Article

The Use of “Genotyping-by-Sequencing” to Recover Shared Genealogy in Genetically Diverse Eucalyptus Populations

1
Scion (New Zealand Forest Research Institute Ltd.), Rotorua 3010, New Zealand
2
AgResearch, Invermay Agriculture Centre, Mosgiel 9053, New Zealand
*
Author to whom correspondence should be addressed.
These authors contributed equally to this work.
Forests 2021, 12(7), 904; https://doi.org/10.3390/f12070904
Submission received: 20 April 2021 / Revised: 28 June 2021 / Accepted: 9 July 2021 / Published: 12 July 2021
(This article belongs to the Section Genetics and Molecular Biology)

Abstract

:
The recovery of genealogy in both natural and captive populations is critical for any decision in the management of genetic resources. It allows for the estimation of genetic parameters such as heritability and genetic correlations, as well as defining an optimal mating design that maintains a large effective population size. We utilised “genotyping-by-sequencing” (GBS) in combination with bioinformatics tools developed specifically for GBS data to recover genetic relatedness, with a focus on parent-offspring relationships in a Eucalyptus nitens breeding population as well as recognition of individuals representing other Eucalyptus species and putative hybrids. We found a clear advantage on using tools specifically designed for data of highly variable sequencing quality when recovering genetic relatedness. The parent-offspring relatedness showed a significant response to data filtering from 0.05 to 0.3 when the standard approach (G1) was used, while it oscillated around 0.4 when the specifically designed method (G5) was implemented. Additionally, comparisons with commonly used tools demonstrated vulnerability of the relatedness estimates to incorrect imputation of missing data when shallow sequencing information and genetically distant individuals are present in the population. In turn, these biased imputed genotypes negatively affected the estimation of genetic relatedness between parents and offspring. Careful filtering for both genetic outliers and shallowly sequenced markers led to improvements in estimations of genetic relatedness. Alternatively, a method that avoided missing data imputation and took sequence depth into consideration improved the accuracy of parent-offspring relationship coefficients where sequencing data quality was highly variable.

1. Introduction

Genetic relatedness [1], defined as twice the probability that alleles from each of a pair of individuals are identical by descent (IBD) [2], and its accuracy, is considered one of the essential factors of any quantitative genetic analysis [3,4]. Much effort has been invested into the improvement of relatedness estimates by way of adjustments for historical relatedness through the inclusion of genetic clusters [5], or recovery of paternal contributions through sire probability relationship matrices [6,7]. The first attempts to improve relatedness estimations through the employment of DNA information arose with the development of highly polymorphic molecular markers (i.e., microsatellites (simple sequence repeats—SSR)) in concert with pedigree reconstruction approaches [8]. Many studies have demonstrated the detrimental effect of hidden relatedness on the precision of genetic parameter estimates, such as additive genetic variance and heritability, through often unstated assumptions of paternal non-relatedness within open-pollinated family individuals [9,10,11] or pedigree errors in control-pollinated populations [12].
Despite the enormous progress in the development of genomic resources in forest trees, the commercial availability of robust genotyping tools such as single nucleotide polymorphism (SNP) arrays is limited to only a few species such as Eucalyptus [13], poplar [14], Brazilian pine [15], Douglas-fir [16,17], maritime pine [18], Norway spruce [19], white spruce [20], lodgepole pine [21], and European pines [22] and white oaks [23]. Additionally, the markers on SNP arrays are usually informative for genetic diversity in a discovery population but might be irrelevant or less informative for capture of genetic diversity in the population under study, especially in high diversity species. Therefore, alternative methods based on reduced genome representation sequencing technologies that decrease the amount of sequencing required have to be considered. Generally, there are two main approaches undertaken for reducing complexity when generating forest tree genomic resources: (1) exome capture-based [24,25,26] or (2) reduced genome representation sequencing methodologies such as genotyping-by-sequencing (GBS-RE-RRS) [27,28,29,30], Restriction site Associated DNA Sequencing (RAD-Seq) [31], double digest RAD-seq [32], GRAS-Di [33] or tGBS [34]. While exome capture-based approaches target specific genic (expressed) regions, GBS or RAD-Seq platforms apply restriction enzymes to target genomic fragments surrounding the cut sites. However, even intensively reduced representation of the genome can still result in more genomic fragments being captured with denser marker distributions compared to SNP arrays. Additionally, the genetic variability captured by these methods is tailored to the population under study, while that captured by SNP arrays is usually defined by the genetic diversity of a relatively small set of individuals from a discovery population.
Recent development of genomic resources for several forest tree species [14,18,35,36,37,38,39,40] has enabled a deeper insight into the genetic diversity of these species and the genomic complexity of many important traits [41]. Relatedness has also shifted from expected (pedigree-based) to realized (genetic marker-based) estimates [42,43]. Marker-based relationship estimates have been recognised as a useful tool to correct for confounding factors in analyses that dissect the genetic architecture of complex traits [44,45]. Additionally, genomic markers allow the effect of shared genealogy and co-segregation to be captured, and tracks linkage disequilibrium (LD) between markers and quantitative trait loci (QTLs) in genomic predictions [46,47]. Also, the deployment of realized relationship matrices within mixed model frameworks allows us to estimate heritability [48,49] or genetic correlations [50] in populations with unknown pedigrees, or to disentangle genetic variance into additive and non-additive components [12,51,52]. The improved ability to predict unobserved phenotypes through genomic markers allows for early selection of genotypes as a parent to the next generation of the breeding population and the rapid transfer of genetic gain to forest plantations. The early prediction is critical in species with a late expression of economically important traits such as forest trees [53]. Additionally, genomic marker-based recovery of hidden relatedness helps avoid increased inbreeding in the breeding population by culling individuals from selfing/inbreeding.
Progress in the development of genotyping platforms based on GBS [28] or exome capture [24] has enabled the implementation of genomic prediction strategies even in species with missing or incomplete reference genomes, such as forest trees [29,30,54,55]. Also, Aguirre et al. [56]) implemented GBS in Eucalyptus dunnii population and successfully generated ∼11 K SNPs representing the whole genome. However, highly variable sequencing quality and large proportions of missing data remain a concern with sequencing based approaches.
Eucalypt species have mixed mating, resulting in a broad spectrum of relatedness classes including viable selfing, which can result in inbreeding depression especially in traits related to productivity [57]. Biological and technical difficulties associated with controlled mating has meant that open-pollinated breeding systems are favoured as a lower-cost breeding option [58]. However, this can result in a large amount of hidden relatedness which can introduce bias to genetic parameter estimates, resulting in inaccurate selection of superior individuals for the next generation of the breeding cycle and poor management of genetic diversity, which is especially critical in forest trees [10].
Our study evaluates a newly proposed method for relationship matrix construction that takes missing data and read depth into consideration [59] in the context of applying genomic prediction in forest tree breeding. The material implemented in this study included part of a Eucalyptus nitens breeding population as well as representatives of other Eucalyptus species and their putative hybrids sampled from New Zealand’s seed orchards.

2. Materials and Methods

A Eucalyptus nitens population in New Zealand that previously underwent marker-based pedigree reconstruction using both SSR and SNP array data [60] was genotyped using GBS [28]. The population comprised 89 individuals, of which 22 individuals were sampled from the Alexandra seed orchard (New Zealand) population (13 parents and 9 offspring), 9 individuals were sampled from the Drumfern (New Zealand) population (offspring only), and 48 individuals were sampled from Tinkers (New Zealand) (30 parents and 18 offspring). The population also contained 4 putative hybrids (E. grandis x E. nitens) and 6 individuals representing other species (E. quadrangulata, E. regnans, E. saligna, E. cladocalyx, E. camaldensis, E. bosistoana). Additionally, there were technical (3 individuals) and biological (3 individuals) replicates which extended the total number of samples genotyped to 95 (Table 1).
Frozen leaf tissue (5 leaves per individual) was sent to Slipstream Automation (Palmerston North, New Zealand) for automated high-molecular weight DNA extractions. In addition, Scion carried out DNA extractions by hand on a subset of 14 individuals using a cetyltrimethylammonium bromide (CTAB) method [61] with the following modifications: Frozen leaf tissue (100 mg) was ground to a fine powder under liquid nitrogen in a mortar and pestle; polyvinylpyrrolidone (PVP) in the lysis buffer was increased to 2% (w/v); lysis incubations were performed at 37 C; cellular debris was pelleted for 20 min at 2000×g. Final DNA pellets were centrifuged as previously described and resuspended in 30 μ L sterile water. The extracted DNA, ranging in quality with A260/A280 absorbance ratios from 0.55–1.9, was sent to AgResearch for genotyping. An input of 100 ng of DNA per sample was utilised for Pst1 restriction enzyme reduced representational sequencing (RE-RRS) based on the Cornell GBS method [28], with the following exceptions: after post ligase pooling, 4 μ L of library DNA was PCR amplified four times, and pooled after the PCR step. This pooled library was further purified and size selected using the Pippin prep (SAGE Science, Beverly, MA, USA) on 2% (w/v) agarose, dye-free with internal standards. The resulting GBS library of 150–500 bp fragments (inclusive of adapter sequence and index) was sequenced on one lane of HiSeq 2500 V4 SBS chemistry 1 × 100 single end reads generating 29.8 Gb raw sequence data. The Universal Network Enabled Analysis Kit (UNEAK) pipeline [62] was implemented for analysis of raw sequence data. However, the raw sequence data was produced as paired-end which is not supported by UNEAK pipeline, therefore the read 1 file was used for downstream analysis and treated as single-end data. The raw sequence data file contained 234 million reads, of which 215 million (92%) were good, barcoded reads. A total of 15.7 million unique tags were kept in total. The UNEAK pipeline was run as part of the Tassel v3.0.174 package [63]. The minimum number of reads required to define a tag was set to 3, minor allele frequency cut offs were set at 0.03 and 0.5, and the minimum call rate threshold set to 0.3.
A comparison of the relationship accuracies determined from GBS data to the previously reconstructed pedigree [60], considered here as the benchmark, was investigated using classic approach following VanRaden [42] (G1) and approach specifically developed for GBS data following Dodds et al. [59] (G5). The notations G1 and G5 were used to maintain consistency with Dodds et al. [59] in which the G5 relationship matrix was developed. The realized relationship matrix [42] was based on observed allelic frequencies as follows:
G 1 = ZZ 2 p ( 1 p )
where p are allelic frequencies and Z = MP where M is the genotype matrix with genotypes coded as 0 for reference allele homozygote, 1 for heterozygote, and 2 for alternative allele homozygote, and P is the vector of doubled alternative allele frequencies. The naïve method was used to impute missing data (the population expected value (2pj for the j-th marker)). Similarly, an alternative relationship matrix considering missing values was estimated as follows:
G 5 = ZZ 2 P 0 P 1
where the Z matrix is defined as above but contains zeros at positions with missing data, P0 is a matrix of the same dimension as the Z matrix, containing allelic frequencies with identical rows but filled by zeros where marker data were missing (therefore no missing data imputation was performed). Similarly, P1 = 1 − P0 and again zeros are inserted where marker data were missing. Self-relatedness was corrected for SNP read depth as proposed by Dodds et al. [59] as follows:
j ( z i j z i j ( 1 p j ) K i j 1 2 K i j ) 2 j p j ( 1 p j )
where zij is the Z matrix element for i-th individual at j-th marker, pj is the allelic frequency of the j-th marker and Kij = (1/2)kij, where kij is the sequencing depth for the i-th individual at the j-th marker. As recommended by Lopes et al. [64], the tested estimators were compared through variation in parent-offspring relationships rather than across all relatedness classes due to lack of Mendelian sampling influence. Additionally, the distribution of self-relatedness coefficients was investigated. The analysis was performed on both the whole population and on the set of E. nitens individuals only to compare the effect of genetically highly distant individuals on recovery of relatedness.

3. Results

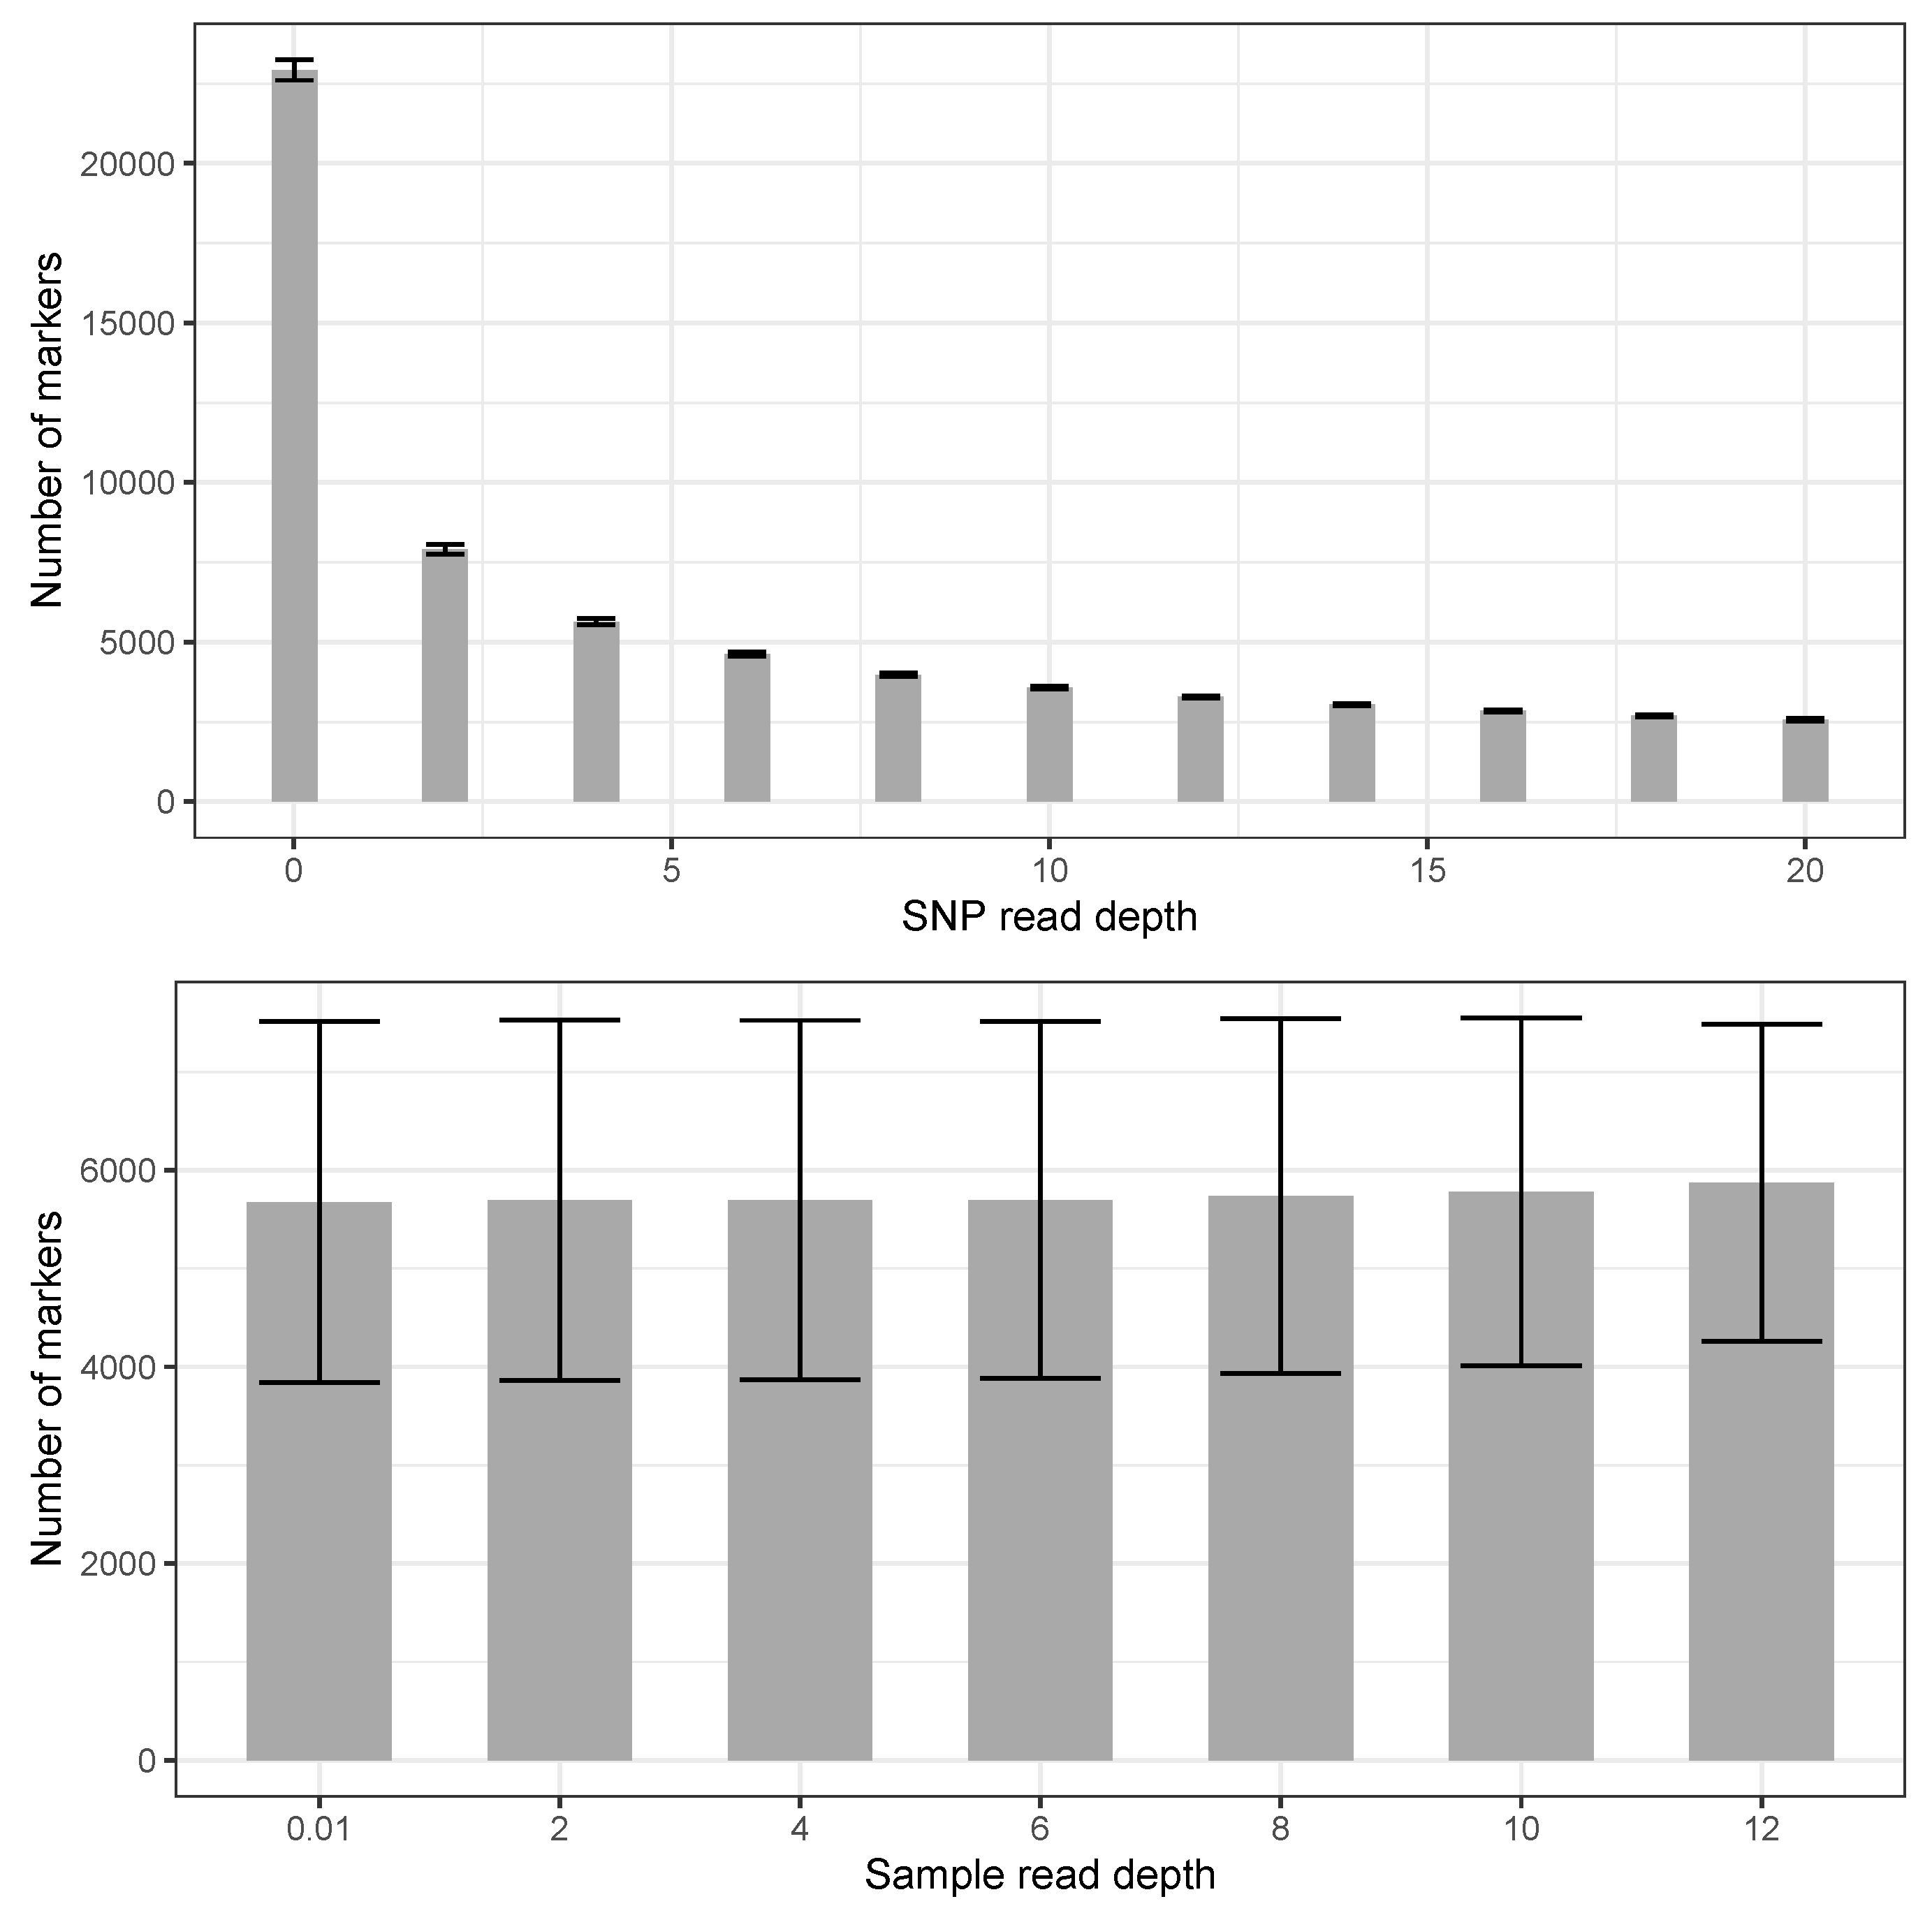
Genotyping-by-Sequencing generally delivers sequence data with high variability in sequence read counts between samples [27,28], as was also observed in the current study and resulted in wide ranges in call rates (Figure 1). The genotyping strategy implemented in the studied population generated 23,452 SNPs with various read depths. As expected, the vast majority of markers have low read depths (Figure 2). The number of SNPs decreased rapidly when the threshold for minimum SNP read depth was two, however a further decrease from 2–20 showed minimal further decrease (Figure 2). In individuals, the SNP call rates increased slightly with increasing sample read depth (Figure 2). We also investigated the effect of the inclusion of other Eucalyptus species to the population on call rates. The individual call rate ranged between 0.0 and 0.7, peaking between 0.2 and 0.3 when including individuals from multiple species and hybrids, and peaking between 0.3 and 0.4 when only E. nitens was included (Figure 3). SNP call rates ranged from 0.05 to 1 with the majority between 0.1 and 0.3, which was consistent, whether including all individuals (considering also other Eucalyptus species) or just E. nitens individuals (Figure 3). Such results support the general notion that GBS methods suffer from a significant amount of missing data, and further procedure optimisations such as enzyme choice and reduced multiplexing could be potentially considered.
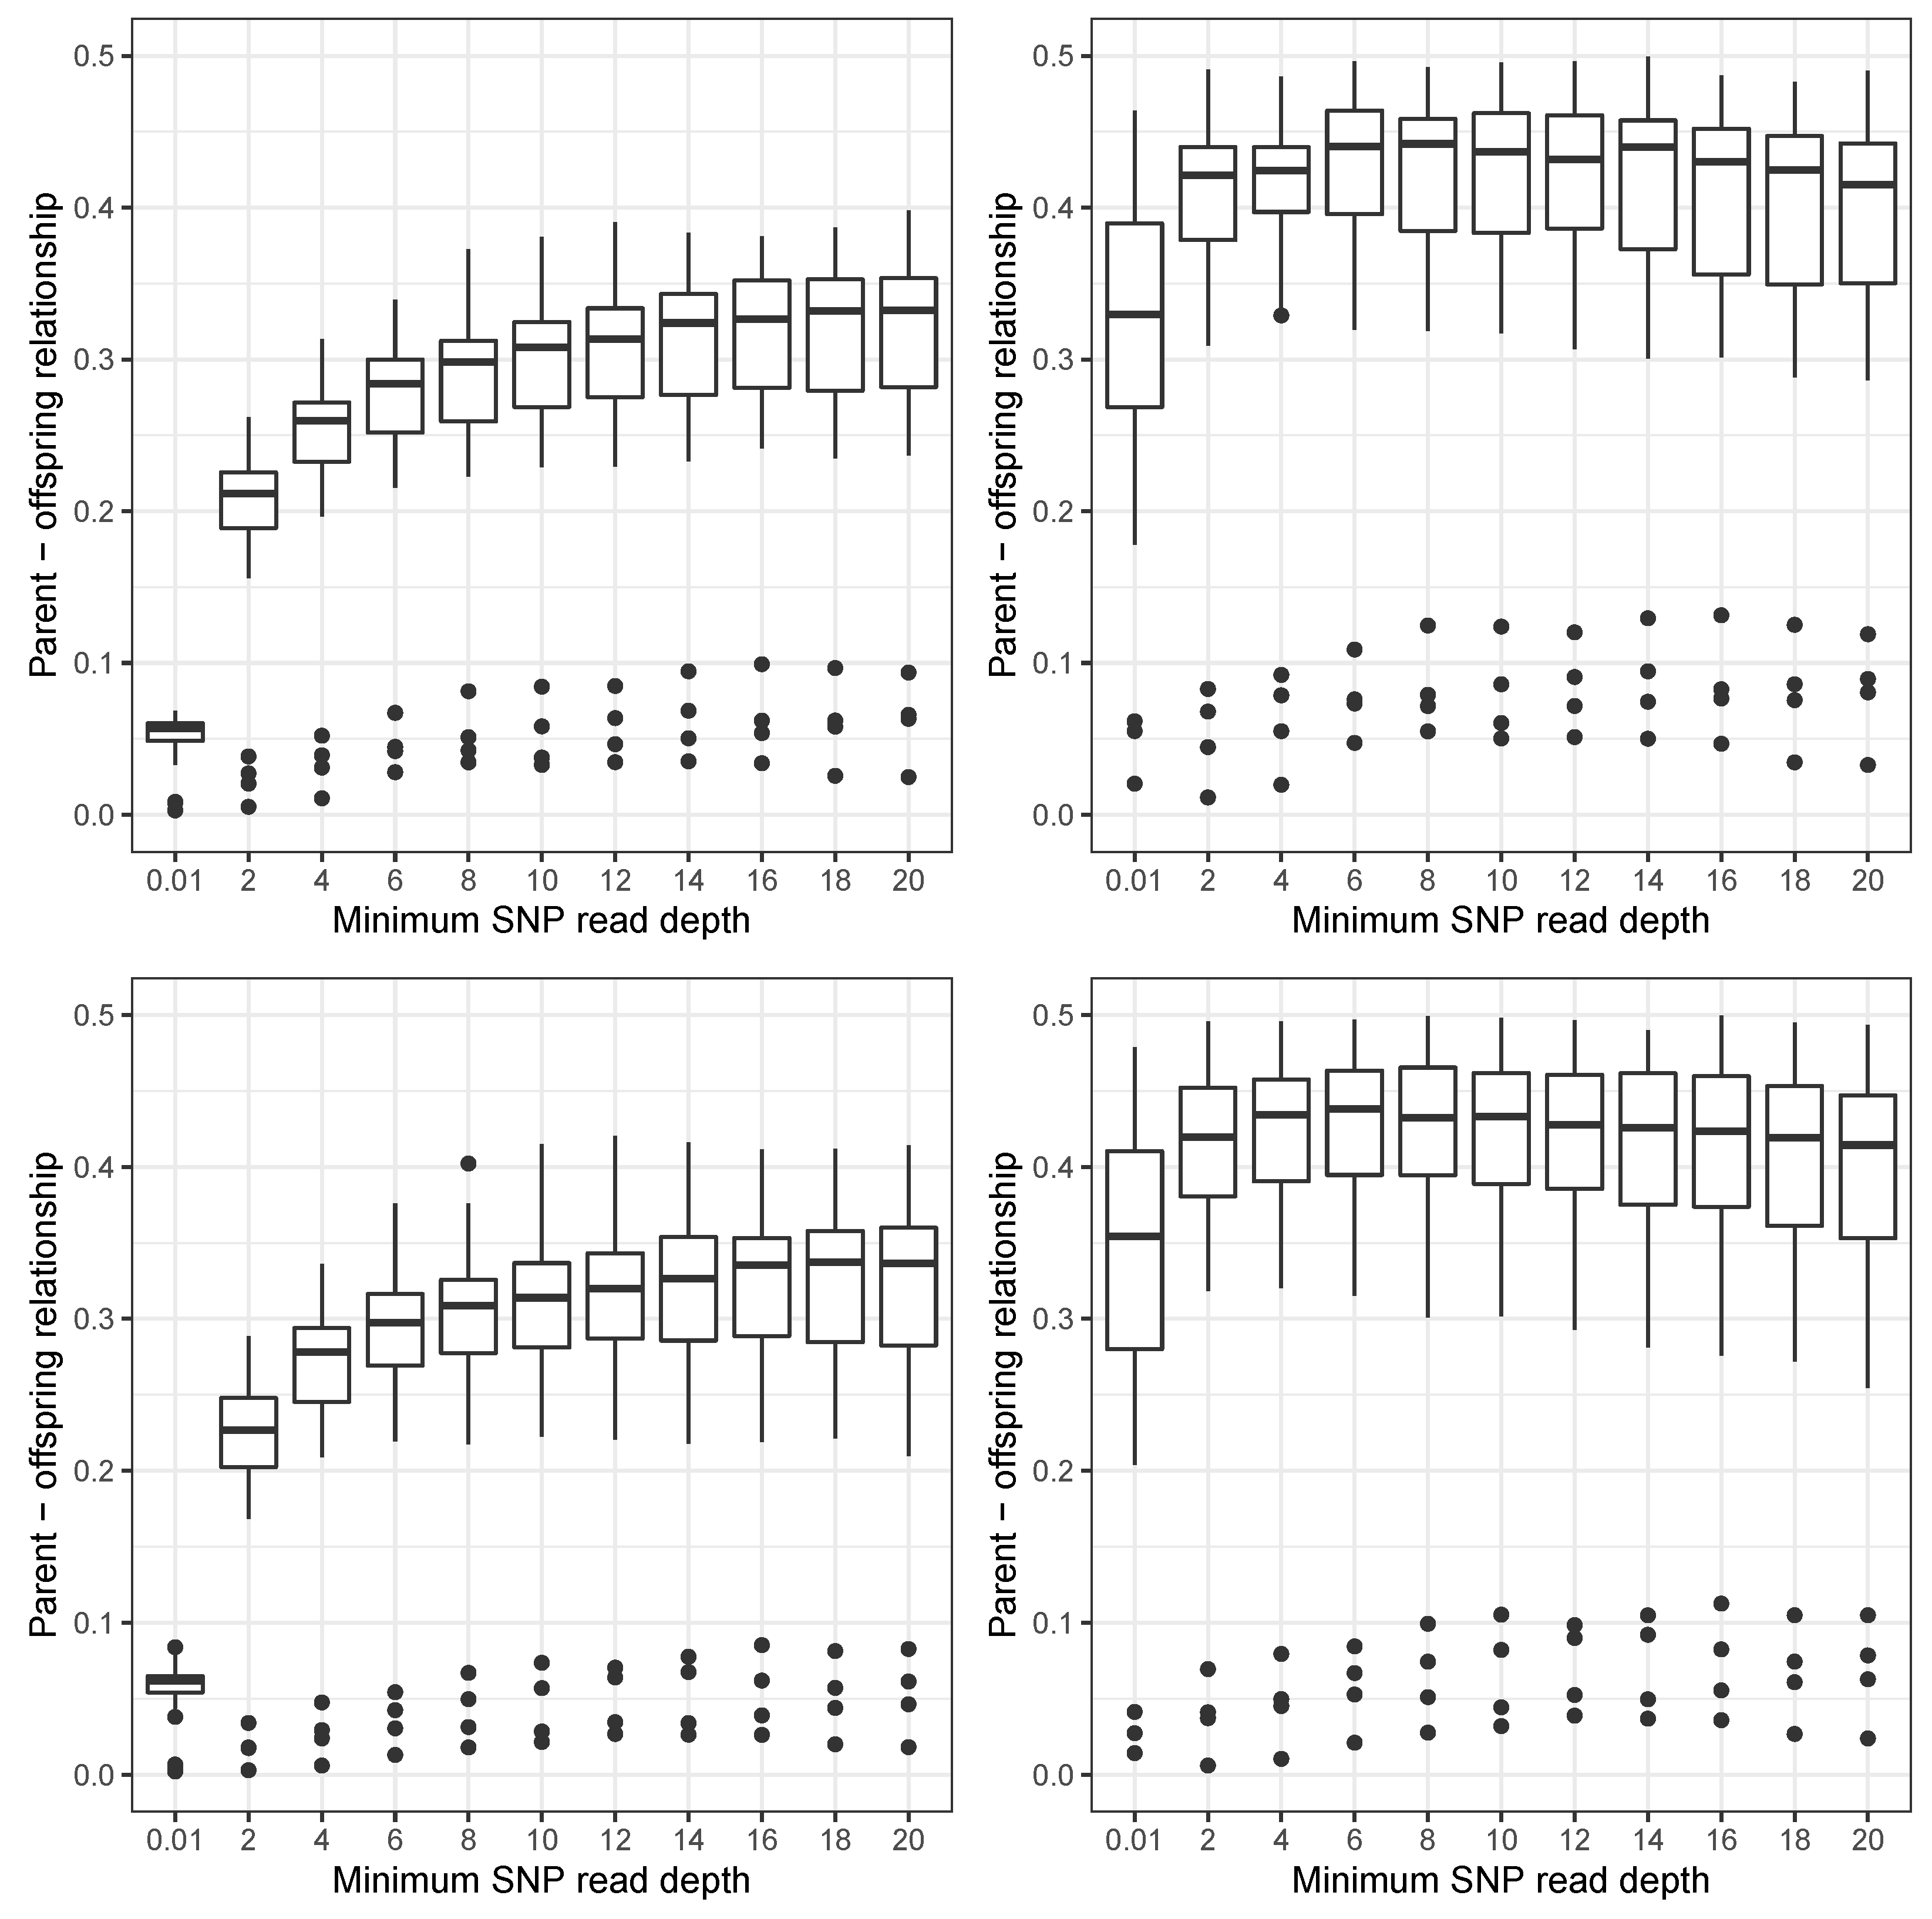
The effect of threshold for minimum SNP and sample read depth on parent-offspring relationships were investigated both separately (Figure 4 and Figure 5—upper plots). When only SNP read depth threshold was considered, we found significant improvements (from 0.05 to 0.3) in G1 but no significant change in the G5 matrix, with an average parent-offspring relationship of around 0.4 across all ranges of thresholds for minimum SNP read depths (0.001–20) that were investigated (Figure 4—upper plots). When only sample read depth threshold was considered, we found a slight decrease in the average parent-offspring relationship with increasing threshold for sample read depth in both relationship estimators. This decrease in the average relationship was more apparent with the G5 matrix, where a plateau around 0.4 was achieved across most of the sample read depths but dropped at the maximum threshold (Figure 5—upper plots). The rapid decay in average parent-offspring relationship in the scenario with the highest threshold for minimum sample read depth was likely due to the low number of remaining parent-offspring combinations. However, the combinations of individuals that performed very poorly (with estimated parent-offspring relationship from −0.1 to 0.1) (Figure 5—upper plots) mostly originated from triplets identified in the previous study [60] as having a large proportion of mismatches. To resolve such issues, implementation of methods for parentage assignments using low-depth sequencing is required [65,66].
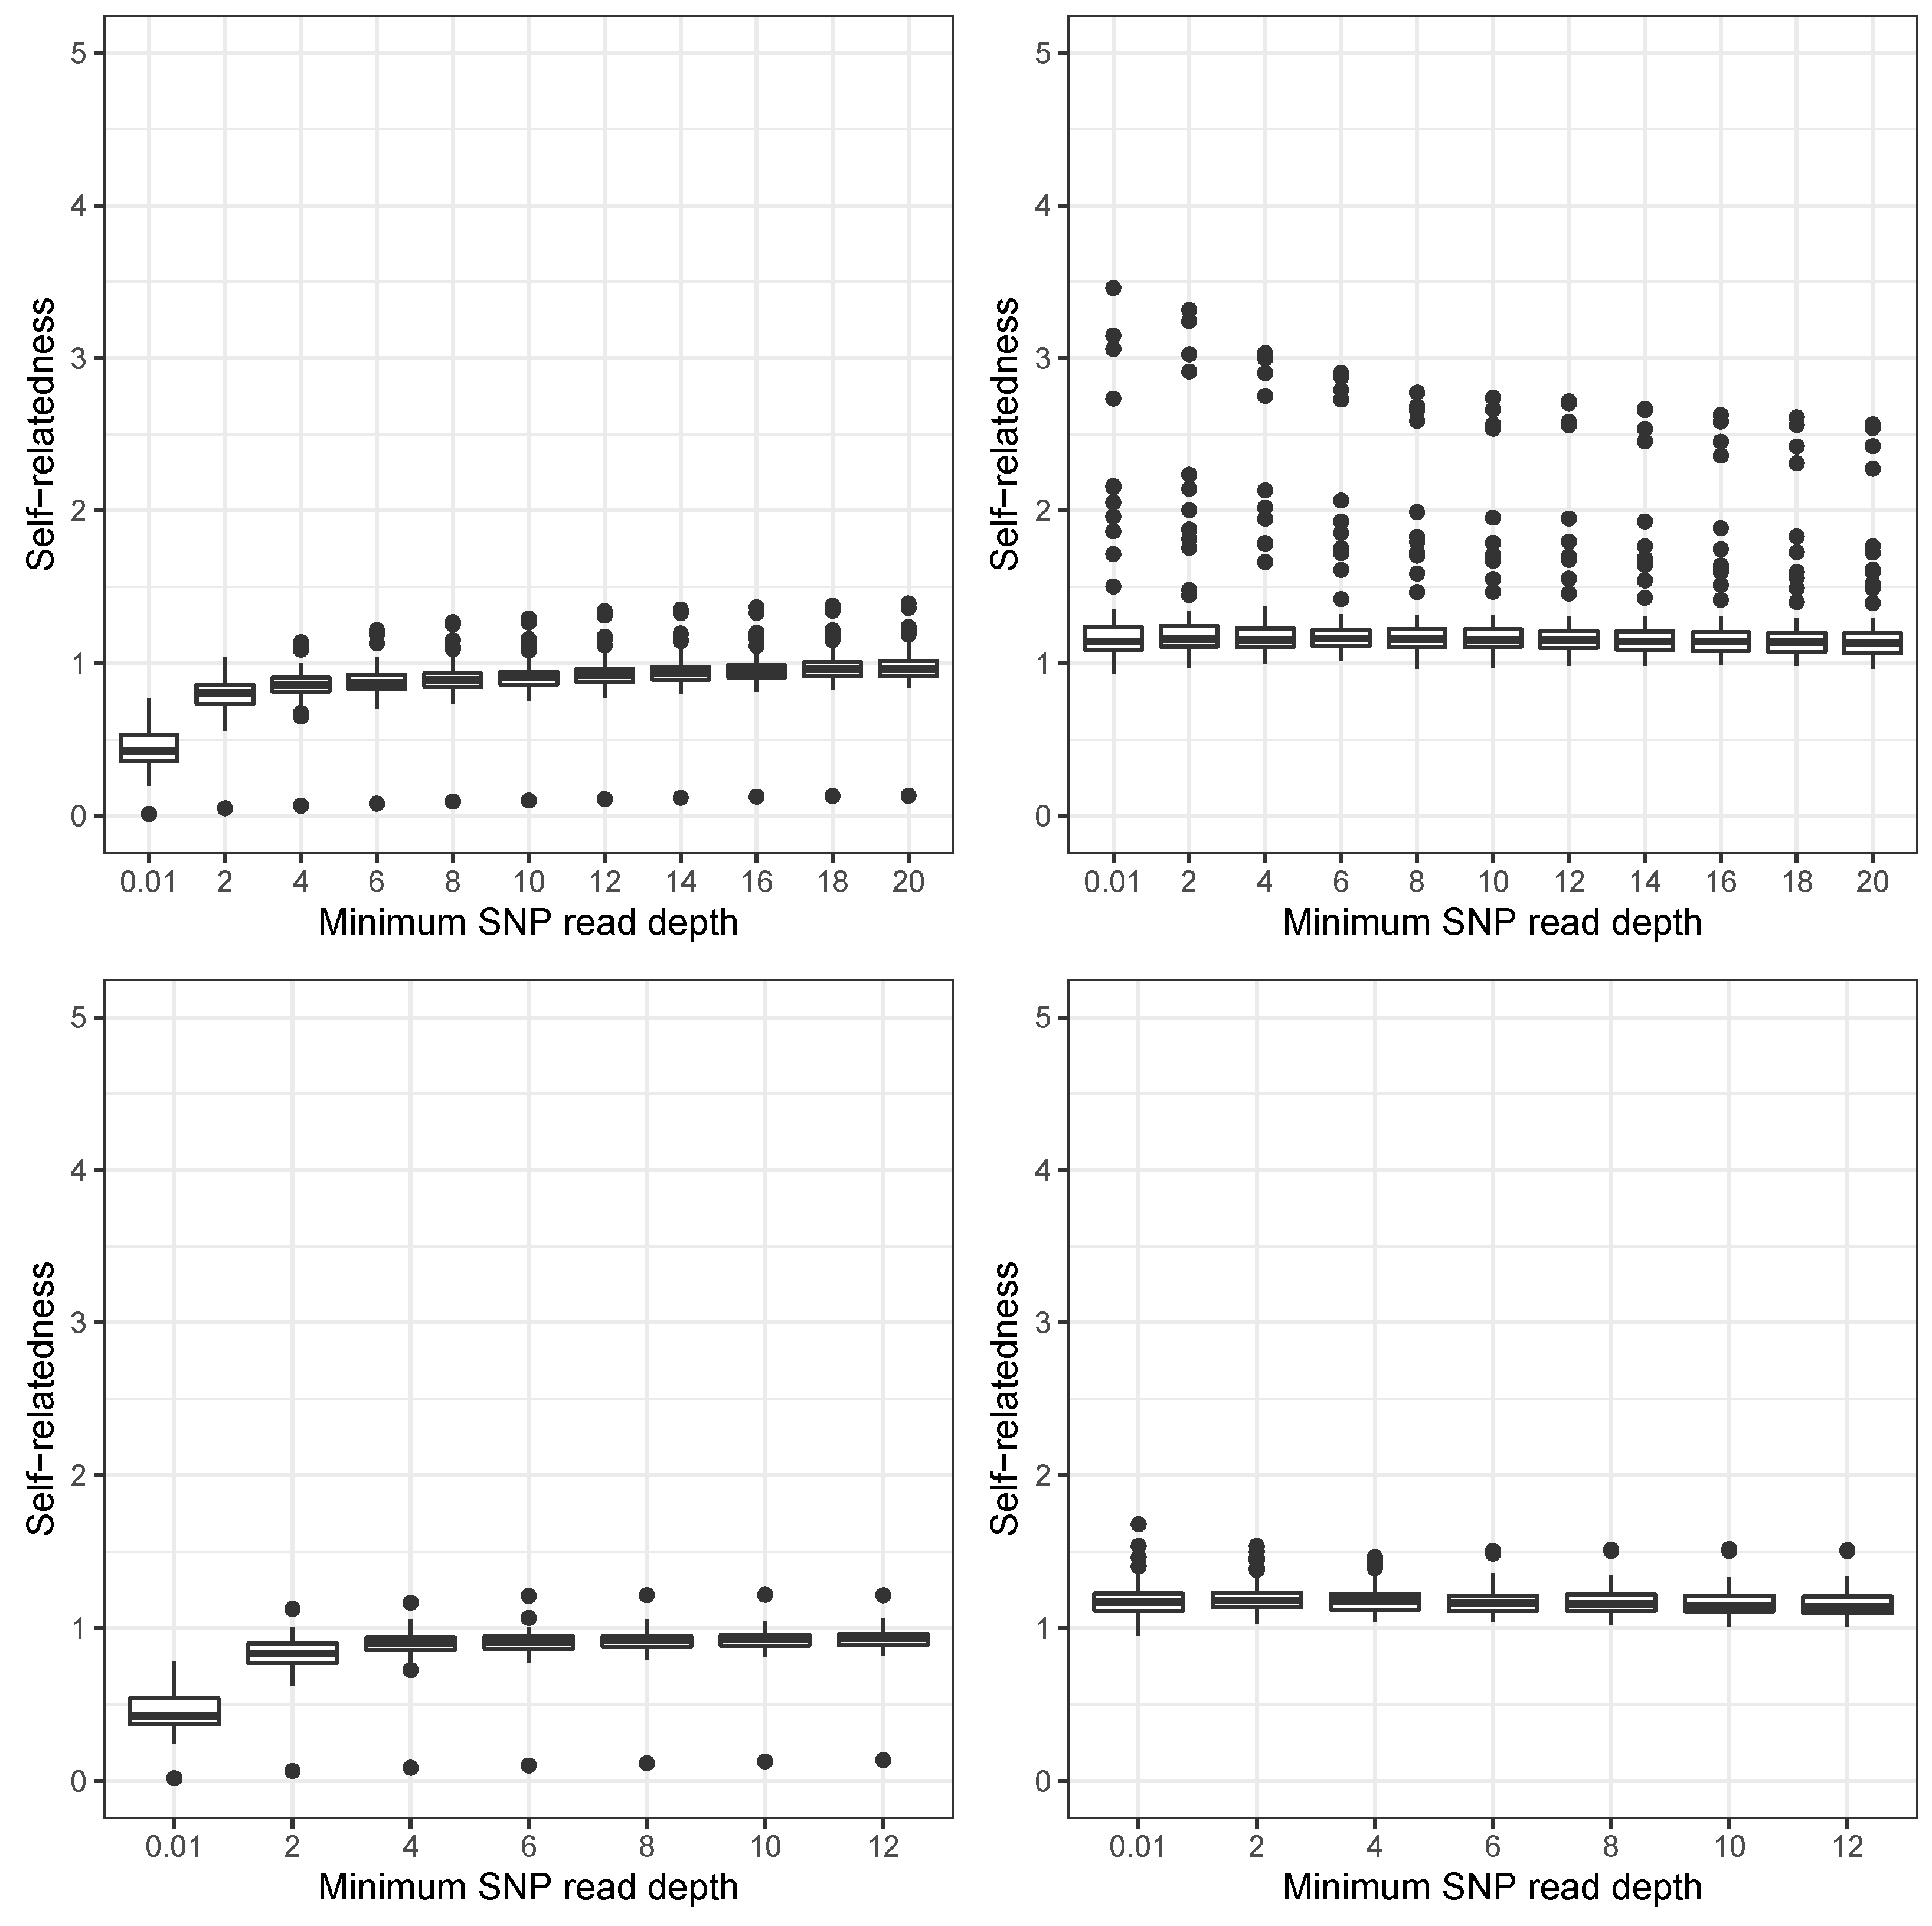
Self-relatedness estimates were also investigated under different SNP read depths. While the G1 matrix underestimated self-relatedness coefficients, improvements from an average of 0.456 to 0.936 were observed as SNP read depth increased. On the other hand, the G5 matrix estimated self-relatedness values that were very close to the expected value of 1 for non-inbred individuals, slightly decreasing with increasing SNP read depth from 1.424 to 1.279. Additionally, genomic outliers (putative hybrids and individuals representing other species) were clearly identified in G5 by extremely high self-relatedness coefficients, but not in G1 (Figure 6—upper plots). Similarly, spectral decomposition of relationship matrices and plotting the first two principal components found a clear separation of hybrids and other species in G5 compared to G1 (Figure 7).
When only E. nitens individuals were investigated, the distribution of parent-offspring relatedness under different thresholds for both SNP and individual minimum read depth followed the same patterns as obtained in whole population analysis. However, the G1 relationship matrix showed slightly higher estimates for parent-offspring relationship compared to a scenario including individuals from other species (Figure 4 and Figure 5—bottom plots). The only exception was the pattern in self-relatedness where all high coefficients disappeared due to removal of individuals belonging to other species and putative hybrids (Figure 6—bottom plots).

4. Discussion

4.1. Challenges to Recover Relatedness in Forest Tree Breeding Populations

Our study mainly involved individuals from an open-pollinated E. nitens breeding program, common in both commercial planting and establishment of genetic field experiments. Reconstruction of pedigrees has proved beneficial in recovering hidden relatedness thereby increasing the accuracy of identifying superior individuals, which has in turn increased the performance of the breeding program [67]. However, the efficiency of pedigree reconstruction depends on the availability of genetic fingerprints for all possible parents contributing to the gene pool [68,69], which can be a crucial limitation especially in multi-generational forest tree breeding populations. An alternative is the estimation of family-specific average relatedness, when only marker array data are available [70], or pedigree-free marker-based realized relatedness [42], when dense marker data are available and hidden relatedness can be more efficiently captured within studied populations. Furthermore, such relationship estimates capitalize on capturing segregating QTL alleles through LD with genetic markers employed in the construction of a relationship matrix [47] compared with the expected relatedness based on path analysis [1].
Forest trees are characterized by large genomes, high genetic diversity and large effective population sizes resulting in fast decay of LD along the genome [38]. As such, QTL effects are difficult to capture precisely when using sparse marker arrays, and shared genealogy (e.g., co-ancestry) becomes a dominating factor determining prediction accuracy. Therefore, the quality of relatedness inference is crucial to successful genomic prediction and its practical implementation. In the case of small genome sizes, marker-based relationships can be useful as the markers can adequately elucidate Mendelian sampling. However, in larger genomes, expected or pedigree-based relationships are often better able to reflect the true relatedness [71]. Similarly, the ability of marker-based relationships to infer real relatedness decreases as population size increases [72]. Therefore, the application of marker-based relationship matrices in forest tree breeding populations could be rather limited. Furthermore, relatedness in terms of IBD can be highly variable across the genome due to genetic drift and/or selection. Therefore, even if the real average identity by descent (IBD) is close to expectation, the average IBD estimated from QTL alleles can deviate from the expected values. Tracking such local deviations in large populations, however, requires a large number of regularly distributed markers [73]. Lippert et al. [74] showed that the construction of a marker-based matrix considering only QTL alleles produced the most precise estimate of genetic parameters, therefore, more precise responses to breeding and selection activities can result when realized relatedness is used in genetic evaluations.

4.2. Genomic Resources in Eucalypts and Their Limitations

The Eucalyptus genus comprises several forest tree species of global economic importance and thus has attracted immense interest in terms of genomics research [75], supported by the development of a reference genome [37]. Additionally, a multi-species Eucalyptus SNP chip [13] was developed as a robust genotyping tool to enable the implementation of genomics in operational breeding programs [57,76,77,78,79].
Genotyping-by-sequencing (GBS), as used in the current study, is a promising genotyping platform for species without reference genomes, which is often the case for forest trees. Aguirre et al. [56] tested GBS platform in E. dunnii and recovered ∼10 k SNP markers covering whole genome. The reduction of genotyping effort through restriction enzymes combined with pooled sequencing presents an economically feasible methods to obtain genomic information for large numbers of individuals. The scale of testing is crucial to perform accurate genomic predictions and makes genomics-based approaches a viable alternative to conventional breeding strategies. Large training population sizes are required in organisms with high genetic diversity, large effective population size and fast LD decay along the genome, as is the case for many forest trees [41,80]. On the other hand, GBS suffers from highly variable genotype quality scores and a high proportion of missing data due to low depth sequencing, which introduces bias in relationship coefficient estimations and potentially decreases the accuracy of genomic predictions when unsuitable analytical tools are implemented. Therefore, the implementation of appropriate approaches and tools to handle GBS data is crucial.
GBS can potentially capture linkage disequilibrium between markers and QTLs through more abundant coverage of the genome, an advantage over SNP arrays with regards to prediction accuracy of genomic selection models. On the other hand, GBS suffers from low sequence coverage when minimizing sequencing effort/cost, and a large proportion of missing data which might negatively affect the performance of the prediction models due to poor recovery of heterozygote genotypes. However, Gorjanc et al. [81] showed that under large training population sizes, both SNP array and GBS approaches reached similar prediction accuracies, attributed to the fact that precise allelic substitution effects could be estimated through inclusion of many individuals in the training population. Nevertheless, the accuracy of genomic prediction will plateau with increasing numbers of SNPs due to increased shrinkage of SNP effects [47], thus the benefit of using denser marker sets generated by GBS could be limited. This might not be the case for eucalypts where the genome size is relatively small (540 Mb) but can be important in other species with large genomes such as Douglas-fir (18.7 Gb) or radiata pine (26.5 Gb) [82].

4.3. Recovery of Genealogy Using GBS

Our study focused on the recovery of two classes of relatedness: (1) parent-offspring relationships, due to the fact they are not affected by Mendelian sampling, and (2) self-relatedness, which is a critical parameter for inferring the level of inbreeding in a population. Consideration of genotype score determination and avoidance of missing data imputation as proposed by Dodds et al. [59] positively impacted our results, especially when genomic outliers (putative hybrids and individuals representing other species) are present in the reference population. Use of unrelated individuals, highly genetically diverse in our case, in the reference population can negatively affect the precision of imputed missing values [83] compared with studies performed in related individuals [84], and increased bias in relatedness estimations. However, the analysis of the population including only E. nitens showed only a partial increase in estimates produced by the G1 relationship matrix and did not reach the levels of the G5 matrix (Figure 4). Development of a prediction model involving individuals from other species is rather atypical, but high genetic diversity [85] and common spontaneous inter-specific hybridization [86,87] are real considerations in forest tree populations, which should be checked for genomic outliers and these removed before imputation of any missing data. Additionally, while GBS is cost-effective, the sequencing depth can be highly variable due to DNA purity (and integrity potentially requiring additional clean up in some species) and result in a large proportion of missing data. The reliability of genotype calling is also affected by sequencing depth, and genotype scores should thus be adjusted for this, as proposed by Dodds et al. [59].
The G1 self-relatedness and parent-offspring relationship coefficients were highly underestimated due to the imputation of missing data. Dodds et al. [59] pointed out that the naïve method used in our analysis is perhaps not suitable for data with such a large proportion of missing values. Furthermore, using a mixture of both related and unrelated (putative hybrids and individuals representing other species) individuals decreases the accuracy of imputed values due to the inclusion of non-informative haplotypes [83]. In this study, this resulted in strong underestimation of both self-relatedness and parent-offspring relationship coefficients in G1 (Figure 4, Figure 5 and Figure 6). Despite the G5 parent-offspring relationship coefficients being close to their expected values of 0.5, they still showed large variances ranging from 0.3 to 0.58 (Figure 4) which could be caused by the small number of complete pairwise genotypes used in their estimation. Wang [72] found that 10,000 markers were required to obtain reliable estimates of relatedness, but this number increases with a decreasing level of relatedness [88]. Furthermore, the quality of both relationship estimates and missing values imputation increased with the size of the reference population [72,83].
Therefore, careful filtering for SNP’s average read depth and consideration of individual genotype quality scores, as proposed by Dodds et al. [59], will help to maximize the economic efficiency of genotyping costs vs the accuracy of genomic prediction. We found this method of relationship matrix construction superior due to the identification of genomic outliers that would ordinarily introduce bias in missing data imputation. Additionally, avoiding the imputation of missing data resulted in more accurate recovery of parent-offspring relationships, which can be especially important in genetically heterogeneous populations.

5. Conclusions

Our study investigated the performance of a GBS platform, in combination with bioinformatics tools specifically proposed for GBS data, to recover relatedness in an Eucalyptus breeding population. We found that the imputation of missing genotypic information was biased when sequencing information was shallow and genetically distant individuals were included in the population. In turn, these biased imputed genotypes negatively affected the estimation of genetic relatedness between parents and offspring. Careful filtering for both genetic outliers and shallowly sequenced markers (low read depth) improved genetic relatedness estimates. Alternatively, the avoidance of missing data imputation and consideration of sequence depth improved accuracies when estimating the coefficients of relatedness for parent-offspring relationships when using a genotyping platform with highly variable sequencing quality.

Author Contributions

J.K. and R.L.A. performed analysis and drafted manuscript, K.G.D., H.S.D. and R.B. supervised bioinformatics analysis, E.J.T., N.J.G. and S.M.C. supervised sampling collection, DNA preparation, library preparation and genotyping. All co-authors significantly contributed to the current study. All authors have read and approved the final manuscript.

Funding

This research was funded by Ministry of Business, Innovation and Employment (MBIE) through Strategic Science Investment Fund contract nr. C04X1703.

Institutional Review Board Statement

Not applicable.

Informed Consent Statement

Not applicable.

Data Availability Statement

Genomic data and pedigree information implemented in this study are available on Zenodo.org data repository doi:10.5281/zenodo.5091129.

Conflicts of Interest

The authors declare no conflict of interest.

Abbreviations

The following abbreviations are used in this manuscript:
GBSGenotyping by sequencing
DNADeoxyribonucleic acid
IBDIdentity by descent
SSRSimple sequence repeats
SNPSingle nucleotide polymorphism
QTLQuantitative trait loci
LDLinkage disequilibrium

References

  1. Wright, S. Coefficients of inbreeding and relationship. Am. Nat. 1922, 56, 330–338. [Google Scholar] [CrossRef] [Green Version]
  2. Malécot, G.; Blaringhem, L.-F. Les Mathématiques de L’hérédité; Masson: Paris, France, 1948. [Google Scholar]
  3. Mrode, R.A. Linear Models for the Prediction of Animal Breeding Values; CABI: Wallingford, UK, 2014. [Google Scholar]
  4. Henderson, C.R. Estimation of variances in animal model and reduced animal model for single traits and single records. J. Dairy Sci. 1986, 69, 1394–1402. [Google Scholar] [CrossRef]
  5. Westell, R.A.; Quaas, R.L.; Van Vleck, L.D. Genetic groups in an animal model. J. Dairy Sci. 1988, 71, 1310–1318. [Google Scholar] [CrossRef]
  6. Shiotsuki, L.; Cardoso, F.F.; Silva, J.A.V., II; Rosa, G.J.M.; Albuquerque, L.G. Evaluation of an average numerator relationship matrix model and a Bayesian hierarchical model for growth traits in Nellore cattle with uncertain paternity. Livest. Sci. 2012, 144, 89–95. [Google Scholar] [CrossRef] [Green Version]
  7. Henderson, C.R. Use of an average numerator relationship matrix for multiple-sire joining. J. Anim. Sci. 1988, 66, 1614–1621. [Google Scholar] [CrossRef]
  8. Lambeth, C.; Lee, B.-C.; O’Malley, D.; Wheeler, N. Polymix breeding with parental analysis of progeny: An alternative to full-sib breeding and testing. Theor. Appl. Genet. 2001, 103, 930–943. [Google Scholar] [CrossRef]
  9. El-Kassaby, Y.A.; Lstibůrek, M. Breeding without breeding. Genet. Res. 2009, 91, 111–120. [Google Scholar] [CrossRef] [PubMed] [Green Version]
  10. El-Kassaby, Y.A.; Cappa, E.P.; Liewlaksaneeyanawin, C.; Klápště, J.; Lstibůrek, M. Breeding without breeding: Is a complete pedigree necessary for efficient breeding? PLoS ONE 2011, 6, e25737. [Google Scholar] [CrossRef] [Green Version]
  11. Vidal, M.; Plomion, C.; Harvengt, L.; Raffin, A.; Boury, C.; Bouffier, L. Paternity recovery in two maritime pine polycross mating designs and consequences for breeding. Tree Genet. Genomes 2015, 11, 105. [Google Scholar] [CrossRef]
  12. Munoz, P.R.; Resende, M.F.R.; Huber, D.A.; Quesada, T.; Resende, M.D.V.; Neale, D.B.; Wegrzyn, J.L.; Kirst, M.; Peter, G.F. Genomic relationship matrix for correcting pedigree errors in breeding populations: Impact on genetic parameters and genomic selection accuracy. Crop Sci. 2014, 54, 1115–1123. [Google Scholar] [CrossRef] [Green Version]
  13. Silva-Junior, O.B.; Faria, D.A.; Grattapaglia, D. A flexible multi-species genome-wide 60K SNP chip developed from pooled resequencing of 240 Eucalyptus tree genomes across 12 species. New Phytol. 2015, 206, 1527–1540. [Google Scholar] [CrossRef] [Green Version]
  14. Geraldes, A.; Difazio, S.P.; Slavov, G.T.; Ranjan, P.; Muchero, W.; Hannemann, J.; Gunter, L.E.; Wymore, A.M.; Grassa, C.J.; Farzaneh, N.; et al. A 34K SNP genotyping array for Populus trichocarpa: Design, application to the study of natural populations and transferability to other Populus species. Mol. Ecol. Resour. 2013, 13, 306–323. [Google Scholar] [CrossRef]
  15. Silva, P.I.T.; Silva-Junior, O.B.; Resende, L.V.; Sousa, V.A.; Aguiar, A.V.; Grattapaglia, D. A 3K Axiom® SNP array from a transcriptome-wide SNP resource sheds new light on the genetic diversity and structure of the iconic subtropical conifer tree Araucaria angustifolia (Bert.) Kuntze. PLoS ONE 2020, 15, e0230404. [Google Scholar] [CrossRef]
  16. Howe, G.T.; Yu, J.; Knaus, B.; Cronn, R.; Kolpak, S.; Dolan, P.; Lorenz, W.W.; Dean, J.F.D. A SNP resource for Douglas-fir: de novo transcriptome assembly and SNP detection and validation. BMC Genom. 2013, 14, 137. [Google Scholar] [CrossRef] [Green Version]
  17. Howe, G.T.; Jayawickrama, K.; Kolpak, S.E.; Kling, J.; Trappe, M.; Hipkins, V.; Ye, T.; Guida, S.; Cronn, R.; Cushman, S.A.; et al. An Axiom SNP genotyping array for Douglas-fir. BMC Genom. 2020, 21, 9. [Google Scholar] [CrossRef] [PubMed] [Green Version]
  18. Plomion, C.; Chancerel, E.; Endelman, J.; Lamy, J.-B.; Mandrou, E.; Lesur, I.; Ehrenmann, F.; Isik, F.; Bink, M.C.A.M.; van Heerwaarden, J.; et al. Genome-wide distribution of genetic diversity and linkage disequilibrium in a mass-selected population of maritime pine. BMC Genom. 2014, 15, 171. [Google Scholar] [CrossRef] [PubMed]
  19. Azaiez, A.; Pavy, N.; Gérardi, S.; Laroche, J.; Boyle, B.; Gagnon, F.; Mottet, M.-J.; Beaulieu, J.; Bousquet, J. A catalog of annotated high-confidence SNPs from exome capture and sequencing reveals highly polymorphic genes in Norway spruce (Picea abies). BMC Genom. 2018, 19, 942. [Google Scholar] [CrossRef] [PubMed]
  20. Pavy, N.; Gagnon, F.; Rigault, P.; Blais, S.; Deschênes, A.; Boyle, B.; Pelgas, B.; Deslauriers, M.; Clément, S.; Lavigne, P.; et al. Development of high-density SNP genotyping arrays for white spruce (Picea glauca) and transferability to subtropical and nordic congeners. Mol. Ecol. Resour. 2013, 13, 324–336. [Google Scholar] [CrossRef]
  21. Ukrainetz, N.K.; Mansfield, S.D. Assessing the sensitivities of genomic selection for growth and wood quality traits in lodgepole pine using Bayesian models. Tree Genet. Genomes 2020, 16, 14. [Google Scholar] [CrossRef]
  22. Perry, A.; Wachowiak, W.; Downing, A.; Talbot, R.; Cavers, S. Development of a single nucleotide polymorphism array for population genomic studies in four European pine species. Mol. Ecol. Resour. 2020, 20, 1697–1705. [Google Scholar] [CrossRef]
  23. Lepoittevin, C.; Bodénès, C.; Chancerel, E.; Villate, L.; Lang, T.; Lesur, I.; Boury, C.; Ehrenmann, F.; Zelenica, D.; Boland, A.; et al. Single-nucleotide polymorphism discovery and validation in high-density SNP array for genetic analysis in European white oaks. Mol. Ecol. Resour. 2015, 15, 1446–1459. [Google Scholar] [CrossRef]
  24. Neves, L.G.; Davis, J.M.; Barbazuk, W.B.; Kirst, M. Whole-exome targeted sequencing of the uncharacterized pine genome. Plant J. 2013, 75, 146–156. [Google Scholar] [CrossRef]
  25. Chen, Z.Q.; Baison, J.; Pan, J.; Karlsson, B.; Andersson, B.; Westin, J.; García-Gil, M.R.; Wu, H.X. Accuracy of genomic selection for growth and wood quality traits in two control-pollinated progeny trials using exome capture as the genotyping platform in Norway spruce. BMC Genom. 2018, 19, 946. [Google Scholar] [CrossRef] [Green Version]
  26. Thistlethwaite, F.R.; Ratcliffe, B.; Klápště, J.; Porth, I.; Chen, C.; Stoehr, M.U.; El-Kassaby, Y.A. Genomic prediction accuracies in space and time for height and wood density of Douglas-fir using exome capture as the genotyping platform. BMC Genom. 2017, 18, 930. [Google Scholar] [CrossRef] [Green Version]
  27. Chen, C.; Mitchell, S.E.; Elshire, R.J.; Buckler, E.S.; El-Kassaby, Y.A. Mining conifers’ mega-genome using rapid and efficient multiplexed high-throughput genotyping-by-sequencing (GBS) SNP discovery platform. Tree Genet. Genomes 2013, 9, 1537–1544. [Google Scholar] [CrossRef]
  28. Elshire, R.J.; Glaubitz, J.C.; Sun, Q.; Poland, J.A.; Kawamoto, K.; Buckler, E.S.; Mitchell, S.E. A robust, simple genotyping-by-sequencing (GBS) approach for high diversity species. PLoS ONE 2011, 6, e19379. [Google Scholar] [CrossRef] [PubMed] [Green Version]
  29. El-Dien, O.G.; Ratcliffe, B.; Klápště, J.; Chen, C.; Porth, I.; El-Kassaby, Y.A. Prediction accuracies for growth and wood attributes of interior spruce in space using genotyping-by-sequencing. BMC Genom. 2015, 16, 370. [Google Scholar]
  30. Ratcliffe, B.; El-Dien, O.G.; Klápště, J.; Porth, I.; Chen, C.; Jaquish, B.; El-Kassaby, Y.A. A comparison of genomic selection models across time in interior spruce (Picea engelmannii × glauca) using unordered SNP imputation methods. Heredity 2015, 115, 547–555. [Google Scholar] [CrossRef] [Green Version]
  31. Parchman, T.L.; Jahner, J.P.; Uckele, K.A.; Gall, L.M.; Eckert, A.J. RADseq approaches and applications for forest tree genetics. Tree Genet. Genomes 2018, 14, 39. [Google Scholar] [CrossRef]
  32. Aguirre, N.C.; Filippi, C.V.; Zaina, G.; Rivas, J.G.; Acuña, C.V.; Villalba, P.V.; García, M.N.; González, S.; Rivarola, M.; Martínez, M.C.; et al. Optimizing ddRADseq in non-model species: A case study in Eucalyptus dunnii maiden. Agronomy 2019, 9, 484. [Google Scholar] [CrossRef] [Green Version]
  33. Miki, Y.; Yoshida, K.; Enoki, H.; Komura, S.; Suzuki, K.; Inamori, M.; Nishijima, R.; Takumi, S. GRAS-Di system facilitates high-density genetic map construction and QTL identification in recombinant inbred lines of the wheat progenitor Aegilops tauschii. Sci. Rep. 2020, 21, 21455. [Google Scholar] [CrossRef]
  34. Ott, A.; Liu, S.; Schnable, J.C.; Yeh, C.T.E.; Wang, K.S.; Schnable, P.S. tGBS® genotyping-by-sequencing enables reliable genotyping of heterozygous loci. Nucleic Acids Res. 2017, 45, e178. [Google Scholar] [CrossRef] [PubMed] [Green Version]
  35. Tuskan, G.A.; Difazio, S.; Jansson, S.; Bohlmann, J.; Grigoriev, I.; Hellsten, U.; Putnam, N.; Ralph, S.; Rombauts, S.; Salamov, A.; et al. The genome of black cottonwood, Populus trichocarpa (Torr. & Gray). Science 2006, 313, 1596–1604. [Google Scholar] [PubMed] [Green Version]
  36. Nystedt, B.; Street, N.R.; Wetterbom, A.; Zuccolo, A.; Lin, Y.-C.; Scofield, D.G.; Vezzi, F.; Delhomme, N.; Giacomello, S.; Alexeyenko, A.; et al. The Norway spruce genome sequence and conifer genome evolution. Nature 2013, 497, 579–584. [Google Scholar] [CrossRef] [PubMed] [Green Version]
  37. Myburg, A.A.; Grattapaglia, D.; Tuskan, G.A.; Hellsten, U.; Hayes, R.D.; Grimwood, J.; Jenkins, J.; Lindquist, E.; Tice, H.; Bauer, D.; et al. The genome of Eucalyptus grandis. Nature 2014, 510, 356–362. [Google Scholar] [CrossRef] [Green Version]
  38. Neale, D.B.; Wegrzyn, J.L.; Stevens, K.A.; Zimin, A.V.; Puiu, D.; Crepeau, M.W.; Cardeno, C.; Koriabine, M.; Holtz-Morris, A.E.; Liechty, J.D.; et al. Decoding the massive genome of loblolly pine using haploid DNA and novel assembly strategies. Genome Biol. 2014, 15, R59. [Google Scholar] [CrossRef] [PubMed] [Green Version]
  39. Telfer, E.; Graham, N.; Macdonald, L.; Sturrock, S.; Wilcox, P.; Stanbra, L. Approaches to variant discovery for conifer transcriptome sequencing. PLoS ONE 2018, 13, e0205835. [Google Scholar] [CrossRef] [Green Version]
  40. Telfer, E.; Graham, N.; Macdonald, L.; Li, Y.; Klápště, J.; Resende, M., Jr.; Neves, L.G.; Dungey, H.; Wilcox, P. A high-density exome capture genotype-by-sequencing panel for forestry breeding in Pinus radiata. PLoS ONE 2019, 14, e0222640. [Google Scholar] [CrossRef] [Green Version]
  41. Neale, D.B.; Savolainen, O. Association genetics of complex traits in conifers. Trends Plant Sci. 2004, 9, 330–337. [Google Scholar] [CrossRef]
  42. VanRaden, P.M. Efficient methods to compute genomic predictions. J. Dairy Sci. 2008, 91, 4414–4423. [Google Scholar] [CrossRef] [Green Version]
  43. Nejati-Javaremi, A.; Smith, C.; Gibson, J.P. Effect of total allelic relationship on accuracy of evaluation and response to selection. J. Anim. Sci.e 1997, 75, 1738–1745. [Google Scholar] [CrossRef] [PubMed]
  44. Yu, J.; Pressoir, G.; Briggs, W.H.; Bi, I.V.; Yamasaki, M.; Doebley, J.F.; McMullen, M.D.; Gaut, B.S.; Nielsen, D.M.; Holl, J.B.; et al. A unified mixed-model method for association mapping that accounts for multiple levels of relatedness. Nat. Genet. 2006, 38, 203–208. [Google Scholar] [CrossRef]
  45. Kang, H.M.; Sul, J.H.; Zaitlen, N.A.; Kong, S.-Y.; Freimer, N.B.; Sabatti, C.; Eskin, E. Variance component model to account for sample structure in genome-wide association studies. Nat. Genet. 2010, 42, 348–354. [Google Scholar] [CrossRef] [Green Version]
  46. Habier, D.; Fernando, R.L.; Dekkers, J.C.M. The impact of genetic relationship information on genome-assisted breeding values. Genetics 2007, 177, 2389–2397. [Google Scholar] [CrossRef] [Green Version]
  47. Habier, D.; Fernando, R.L.; Garrick, D.J. Genomic BLUP decoded: A look into the black box of genomic prediction. Genetics 2013, 194, 597–607. [Google Scholar] [CrossRef] [Green Version]
  48. El-Kassaby, Y.A.; Klápště, J.; Guy, R.D. Breeding without breeding: Selection using the genomic best linear unbiased predictor method (GBLUP). New For. 2012, 43, 631–637. [Google Scholar] [CrossRef]
  49. Yang, J.; Benyamin, B.; McEvoy, B.P.; Gordon, S.; Henders, A.K.; Nyholt, D.R.; Madden, P.A.; Heath, A.C.; Martin, N.G.; Montgomery, G.W.; et al. Common SNPs explain a large proportion of the heritability for human height. Nat. Genet. 2010, 42, 565–569. [Google Scholar] [CrossRef] [PubMed] [Green Version]
  50. Porth, I.; Klápště, J.; Skyba, O.; Lai, B.S.K.; Geraldes, A.; Muchero, W.; Tuskan, G.A.; Douglas, C.J.; El-Kassaby, Y.A.; Mansfield, S.D. Populus trichocarpa cell wall chemistry and ultrastructure trait variation, genetic control and genetic correlations. New Phytol. 2013, 197, 777–790. [Google Scholar] [CrossRef]
  51. El-Dien, O.G.; Ratcliffe, B.; Klápště, J.; Porth, I.; Chen, C.; El-Kassaby, Y.A. Implementation of the realized genomic relationship matrix to open-pollinated white spruce family testing for disentangling additive from nonadditive genetic effects. G3 Genes Genomes Genet. 2016, 6, 743–753. [Google Scholar]
  52. Nazarian, A.; Gezan, S.A. Integrating nonadditive genomic relationship matrices into the study of genetic architecture of complex traits. J. Hered. 2015, 107, 153–162. [Google Scholar] [CrossRef] [PubMed] [Green Version]
  53. Li, Y.; Dungey, H.S. Expected benefit of genomic selection over forward selection in conifer breeding and deployment. PLoS ONE 2018, 13, e0208232. [Google Scholar] [CrossRef] [Green Version]
  54. Resende, M.F.R.; Munoz, P.; Acosta, J.J.; Peter, G.F.; Davis, J.M.; Grattapaglia, D.; Resende, M.D.V.; Kirst, M. Accelerating the domestication of trees using genomic selection: Accuracy of prediction models across ages and environments. New Phytol. 2012, 193, 617–624. [Google Scholar] [CrossRef] [PubMed] [Green Version]
  55. Beaulieu, J.; Doerksen, T.; Clément, S.; MacKay, J.; Bousquet, J. Accuracy of genomic selection models in a large population of open-pollinated families in white spruce. Heredity 2014, 113, 343–352. [Google Scholar] [CrossRef] [PubMed] [Green Version]
  56. Aguirre, N.C.; Filippi, C.V.; Zaina, G.; Rivas, J.G.; Acuña, C.; Villalba, P.V.; García, M.N.; Scaglione, D.; Morgante, M.; González, S.; et al. Development of a genotyping by sequencing strategy for assisted breeding of Eucalyptus dunnii. In Proceedings of the VII Reunión Genética y Mejoramiento Forestal, San Miguel de Tucumán, Argentina, 22–26 August 2016. [Google Scholar]
  57. Klápště, J.; Suontama, M.; Telfer, E.; Graham, N.; Low, C.; Stovold, T.; McKinley, R.; Dungey, H. Exploration of genetic architecture through sib-ship reconstruction in advanced breeding population of Eucalyptus nitens. PLoS ONE 2017, 12, e0185137. [Google Scholar] [CrossRef] [PubMed] [Green Version]
  58. Burdon, R.D.; Shelbourne, C.J.A. Breeding populations for recurrent selection: Conflicts and possible solutions. N. Z. J. For. Sci. 1971, 1, 174–193. [Google Scholar]
  59. Dodds, K.G.; McEwan, J.C.; Brauning, R.; Anderson, R.M.; Stijn, T.C.; Kristjánsson, T.; Clarke, S.M. Construction of relatedness matrices using genotyping-by-sequencing data. BMC Genom. 2015, 16, 1047. [Google Scholar] [CrossRef] [PubMed] [Green Version]
  60. Telfer, E.J.; Stovold, G.T.; Li, Y.; Silva-Junior, O.B.; Grattapaglia, D.G.; Dungey, H.S. Parentage reconstruction in Eucalyptus nitens using SNPs and microsatellite markers: A comparative analysis of marker data power and robustness. PLoS ONE 2015, 10, e0130601. [Google Scholar] [CrossRef]
  61. Telfer, E.; Graham, N.; Stanbra, L.; Manley, T.; Wilcox, P. Extraction of high purity genomic DNA from pine for use in a high-throughput genotyping platform. N. Z. J. For. Sci. 2013, 43, 3. [Google Scholar] [CrossRef] [Green Version]
  62. Lu, F.; Lipka, A.E.; Glaubitz, J.; Elshire, R.; Cherney, J.H.; Casler, M.D.; Buckler, E.S.; Costich, D.E. Switchgrass genomic diversity, ploidy, and evolution: Novel insights from a network-based SNP discovery protocol. PLoS Genet. 2013, 9, e1003215. [Google Scholar] [CrossRef] [Green Version]
  63. Bradbury, P.J.; Zhang, Z.; Kroon, D.E.; Casstevens, T.M.; Ramdoss, Y.; Buckler, E.S. TASSEL: Software for association mapping of complex traits in diverse samples. Bioinformatics 2007, 23, 2633–2635. [Google Scholar] [CrossRef]
  64. Lopes, M.S.; Silva, F.F.; Harlizius, B.; Duijvesteijn, N.; Lopes, P.S.; Guimaraes, S.E.F.; Knol, E.F. Improved estimation of inbreeding and kinship in pigs using optimized SNP panels. BMC Genet. 2013, 14, 92. [Google Scholar] [CrossRef] [PubMed] [Green Version]
  65. Dodds, K.G.; McEwan, J.C.; Brauning, R.; van Stijn, T.C.; Rowe, S.J.; McEwan, K.M.; Clarke, S.M. Exclusion and genomic relatedness methods for assignment of parentage using genotyping-by-sequencing data. G3 Genes Genomes Genet. 2019, 9, 3239–3247. [Google Scholar] [CrossRef] [Green Version]
  66. Whalen, A.; Gorjanc, G.; Hickey, J.M. Parentage assignment with genotyping-by-sequencing data. J. Anim. Breed. Genet. 2019, 136, 102–112. [Google Scholar] [CrossRef] [Green Version]
  67. Grattapaglia, D.; Ribeiro, V.J.; Rezende, G.D.S.P. Retrospective selection of elite parent trees using paternity testing with microsatellite markers: An alternative short term breeding tactic for Eucalyptus. Theor. Appl. Genet. 2004, 109, 192–199. [Google Scholar] [CrossRef]
  68. Lstibůrek, M.; Ivanková, K.; Kadlec, J.; Kobliha, J.; Klápště, J.; El-Kassaby, Y.A. Breeding without breeding: Minimum fingerprinting effort with respect to the effective population size. Tree Genet. Genomes 2011, 7, 1069–1078. [Google Scholar] [CrossRef]
  69. Lstibůrek, M.; Klápště, J.; Kobliha, J.; El-Kassaby, Y.A. Breeding without Breeding: Effect of gene flow on fingerprinting effort. Tree Genet. Genomes 2012, 8, 873–877. [Google Scholar] [CrossRef]
  70. Bush, D.; Kain, D.; Kanowski, P.; Matheson, C. Genetic parameter estimates informed by a marker-based pedigree: A case study with Eucalyptus cladocalyx in southern Australia. Tree Genet. Genomes 2015, 11, 798. [Google Scholar] [CrossRef]
  71. Hill, W.G.; Weir, B.S. Variation in actual relationship as a consequence of Mendelian sampling and linkage. Genet. Res. 2011, 93, 47–64. [Google Scholar] [CrossRef] [PubMed] [Green Version]
  72. Wang, J. Pedigrees or markers: Which are better in estimating relatedness and inbreeding coefficient? Theor. Popul. Biol. 2016, 107, 4–13. [Google Scholar] [CrossRef]
  73. Goddard, M. Genomic selection: Prediction of accuracy and maximisation of long term response. Genetica 2009, 136, 245–257. [Google Scholar] [CrossRef]
  74. Lippert, C.; Quon, G.; Kang, E.Y.; Kadie, C.M.; Listgarten, J.; Heckerman, D. The benefits of selecting phenotype-specific variants for applications of mixed models in genomics. Sci. Rep. 2013, 3, 1815. [Google Scholar] [CrossRef] [PubMed] [Green Version]
  75. Grattapaglia, D.; Kirst, M. Eucalyptus applied genomics: From gene sequences to breeding tools. New Phytol. 2008, 179, 911–929. [Google Scholar] [CrossRef]
  76. Müller, B.S.F.; Neves, L.G.; de Almeida Filho, J.E.; Resende, M.F.R.; Munoz, P.R.; dos Santos, P.E.T.; Filho, E.P.; Kirst, M.; Grattapaglia, D. Genomic prediction in contrast to a genome-wide association study in explaining heritable variation of complex growth traits in breeding populations of Eucalyptus. BMC Genom. 2017, 18, 524. [Google Scholar] [CrossRef] [Green Version]
  77. Durán, R.; Isik, F.; Zapata-Valenzuela, J.; Balocchi, C.; Valenzuela, S. Genomic predictions of breeding values in a cloned Eucalyptus globulus population in Chile. Tree Genet. Genomes 2017, 13, 74. [Google Scholar] [CrossRef]
  78. Tan, B.; Grattapaglia, D.; Martins, G.S.; Ferreira, K.Z.; Sundberg, B.; Ingvarsson, P.K. Evaluating the accuracy of genomic prediction of growth and wood traits in two Eucalyptus species and their F1 hybrids. BMC Plant Biol. 2017, 17, 110. [Google Scholar] [CrossRef] [PubMed] [Green Version]
  79. Suontama, M.; Klápště, J.; Telfer, E.; Graham, N.; Stovold, T.; Low, C.; McKinley, R.; Dungey, H. Efficiency of genomic prediction across two Eucalyptus nitens seed orchards with different selection histories. Heredity 2019, 122, 370–379. [Google Scholar] [CrossRef] [Green Version]
  80. Grattapaglia, D.; Resende, M.D.V. Genomic selection in forest tree breeding. Tree Genet. Genomes 2011, 7, 241–255. [Google Scholar] [CrossRef]
  81. Gorjanc, G.; Clevel, M.A.; Houston, R.D.; Hickey, J.M. Potential of genotyping-by-sequencing for genomic selection in livestock populations. Genet. Sel. Evol. 2015, 47, 12. [Google Scholar] [CrossRef] [PubMed]
  82. Ahuja, M.R.; Neale, D.B. Evolution of genome size in conifers. Silvae Genet. 2005, 54, 126–137. [Google Scholar] [CrossRef] [Green Version]
  83. Moghaddar, N.; Gore, K.P.; Daetwyler, H.D.; Hayes, B.J.; Werf, J.H.J. Accuracy of genotype imputation based on random and selected reference sets in purebred and crossbred sheep populations and its effect on accuracy of genomic prediction. Genet. Sel. Evol. 2015, 47, 97. [Google Scholar] [CrossRef] [PubMed] [Green Version]
  84. Jarquín, D.; Kocak, K.; Posadas, L.; Hyma, K.; Jedlicka, J.; Graef, G.; Lorenz, A. Genotyping by sequencing for genomic prediction in a soybean breeding population. BMC Genom. 2014, 15, 740. [Google Scholar] [CrossRef] [PubMed] [Green Version]
  85. Savolainen, O.; Pyhäjärvi, T. Genomic diversity in forest trees. Curr. Opin. Plant Biol. 2007, 10, 162–167. [Google Scholar] [CrossRef] [PubMed]
  86. Meirmans, P.G.; Gros-Louis, M.-C.; Lamothe, M.; Perron, M.; Bousquet, J.; Isabel, N. Rates of spontaneous hybridization and hybrid recruitment in co-existing exotic and native mature larch populations. Tree Genet. Genomes 2014, 10, 965–975. [Google Scholar] [CrossRef] [Green Version]
  87. Meirmans, P.G.; Lamothe, M.; Gros-Louis, M.-C.; Khasa, D.; Périnet, P.; Bousquet, J.; Isabel, N. Complex patterns of hybridization between exotic and native North American poplar species. Am. J. Bot. 2010, 97, 1688–1697. [Google Scholar] [CrossRef] [PubMed] [Green Version]
  88. Visscher, P.M.; Hill, W.G.; Wray, N.R. Heritability in the genomics era–concepts and misconceptions. Nat. Rev. Genet. 2008, 9, 255–266. [Google Scholar] [CrossRef]
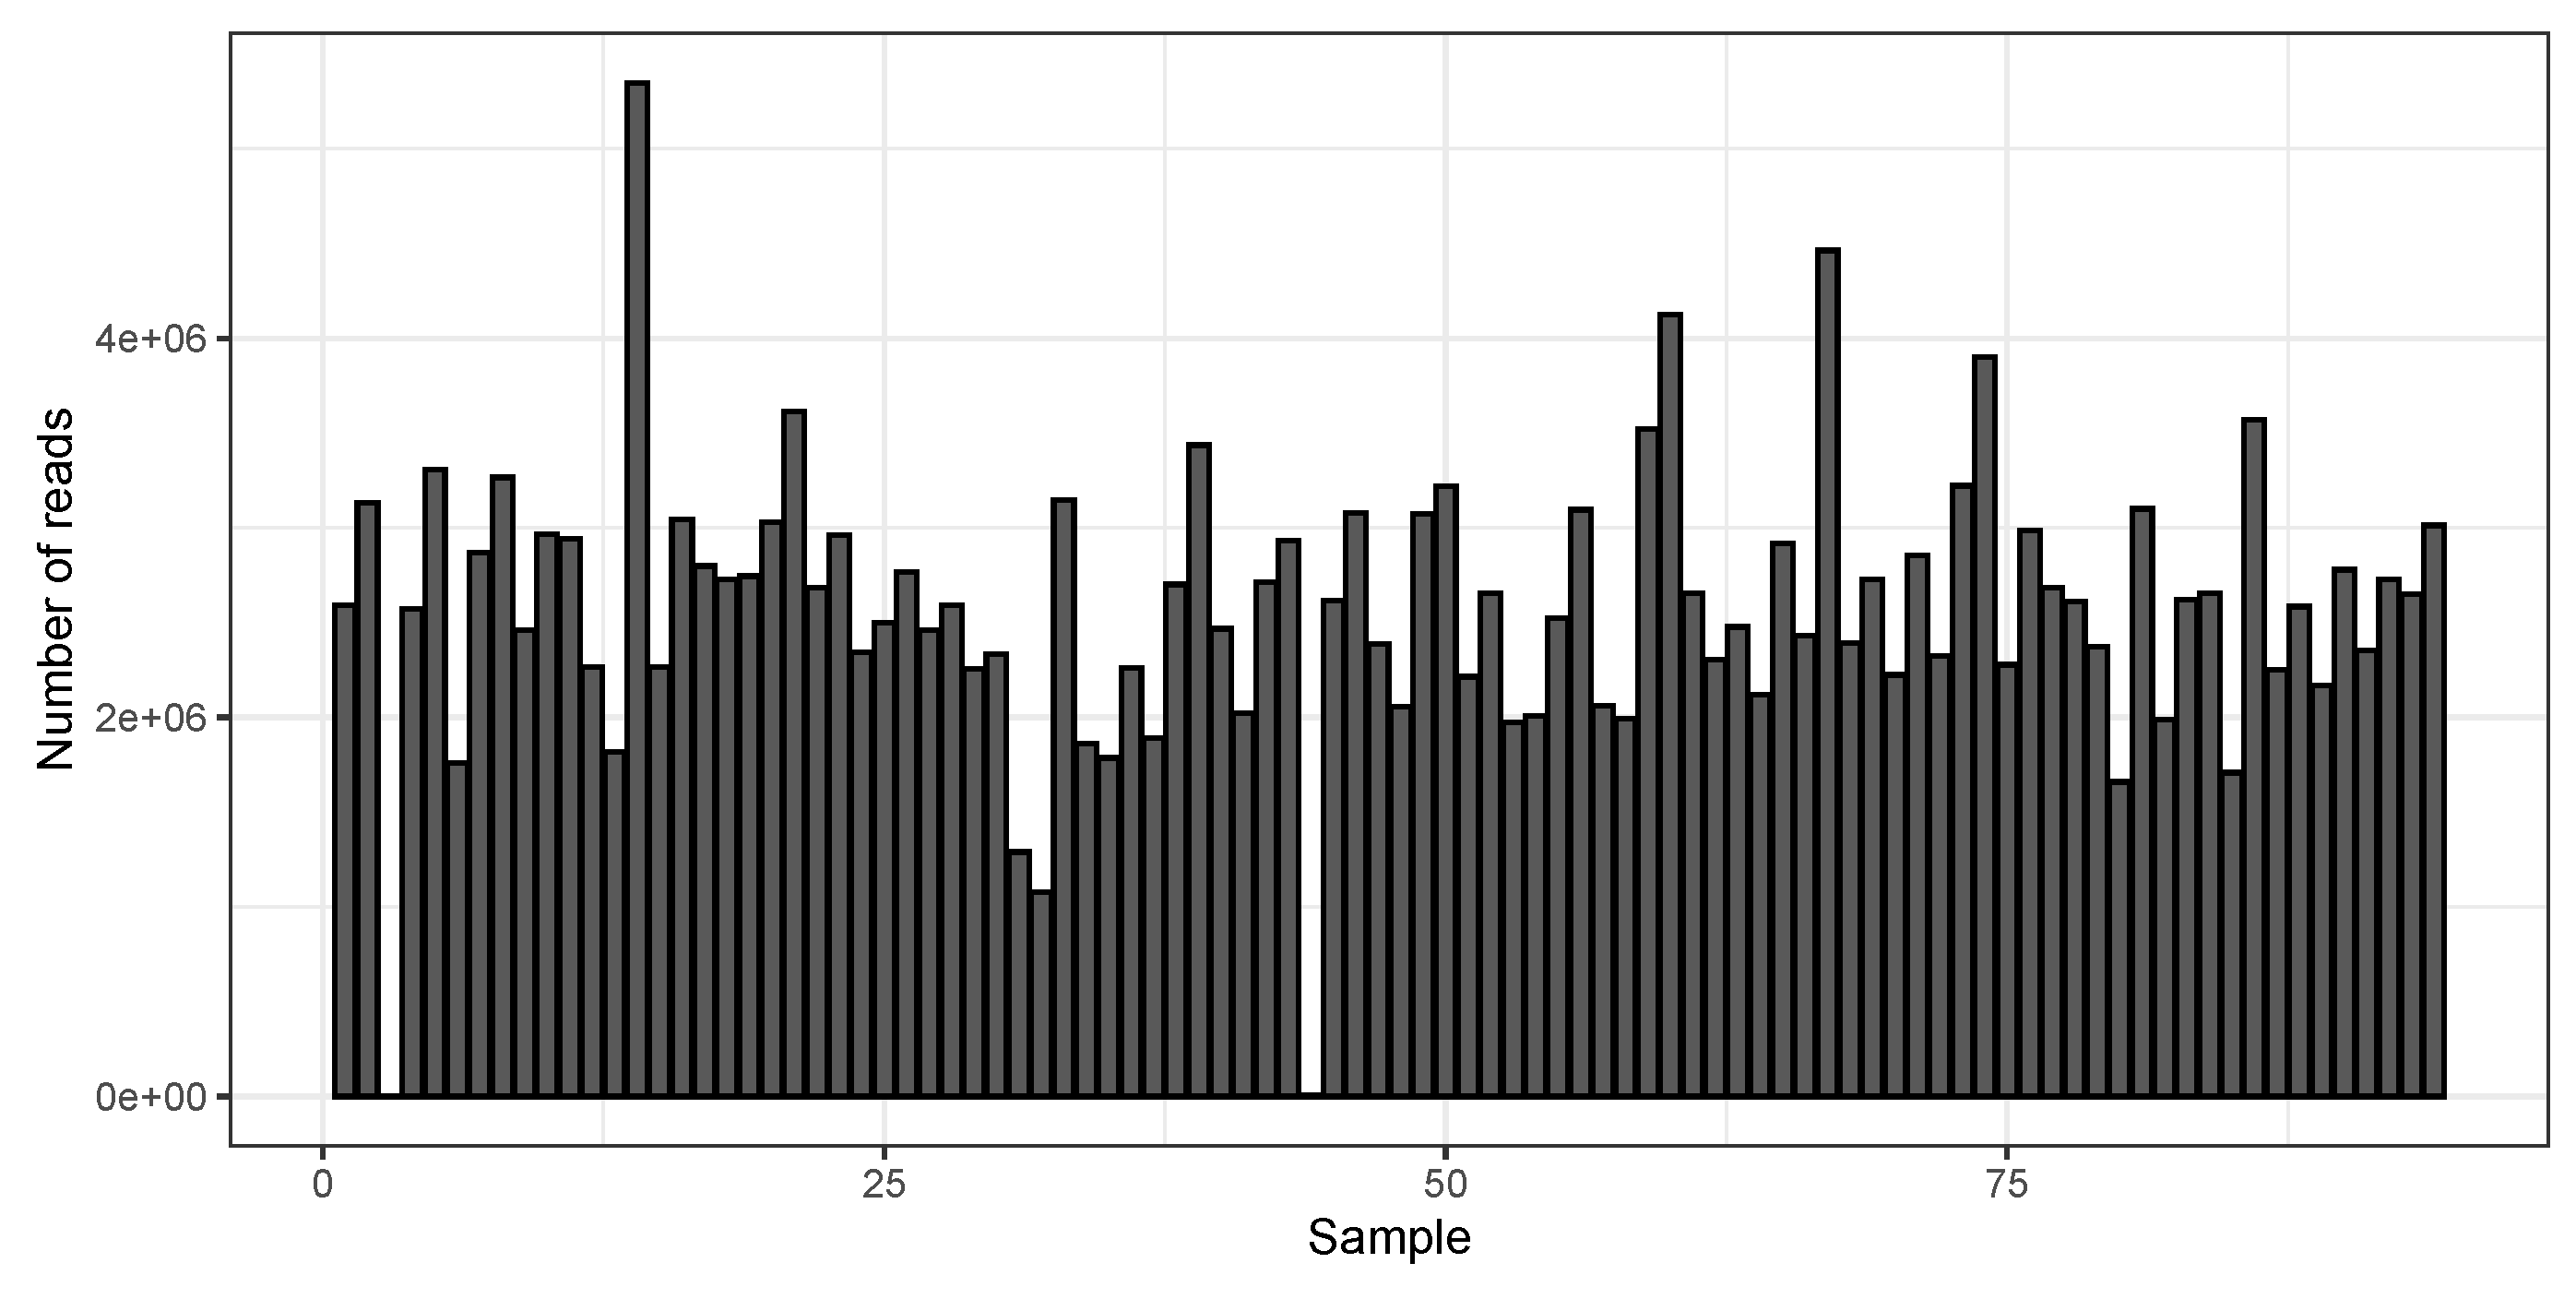
Figure 1. Number of reads. Number of reads generated for each sample.
Forests 12 00904 g001
Figure 2. Number of markers. Number of SNPs generated under different SNP read depth thresholds (top plot) as well as under different sample read depth thresholds (bottom plot). The confidence limits represent variance in the number of SNPs across different sample read depth/SNP read depth thresholds.
Forests 12 00904 g002
Figure 3. Call rates. Call rates across SNPs and individuals in whole population (plot (A,B)) and only E. nitens individuals (plot (C,D)).
Forests 12 00904 g003
Figure 4. Parent-offspring relatedness distribution. Distribution of estimated relatedness for parent-offspring pairs under different minimum SNP read depth thresholds in the whole population (upper plots) and only E.nitens population (bottom plots) using G1 [42] (left plots) and G5 [59] (right plots) relationship matrices.
Forests 12 00904 g004
Figure 5. Parent-offspring relatedness distribution. Distribution of estimated relatedness for parent-offspring pairs under different minimum sample read depth thresholds in the whole population (upper plots) and only E.nitens population (bottom plots) using G1 [42] (left plots) and G5 [59] (right plots) relationship matrices.
Forests 12 00904 g005
Figure 6. Self-relatedness distribution. Distribution of estimated self-relatedness under different minimum SNP read depth thresholds in the whole population (upper plots) and only E.nitens population (bottom plots) using G1 [42] (left plots) and G5 [59] (right plots) relationship matrices.
Forests 12 00904 g006
Figure 7. Spectral decomposition of relatedness matrix. Spectral decomposition of G1 [42] (left plot) and G5 [59] (right plot) relationship matrices, red points represent individuals belonging to other Eucalyptus species or putative hybrids.
Forests 12 00904 g007
Table 1. Structure of the studied population.
SpeciesSeed OrchardNr. of ParentsNr. of Offspring
E. nitensAlexandra139
E. nitensDrumfern09
E. nitensTinkers3018
E. grandis x E. nitensNA40
E. quadrangulataNA10
E. regnansNA10
E. salignaNA10
E. cladocalyxNA10
E. camaldensisNA10
E. bosistoanaNA10
Publisher’s Note: MDPI stays neutral with regard to jurisdictional claims in published maps and institutional affiliations.