Abstract
All-season warming is assumed to advance snowmelt and delay snow accumulation; additionally, coupled with warming-induced drought stress, all-season warming could extend both the beginning and the end of the fire season. Using fire data updated for 1968–2018, we found an asymmetrical expansion of the lightning fire season in the boreal forest of Northeast China. Lightning fires have not advanced into the early fire season (May–June) but have largely extended into the snowless late fire season (July–September) since the late 1990s (mean end Julian date delayed by 51.1 days for 1998–2018 compared with 1968–1997, p < 0.001). Despite significant warming, the Julian days of snowmelt have changed only slightly, which has prohibited the fire season from advancing into early spring. The expansion of lightning fires into July–September was associated with a warming-induced significant increase in evapotranspiration and a decrease in soil/fuel moisture.
1. Introduction
In association with climate warming and frequent heatwaves, wildfire frequency, burned area, and duration have all increased [1,2,3], leading to a great loss of human lives and property, disturbance of forest ecosystems, and biodiversity changes [4,5,6,7,8]. The severity of wildfires is a key factor in transforming forest ecosystems from net carbon sinks to net carbon sources [9,10] and has substantially contributed to greenhouse gas emissions [11]. Warming rates increase with increasing latitude [12], and boreal forests have experienced increases in drought stress, fuel dryness, and dry seasons duration [13,14,15,16]. Lightning is the leading cause of fire ignition in some regions of boreal forest [17,18,19], and the coupling of lightning with increased warming-induced drought severity is responsible for the increase in fires in these regions [20,21,22].
In addition to increasing fire frequency, warming has been shown to expand the fire season by both advancing the beginning and extending the end in North America, Europe, and Southwest China [23,24,25]. The global wildfire season length increased by 18.7% from 1979 to 2013 [26], and seasonal expansion has been and will continue to be more pronounced in northern high latitudes [3]. Fire ignitions are highly dependent on fuel dryness, which is controlled by precipitation, evapotranspiration [27], and interactions between snow cover and soil moisture conditions [28]. Snow cover naturally prohibits fire occurrence, and strong spring-summer warming and earlier snowmelt theoretically reduce soil and fuel moisture and thereby advance fire occurrence into early spring [29,30].
The Greater Khingan forest, the only boreal forest in Northeast China, has experienced a rapid warming rate and the largest number of lightning fires among all forests in China [31]. Increased fire occurrence, larger burned areas, and an elongated fire season were observed in this region between 198 and 005 [32]. However, whether the seasonality of lightning fires has changed in recent decades remains unclear [17]. This uncertainty arises from the distinct time intervals and old versions of fire records used by previous studies. The frequency and severity of lightning fires have been shown to be determined by moisture conditions, fuel stock and dryness [33,34,35], however, the potential mechanisms linking fire seasonality, snow cover, and soil moisture need to be further explored.
In this study, we used the long-term fire record, climate, soil moisture, and snow cover data for the Greater Khingan forest. The dynamics of lightning fire seasonality, fire frequency, snowmelt and snow accumulation days, snow cover, and key climate factors between 1968 and 2018 were characterized. In addition, the connections between fire occurrence and climate change, snow cover, and moisture conditions were explored.
2. Data and Methods
2.1. Study Area
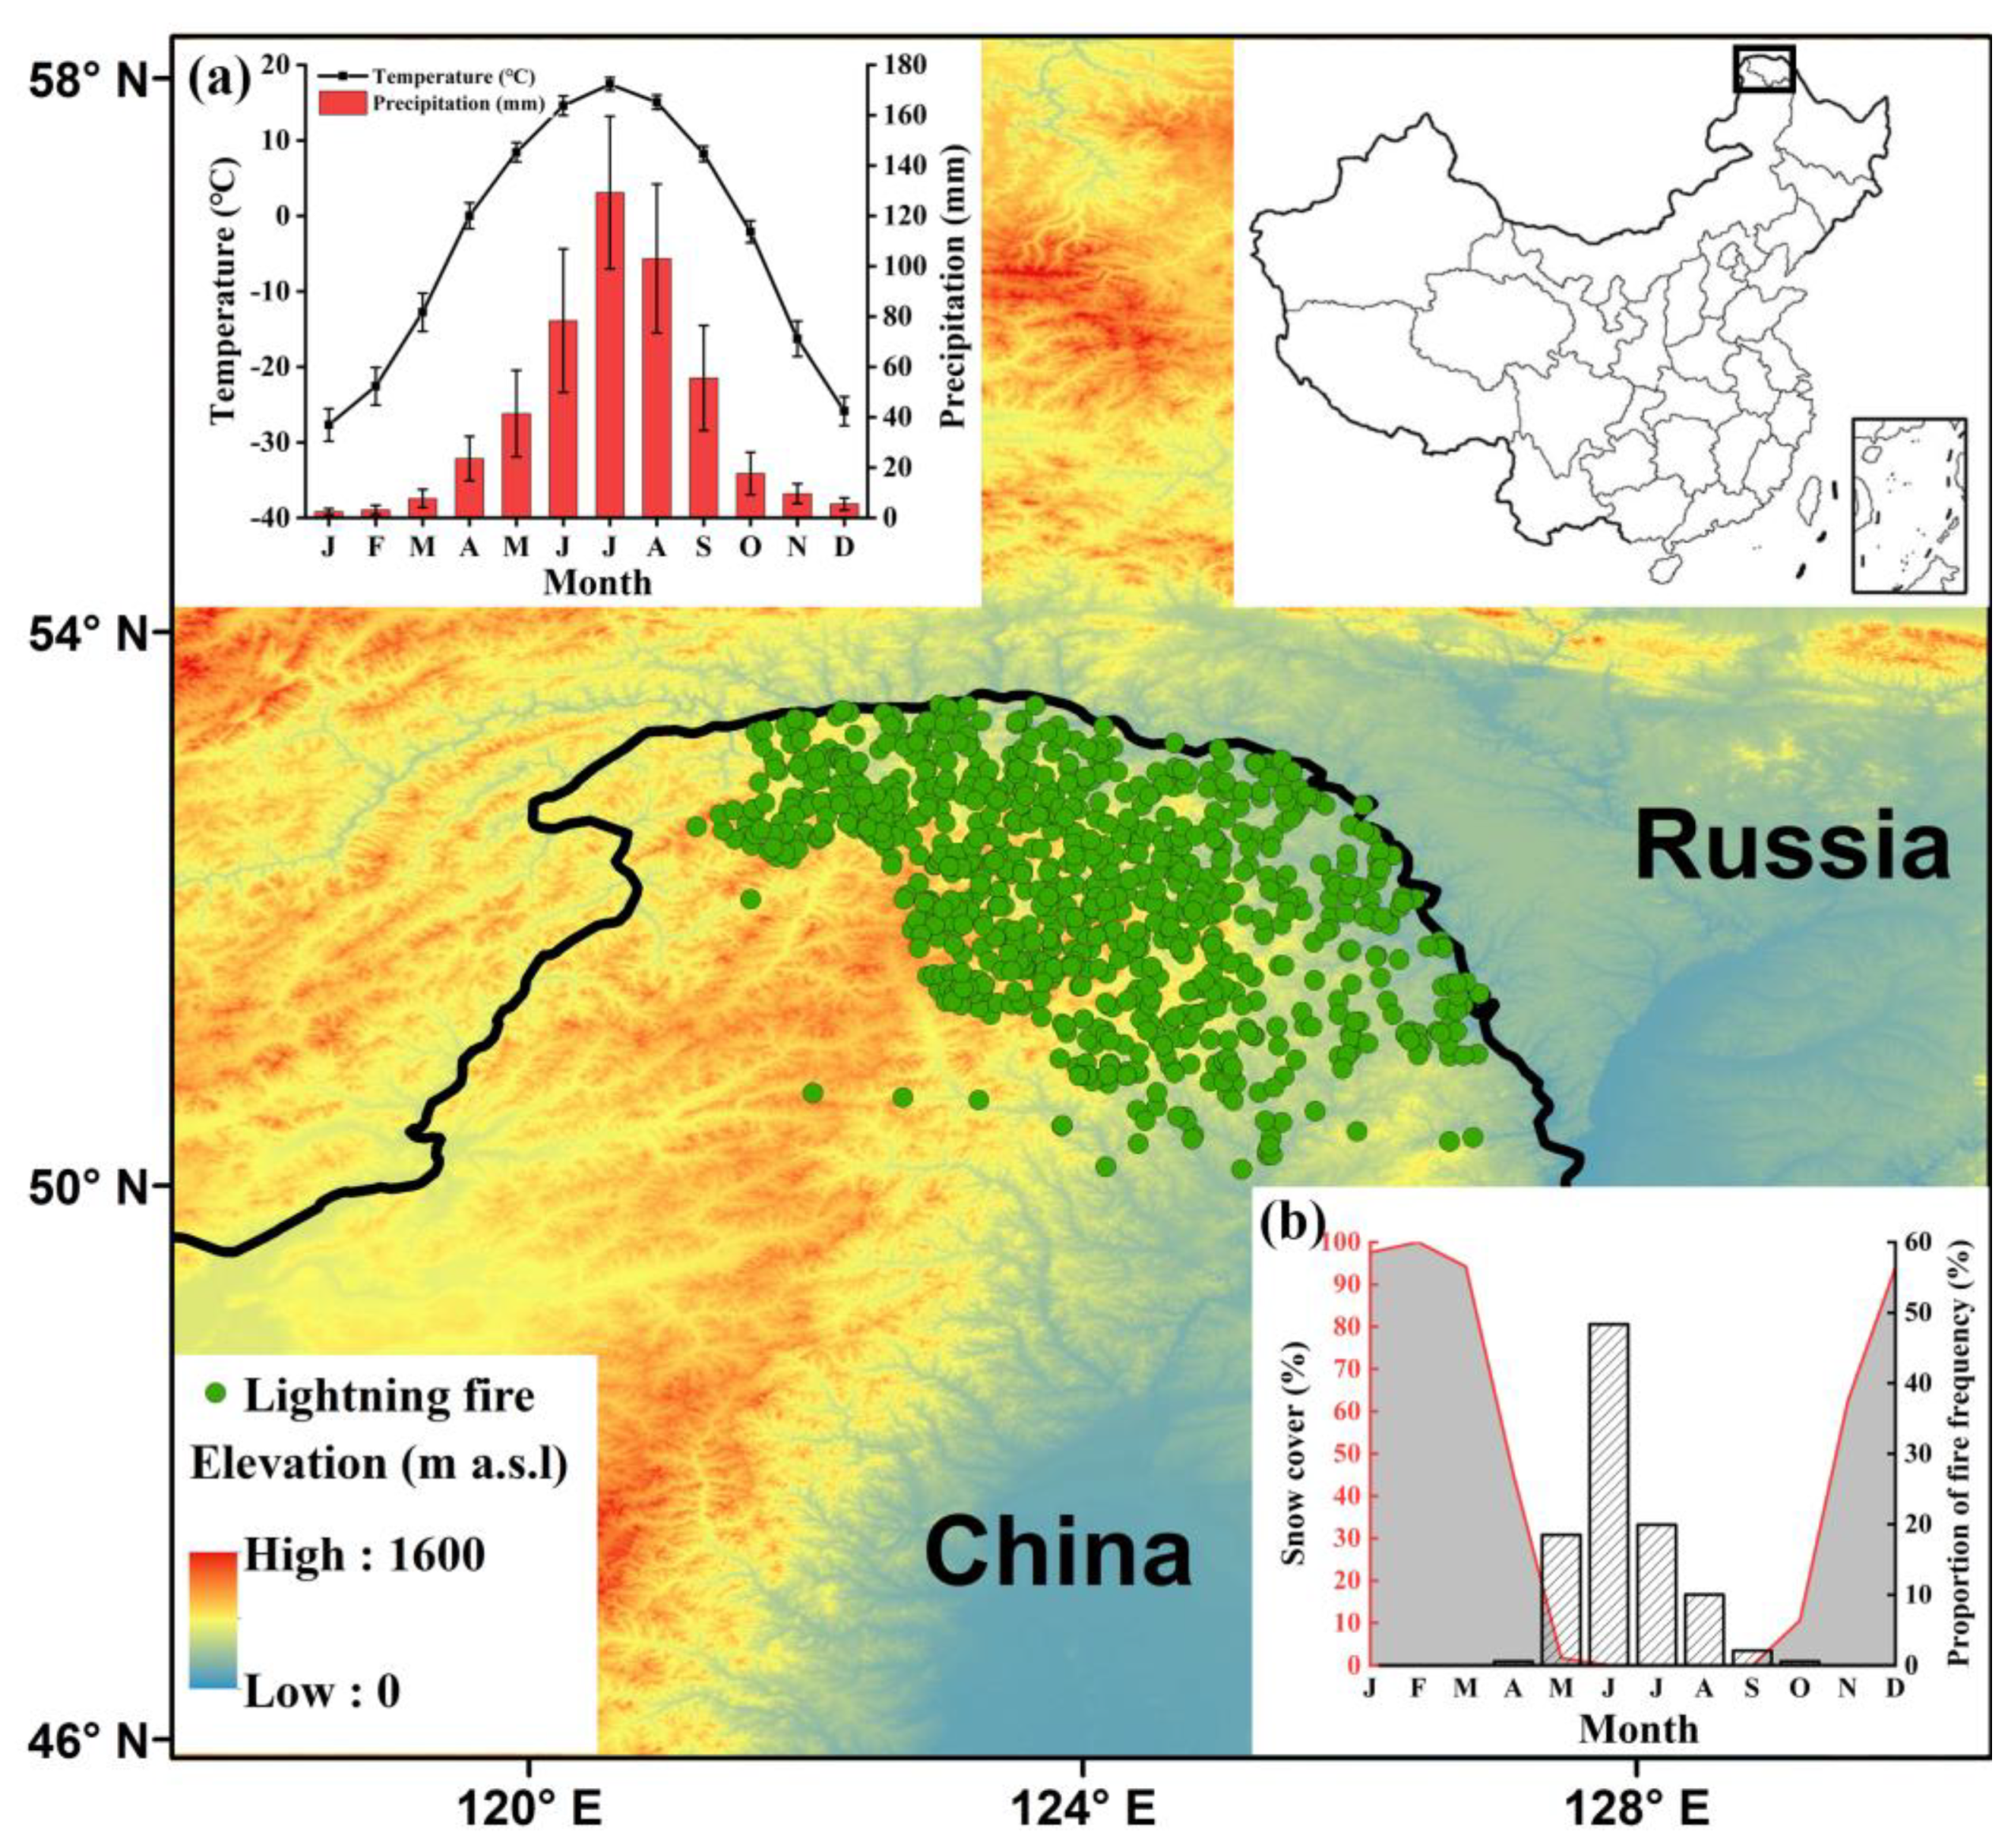
The study area is located in the Greater Khingan forest of Heilongjiang Province, China (Figure 1), which is the southern extension of the Russian Far East boreal forest into China, and covers a rectangular region within 121°–127° E and 50°–53° N. The dominant tree genera are Larix and Pinus. The elevation ranges from 180 m to 1528 m above sea level (a.s.l.).
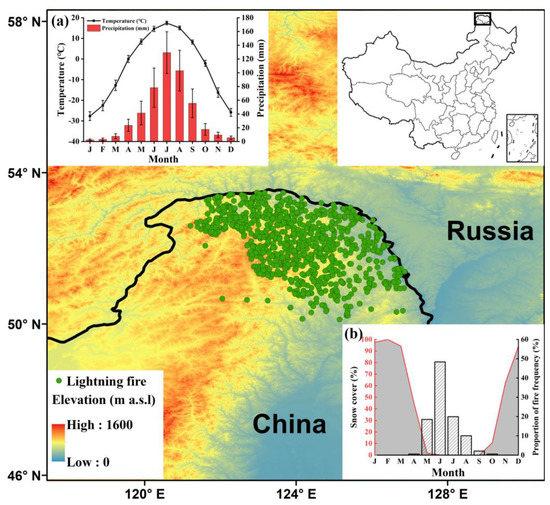
Figure 1.
Locations of lightning fires from 1968 to 2018. The black rectangle at the top right indicates the boundary of the map. The top left insert (a) shows the monthly mean temperature and precipitation of the study area (121°–127° E and 50°–53° N). The bottom right insert (b) shows the monthly mean snow cover and lightning fire ratio.
The Greater Khingan forest is located in the cold-temperate continental monsoonal climate region. Mean temperature ranges from −4 to −2 °C. Mean annual precipitation is 400 to 550 mm (Figure 1a). The mean number of frost-free days is 90 to 110. Almost all lightning fires (98.7%) occur between May and September (MJJAS) (Figure 1b), which is defined as the lightning fire season.
2.2. Fire and Climate Data
Detailed information on historical wildfires, including fire dates, coordinates, causes of ignition, burned areas, etc., was investigated and recorded by the local forest administrations. Monthly climate data, including mean temperature (Temp), maximum temperature (Tmax), and precipitation (Prec), were obtained from the Climatic Research Unit Timeseries 4.03 dataset with a resolution of 0.5°. The monthly and daily snow cover data were extracted from the Rutgers University Global Snow Lab database. The one-month standardized precipitation evapotranspiration index (SPEI) data were obtained from the Spanish National Research Council. The 0–10 cm soil moisture (SM) and evapotranspiration (Eva) data were compiled from the Common Land Model ERA-Interim dataset. Information on data sources, accessed dates, and source websites has been listed in Table A1.
2.3. Methods
The fire season was separated into the early and late fire seasons of May to June (MJ) and July to September (JAS), respectively. The climate parameters, including Temp, Tmax, Prec, SPEI, Eva, SM, and snow cover, were averaged over the region of 121°–127° E, 50°–53° N to estimate the mean climate conditions of the study region. The burned area data were base-10 logarithm-transformed for convenience; the transformed data are plotted in the figures. To examine the fire season changes over time, we transformed the fire dates and the daily snow cover data into Julian days [36]. A previous study identified a negative to positive regime shift for both lightning fire frequency and summer temperature in approximately 1998 [37], so this year was used as a breakpoint in this study. The Pearson correlation coefficient (R) values describing the relationships between MJJAS lightning fire frequency and climate indices were calculated to estimate the effects of regional climate on fire occurrence. The first-order autocorrelation coefficients of the climate indices were calculated and are displayed in Table A2. To estimate the trends of the climate parameters, linear regression was conducted.
To determine whether the probability distribution of burned area data was stable over time before and after 1998, a quantile–quantile test was conducted using the R function “qqplot”: the quantile of each 1998–2018 data point within its own dataset was derived, and then the corresponding value with the same quantiles but for the distribution probability of the 1968–1997 data was derived and plotted against the 1998–2018 data. To calculate the significance of the mean value shift before and after 1998, t-tests were applied to the normally distributed data, including fire start date, snowmelt date, and snow accumulation date, while the Mann–Whitney test was adopted to test nonnormally distributed data, such as fire end date, fire season length and fire frequency in MJ, JAS, and MJJAS.
3. Results
3.1. Fire Frequency and Burned Area
In total, 908 lightning fires occurred in the Greater Khingan forest during 1968–2018, with a mean burned area of 68.8 km2 each year. The increase in mean lightning fire frequency of the early fire season (MJ) during 1998–2018 compared to 1968–1997 was insignificant (p = 0.14, 89 versus 162 events/decade, Figure 2a), whereas the increases in frequency of the late fire season (JAS) and whole fire season (MJJAS) were significant (p < 0.001 and p < 0.01, respectively; 8 versus 127 and 97 versus 289 events/decade, respectively; Figure 2b,c). Before 1998, 90.5% of the lightning fires occurred in MJ, and only 8.5% occurred in JAS. From 1998 onwards, the proportion of lightning fires JAS increased to 43.4% (Figure 2).
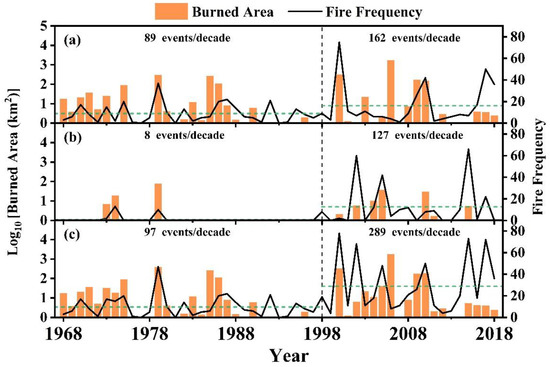
Figure 2.
The annual lightning fire frequency and the logarithm of burned area from 1968–1997 and 1998–2018 in MJ (a), JAS (b), and MJJAS (c). The green dashed lines indicate the mean fire frequencies over 1968–1997 and 1998–2018.
3.2. Lightning Fire Season and Snow Cover
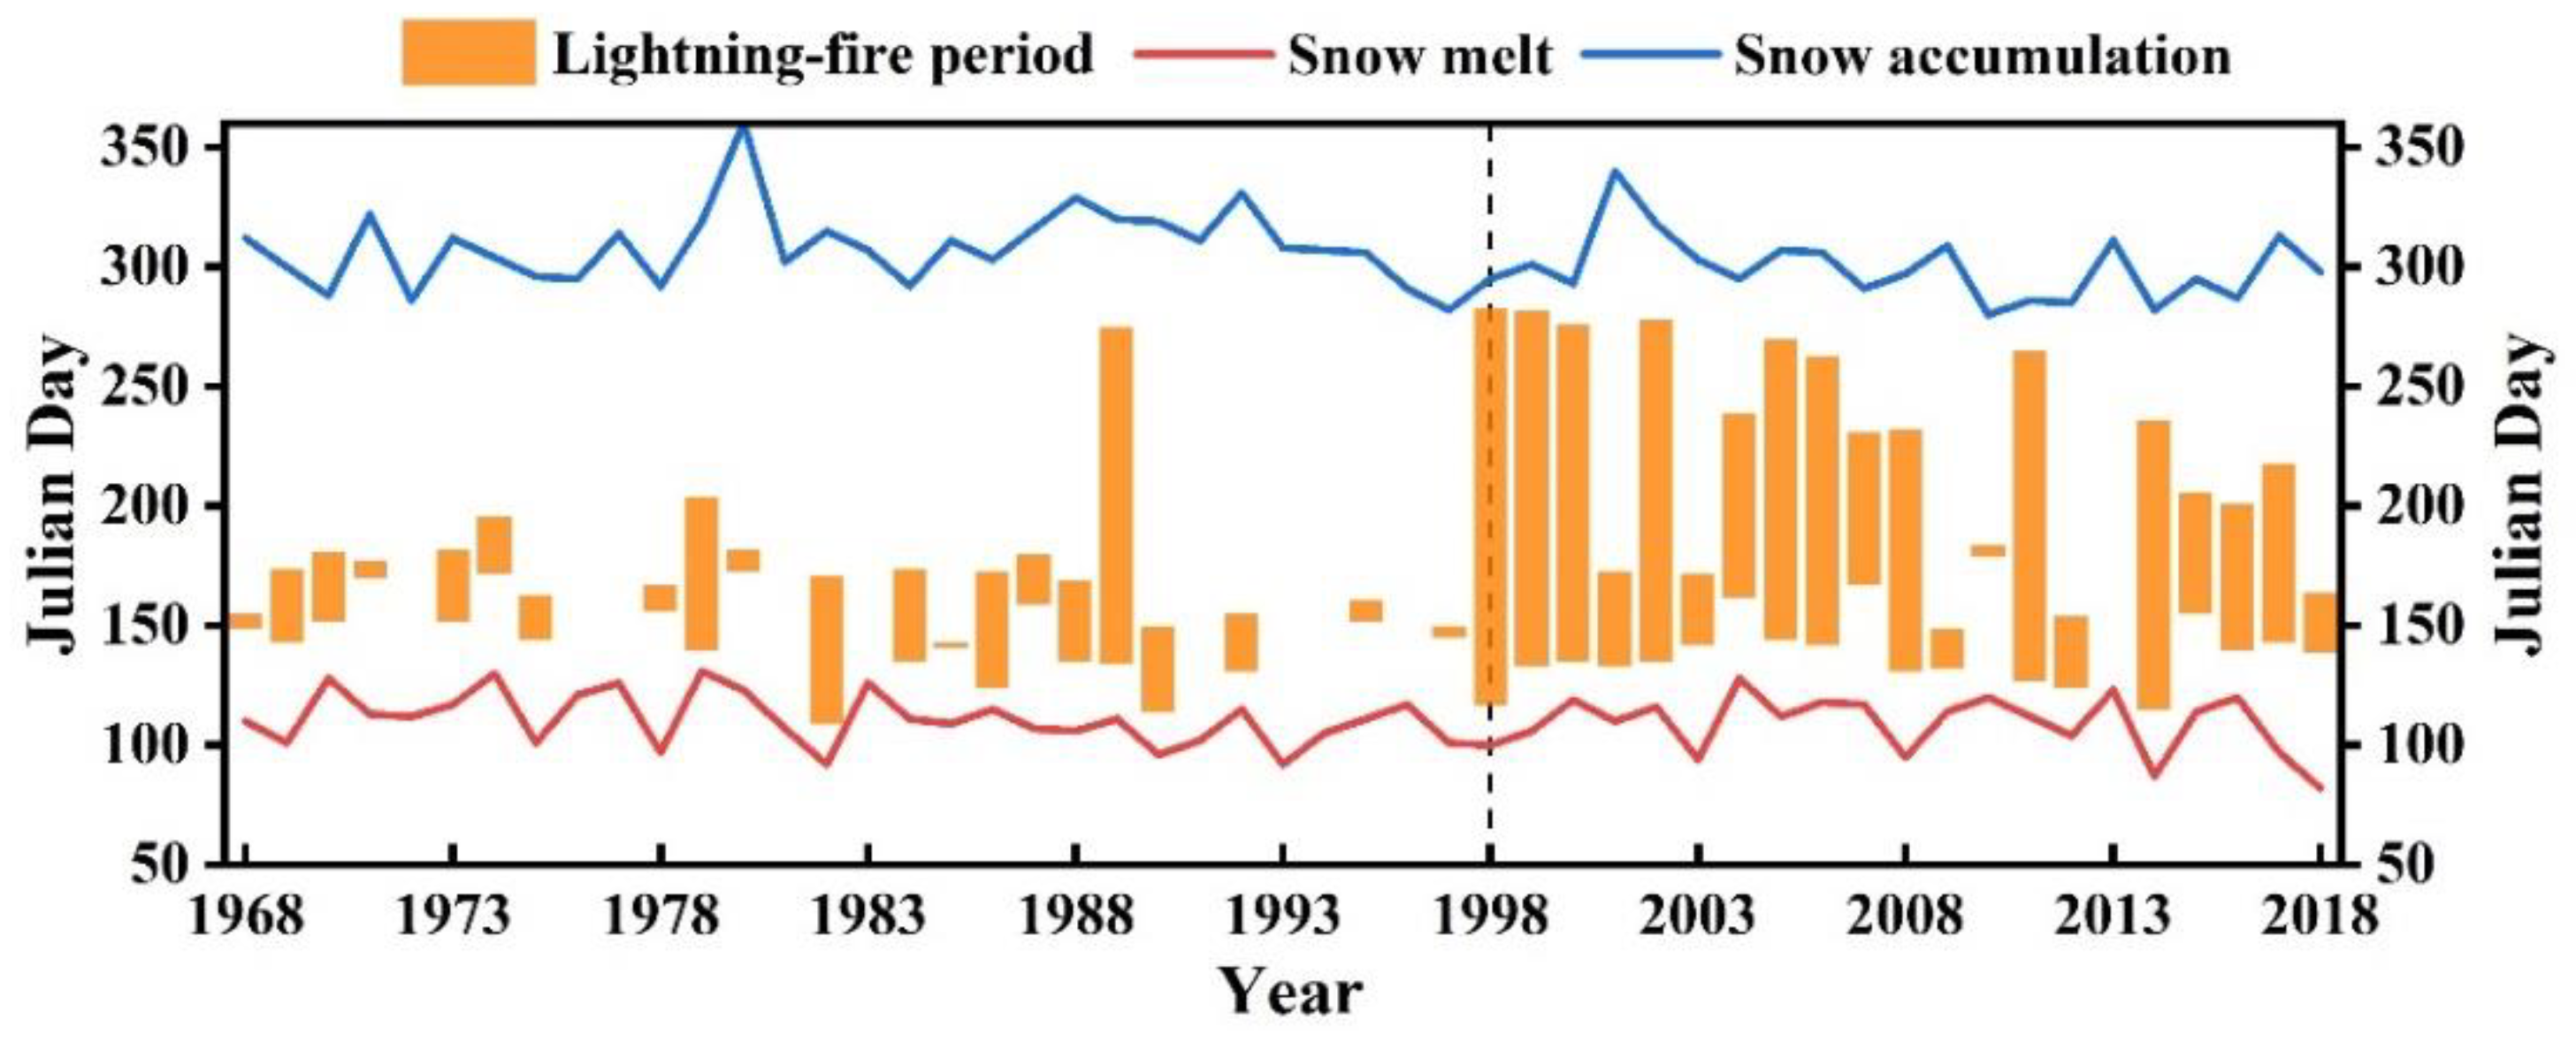
The quantile–quantile plot for the burned area data exhibited the same distribution probability before and after 1998 (Figure A1). Lightning fires occurred only in the snow-free period, with snowmelt and snow accumulation within the intervals of 82–131 and 280–360 Julian days (Figure 3). The snowmelt date changed very little (p = 0.52, Julian days 111.1 and 109.0 for 1968–1997 and 1998–2018, respectively). Correspondingly, the mean lightning fire start dates were similar across 1968–1997 and 1998–2018 (p = 0.34, Julian days 146.4 and 141.6). The mean fire end date was significantly extended into the snowless season since 1998 (p < 0.001, Julian days 170.5 and 221.6); accordingly, the mean length of the lightning fire season significantly increased from 22 days in the former period to 80 days (p < 0.001) in the latter period.
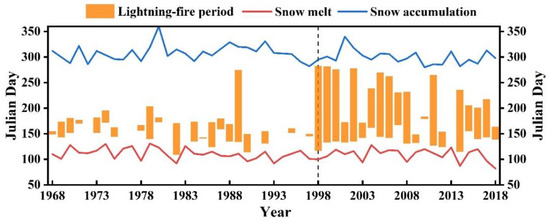
Figure 3.
Julian days of lightning fire occurrence, snowmelt, snow accumulation, and length of the lightning fire season.
3.3. Lightning Fire Frequency and Climate Variability
The correlation coefficients of the climate parameters and lightning fire frequency within the early, late, and whole fire seasons were presented in Figure 4. Temp, Tmax, and Eva were significantly and positively correlated with lightning fire frequency in all fire seasons (MJ, JAS, and MJJAS); Prec, SPEI, and SM were significantly and negatively correlated with lightning fire occurrence (Figure 4).
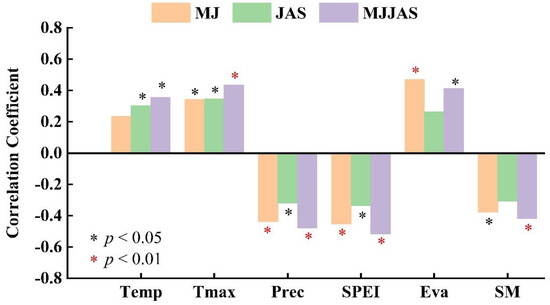
Figure 4.
Correlation coefficients of the annual climate parameters and lightning fire frequency in MJ, JAS, and MJJAS. The black and red asterisks indicate significance at levels above 95% and 99%, respectively.
Linear trend analyses showed that the mean and maximum temperatures in MJ, JAS, and MJJAS all increased significantly (Figure 5a,b). The moisture trends of MJ and JAS were the opposite: although statistically insignificant, both Prec and SPEI increased for MJ (p = 0.13 and p = 0.47, respectively) and decreased for JAS (p = 0.64 and p = 0.47, respectively; Figure 5c,d). In association with the significant warming trends, a significant increase in Eva was observed in JAS (Figure 5e, p < 0.01), and the surface SM significantly decreased as well (Figure 5f, p < 0.05).
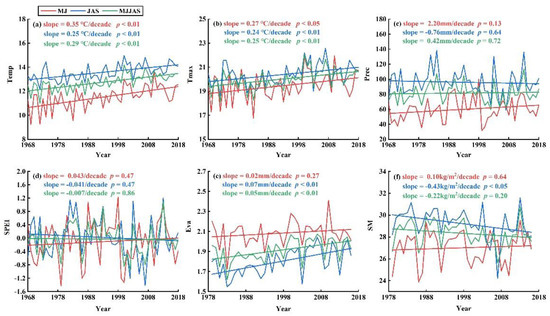
Figure 5.
The linear trends of climate parameters from 1968–2018: (a) mean temperature, (b) maximum temperature, (c) precipitation, (d) the one-month standardized precipitation evapotranspiration index, (e) evapotranspiration, and (f) soil moisture.
4. Discussion
4.1. Fire Season Expansion
The existence of snow cover naturally prohibits wildfire occurrence. Climate warming has increased drought severity and snow-free days in early spring and late autumn [38,39], both of which favor symmetric fire season expansion towards the beginning and end of the fire season [13,40]. However, we observed an asymmetric extension in the Greater Khingan forest: the lightning fires did not advance in spring but significantly expanded from July–September.
The Greater Khingan forest is located above the permafrost of Northeast China [41,42], where the warming-associated acceleration of snow melting and surface-thawing water tends to be maintained in shallow soil [43]. The mean April snow cover remained at a high level of 45.1% during 1968–2018 (Figure 1b), and the snowmelt date changed little (Figure 3); both phenomena prevented the fire from advancing into early spring. Snow coverage was less than 10% between September and October, as presented in Figure 1. The fire-inhibiting effect of snow is assumed to be negligible in the late fire season of JAS; however, soil moisture has been significantly decreasing (Figure 5f) during this time, mainly due to increased evapotranspiration (Figure 5e) in association with rapid warming (Figure 5a,b). All these features could be responsible for the increased fuel dryness, enhanced lightning fire occurrence and an extended fire season.
4.2. Fire Frequency and Climate Variability
A warmer climate increases fuel dryness [44], leading to more frequent fire occurrences, larger burn areas [45,46] and extreme wildfire episodes [47]. The significant positive correlations of JAS fire frequency with temperature, drought severity (SPEI) and SM were consistent with this observation (Figure 4). The significant warming and increase in evapotranspiration (p < 0.01, Figure 5a,b,e) led to increased soil and air dryness (Figure 5f) and, therefore, a significantly increased lightning fire occurrence in JAS (Figure 2b). In contrast, the trends of MJ SM and Eva were insignificant (Figure 5e,f), which was consistent with the observed insignificant change in fire frequency (Figure 2a).
4.3. Comparisons with Previous Studies
Hu et al. [17] reported that lightning fires advanced from 1967 to 2006 in the Greater Khingan Mountains. Using the updated fire record from 1968 to 2018, we found that the trend was insignificant, and that the data highlighted the significant extension of lightning fires into summer and fall since the late 1990s. These results are consistent with the satellite-derived total fire (i.e., both lightning and human-caused fire) seasonality changes within 1980–2005 [32]. The connections of total fire frequency and severity with temperature and precipitation [32,33] and fuel moisture conditions [34,35] have been widely reported. Lightning fires are highly sensitive to climatic changes [17]. However, the mechanisms underlying the changes in lightning fire seasonality have seldom been explored. In this study, we interpreted the seasonality of lightning fires in Northeast China’s boreal forests in terms of snow cover and linked the prolonged fire period to a warming and drying climate trend in JAS.
5. Conclusions
Lightning fires have caused great damage to forest resources, human lives, and properties in the Greater Khingan forest. Using fire data spanning 1968–2018, we found an asymmetric expansion of the lightning fire season in boreal forests of Northeast China. Since the late 1990s, lightning fires have not advanced into the early fire season (May–June) but have largely extended into the snowless late fire season (July–September). Despite significant warming, there has been only a slight change in Julian days of snowmelt, which has prevented lightning fires from advancing into early spring. The expansion of lightning fires into the snow-free July–September period is attributed to a warming-induced significant increase in evapotranspiration and a decrease in soil/fuel moisture.
Therefore, forest administration should be fully aware of the increasing prevalence and hazards of lightning fires in summer and autumn, especially in the context of persistent warming. Special fire precaution strategies must be adopted to cope with the observed extension of the lightning fire season into the late fire season (July–September), and response plans to minimize the damage should be implemented. How to prevent and monitor lightning fires in summer and autumn will be a key direction of future research.
Author Contributions
Conceptualization, C.S.; methodology, C.G. and C.S.; software, C.G.; validation, R.A., W.W. and C.S.; formal analysis, C.G. and C.S.; investigation, C.G.; resources, C.S.; data curation, K.L.; writing—original draft preparation, C.G. and C.S.; writing—review and editing, C.G., R.A., W.W., C.S., M.W., X.W. and G.W.; visualization, C.G.; supervision, C.S. and L.S.; project administration, C.S.; funding acquisition, C.S. and L.S. All authors have read and agreed to the published version of the manuscript.
Funding
This study was supported by the National Natural Science Foundation of China (31971667) and the Central Public-interest Scientific Institution Basal Research Fund (CAFYBB2021ZB001).
Data Availability Statement
The fire data presented in this study are available on request from the corresponding author. The monthly mean temperature (Temp), maximum temperature (Tmax), and precipitation (Prec) data were obtained from the Climatic Research Unit (http://www.cru.uea.ac.uk/data (accessed on 9 September 2020). The monthly and daily snow cover data were extracted from the Rutgers University Global Snow Lab database (http://climate.rutgers.edu/snowcover/ (accessed on 9 September 2020), the standardized precipitation evapotranspiration index (SPEI) data were obtained from the Spanish National Research Council (https://spei.csic.es/ (accessed on 9 September 2020), and the soil moisture (SM) and evapotranspiration (Eva) data were compiled from the Common Land Model ERA-Interim dataset (https://www.ecmwf.int/en/forecasts/datasets/reanalysis-datasets/era-interim (accessed on 9 September 2020).
Acknowledgments
The authors would like to acknowledge the National Natural Science Foundation of China (31971667) and the Central Public-interest Scientific Institution Basal Research Fund (CAFYBB2021ZB001) for their financial support as part of the statutory work.
Conflicts of Interest
The authors declare no conflict of interest.
Appendix A

Table A1.
Information on the data sources, download dates and source websites.
Table A1.
Information on the data sources, download dates and source websites.
| Parameter | Source | Website |
|---|---|---|
| Mean temperature | Climatic Research Unit Timeseries 4.03 dataset | www.cru.uea.ac.uk/data (accessed on 9 September 2020) |
| Maximum temperature | Climatic Research Unit Timeseries 4.03 dataset | www.cru.uea.ac.uk/data (accessed on 9 September 2020) |
| Precipitation | Climatic Research Unit Timeseries 4.03 dataset | www.cru.uea.ac.uk/data (accessed on 9 September 2020) |
| Standardized precipitation evapotranspiration index | Spanish National Research Council | spei.csic.es (accessed on 9 September 2020) |
| Evapotranspiration | Common Land Model ERA-Interim dataset | www.ecmwf.int/en/forecasts/datasets/reanalysis-datasets/era-interim (accessed on 9 September 2020) |
| Soil moisture | Common Land Model ERA-Interim dataset | www.ecmwf.int/en/forecasts/datasets/reanalysis-datasets/era-interim (accessed on 9 September 2020) |
| Snow cover | Rutgers University Global Snow Lab database | climate.rutgers.edu/snowcover (accessed on 9 September 2020) |
Table A2.
First-order autocorrelation coefficients of climate parameters from 1968–2018. Single and double asterisks indicate significance at the 95% and 99% levels, respectively.
Table A2.
First-order autocorrelation coefficients of climate parameters from 1968–2018. Single and double asterisks indicate significance at the 95% and 99% levels, respectively.
| Temp | Tmax | Prec | SPEI | Eva | SM | |
|---|---|---|---|---|---|---|
| MJ | 0.53 ** | 0.33 * | 0.21 | 0.12 | 0.18 | 0.08 |
| JAS | 0.56 ** | 0.39 ** | −0.08 | −0.12 | 0.58 ** | −0.35 * |
| MJJAS | 0.65 ** | 0.44 ** | 0.04 | −0.02 | 0.50 ** | −0.22 |
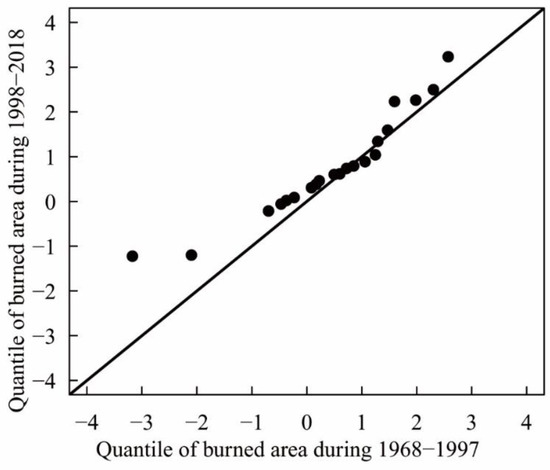
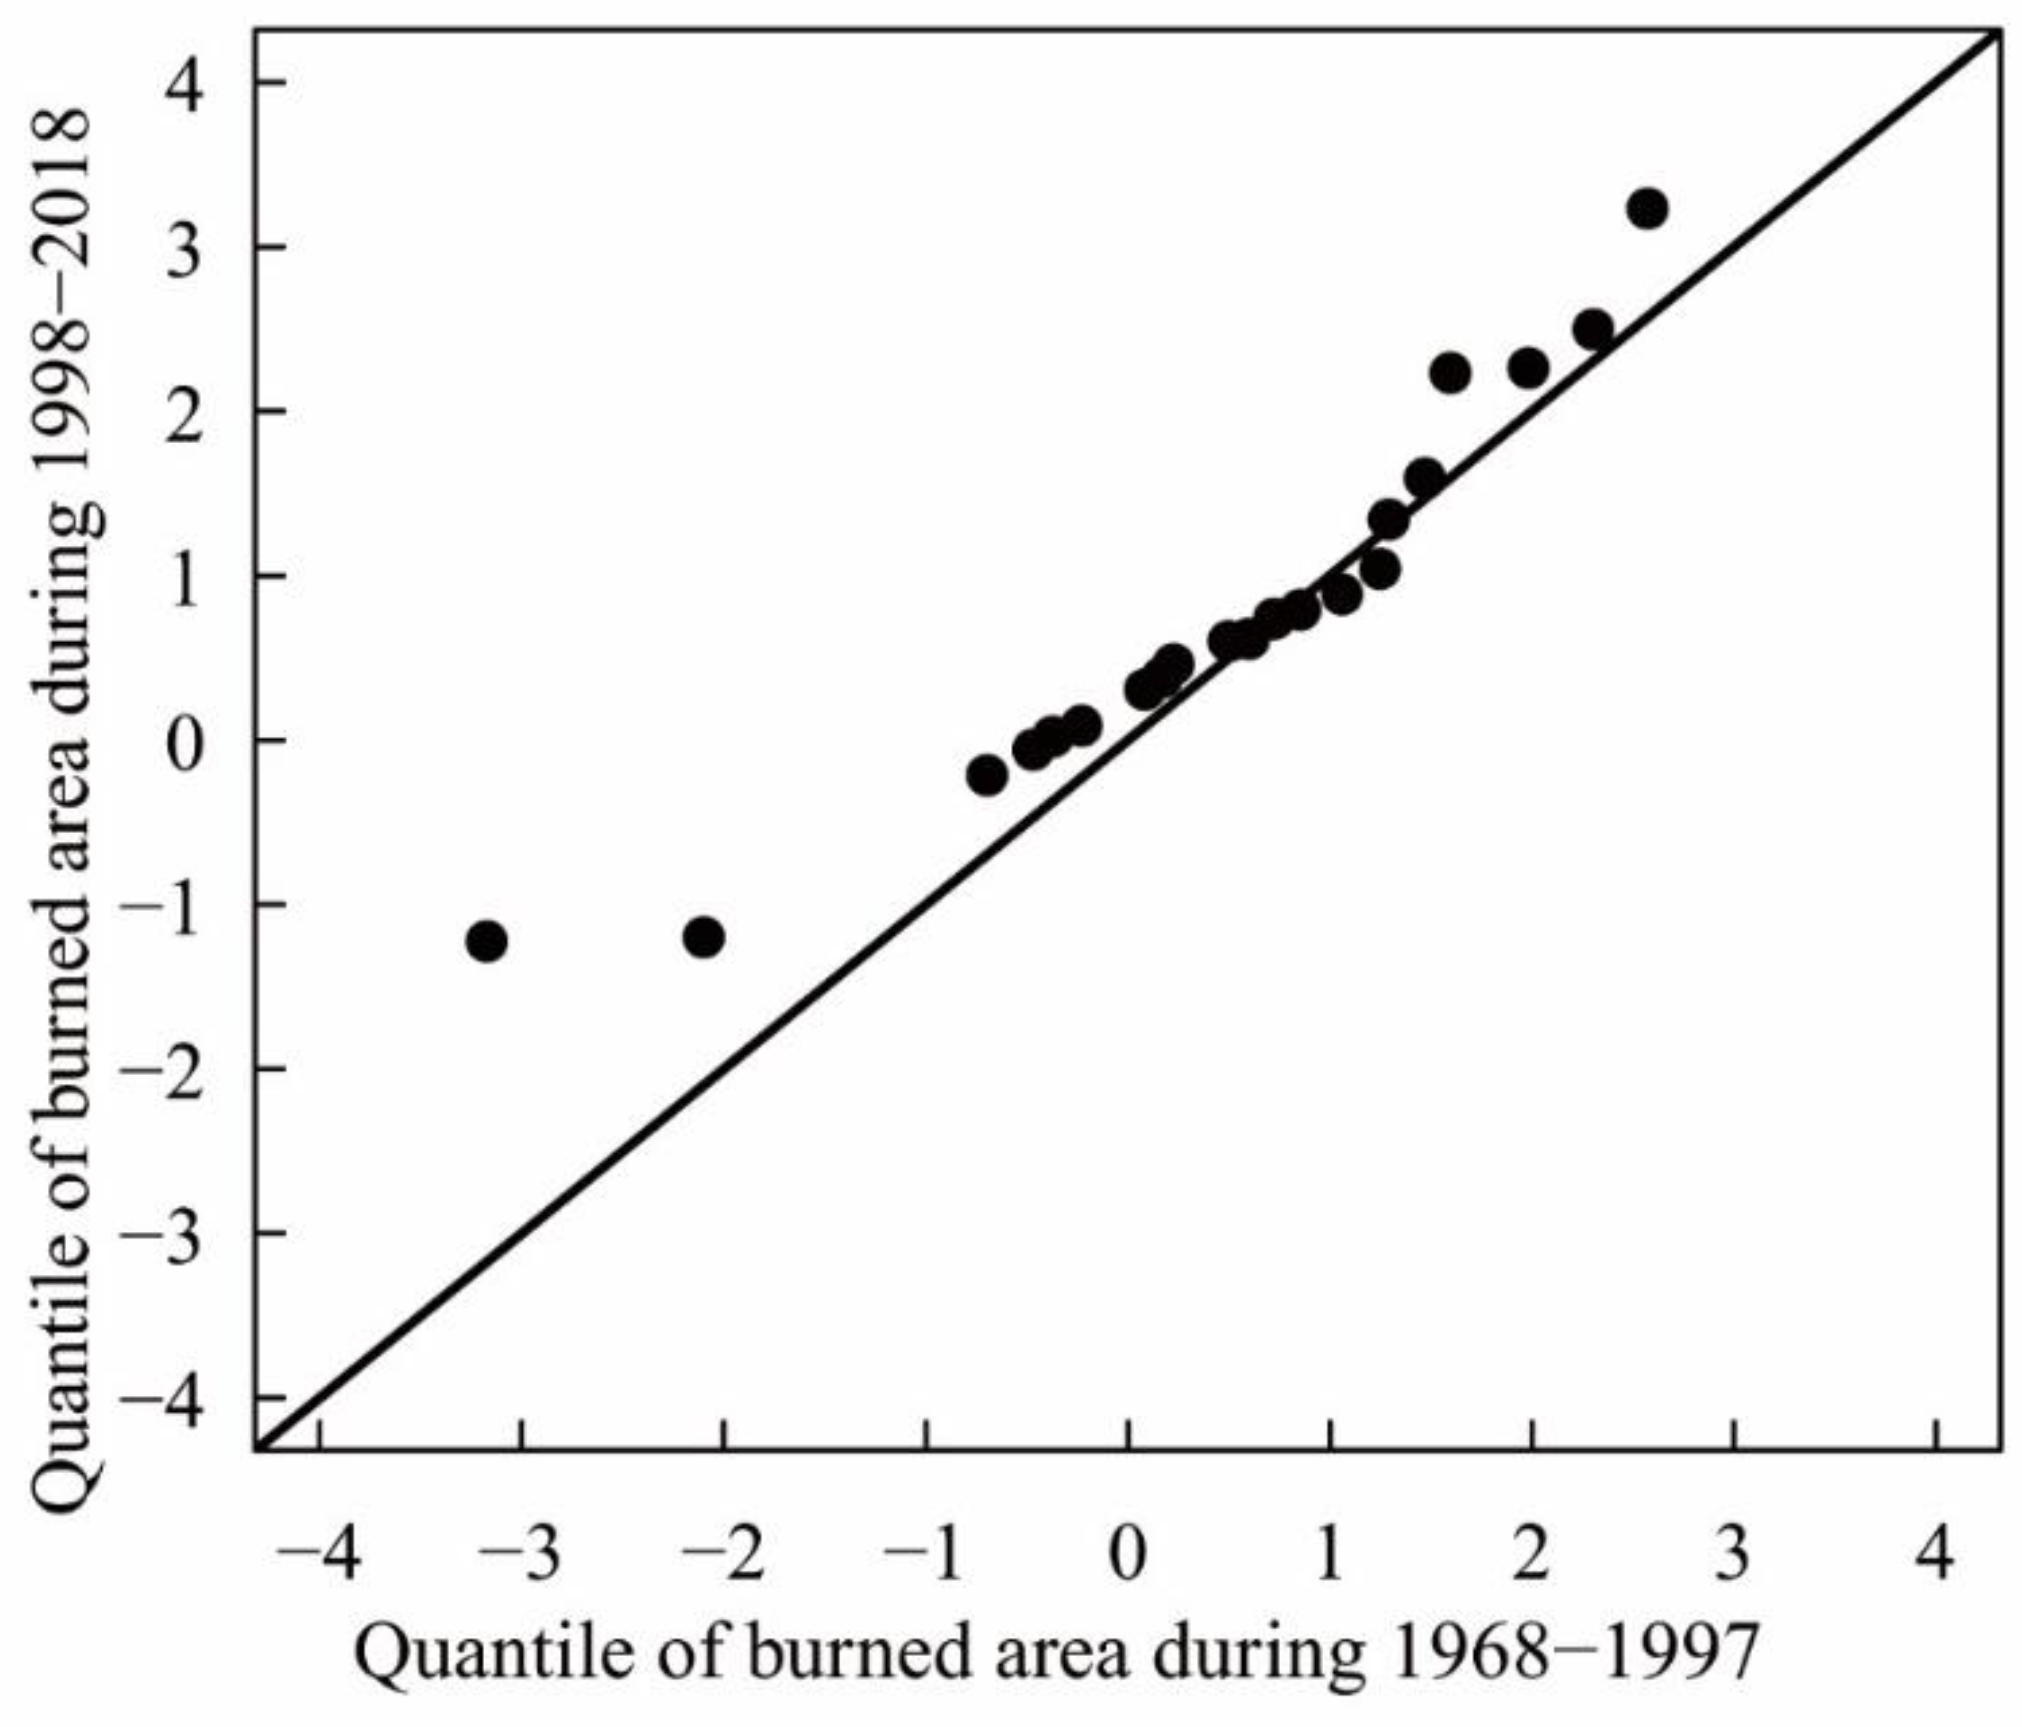
Figure A1.
Quantile–quantile plot of burned area during 1968–1997 and 1998–2018. The x-axis presents the quantiles of logarithm-transformed burned area for 1998–2018, and the y-axis presents the corresponding values with the same distribution of quantiles of the 1998–2018 data but within the distribution probability of the 1968–1997 data.
References
- Cary, G.J.; Keane, R.E.; Gardner, R.H.; Lavorel, S.; Flannigan, M.D.; Davies, I.D.; Li, C.; Lenihan, J.M.; Rupp, T.S.; Mouillot, F. Comparison of the Sensitivity of Landscape-fire-succession Models to Variation in Terrain, Fuel Pattern, Climate and Weather. Landsc. Ecol. 2006, 21, 121–137. [Google Scholar] [CrossRef]
- Flannigan, M.D.; Krawchuk, M.A.; De Groot, W.J.; Wotton, B.M.; Gowman, L.M. Implications of changing climate for global wildland fire. Int. J. Wildland Fire 2009, 18, 483–507. [Google Scholar] [CrossRef]
- Flannigan, M.; Cantin, A.S.; de Groot, W.J.; Wotton, M.; Newbery, A.; Gowman, L.M. Global wildland fire season severity in the 21st century. For. Ecol. Manag. 2013, 294, 54–61. [Google Scholar] [CrossRef]
- Boer, M.M.; De Dios, V.R.; Bradstock, R.A. Unprecedented burn area of Australian mega forest fires. Nat. Clim. Chang. 2020, 10, 171–172. [Google Scholar] [CrossRef]
- Bowman, D.M.J.S.; Balch, J.K.; Artaxo, P.; Bond, W.J.; Carlson, J.M.; Cochrane, M.A.; D’Antonio, C.M.; DeFries, R.S.; Doyle, J.C.; Harrison, S.P.; et al. Fire in the Earth System. Science 2009, 324, 481–484. [Google Scholar] [CrossRef] [PubMed]
- Brando, P.M.; Balch, J.K.; Nepstad, D.C.; Morton, D.C.; Putz, F.E.; Coe, M.; Silvério, D.; Macedo, M.N.; Davidson, E.; Nóbrega, C.C.; et al. Abrupt increases in Amazonian tree mortality due to drought-fire interactions. Proc. Natl. Acad. Sci. USA 2014, 111, 6347–6352. [Google Scholar] [CrossRef] [PubMed] [Green Version]
- Dennison, P.E.; Brewer, S.; Arnold, J.D.; Moritz, M.A. Large wildfire trends in the western United States, 1984–2011. Geophys. Res. Lett. 2014, 41, 2928–2933. [Google Scholar] [CrossRef]
- San-Miguel-Ayanz, J.; Moreno, J.M.; Camia, A. Analysis of large fires in European Mediterranean landscapes: Lessons learned and perspectives. For. Ecol. Manag. 2013, 294, 11–22. [Google Scholar] [CrossRef]
- Kasischke, E.S.; Christensen, N.L.; Stocks, B.J. Fire, Global Warming, and the Carbon Balance of Boreal Forests. Ecol. Appl. 1995, 5, 437–451. [Google Scholar] [CrossRef]
- Walker, X.J.; Baltzer, J.L.; Cumming, S.G.; Day, N.; Ebert, C.; Goetz, S.; Johnstone, J.; Potter, S.; Rogers, B.M.; Schuur, E.A.G.; et al. Increasing wildfires threaten historic carbon sink of boreal forest soils. Nature 2019, 572, 520–523. [Google Scholar] [CrossRef]
- van der Werf, G.R.; Randerson, J.T.; Giglio, L.; Collatz, G.J.; Mu, M.; Kasibhatla, P.S.; Morton, D.C.; DeFries, R.S.; Jin, Y.; van Leeuwen, T.T. Global fire emissions and the contribution of deforestation, savanna, forest, agricultural, and peat fires (1997–2009). Atmos. Chem. Phys. 2010, 10, 11707–11735. [Google Scholar] [CrossRef] [Green Version]
- Post, E.; Steinman, B.A.; Mann, M. Acceleration of phenological advance and warming with latitude over the past century. Sci. Rep. 2018, 8, 1–8. [Google Scholar] [CrossRef]
- Cattau, M.E.; Wessman, C.; Mahood, A.; Balch, J.K. Anthropogenic and lightning-started fires are becoming larger and more frequent over a longer season length in the U.S.A. Glob. Ecol. Biogeogr. 2020, 29, 668–681. [Google Scholar] [CrossRef]
- Dai, A. Drought under global warming: A review. Wiley Interdiscip. Rev. Clim. Chang. 2011, 2, 45–65. [Google Scholar] [CrossRef] [Green Version]
- Lindner, M.; Maroschek, M.; Netherer, S.; Kremer, A.; Barbati, A.; Garcia-Gonzalo, J.; Seidl, R.; Delzon, S.; Corona, P.; Kolström, M.; et al. Climate change impacts, adaptive capacity, and vulnerability of European forest ecosystems. For. Ecol. Manag. 2010, 259, 698–709. [Google Scholar] [CrossRef]
- Peng, C.; Ma, Z.; Lei, X.; Zhu, Q.; Chen, H.; Wang, W.; Liu, S.; Li, W.; Fang, X.; Zhou, X. A drought-induced pervasive increase in tree mortality across Canada’s boreal forests. Nat. Clim. Chang. 2011, 1, 467–471. [Google Scholar] [CrossRef]
- Hu, T.; Zhou, G. Drivers of lightning- and human-caused fire regimes in the Great Xing’an Mountains. For. Ecol. Manag. 2014, 329, 49–58. [Google Scholar] [CrossRef]
- Nash, C.; Johnson, E. Synoptic climatology of lightning-caused forest fires in subalpine and boreal forests. Can. J. For. Res. 1996, 26, 1859–1874. [Google Scholar] [CrossRef]
- Veraverbeke, S.; Rogers, B.M.; Goulden, M.L.; Jandt, R.; Miller, C.E.; Wiggins, E.B.; Randerson, J.T. Lightning as a major driver of recent large fire years in North American boreal forests. Nat. Clim. Chang. 2017, 7, 529–534. [Google Scholar] [CrossRef]
- Hanes, C.; Wang, X.; Jain, P.; Parisien, M.-A.; Little, J.M.; Flannigan, M.D. Fire-regime changes in Canada over the last half century. Can. J. For. Res. 2019, 49, 256–269. [Google Scholar] [CrossRef]
- Kharuk, V.I.; Dvinskaya, M.L.; Petrov, I.A.; Im, S.T.; Ranson, K.J. Larch Forests of Middle Siberia: Long-Term Trends in Fire Return Intervals. Reg. Environ. Chang. 2016, 16, 2389–2397. [Google Scholar] [CrossRef] [PubMed] [Green Version]
- Young, A.; Higuera, P.E.; Duffy, P.A.; Hu, F.S. Climatic thresholds shape northern high-latitude fire regimes and imply vulnerability to future climate change. Ecography 2016, 40, 606–617. [Google Scholar] [CrossRef]
- Moriondo, M.; Good, P.; Durão, R.; Bindi, M.; Giannakopoulos, C.; Corte-Real, J.A.M. Potential impact of climate change on fire risk in the Mediterranean area. Clim. Res. 2006, 31, 85–95. [Google Scholar] [CrossRef]
- Nitschke, C.R.; Innes, J. Climatic change and fire potential in South-Central British Columbia, Canada. Glob. Chang. Biol. 2007, 14, 841–855. [Google Scholar] [CrossRef]
- Tian, X.-R.; Zhao, F.-J.; Shu, L.-F.; Wang, M.-Y. Changes in forest fire danger for south-western China in the 21st century. Int. J. Wildland Fire 2014, 23, 185–195. [Google Scholar] [CrossRef]
- Jolly, W.M.; Cochrane, M.A.; Freeborn, P.H.; Holden, Z.A.; Brown, T.J.; Williamson, G.J.; Bowman, D.M.J.S. Climate-induced variations in global wildfire danger from 1979 to 2013. Nat. Commun. 2015, 6, 7537. [Google Scholar] [CrossRef] [PubMed]
- Anderson, K. A model to predict lightning-caused fire occurrences. Int. J. Wildland Fire 2002, 11, 163. [Google Scholar] [CrossRef]
- Wotton, B.M.; Martell, D.L.; Logan, K.A. Climate Change and People-Caused Forest Fire Occurrence in Ontario. Clim. Chang. 2003, 60, 275–295. [Google Scholar] [CrossRef]
- Westerling, A.L.; Hidalgo, H.G.; Cayan, D.R.; Swetnam, T.W. Warming and Earlier Spring Increase Western U.S. Forest Wildfire Activity. Science 2006, 313, 940–943. [Google Scholar] [CrossRef] [Green Version]
- Westerling, A.L. Increasing western US forest wildfire activity: Sensitivity to changes in the timing of spring. Philos. Trans. R. Soc. B Biol. Sci. 2016, 371, 20150178. [Google Scholar] [CrossRef]
- Zhao, F.; Liu, Y.; Shu, L. Change in the fire season pattern from bimodal to unimodal under climate change: The case of Daxing’anling in Northeast China. Agric. For. Meteorol. 2020, 291, 108075. [Google Scholar] [CrossRef]
- Fan, Q.; Wang, C.; Zhang, D.; Zang, S. Environmental Influences on Forest Fire Regime in the Greater Hinggan Mountains, Northeast China. Forests 2017, 8, 372. [Google Scholar] [CrossRef] [Green Version]
- Liu, Z.; Yang, J.; Chang, Y.; Weisberg, P.J.; He, H.S. Spatial patterns and drivers of fire occurrence and its future trend under climate change in a boreal forest of Northeast China. Glob. Chang. Biol. 2012, 18, 2041–2056. [Google Scholar] [CrossRef]
- Wu, Z.; He, H.S.; Fang, L.; Liang, Y.; Parsons, R.A. Wind speed and relative humidity influence spatial patterns of burn severity in boreal forests of northeastern China. Ann. For. Sci. 2018, 75, 66. [Google Scholar] [CrossRef] [Green Version]
- Ying, L.; Han, J.; Du, Y.; Shen, Z. Forest fire characteristics in China: Spatial patterns and determinants with thresholds. For. Ecol. Manag. 2018, 424, 345–354. [Google Scholar] [CrossRef]
- Hatcher, D.A. Simple formulas for Julian day numbers and calendar dates. Q. J. R. Astron. Soc. 1984, 25, 53–55. [Google Scholar]
- Gao, C.; Zhao, F.; Shi, C.; Liu, K.; Wu, X.; Wu, G.; Liang, Y.; Shu, L. Previous Atlantic Multidecadal Oscillation (AMO) modulates the lightning-ignited fire regime in the boreal forest of Northeast China. Environ. Res. Lett. 2021, 16, 024054. [Google Scholar] [CrossRef]
- Balch, J.K.; Bradley, B.A.; Abatzoglou, J.T.; Nagy, R.C.; Fusco, E.J.; Mahood, A. Human-started wildfires expand the fire niche across the United States. Proc. Natl. Acad. Sci. USA 2017, 114, 2946–2951. [Google Scholar] [CrossRef] [PubMed] [Green Version]
- Williams, A.P.; Abatzoglou, J.T.; Gershunov, A.; Guzman-Morales, J.; Bishop, D.A.; Balch, J.K.; Lettenmaier, D.P. Observed Impacts of Anthropogenic Climate Change on Wildfire in California. Earth’s Futur. 2019, 7, 892–910. [Google Scholar] [CrossRef] [Green Version]
- Dupuy, J.-L.; Fargeon, H.; Martin-StPaul, N.; Pimont, F.; Ruffault, J.; Guijarro, M.; Hernando, C.; Madrigal, J.; Fernandes, P. Climate change impact on future wildfire danger and activity in southern Europe: A review. Ann. For. Sci. 2020, 77, 1–24. [Google Scholar] [CrossRef]
- Cong, J.; Gao, C.; Han, D.; Li, Y.; Wang, G. Stability of the permafrost peatlands carbon pool under climate change and wildfires during the last 150 years in the northern Great Khingan Mountains, China. Sci. Total. Environ. 2020, 712, 136476. [Google Scholar] [CrossRef] [PubMed]
- Ran, Y.; Li, X.; Cheng, G.; Zhang, T.; Wu, Q.; Jin, H.; Jin, R. Distribution of Permafrost in China: An Overview of Existing Permafrost Maps. Permafr. Periglac. Process. 2012, 23, 322–333. [Google Scholar] [CrossRef]
- Musselman, K.N.; Clark, M.P.; Liu, C.; Ikeda, K.; Rasmussen, R. Slower snowmelt in a warmer world. Nat. Clim. Chang. 2017, 7, 214–219. [Google Scholar] [CrossRef]
- Turco, M.; Von Hardenberg, J.; AghaKouchak, A.; Llasat, M.C.; Provenzale, A.; Trigo, R. On the key role of droughts in the dynamics of summer fires in Mediterranean Europe. Sci. Rep. 2017, 7, 1–10. [Google Scholar] [CrossRef] [PubMed] [Green Version]
- Gonzalez, M.; Gómez-González, S.; Lara, A.; Garreaud, R.; Díaz-Hormazábal, I. The 2010-2015 Megadrought and its influence on the fire regime in central and south-central Chile. Ecosphere 2018, 9, e02300. [Google Scholar] [CrossRef] [Green Version]
- Portier, J.; Gauthier, S.; LeDuc, A.; Arseneault, D.; Bergeron, Y. Fire Regime along Latitudinal Gradients of Continuous to Discontinuous Coniferous Boreal Forests in Eastern Canada. Forests 2016, 7, 211. [Google Scholar] [CrossRef] [Green Version]
- Ruffault, J.; Curt, T.; Martin-StPaul, N.K.; Moron, V.; Trigo, R. Extreme wildfire events are linked to global-change-type droughts in the northern Mediterranean. Nat. Hazards Earth Syst. Sci. 2018, 18, 847–856. [Google Scholar] [CrossRef] [Green Version]


Publisher’s Note: MDPI stays neutral with regard to jurisdictional claims in published maps and institutional affiliations. |
© 2021 by the authors. Licensee MDPI, Basel, Switzerland. This article is an open access article distributed under the terms and conditions of the Creative Commons Attribution (CC BY) license (https://creativecommons.org/licenses/by/4.0/).