Article

Response of Runoff to Extreme Land Use Change in the Permafrost Region of Northeastern China

1
School of Forestry, Northeast Forestry University, Harbin 150040, China
2
Key Laboratory of Sustainable Forest Ecosystem Management-Ministry of Education, Northeast Forestry University, Harbin 150040, China
3
College of Life Sciences, Northeast Forestry University, Harbin 150040, China
4
Academy of Forest Inventory and Planning, National Forestry and Grassland Administration, Beijing 100714, China
*
Authors to whom correspondence should be addressed.
Forests 2021, 12(8), 1021; https://doi.org/10.3390/f12081021
Submission received: 22 June 2021 / Revised: 18 July 2021 / Accepted: 27 July 2021 / Published: 31 July 2021
(This article belongs to the Special Issue Forest Hydrology: Processes, Assessment and Management)

Abstract

:
To study the response of runoff to extreme changes in land use, the Soil and Water Assessment Tool (SWAT) model was used to construct historical, extreme, and future scenarios for several major landscape types in a permafrost region of northeastern China. The results show that the SWAT model is applicable in the Tahe River Basin; forestlands, shrublands, wetlands, and grasslands are the main land-use types in this basin, and the transfers among them from 1980–2015 have impacted runoff by less than 5%. Under extreme land use-change scenarios, the simulated runoff decreased from grasslands, to wetlands, shrublands, and finally, forestlands. The conversion of extreme land-use scenarios produces different hydrological effects. When forestland is converted to grassland, runoff increases by 25.32%, when forestland is converted to wetland, runoff increases by 13.34%, and the conversion of shrubland to forestland reduces runoff by 13.25%. In addition, the sensitivity of runoff to different land-use changes was much greater during flood seasons than in dry seasons. Compared to the reference year of 2015, the annual simulated runoff under the two future land-use scenarios (shrublands to forestlands and shrublands to wetland) was less. Also, both future land-use scenarios showed effects to decrease flooding and increased dryness, This study provided important insight into the integrated management of land use and water resources in the Tahe River Basin and the permafrost region of northeastern China.

1. Introduction

Land use and cover change (LUCC) is not only the most obvious indicator of human activity and the transformation of nature, but it is also one of the main driving factors of regional and global ecological hydrology change. Its effects, combined with other environmental factors, directly or indirectly impact the hydrological cycle of the world’s basins [1]. Land-use changes have transformed the nature of the surfaces underlying watersheds, dramatically impacting the distribution of water resources both temporally and geographically, and causing a series of ecological and environmental problems [2,3,4]. Therefore, studying the hydrological effects of different land-use types in a basin is of great value for the rational use of water resources and sustainable development.
The different types of land use have diverse effects on evapotranspiration and the regulation of precipitation, thereby affecting the storage environments of water resources, surface runoff, groundwater resources, dry season fluvial runoff, and the characteristics of rivers [5,6]. At present, the research on hydrological effects of land-use types have increased globally, such as shown in the results of Nie [7], who found that urbanization was the main reason for increases in surface runoff. Ghaffari [8] found that the conversion of grasslands to cultivated and bare lands increased surface runoff. Zhou et al. [9] found that afforestation plays a positive role in redistributing water from the wet season to the dry season over the past 50 years in Guangdong province, China. With population growth and rapid economic development, LUCC also presents diverse and complex characteristics. The primary methods used to study these issues have gradually developed from early experimental watershed [10] and time-series analyses [11] to the current use of distributed hydrological models [12].
The Soil and Water Assessment Tool (SWAT, https://swat.tamu.edu (accessed on 15 September 2020)) is a long-term distributed hydrological model for large and medium-sized watersheds developed by United States Department of Agriculture (USDA) Agriculture Research Service [13]. Because it can flexibly adjust scenarios and analyze hydrological responses under different scenarios, it has been widely used to study hydrological responses to LUCC in watersheds. For example, Anand et al. [14] used the SWAT model to quantify the hydrological effects of LUCC in the Ganga River Basin, and analyzed the relationship between changes in surface runoff and major landscape types. Similarly, Liu et al. [15] analyzed land-use changes in the Taoer River Basin, and used the SWAT model to quantify the contribution coefficients of the main land-use types to runoff. Wang et al. [16] evaluated the impacts of land use on runoff over different years in the Xitiaoxi River Basin via the SWAT model, and found that increases in urban lands and decreases in grasslands reduced runoff.
Although previous studies provide reference values for understanding the impacts of LUCC on runoff in different regions, quantitative studies on such changes are relatively rare in alpine regions, especially those affected by permafrost. As an impermeable surface, the existence of permafrost can directly affect the migration, storage, and exchange of surface and groundwater, which requires the use of a special hydrological model that accounts for frozen soils [17]. Due to global warming, the relationship between LUCC and permafrost degradation will greatly impact ecohydrological processes in alpine regions [18]. For example, in the Liard River Basin of northwestern Canada, Connon et al. [19] noted that permafrost degradation led to the transformation of land-use types and their corresponding hydrological functions, thereby enhancing the connectivity of surface hydrological pathways and serving as the main drivers for increased runoff over the past few decades.
The impact of land-use change on runoff is the result of the combined effects of multiple land-use changes. However, it is difficult to quantitatively analyze the impact of main land-use types on runoff, because the land-use types in Da Hinggan Mountains have been slowly and irreversibly changing (e.g., forestland converting to wetland) over the past several decade [20,21]. Besides, permafrost degradation caused by global warming is bound to accelerate the transformation of land-use types [22], which is expected to affect river runoff in the southernmost distribution of permafrost in the Da Hinggan Mountains extending from the Arctic region of Eurasia [18].
In this study, the Tahe River Basin, a typical forest basin in the permafrost region of the Da Hinggan Mountains, was selected as the research object. In the past few decades, the forests of the Tahe River Basin experienced long-term timber logging (from the 1960s to the 1990s), and experienced a forest restoration period through a natural forest protection project in the late 1990s. At the same time, permafrost degradation caused by climate warming could also change the types of land use [23]. In order to quantify the effects of land-type transformations on streamflow, four main land-use scenarios were constructed by using an extreme land-use method, which transformed all land-use types in the basin into forestlands, shrublands, grasslands, or wetlands. Then, the response relationship between single land-use type and runoff was quantitatively analyzed. By devising various land-use scenarios, including historical, extreme, and future scenarios, the hydrological responses to the main land-use types in the basin were studied using the SWAT model. The results presented here can provide a scientific basis for the comprehensive management of forest and water resources in this unique region and provide new ideas and direction for the study of other areas with similar circumstances.

2. Materials and Methods
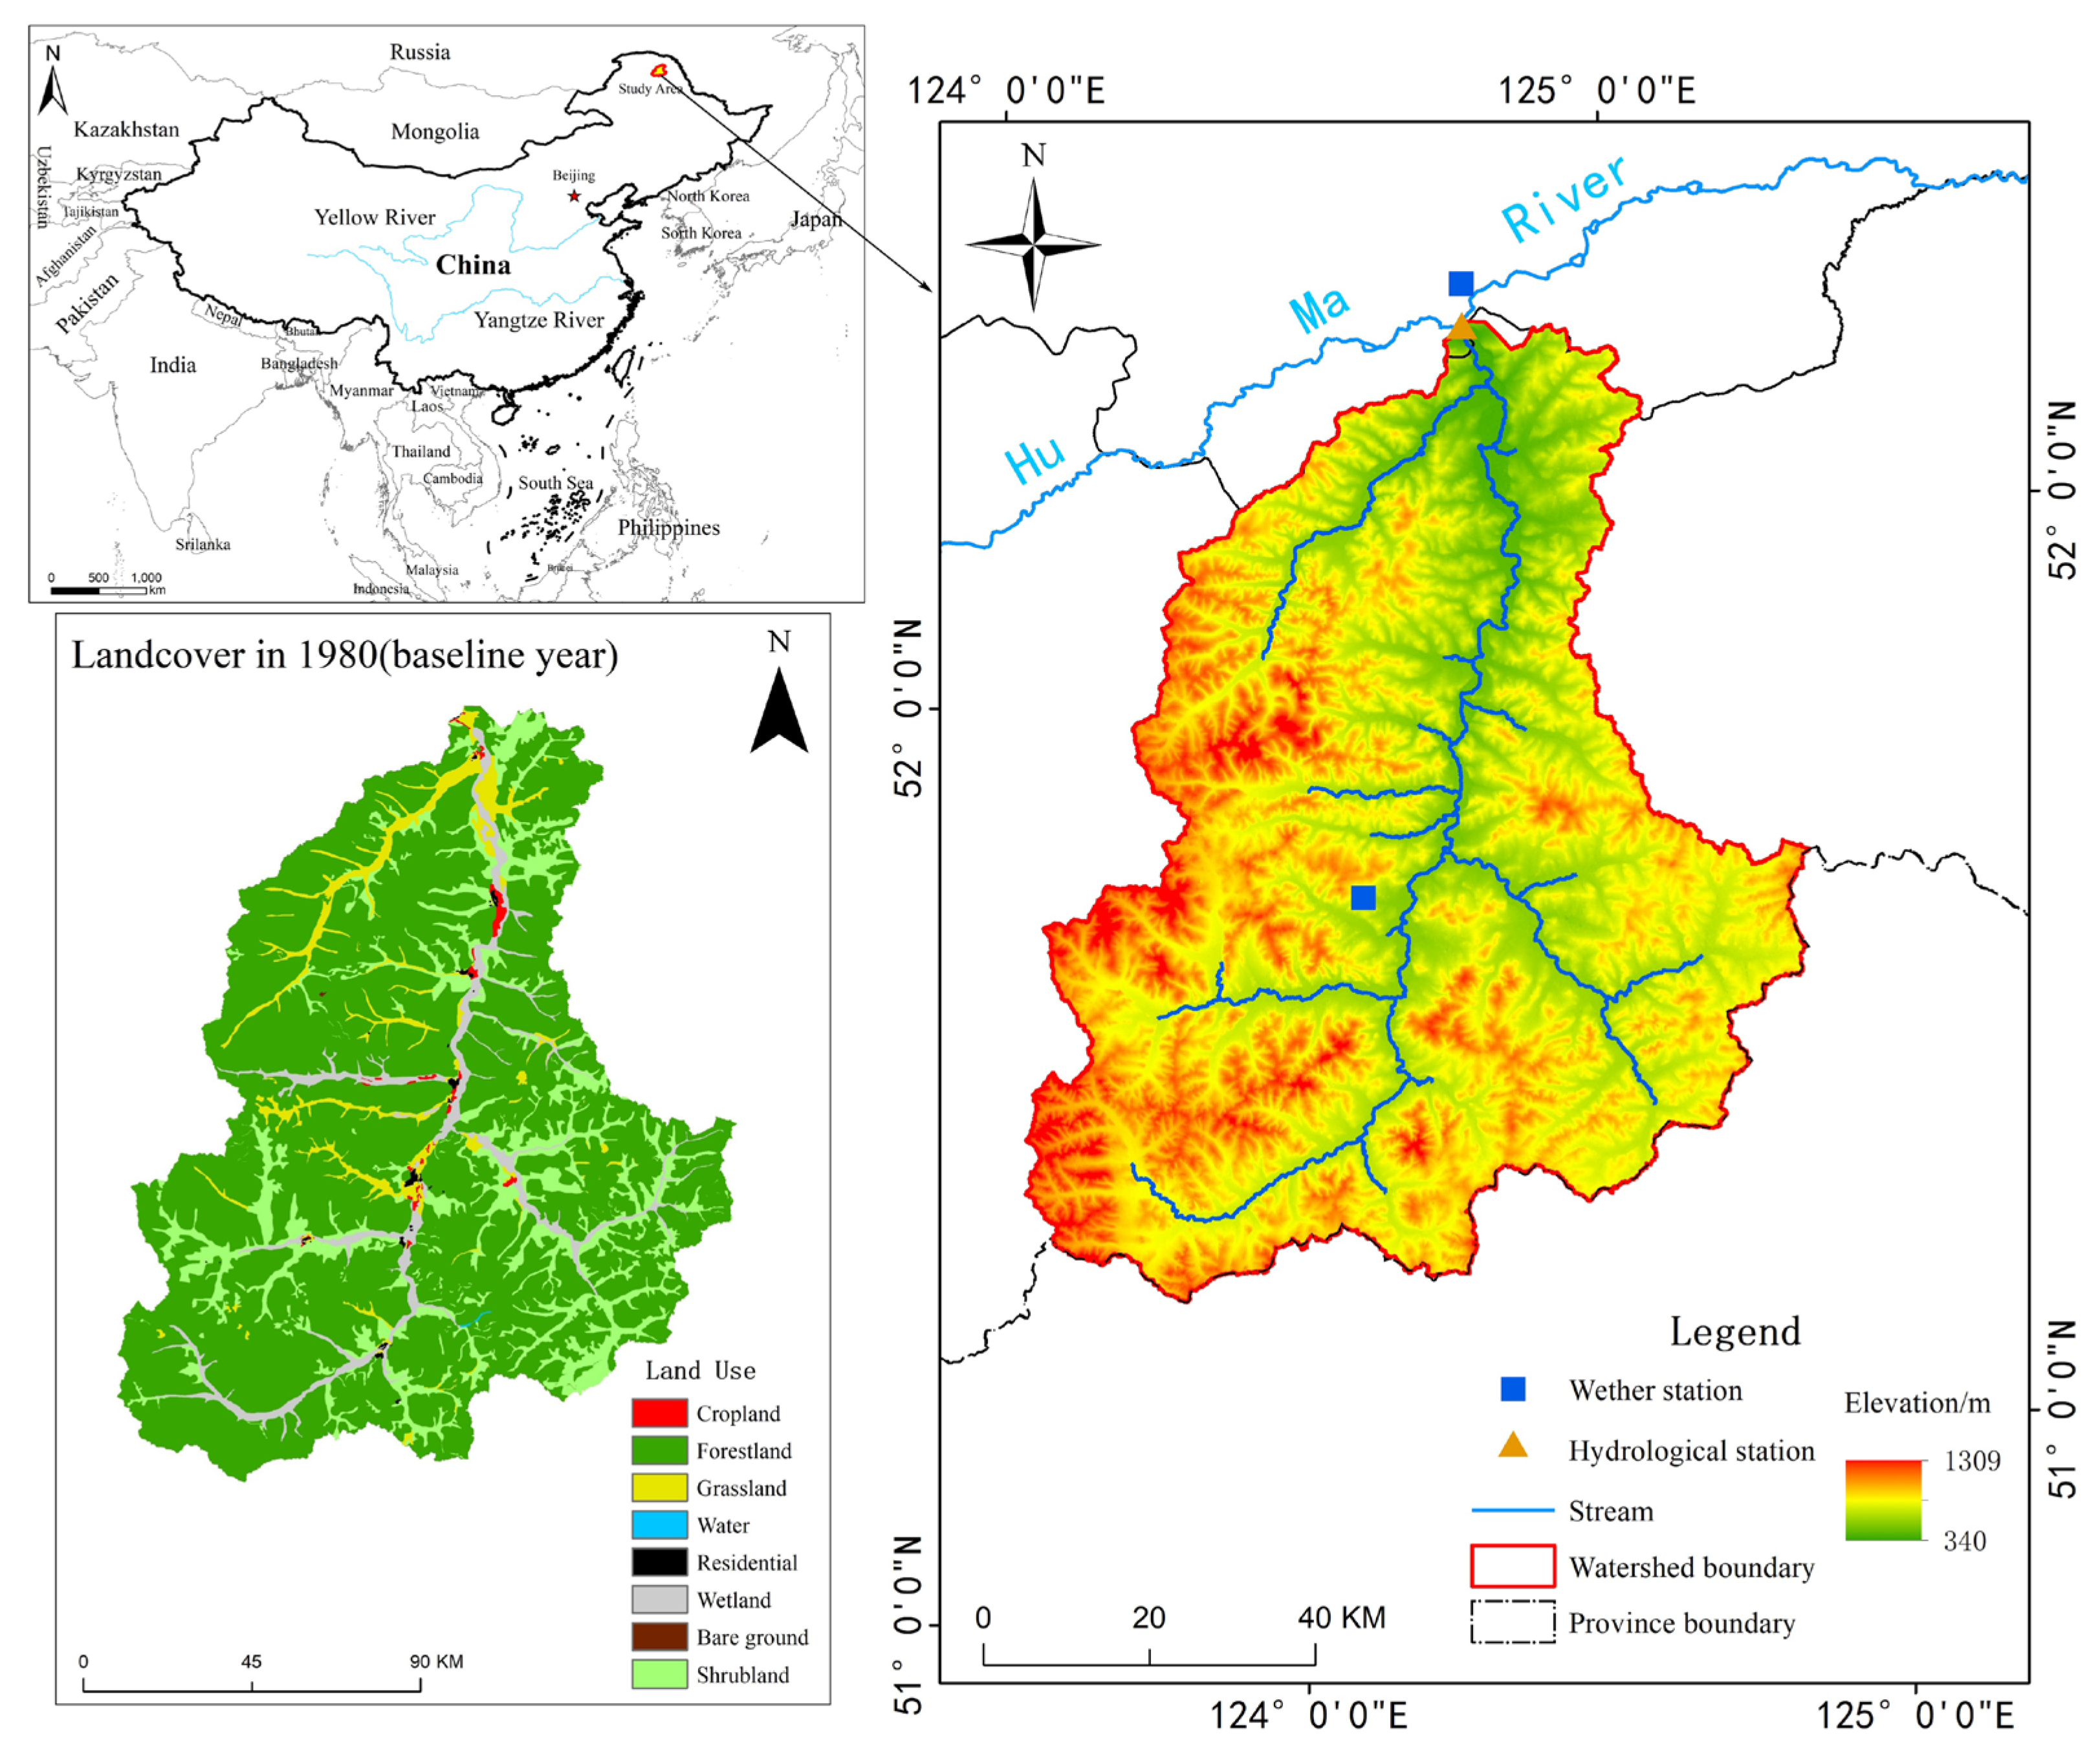
2.1. Study Area

The Da Hinggan Mountains are the largest state-owned forest area in China. Over the past few decades, the forest resources of the Da Hinggan Mountains have undergone dynamic changes in logging and restoration, which have greatly affected the distribution of water resources and hydrological processes [24,25]. Additionally, the wide valley landform and existence of permafrost have created a unique wetland type in the area, which has distinctive characteristics and functions, including little precipitation and the gathering of slope water [26]. Therefore, it is vital that the impacts of different land-use types on runoff be studied to support the integrated management of the watershed.
The Tahe River Basin is located at the north slope of the Da Hinggan Mountains in northeastern China and within the territory of the Xinlin Forestry Bureau of Huma County in Heilongjiang Province. It belongs to the Heilongjiang River system of the Da Hinggan Mountains (Figure 1). The main channel of Tahe River is 148 km long and has a drainage area of 6581 km2. It is mainly montane, with an altitude of 340–1309 m and a mean slope of 20%. The climate zone of the study area is subboreal, continental, and monsoonal. Records of meteorological stations in the Tahe watershed (1972–2016) show a mean annual temperature of −2.2 °C, precipitation of 505 mm, and potential evapotranspiration of 562 mm. Precipitation is mainly concentrated in the summer and autumn, which account for 75% of the total, with snowfall accounting for ~10% of all precipitation in the basin. The main land-use types are forestlands, which account for >70% of the total area, followed by shrublands, grasslands, and wetlands. Brown coniferous forest and swamp soils are the main soil types.

2.2. Data Collection

The digital elevation model (DEM) data used in this study were derived from the Aster GDEM V2 dataset provided by the Geospatial Data Cloud platform (http://www.gscloud.cn (accessed on 16 September 2020)). The dataset was jointly developed by the Japanese Ministry of Trade, Economy and Industry and the United States National Aeronautics and Space Administration, with a spatial resolution of 30 m and using the WGS-1984 geographic coordinate system. The original DEM images within the basin were downloaded from the platform; the DEM data were obtained by splicing, clipping, and projection transformation in ArcGIS v. 10.5 (Esri, West Redlands, CA, USA), and were used as the basic input data of SWAT model.
Land use data were gathered from the Resource and Environment Science and Data Center of the Chinese Academy of Sciences (http://www.resdc.cn (accessed on 16 September 2020)), and included three periods of land use data from 1980, 1995, and 2015. The spatial resolution of the data was 30 m and the Krasovsky_1940_Albers projection coordinate system was used [27]. Using ArcGIS, the land use data were reclassified into eight categories—croplands, forestlands, grasslands, water areas, residential areas, wetlands, shrublands, and unused lands—to facilitate SWAT model identification. Soil data were derived from the Harmonized World Soil Database (HWSD) constructed by the United Nations Food and Agriculture Organization and the International Institute for Applied Systems Analysis. It contains spatial distribution data and some soil attributes within globally distributed watersheds. The spatial resolution is 1 km and the WGS-1984 projection is employed. The remaining soil physical properties required by the SWAT model were calculated using the Soil Water Characteristics (SPAW) program developed by the USDA.
Meteorological data were obtained from the China Meteorological Administration (http://data.cma.cn (accessed on 15 July 2020)). The Tahe and Xinlin meteorological stations located around the basin were selected to obtain their daily meteorological data from 1972–2016, which mainly included precipitation, maximum and minimum temperature, mean air pressure, wind speed, sunshine hours, and relative humidity. The runoff data were collected from the daily runoff values recorded at the Tahe meteorological station from 1972–2016, excluding 1983. According to a field investigation and hydrological records, there is no reservoir and other water conservancy facility that affects runoff in this basin.

2.3. Model Construction and Validation

2.3.1. Model Theory and Scenario Construction

The SWAT model was developed by the USDA in 1994 to study and predict the long-term effects of complex and variable soil types, land use patterns, and management measures on water, sediments, and chemical substances [28]. It is a semi-distributed hydrological model based on the physical processes of the water cycle and water balance. Its simulations can be divided into land surface (i.e., runoff generation and slope confluence) and water surface (i.e., river confluence). The hydrological cycle of the model is based on the following water balance equation:
SW t = SW 0 + i = 1 t ( R d a y Q surf E a W d e e p Q gw )
where SWt is the final soil water content (mm), and for the ith day, SW0 is the initial soil water content (mm), Rday is the precipitation (mm), Qsurf is the surface runoff (mm), Ea is the surface evapotranspiration (mm), Wdeep is the water entering the underground aquifer, and Qgw is the groundwater flow, or base flow, into the main channel (mm). Based on the land use data from 1980, 1995, and 2015, combined with the meteorological data from 1972–2016, the impacts of LUCC on runoff were quantitatively explored. To further understand the hydrological effects of different land-use types, a single extreme land-use scenario for each of the main land-use types in the basin was established, and runoff was simulated with the meteorological data from the past 20 years (1996–2016) as the climate driving force to quantitatively analyze the production of water for different land-use types under different scenarios. The extreme land-use scenarios include forestland, shrubland, grassland, and wetland. Because their area accounts for more than 90% of the total area of the basin, which has a great impact on the hydrological process of the basin, and helps us to understand the hydrological effects of different land-use types [29,30]. Forest and broad valley wetlands are the two most typical geomorphic types in Tahe River Basin, and their dynamic changes have important impacts on hydrological processes in the basin. According to the predicted LULC pattern in the basin from 1980–2015, future changes in land use will remain dominated by the transformation of shrublands to either forestlands or wetlands. Through natural restoration or artificial afforestation, shrublands will gradually transform into forests, but due to anthropogenic climate change causing more extreme precipitation and the melting of frozen soils, they will also be transformed into wetlands [23,31,32,33]. Based on this, two future land-use scenarios were constructed according to our 2015 land-use scenario to study the response of runoff in the future. Table 1 shows the settings for each scenario. This study uses the calibrated SWAT model to simulate runoff under fixed climate and soil conditions, and compares the simulated runoff under different scenarios to study the impact of land-use changes on runoff [34].

2.3.2. Model Setup and Validation

Most of the parameters in the SWAT model yield different results in different study areas [35]. In the Tahe River Basin, the SWAT model was suitable according to the data collected in the area. The study period was divided into three phases—warm-up (1972–1974), calibration (1975–1995), and validation periods (1996–2016). The SWAT-CUP program, which is recommended for calibrating the uncertainty of the SWAT model [36], was used to analyze the sensitivity and calibration of model parameters. First, some parameters were selected for sensitivity analysis according to the results of previous studies and the physical meanings of the parameters [37,38]. The Sufi-2 algorithm in SWAT-CUP was then used to calibrate the parameters. Finally, the model was validated according to the measured runoff data during the validation period.
The accuracy of model simulations can be evaluated by comparing the simulated and observed runoff values, and the effect can be further assessed using relevant statistical parameters. In this study, Pearson’s correlation coefficient (R2), the Nash–Sutcliffe efficiency coefficient (NSE), and the percent bias (PBIAS) were used to determine the predictive power of the model. As Moriasi et al. [39] recommend that model performance can be It has been changed to italics, the same below judged “satisfactory” for flow simulations if monthly R2 > 0.60, NSE > 0.50, and PBIAS ≤ ±15% for watershed-scale models.

3. Results

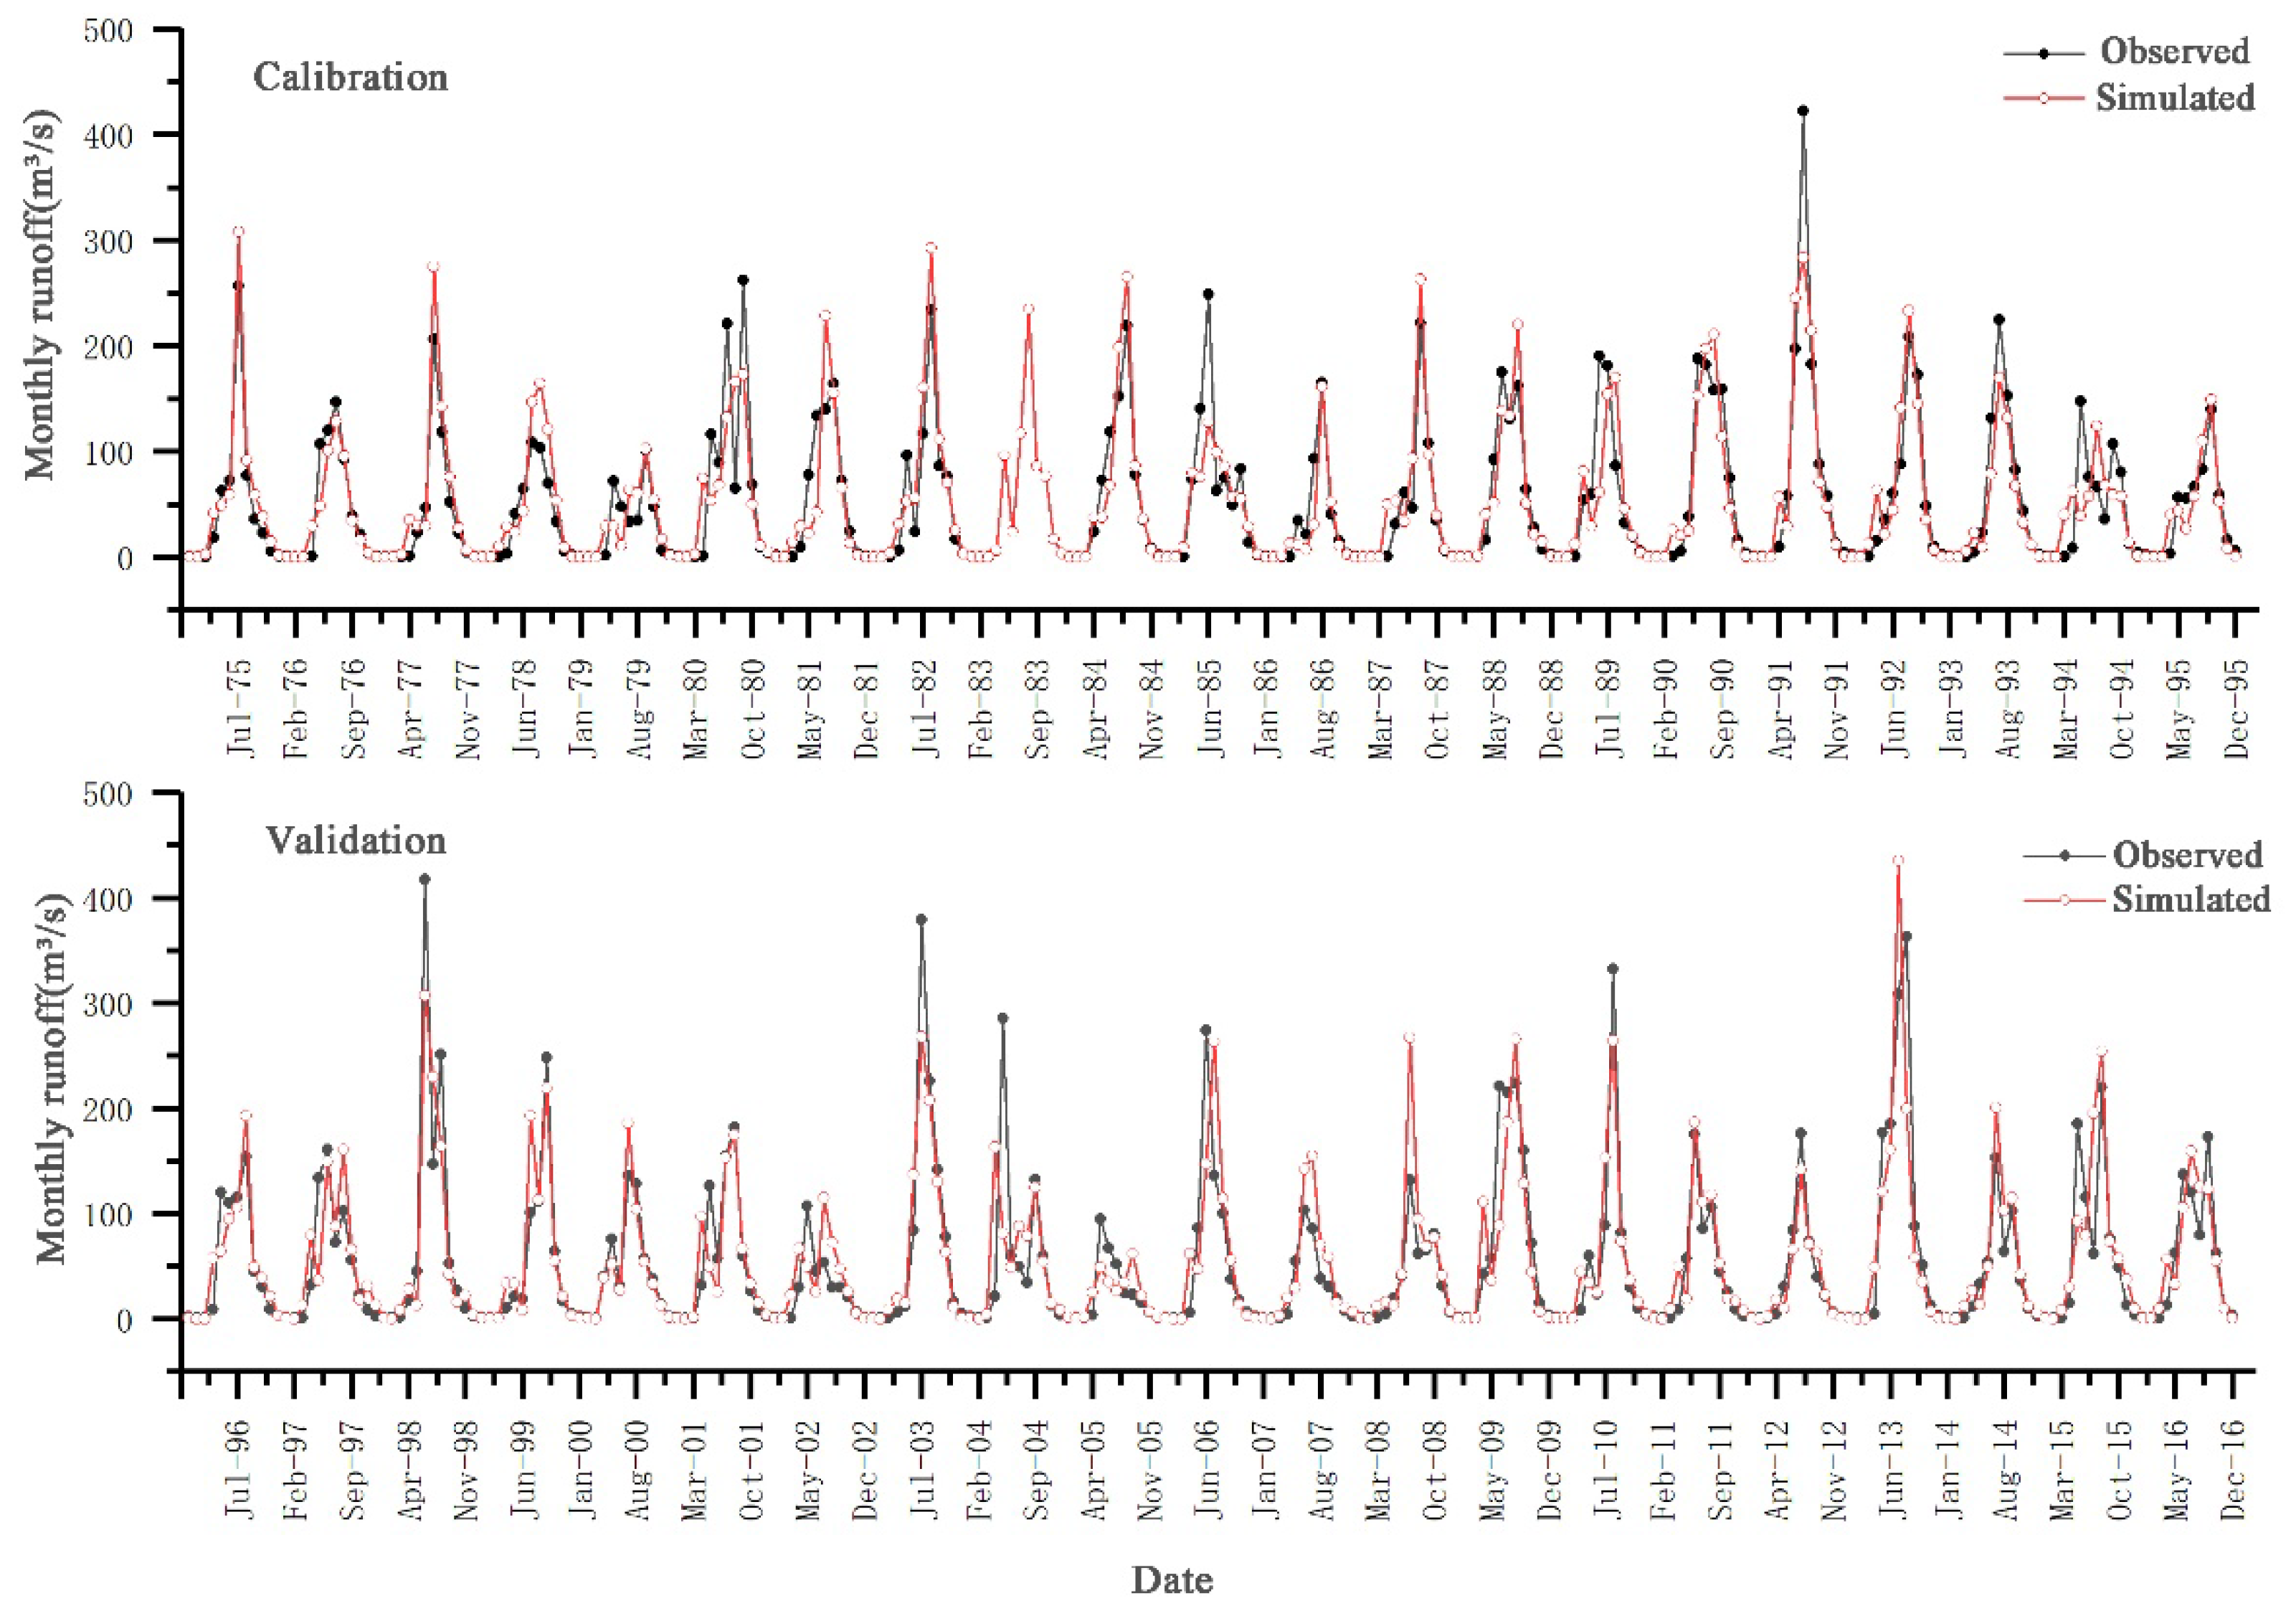
3.1. Calibration and Validation of the Streamflow

In order to improve the simulation speed of SWAT model, swat-cup software is used to analyze the sensitivity of 26 parameters affecting runoff. Finally, 10 parameters which have great impact on runoff (p < 0.05) of Tahe River Basin were selected for subsequent calibration, and then 1972–1974 was taken as the warm-up period of the model, 1975–1995 as calibrate period, and 1996–2016 as validation period. The SWAT model parameters are calibrated by using the measured runoff of Tahe hydrological station. The calibration method is based on the sufi-2 (sequential uncertainty fitting version 2) optimization algorithm in Swat-Cup. The optimal values of the calibrated parameters are shown in Table 2. Figure 2 and Figure 3 show the comparison between simulated and measured monthly discharge values (missing in 1983) in the Tahe River Basin during the calibration and validation periods. The simulated runoff in calibration period and validation period basically reflects real change of runoff, and achieves good results. At the same time, the correlation coefficient (R2), Nash-Sutcliffe efficiency coefficient (NSE) and the percent bias (PBIAS) were used to evaluate the applicability of SWAT Model in Tahe River Basin. It can be seen from Table 3 that SWAT simulation results at the month scale have achieved good results in both calibration and validation periods, meeting the requirements of simulation accuracy.

3.2. Analysis of LUCC and Its Impacts on Runoff in the Tahe River Basin

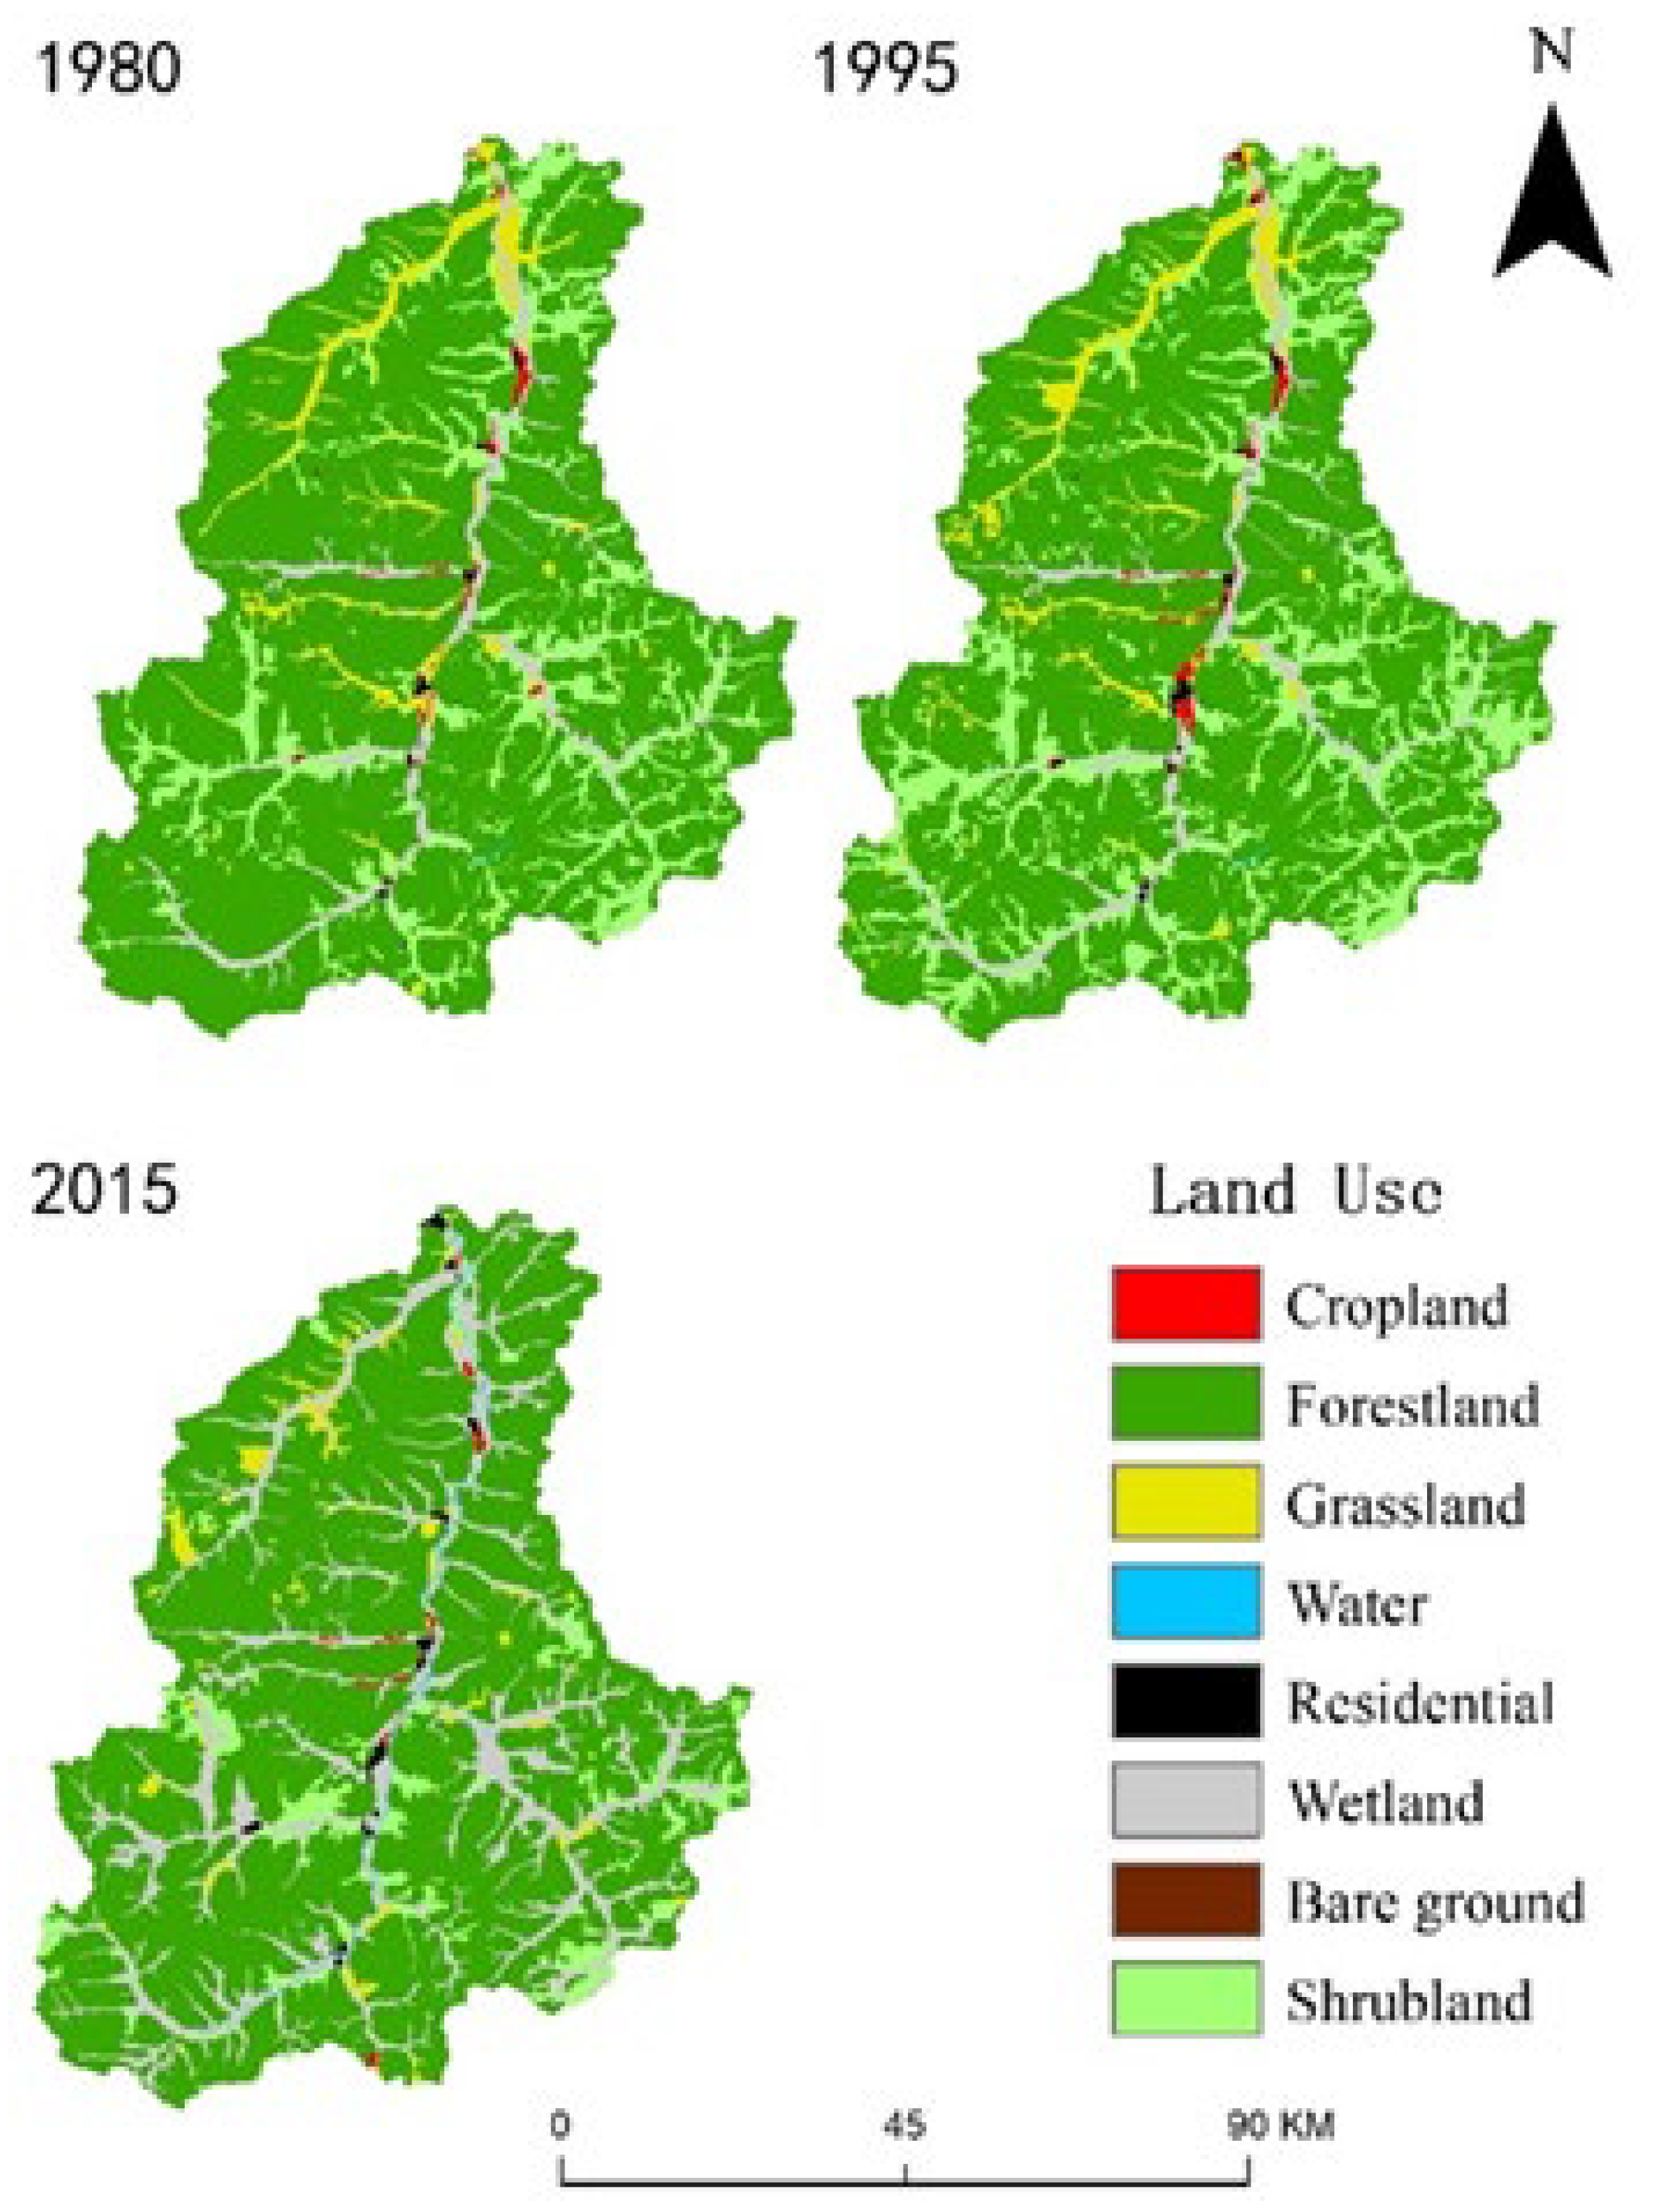
3.2.1. Characteristics of LUCC

The distribution of land-use types in the Tahe River Basin is shown in Figure 4. The area and percentage of different land-use types in different periods were analyzed using ArcGIS (Table 4). The main land-use types were forestlands, shrublands, grasslands, and wetlands, and the proportions of the basin accounted for by these land-use types were 99.4%, 99.09%, and 98.94% in 1980, 1995, and 2015, respectively. Among them, forestlands dominated the landscape, with its area accounting for >70% of the total. According to the trends of changes in land use area for different years, croplands, shrublands, grasslands, water areas, and town areas increased from 1980–1995. Forestland and wetland areas were simultaneously reduced by 394.36 km2 (5.99%) and 1.16 km2 (0.02%), respectively. The conversion of forestland into shrubland was the most notable change, with a transfer area of 359.08 km2, and new shrublands occupying 7.14% of the total forestland area; 46.73 km2 of forestland was also converted into grassland, though this only accounted for 0.93% of the total area. In contrast, the most notable changes from 1995–2015 were the significant decrease in shrublands and the rapid increase in wetlands. The shrubland area decreased by 959.32 km2 (14.57%), and was mainly transformed into forestlands and wetlands, with transfer proportions of 37.72% and 41.04%, respectively. Compared to 1995, the wetland area increased by 852.46 km2, and the growth rate reached 12.94%.

3.2.2. Response of Runoff to LUCC

To study the impact of LUCC on runoff, based on the land use statuses in 1980, 1995, and 2015, and under fixed climatic and soil conditions, the calibrated SWAT model was used to simulate the runoff data of Tahe River Basin from 1975–2016. Table 5 shows that under the land-use scenarios in 1980, 1995, and 2015, the simulated mean annual runoff gradually increased to 249.87 mm, 255.08 mm, and 261.87 mm, respectively. Compared with the simulated value in 1980, runoff had increased by 2.08% in 1995 due to the conversion of forestlands to shrublands. Compared with the base period, the simulated runoff in 2015 had increased by 11.99 mm, with 4.8% rate of increase that was accompanied by the conversion of forestlands, shrublands, and grasslands to wetlands. The large increase in the wetland area caused the increase in runoff to become more pronounced.

3.3. Construction of Different Land-Use Scenarios and Their Impacts on Runoff

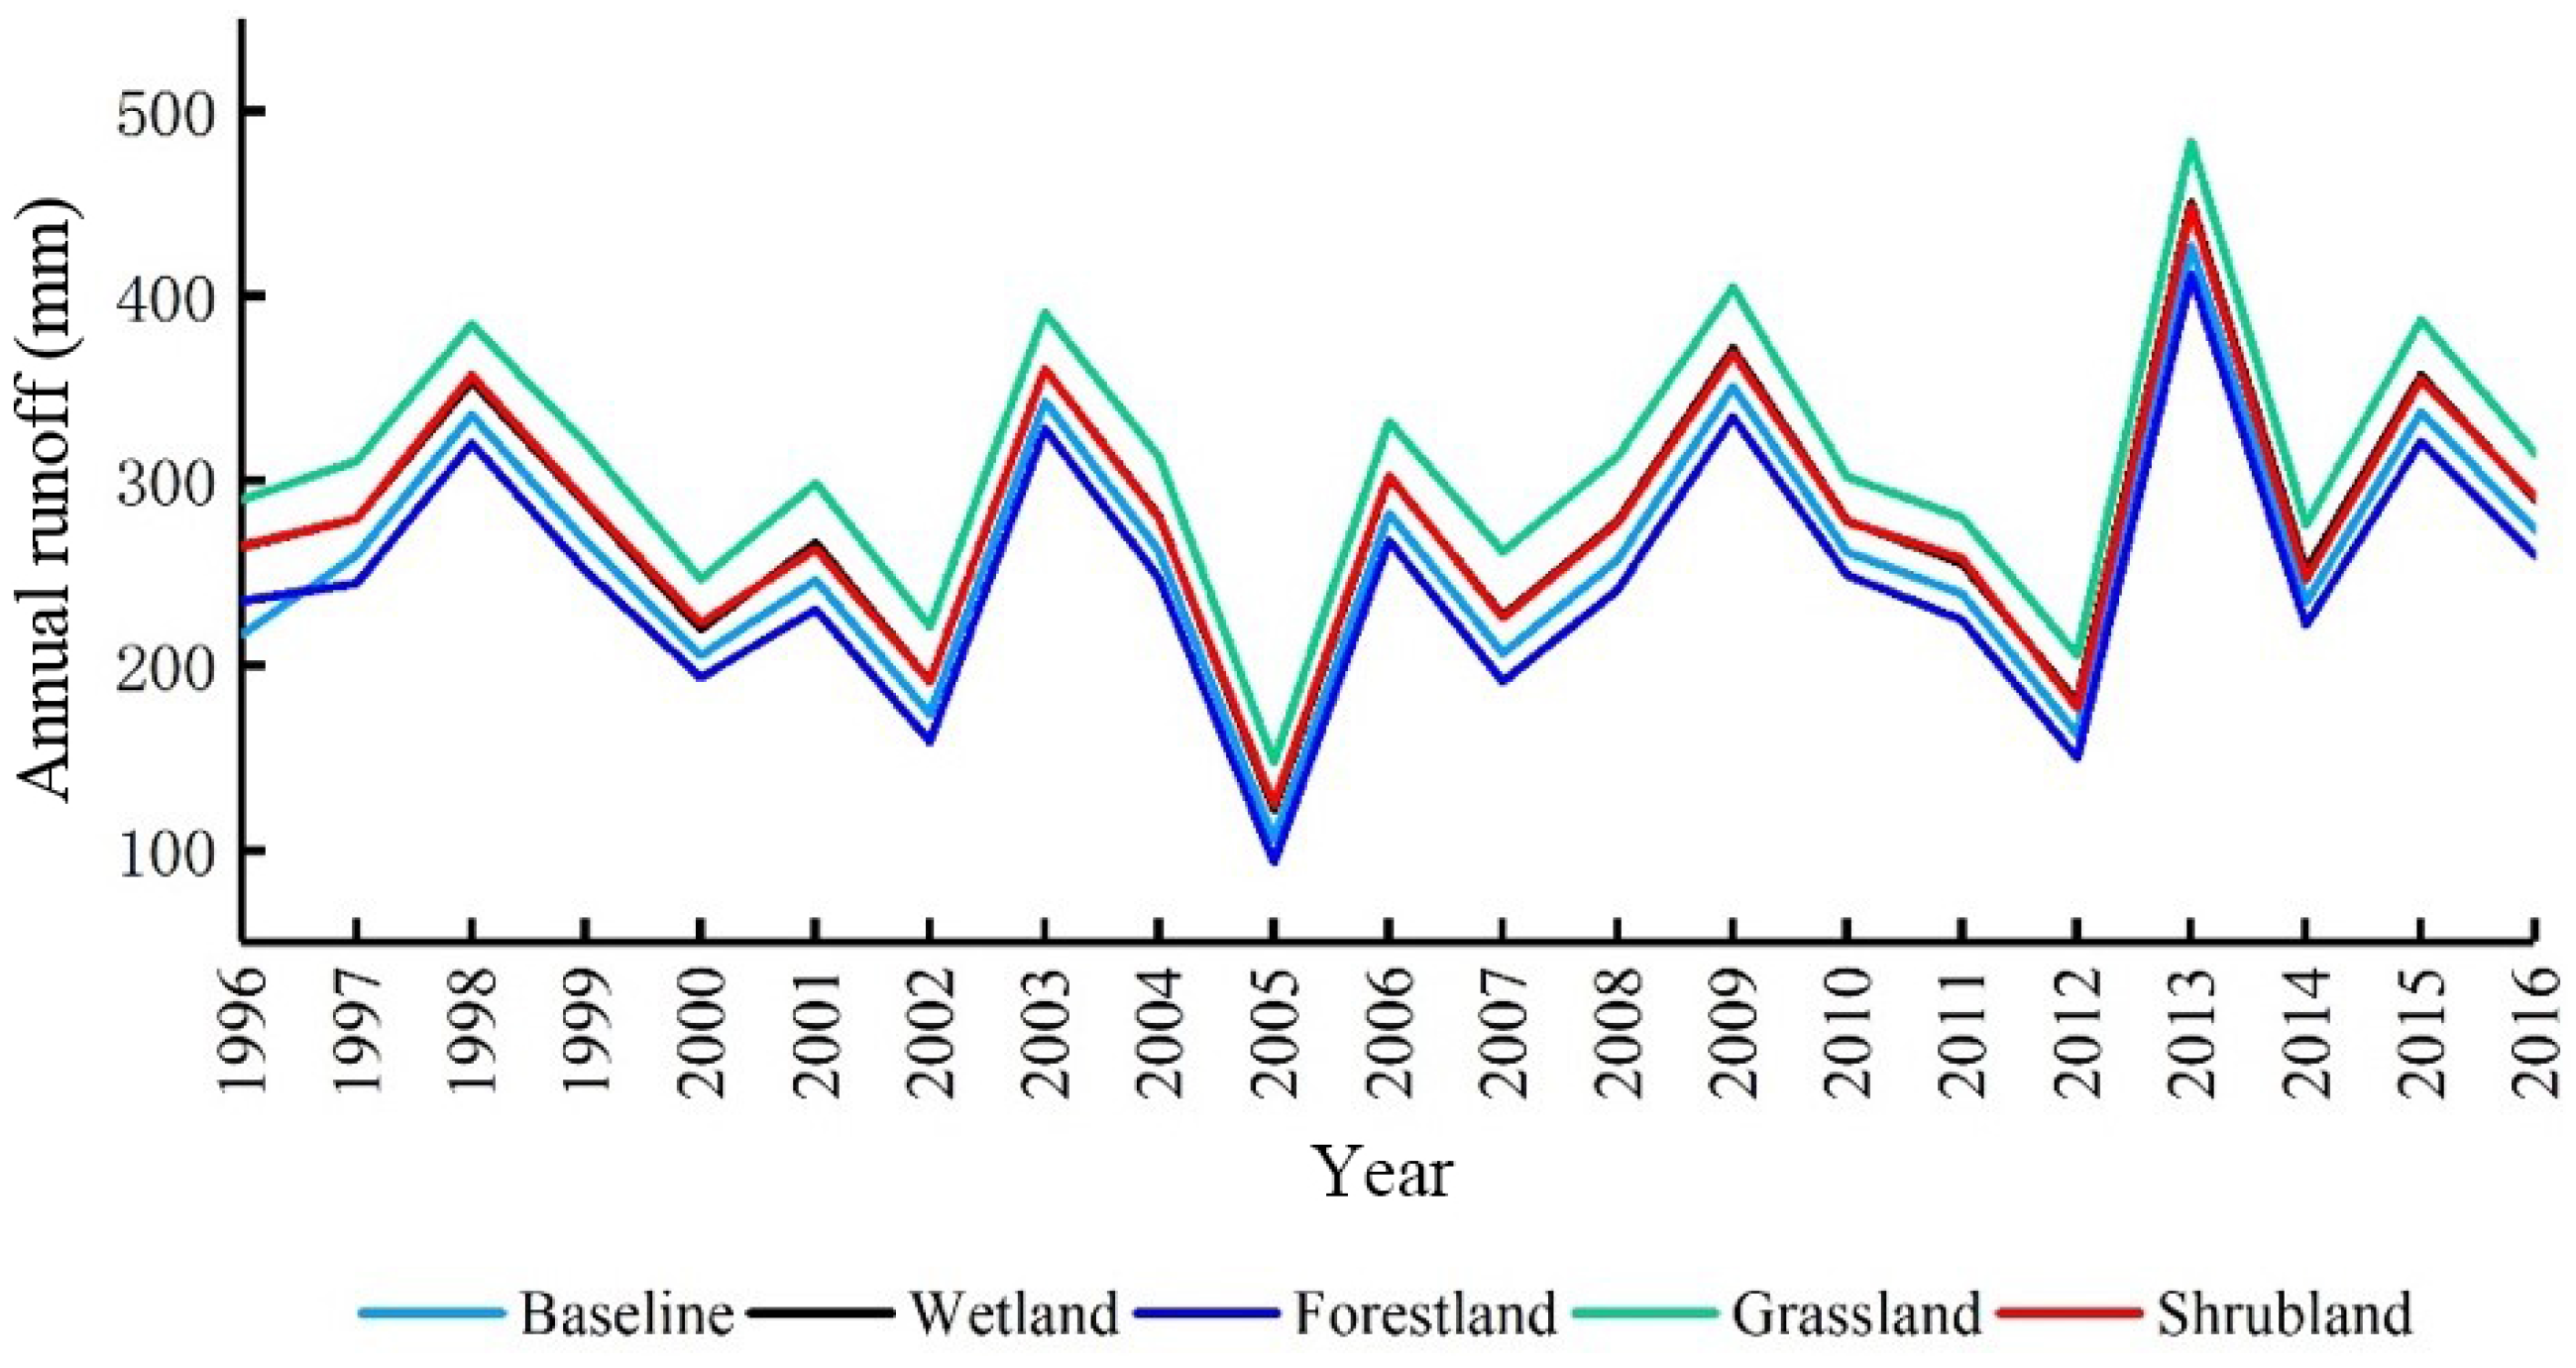
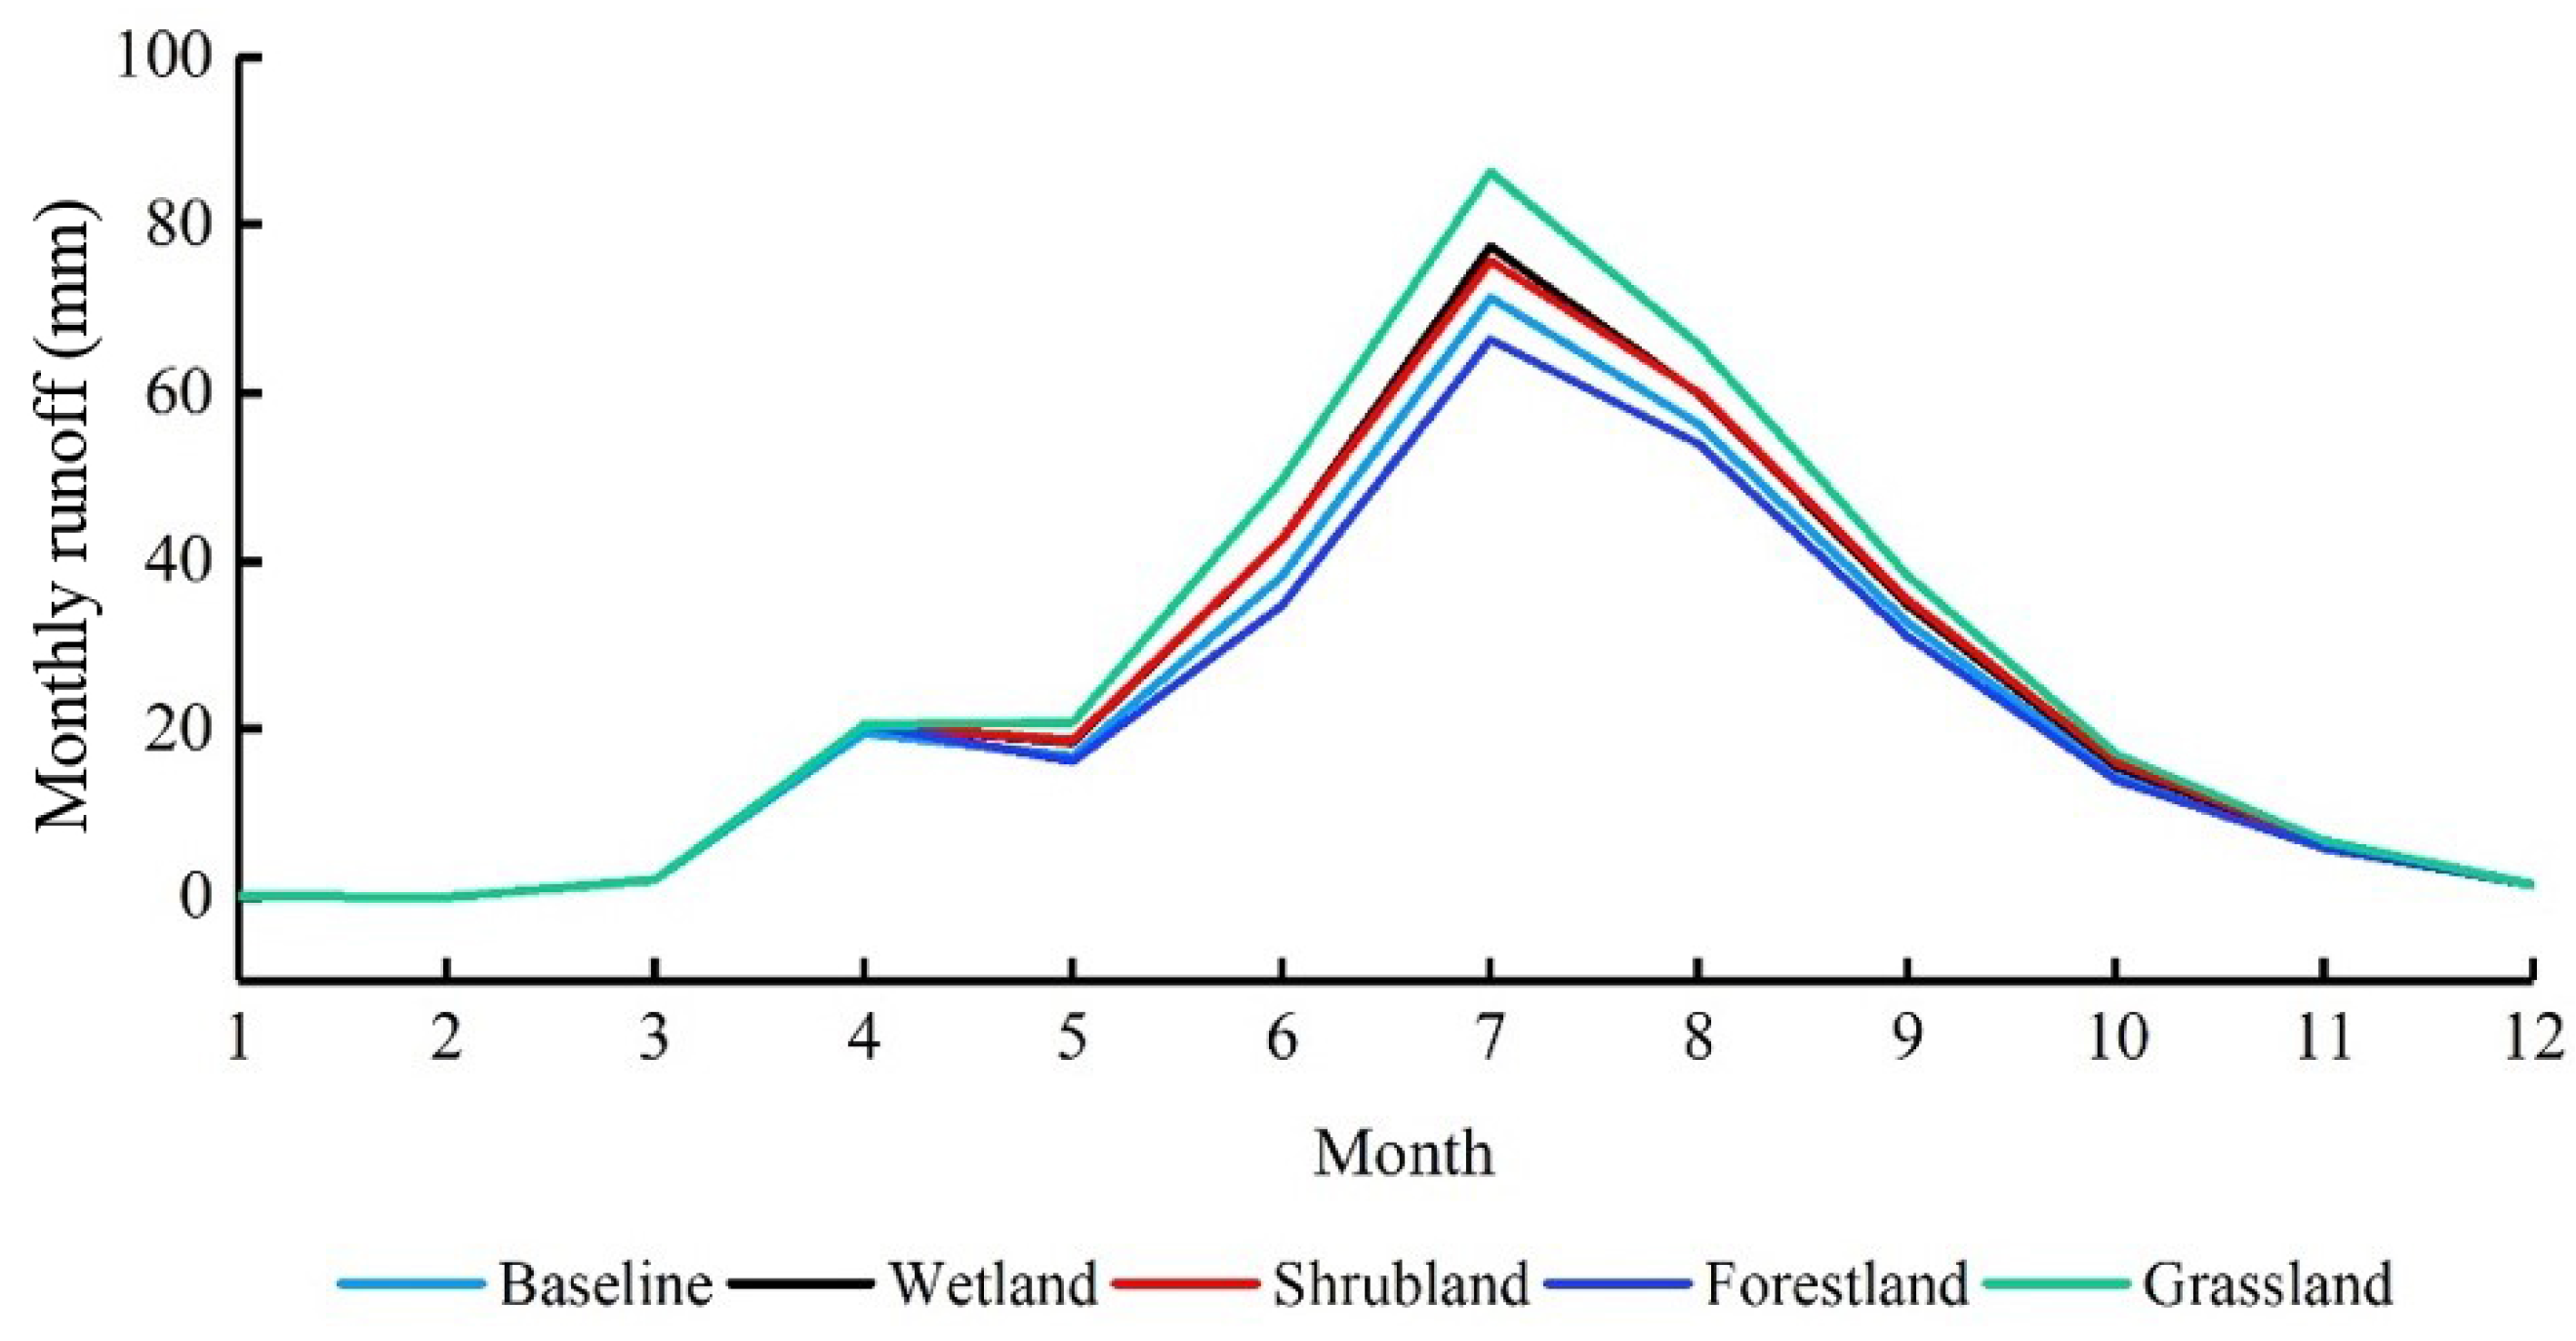
3.3.1. Simulation of the Impacts of Extreme Land-Use Scenarios on Runoff

To further analyze the impacts of the main land-use types on runoff in the Tahe River Basin, four land-use types (forestlands, shrublands, grasslands, and wetlands) were selected to construct extreme scenarios (Table 1) according to the compositions of these land-use types and their changes from 1980–2015. The land-use scenario in 2015 was selected as the reference period and driven by the meteorological data from 1996–2016 to simulate the annual runoff. It can be seen from Figure 5 that the annual runoff simulated under each scenario exhibited similar trends. The water yield under the four extreme land-use types was the highest in grasslands, followed by wetlands, shrublands, and finally, forestlands. The mean annual runoff for these land-use types were 308.62 mm, 279.10 mm, 278.89 mm, and 246.26 mm, respectively, and the difference between grasslands and forestlands was 62.36 mm. Meanwhile, the difference between wetlands and shrublands was only 0.21 mm. Compared with the base period, runoff in the grasslands, wetlands, and shrublands increased by 19.06%, 7.67%, and 7.59% respectively. The forestland scenario showed the opposite trend, with its mean annual runoff declining by 5.00% compared to the base period. In addition to the mean annual runoff, the difference in runoff between land-use types showed different characteristics in each month (Figure 6). Some land-use types had more severe impacts on snowmelt (in April and May) and summer runoff (June–August), but had lesser impacts on winter runoff (December–February).

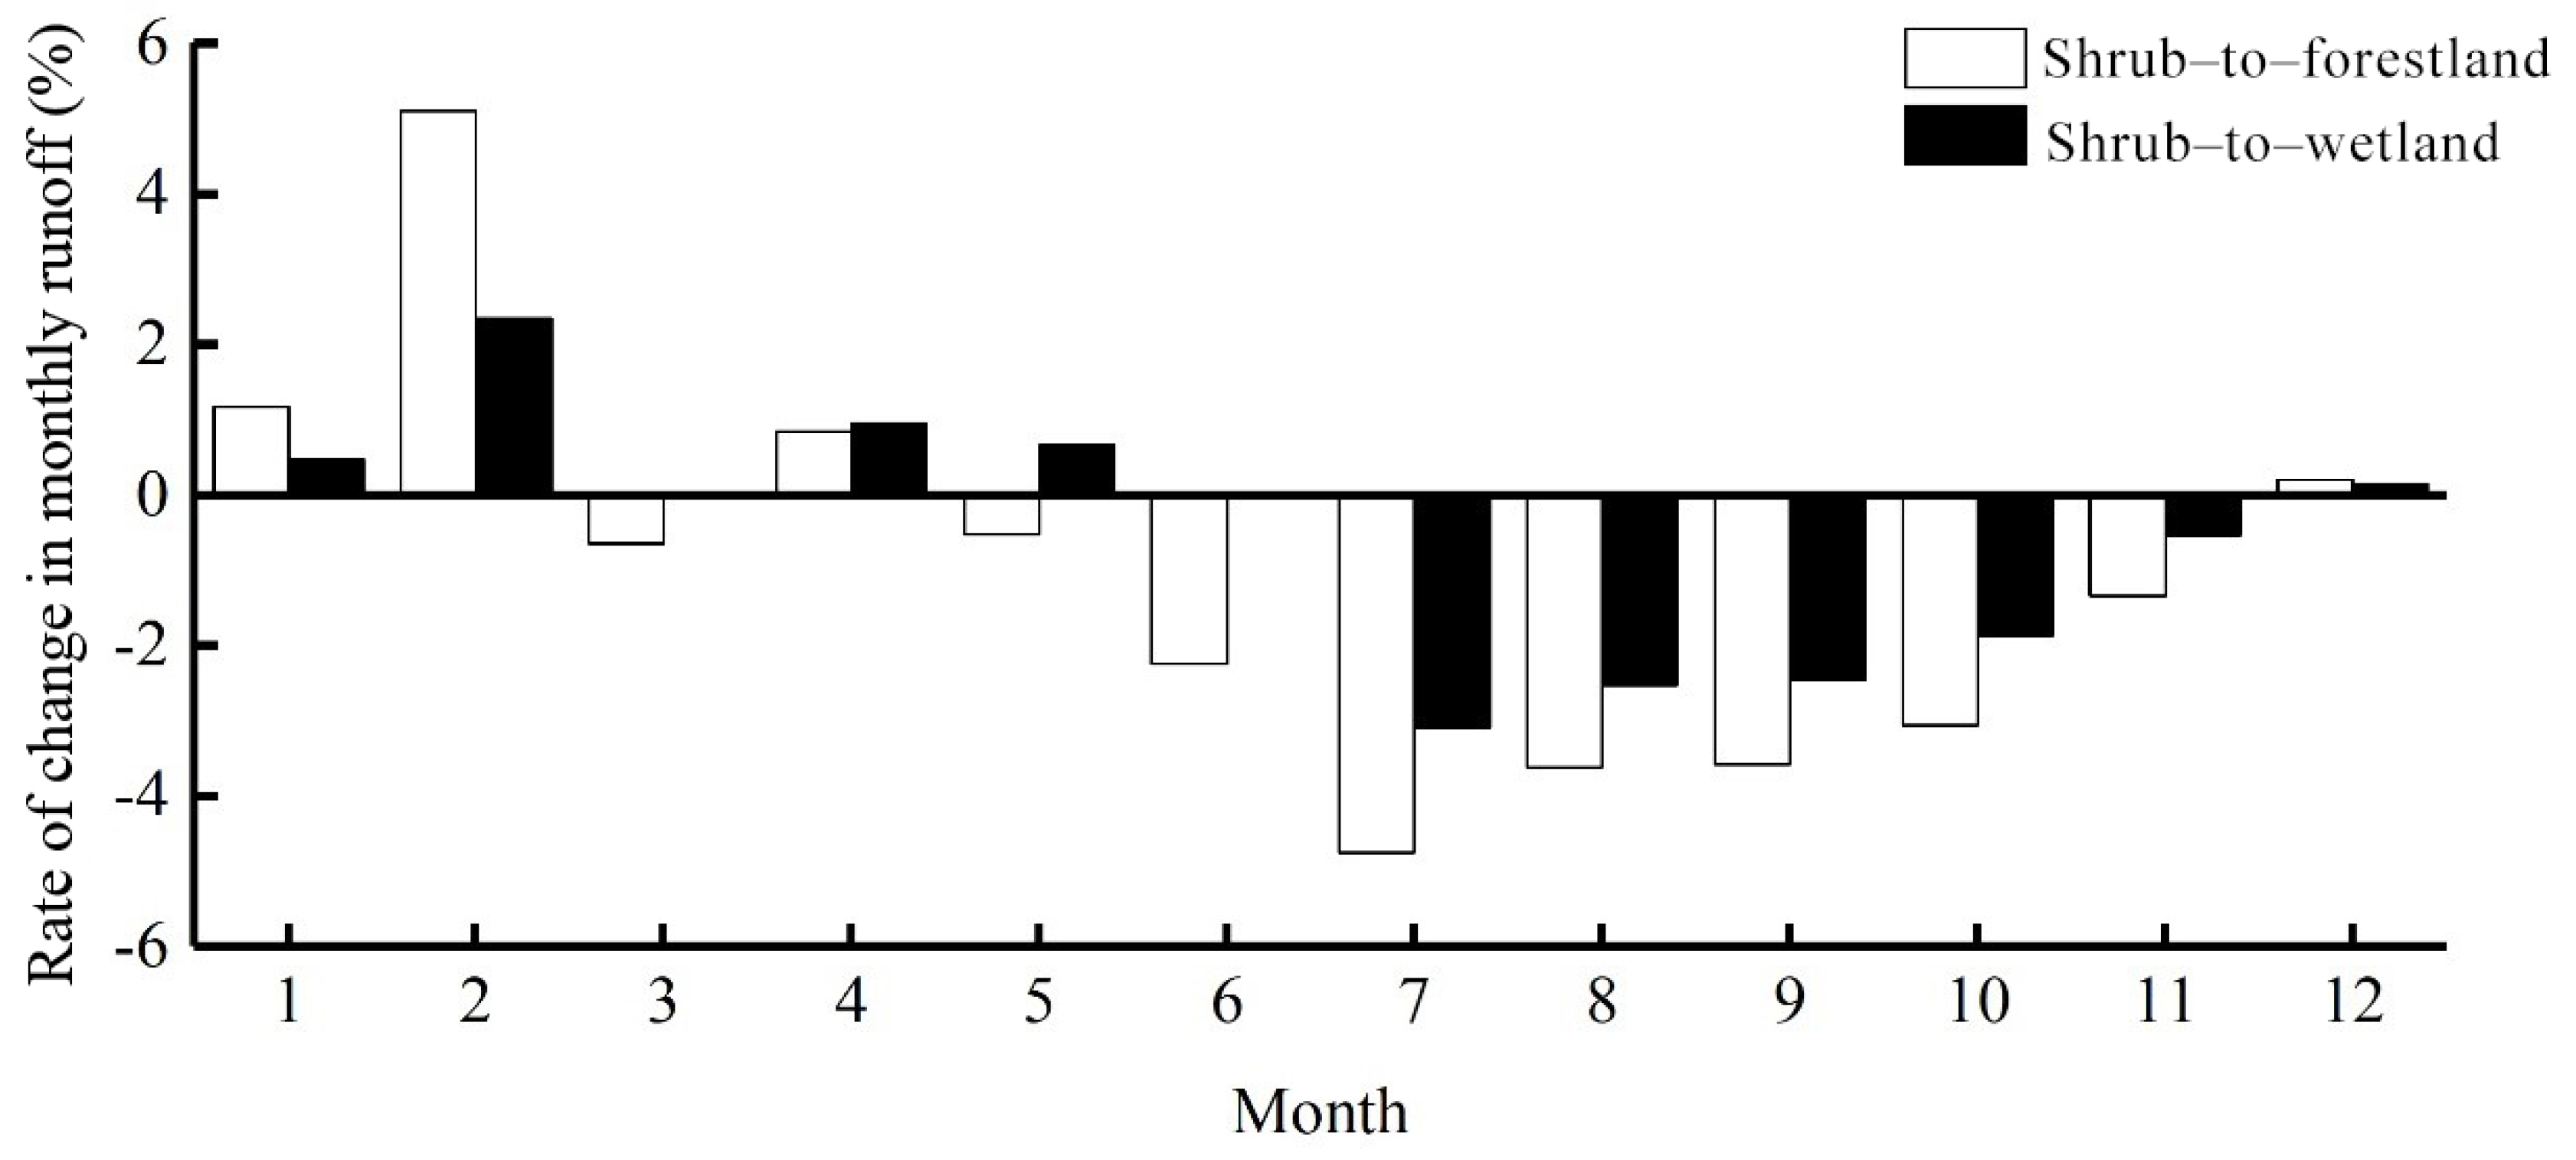
3.3.2. Construction of Future Scenarios and Their Impacts on Runoff

Taking the 2015 land-use scenario as the reference period, the simulated annual runoff of the future three land-use scenarios is shown in Table 6. The increasing order of simulated runoff was as follows: shrubland to forestland scenario < shrubland to wetland scenario < land-use scenario in 2015. The mean annual runoff for each of these scenarios was 259.30 mm, 262.90 mm, and 267.49 mm, respectively. Compared with the simulated runoff in the reference period, the mean annual runoff in the shrubland to forestland scenario decreased by 8.19 mm, accounting for 3.06% of the base period, while that of the shrubland to wetland scenario was reduced by only 4.58 mm or 1.71%.
Taking the simulated monthly runoff under the 2015 land-use scenario as the benchmark, the rate of change between the simulated monthly runoff and the reference period under two future scenarios is shown in Figure 7. Overall, the response intensity of monthly runoff to the shrubland to forestland scenario was greater than that to the shrubland to wetland scenario, but the changes in different months are varied. In the shrubland to forestland scenario, the runoff in January, February, April, and December was higher than during the base period, while in the other months, it was less than in the base period. The rate of change was the greatest in February, and was 5.11% higher than the base period. In the shrubland to wetland scenario, the runoff from July–November was lower than during the base period, while that during the other months was higher. The rate of change was the greatest in July, and was 3.09% lower than during the base period. Compared with the land-use scenario in 2015, two future scenarios yielded better adjustments to monthly runoff, which were manifest in the replenishment of winter runoff (December–February of the next year) and the reduction of summer (June–August) peak flood runoff; the former increased runoff by 5.11% in the dry season (February), while the latter increased runoff by 2.35%, and during the peak flood period (July), the former reduced runoff by 4.75% and the latter reduced runoff by 3.09%. Compared with shrublands, forestlands and wetlands reducing flood and enhance dryness, with the effect of forestlands being stronger than that of wetlands.

4. Discussion

4.1. Impacts of LUCC on Runoff

In the past 40 years, the area of forestlands in the Tahe River Basin first decreased and then increased, from 76.43% in 1980 to 70.44% in 1995 and then to 74.06% in 2015. These dynamic changes reflect the real-world implementation of large-scale deforestation in 1980 and the implementation of natural forest protection projects beginning in 2000 in the Da Hinggan Mountains. In addition to the changes in forestlands, the transformation of shrublands and grasslands to wetlands has caused the land use pattern of the basin to change substantially.
The results of the SWAT model show that runoff increased by 2.08% due to the decline of forestland area from 1980–1995. Forests affect surface runoff by regulating the interception of rainfall, evapotranspiration, and groundwater infiltration. Similar results for runoff responses to LUCC have also been reported in other hydrological simulation studies. For example, Weber [40] found that streamflow simulated by hydrological models increased when the forest area decreased and grassland area increased. Li et al. [41] analyzed 162 large watersheds and confirmed that deforestation increases annual surface water resources (i.e., runoff), while reforestation causes them to decrease. In particular, forest vegetation increases the rate of transpiration, dissipates raindrop energy, slows surface velocities, and increases soil organic matter, all of which increase infiltration and reduce surface runoff [42]. Compared with these studies, the change in runoff caused by changes in forest area in Tahe River Basin was less pronounced, which may be due to the transformation of most of the forestland to shrubland. Although differences in the interception of precipitation, evapotranspiration, and infiltration exist, hydrological processes did not fundamentally change, so no significant change in runoff was observed. Compared with 1980, the simulated runoff for the land-use scenario in 2015 increased by 11.99 mm, with a rate of change of +4.80%. The increase of surface runoff was more notable due to the significant increase in the wetland area, which was closely related to the unique cold and humidity of these alpine wetlands. With increases in the wetland area, the humidity in the atmosphere near the ground increased, so that its ability to control the surface temperature was enhanced [43,44,45]. Some previous studies have also yielded similar conclusions. For example, Ye et al. [46] selected the Keluohe River Basin, a sub-basin of the Nenjiang River Basin, as their research object. By analyzing the changes in land use and runoff between 1986 and 1995, they concluded that the decrease in forestland and increase in wetland area were the main causes of increased runoff. Lee et al. [47] used an improved SWAT model to simulate the impacts of isolated wetlands on runoff in different areas of a watershed, and showed that isolated wetlands can increase runoff; in fact, the farther away a site was from the river, the more capable it was of increasing river flow in the basin. They also reported that decreases in the wetland area could also decrease runoff. A study by Wu [48] in the Upper Nenjiang River Basin showed that the change in runoff within the basin was most closely related to the growth and decline of marsh wetlands; wetlands decrease hydrological fluxes by slightly increasing actual evapotranspiration and decreasing water yield in the study area. Compared with the aforementioned studies, the wide valley landform and existence of permafrost in the Da Hinggan Mountains make the study area considered here unique. Under the background of climatic warming, the most appropriate means of further quantifying the impacts of changes in permafrost on hydrological processes remains an urgent problem that must be solved.

4.2. Response of Runoff under Extreme Land-Use Scenarios

In this study, the runoff in the Tahe River watershed under four extreme land-use scenarios, from greatest to least, was grassland > wetland > shrublands > forestlands. Compared with the simulated runoff under the land-use scenario in 2015, runoff increased in the grassland, wetland, and shrubland scenarios by 19.06%, 7.67%, and 7.59%, respectively. The forestland scenario showed the opposite trend, with its mean annual runoff decreasing by 5.00% compared with the base period. These results indicate that the grassland scenario significantly increased runoff, while the forestland scenario reduced runoff—findings that are similar to those of previous studies. For example, in the Weihe River Basin, three extreme land-use scenarios were used to simulate the overall trend of runoff, which declined from croplands to grasslands to forestlands [49]. The hydrological effects of extreme land-use scenarios in the Huaihe River Basin showed that annual runoff decreased by 16.7% under an evergreen broad-leafed forest scenario and increased by 6.9% under a grassland scenario [50]. Farely [51] found that runoff could be reduced by 33%–75% when grasslands and shrublands were converted into forestlands. Sun [44] used a conceptual model to simulate and analyze the hydrological response after all grasslands were converted to forestlands, and found that grassland afforestation caused a 10%–50% reduction in mean annual runoff. In addition to grasslands, shrublands also promoted runoff compared to forestlands.
These findings suggest that shrublands and sparse forestlands can increase runoff. Compared with grasslands and shrublands, the reduction in runoff achieved by forestlands may be related to canopy interception and soil characteristics. Forest vegetation intercepts more water than other land cover types, and its interception is much greater than that of shrubland and grassland plants. However, comparatively, trees generally consume more water due to their deep roots, and the water extracted from shallow aquifer storage will generate less runoff due to greater aerodynamic conduction and more transpiration; therefore, forest catchment areas will produce less runoff [52,53]. Some studies have shown that with the growth of trees, more precipitation will be intercepted and evaporated. The maximum reduction of annual runoff occurs 15–20 years after tree planting. When a forest grows to maturity, evapotranspiration tends to decrease, and runoff stabilizes [51]. In addition to these effects, forest soils also play a key role in runoff. The thick litter layer and unique aggregate structure of forest soils increase their permeability and reduce surface runoff. As Bruijnzeel [54] noted, the permeability of forests is crucial to determining how available water is distributed between drainage and recharge. The simulated value of grassland is larger than that of shrubland and wetland, which is consistent with the results of earlier studies [55]. Compared with grassland, shrubland has a stronger water retention capacity to slows down the generation of runoff [56]. Other studies have also shown that grassland has better connectivity than shrubland, which makes it faster to respond to runoff from short-term heavy rainfall. Under high-intensity rainfall conditions, a large amount of runoff could be generated [57]. The larger runoff of grassland than wetland may be related to a smaller amount of evaporation. For wetland, water surface evaporation is a non-negligible component of its evapotranspiration. Under sufficient water conditions, its evaporation is the potential evaporation under the climate environment at that time, which is much higher than that of grassland [58,59].
The extreme wetland scenario in this study promoted runoff, and had a greater impact on the water cycle of the basin. In terms of the hydrological effect of wetlands, different studies have yielded differing results. Wu [60] used the HYDROTEL model to simulate runoff in the Nenjiang River Basin with and without wetlands. They found that wetlands play a role in weakening the total runoff, thereby impacting flood processes, especially peak discharge. A study in the Naoli river basin [61] showed that the degradation of wetlands led to decreases in runoff, which did not reflect its typical moderating effects. Even in the same study area, different years also yielded different results. Ahmed [62] found that the wetlands in the Black Creek Basin mainly reduce surface runoff and increasing base flow. However, in some years, due to the frozen soil layer in the wetlands at the end of spring, the existence of wetlands in the Black Creek Basin caused the river water to surge in spring and increased flow. Therefore, the effect of wetland area on runoff has important relationships with the physical properties of soils in the basin, as well as the types and distribution of wetlands, which may show different effects under different external conditions. Moreover, whether or not a wetland can regulate runoff is closely related to the preexisting water storage. Bullock [63] suggested that if a wetland undergoes sufficient water replenishment before flooding and the soil becomes supersaturated, the wetland will not only be unable to reduce flooding, but it will also directly store the full runoff and flow into the river channel, thereby enhancing flood intensity. Jones [64] also found that when wetland soils are always saturated or when they are very porous and leak, under extreme precipitation scenarios, the regulation and storage capacities of wetlands for total runoff and floodwaters are very limited, and these areas may even directly enhance peak flood discharge.
Overall, the increase of grasslands, shrublands, and wetlands in the Tahe River Basin will increase runoff, while increases in the areal extent of forestlands will reduce runoff. These findings can guide the implementation of adaptive management strategies in the basin. By adjusting the land use structure or area, such as reducing the area of forestlands or increasing the area of grasslands, runoff can be increased for the purpose of regulating and storing it. As future climate change will lead to the reduction of inner diameter flow, such negative hydrological effects can also be alleviated by reasonable land use planning, which is helpful for the scientific management of water resources in the basin.

4.3. Limitations of the SWAT Model and Future Research Prospects

Changes in runoff under different land-use scenarios in the Tahe River Basin were explored and the results presented here are relevant to land use planning in this region. However, there are also some uncertainties, mainly with respect to the parameters used, including land cover and soil types. The land cover types in China are not consistent with those in the SWAT model, and many typical land cover types in China are not included. Therefore, when determining land cover types in the watershed, only the parameters of similar plant species could be selected, which undoubtedly increased the calculation error. Additionally, the soil database of the SWAT model is focused on the soils of North America, which are classified differently from soils in China. The existing data from the local soil records in China could not be used directly. Because of this, the HWSD was used, but its accuracy was limited. Although the use of the HWSD could achieve better mathematical fitting, the existence of errors could not be excluded. Thus, the urgent problem that must be solved to apply the SWAT model more accurately to the Tahe River Basin is to increase the measured parameters, which will be done in the future. Using measured parameters will not only improve the simulation accuracy and reduce uncertainty, but it can also improve the localization of the model so that it is more applicable to hydrological studies in China.
As the southeastern margin of the Eurasian Cryolithozone, the northeastern China has experienced rapid climate warming over the past several decades [33], which has resulted in significant permafrost degradation and changes in precipitation regime [32,65]. In Duan et al. [66] study, they found that the winter baseflow was characterized by significant positive trends of 1.7%·year−1, which was positively correlated with mean annual air temperature and the thawing index in Tahe River watershed, as well as the increasing annual rainfall fraction of precipitation for the Duobukuer River watershed in the Da Hinggan Mountains. It is indicated that the changes in streamflow are likely related to enhanced groundwater storage and winter groundwater discharge caused by permafrost thaw and are potentially also due to the changing precipitation regimes. However, this study mainly focused on quantifying the impact of land-use changes on runoff, which can be achieved as long as the weather data remains unchanged. Thus, the fixed climate data from 1996 to 2016 was applied to remove the comprehensive impact of climate change on streamflow. Nevertheless, in the context of climate change, how to integrate the changing climate data with the SWAT model accurately simulate the hydrological processes should be further studied.

5. Conclusions

Under extreme land-use scenarios, simulated runoff declined from grasslands to wetlands, shrublands, and finally, forestlands, with mean annual runoff being 308.62 mm, 279.10 mm, 278.89 mm, and 246.26 mm, respectively. Based on an analysis of historical LUCC in the Tahe River Basin, two future scenarios of converting shrublands into forestlands and wetlands were also constructed based on the land-use scenario in 2015. The results showed that the simulated annual runoff of these two scenarios was less than that of the reference period (2015), with runoff decreasing in the shrubland to forestland scenario by 3.06%, and in the shrubland to wetland scenario by 1.71%. Compared with the land-use scenario in 2015, the two future scenarios exhibited better regulatory effects on monthly runoff, which were reflected in the replenishment of winter runoff (December–February) and the reduction of summer (June–August) peak flood runoff. However, the effect of forestlands on the flood reduction and drought supplementation was stronger than that of wetlands, indicating that forestlands provide the greatest buffer to runoff in the Tahe River Basin.

Author Contributions

P.H., T.C. and L.D. conceived and designed the research themes; P.H. and L.D. wrote the paper; P.H., X.C. and F.S. analyzed the data; P.H., L.D. and F.S. revised the paper; X.M. contributed to data preparation. All authors have read and agreed to the published version of the manuscript.

Funding

This work was supported by the National Science Foundation of China (grant no. 31971451, 41901018).

Acknowledgments

We acknowledge the financial support by the National Natural Science Foundation of China (31971451, 41901018). We would also like to thank the Mohe Forest Ecological Research Station. We would also like to thank the editors and anonymous reviewers for their valuable suggestions and serious work.

Conflicts of Interest

The authors declare that there is no conflict of interest.

References

  1. Ma, K.; Huang, X.; Guo, B.; Wang, Y.; Gao, L. Land Use/Land Cover Changes and Its Response to Hydrological Characteristics in the Upper Reaches of Minjiang River. Proc. Int. Assoc. Hydrol. Sci. 2018, 379, 243–248. [Google Scholar] [CrossRef]
  2. Saliba, L.J. Coastal land use and environmental problems in the Mediterranean. Land Use Policy 1990, 7, 217–230. [Google Scholar] [CrossRef]
  3. Paulo, R.F.C.; Adauto, L.C.; Gustavo, B.Z.; de Carvalho, M.M. Integrated Management of Water Resources and Land Use in Urban- Metropolitan Basins: Flood Control in the Iguau-Sarapu River Basin (Rio De Janeiro, Brazil). Resour. Environ. 2012, 2, 56–66. [Google Scholar]
  4. Nian, Y.; Li, X.; Zhou, J.; Hu, X. Impact of land use change on water resource allocation in the middle reaches of the Heihe River Basin in northwestern China. J. Arid. Land 2013, 6, 273–286. [Google Scholar] [CrossRef] [Green Version]
  5. Li, H.; Liu, G.; Fu, B. Estimation of regional evapotranspiration in alpine area and its response to land use change: A case study in Three-River Headwaters region of Qinghai-Tibet Plateau, China. Chin. Geogr. Sci. 2012, 22, 437–449. [Google Scholar] [CrossRef]
  6. Li, M.; Chu, R.; Islam, A.R.M.T.; Shen, S. Characteristics of surface evapotranspiration and its response to climate and land use and land cover in the Huai River Basin of eastern China. Environ. Sci. Pollut. Res. 2021, 28, 683–699. [Google Scholar] [CrossRef]
  7. Nie, W.; Yuan, Y.; Kepner, W.; Nash, M.S.; Jackson, M.; Erickson, C. Assessing impacts of Landuse and Landcover changes on hydrology for the upper San Pedro watershed. J. Hydrol. 2011, 407, 105–114. [Google Scholar] [CrossRef]
  8. Ghaffari, G.; Keesstra, S.; Ghodousi, J.; Ahmadi, H. SWAT-simulated hydrological impact of land-use change in the Zanjanrood basin, Northwest Iran. Hydrol. Process. 2010, 24, 892–903. [Google Scholar] [CrossRef]
  9. Zhou, G.; Wei, X.; Luo, Y.; Zhang, M.; Li, Y.; Qiao, Y.; Liu, H.; Wang, C. Forest recovery and river discharge at the regional scale of Guangdong Province, China. Water Resour. Res. 2010, 46, 9503. [Google Scholar] [CrossRef] [Green Version]
  10. Hubbart, J.A.; Kellner, E.; Zeiger, S.J. A Case-Study Application of the Experimental Watershed Study Design to Advance Adaptive Management of Contemporary Watersheds. Water 2019, 11, 2355. [Google Scholar] [CrossRef] [Green Version]
  11. Aryal, Y.; Zhu, J. Effect of watershed disturbance on seasonal hydrological drought: An improved double mass curve (IDMC) technique. J. Hydrol. 2020, 585, 124746. [Google Scholar] [CrossRef]
  12. Kiprotich, P.; Wei, X.; Zhang, Z.; Ngigi, T.; Qiu, F.; Wang, L. Assessing the Impact of Land Use and Climate Change on Surface Runoff Response Using Gridded Observations and SWAT+. Hydrology 2021, 8, 48. [Google Scholar] [CrossRef]
  13. Gassman, P.W.; Reyes, M.R.; Green, C.H.; Arnold, J.G. The Soil and Water Assessment Tool: Historical Development, Applications, and Future Research Directions. Trans. ASABE 2007, 50, 1211–1250. [Google Scholar] [CrossRef] [Green Version]
  14. Anand, J.; Gosain, A.; Khosa, R. Prediction of land use changes based on Land Change Modeler and attribution of changes in the water balance of Ganga basin to land use change using the SWAT model. Sci. Total. Environ. 2018, 644, 503–519. [Google Scholar] [CrossRef] [PubMed]
  15. Liu, J.; Zhang, C.; Kou, L.; Zhou, Q. Effects of Climate and Land Use Changes on Water Resources in the Taoer River. Adv. Meteorol. 2017, 2017, 1–13. [Google Scholar] [CrossRef] [Green Version]
  16. Wang, Q.; Xu, Y.; Xu, Y.; Wu, L.; Wang, Y.; Han, L. Spatial hydrological responses to land use and land cover changes in a typical catchment of the Yangtze River Delta region. Catena 2018, 170, 305–315. [Google Scholar] [CrossRef]
  17. Walvoord, M.A.; Kurylyk, B.L. Hydrologic Impacts of Thawing Permafrost-A Review. Vadose Zone J. 2016, 15, 1–20. [Google Scholar] [CrossRef]
  18. Duan, L.; Man, X.; Kurylyk, B.; Cai, T.; Li, Q. Distinguishing streamflow trends caused by changes in climate, forest cover, and permafrost in a large watershed in northeastern China. Hydrol. Process. 2017, 31, 1938–1951. [Google Scholar] [CrossRef]
  19. Connon, R.F.; Quinton, W.L.; Craig, J.; Hayashi, M. Changing hydrologic connectivity due to permafrost thaw in the lower Liard River valley, NWT, Canada. Hydrol. Process. 2014, 28, 4163–4178. [Google Scholar] [CrossRef]
  20. Lingxue, Y.U.; Shuwen, Z.; Tingxiang, L.; Junmei, T.; Kun, B.U.; Jiuchun, Y. Spatio-temporal Pattern and Spatial Heterogeneity of Ecotones Based oh Land Use Types of Southeastern da Hinggan Mountains in China. Chin. Geogr. Sci. 2015, 25, 184–197. [Google Scholar]
  21. Xia, T.; Wu, W.; Zhou, Q.; Verburg, P.H.; Yu, Q.; Yang, P.; Ye, L. Model-based analysis of spatio-temporal changes in land use in Northeast China. J. Geogr. Sci. 2015, 26, 171–187. [Google Scholar] [CrossRef]
  22. Beck, I.; Ludwig, R.; Bernier, M.; Lévesque, E.; Boike, J. Assessing Permafrost Degradation and Land Cover Changes (1986-2009) using Remote Sensing Data over Umiujaq, Sub-Arctic Québec. Permafr. Periglac. Process. 2015, 26, 129–141. [Google Scholar] [CrossRef] [Green Version]
  23. Baltzer, J.L.; Veness, T.; Chasmer, L.E.; Sniderhan, A.E.; Quinton, W.L. Forests on thawing permafrost: Fragmentation, edge effects, and net forest loss. Glob. Chang. Biol. 2014, 20, 824–834. [Google Scholar] [CrossRef]
  24. Yu, Z.; Sun, G.; Cai, T.; Hallema, D.W.; Duan, L. Water Yield Responses to Gradual Changes in Forest Structure and Species Composition in a Subboreal Watershed in Northeastern China. Forests 2019, 10, 211. [Google Scholar] [CrossRef] [Green Version]
  25. Yu, Z.; Man, X.; Duan, L.; Cai, T. Assessments of Impacts of Climate and Forest Change on Water Resources Using SWAT Model in a Subboreal Watershed in Northern da Hinggan Mountains. Water 2020, 12, 1565. [Google Scholar] [CrossRef]
  26. Jin, H.; Sun, G.; Yu, S.; Jin, R.; He, R. Symbiosis of marshes and permafrost in Da and Xiao Hinggan Mountains in northeastern China. Chin. Geogr. Sci. 2008, 18, 62–69. [Google Scholar] [CrossRef]
  27. Jiyuan, L.; Mingliang, L.; Xiangzheng, D.; Dafang, Z.; Zengxiang, Z.; Di, L. The land use and land cover change database and its relative studies in China. J. Geogr. Sci. 2002, 12, 275–282. [Google Scholar] [CrossRef]
  28. Zhao, W.J.; Sun, W.; Li, Z.L.; Fan, Y.W.; Song, J.S.; Wang, L.R. A Review on SWAT Model for Stream Flow Simulation. Adv. Mater. Res. 2013, 726-731, 3792–3798. [Google Scholar] [CrossRef]
  29. Duan, L.; Cai, T. Quantifying Impacts of Forest Recovery on Water Yield in Two Large Watersheds in the Cold Region of Northeast China. Forrsts 2018, 9, 392. [Google Scholar] [CrossRef] [Green Version]
  30. Zhang, Y.; Guan, D.; Jin, C.; Wang, A.; Wu, J.; Yuan, F. Impacts of climate change and land use change on runoff of forest catchment in northeast China. Hydrol. Process. 2012, 28, 186–196. [Google Scholar] [CrossRef]
  31. Stone, L.E.; Fang, X.; Haynes, K.M.; Helbig, M.; Pomeroy, J.W.; Sonnentag, O.; Quinton, W.L. Modelling the effects of permafrost loss on discharge from a wetland-dominated, discontinuous permafrost basin. Hydrol. Process. 2019, 33, 2607–2626. [Google Scholar] [CrossRef]
  32. Jin, H.; Yu, Q.; Lü, L.; Guo, D.; He, R.; Yu, S.; Sun, G.; Li, Y. Degradation of permafrost in the Xing’anling Mountains, northeastern China. Permafr. Periglac. Process. 2007, 18, 245–258. [Google Scholar] [CrossRef]
  33. Ding, Y.; Ren, G.; Zhao, Z.; Xu, Y.; Luo, Y.; Li, Q.; Zhang, J. Detection, causes and projection of climate change over China: An overview of recent progress. Adv. Atmos. Sci. 2007, 24, 954–971. [Google Scholar] [CrossRef]
  34. Ma, X.; Xu, J.; Luo, Y.; Aggarwal, S.P.; Li, J. Response of hydrological processes to land-cover and climate changes in Kejie watershed, south-west China. Hydrol. Process. 2009, 23, 1179–1191. [Google Scholar] [CrossRef]
  35. Malagò, A.; Pagliero, L.; Bouraoui, F.; Franchini, M. Comparing calibrated parameter sets of the SWAT model for the Scandinavian and Iberian peninsulas. Hydrol. Sci. J. 2015, 60, 1–19. [Google Scholar] [CrossRef] [Green Version]
  36. Fu, Q.; Shi, R.; Li, T.; Sun, Y.; Liu, N.; Cui, S.; Hou, R. Effects of land-use change and climate variability on streamflow in the Woken River basin in Northeast China. River Res. Appl. 2019, 35, 121–132. [Google Scholar] [CrossRef]
  37. Arnold, J.G.; Moriasi, D.N.; Gassman, P.W.; Abbaspour, K.C.; White, M.J.; Srinivasan, R.; Santhi, C.; Harmel, R.D.; van Griensven, A.; Van Liew, M.W.; et al. SWAT: Model Use, Calibration, and Validation. Trans. ASABE 2012, 55, 1491–1508. [Google Scholar] [CrossRef]
  38. Guo, J.; Su, X. Parameter sensitivity analysis of SWAT model for streamflow simulation with multisource precipitation datasets. Hydrol. Res. 2019, 50, 861–877. [Google Scholar] [CrossRef] [Green Version]
  39. Moriasi, D.; Gitau, M. Hydrologic and Water Quality Models: Performance Measures and Evaluation Criteria. Trans. ASABE 2015, 58, 1763–1785. [Google Scholar] [CrossRef] [Green Version]
  40. Weber, A.; Fohrer, N.; Möller, D. Long-term land use changes in a mesoscale watershed due to socio-economic factors—Effects on landscape structures and functions. Ecol. Model. 2001, 140, 125–140. [Google Scholar] [CrossRef]
  41. Li, Q.; Wei, X.; Zhang, M.; Liu, W.; Fan, H.; Zhou, G.; Giles-Hansen, K.; Liu, S.; Wang, Y. Forest cover change and water yield in large forested watersheds: A global synthetic assessment. Ecohydrology 2017, 10, e1838. [Google Scholar] [CrossRef]
  42. Alibuyog, N.R.; Ella, V.B.; Reyes, M.R.; Srinivasan, R.; Dillaha, T. Predicting the effects of land use change on runoff and sediment yield in manupali river subwatersheds using the SWAT model. Int. Agric. Eng. J. 2009, 18, 15. [Google Scholar]
  43. Robitu, M.; Musy, M.; Inard, C.; Groleau, D. Modeling the influence of vegetation and water pond on urban microclimate. Sol. Energy 2006, 80, 435–447. [Google Scholar] [CrossRef]
  44. Sun, L.; Song, C. Evapotranspiration from a freshwater marsh in the Sanjiang Plain, Northeast China. J. Hydrol. 2008, 352, 202–210. [Google Scholar] [CrossRef]
  45. Liao, X.; Liu, Z.; Wang, Y.; Jin, J. Spatiotemporal variation in the microclimatic edge effect between wetland and farmland. J. Geophys. Res. Atmos. 2013, 118, 7640–7650. [Google Scholar] [CrossRef]
  46. Ye, B.; Zhang, Y.; Zhang, S.; Li, Y.; Chang, L. Effect of Landcover Change in Neijiang Watershed on Runoff Volume. Bull. Soil Water Conserv. 2003, 23, 15–18. [Google Scholar] [CrossRef]
  47. Lee, S.; Yeo, I.-Y.; Lang, M.W.; Sadeghi, A.M.; McCarty, G.W.; Moglen, G.E.; Evenson, G.R. Assessing the cumulative impacts of geographically isolated wetlands on watershed hydrology using the SWAT model coupled with improved wetland modules. J. Environ. Manag. 2018, 223, 37–48. [Google Scholar] [CrossRef] [PubMed]
  48. Wu, Y.; Zhang, G.; Rousseau, A.N.; Xu, Y.J. Quantifying streamflow regulation services of wetlands with an emphasis on quickflow and baseflow responses in the Upper Nenjiang River Basin, Northeast China. J. Hydrol. 2020, 583, 124565. [Google Scholar] [CrossRef]
  49. Yunyun, L.; Jianxia, C.; Yimin, W.; Wenting, J.; Xia, B. Spatiotemporal responses of runoff to land use change in Wei River Basin. Trans. Chin. Soc. Agric. Eng. 2016, 32, 232–238. [Google Scholar]
  50. Chunling, Z.; Zhongbo, Y.; Chuanguo, Y.; Qin, J. Modeling of Hydrologic Responses on Extreme Land Cover Scenarios. Acta Sci. Nat. Univ. Sunyatseni 2011, 50, 127–133. [Google Scholar]
  51. Farley, K.A.; Jobbagy, E.G.; Jackson, R.B. Effects of afforestation on water yield: A global synthesis with implications for policy. Glob. Chang. Biol. 2005, 11, 1565–1576. [Google Scholar] [CrossRef]
  52. Wang, S.; Kang, S.; Zhang, L.; Li, F. Modelling hydrological response to different land-use and climate change scenarios in the Zamu River basin of northwest China. Hydrol. Process. 2007, 22, 2502–2510. [Google Scholar] [CrossRef]
  53. Mwangi, H.M.; Julich, S.; Patil, S.; McDonald, M.A.; Feger, K.-H. Modelling the impact of agroforestry on hydrology of Mara River Basin in East Africa. Hydrol. Process. 2016, 30, 3139–3155. [Google Scholar] [CrossRef] [Green Version]
  54. Bruijnzeel, L. Hydrological functions of tropical forests: Not seeing the soil for the trees? Agric. Ecosyst. Environ. 2004, 104, 185–228. [Google Scholar] [CrossRef]
  55. Neave, M.; Abrahams, A.D. Vegetation influences on water yields from grassland and shrubland ecosystems in the Chihuahuan Desert. Earth Surf. Process. Landf. 2002, 27, 1011–1020. [Google Scholar] [CrossRef]
  56. Harwell, G.; Stengel, V.G.; Bumgarner, J.R. Simulation of streamflow and the effects of brush management on water yields in the Double Mountain Fork Brazos River watershed, western Texas 1994–2013. In Scientific Investigations Report; US Geological Survey: Reston, VA, USA, 2016; p. 50. [Google Scholar]
  57. Turnbull, L.; Wainwright, J.; Brazier, R.E. Changes in hydrology and erosion over a transition from grassland to shrubland. Hydrol. Process. 2009, 24, 393–414. [Google Scholar] [CrossRef] [Green Version]
  58. Li, G.; Zhang, F.; Jing, Y.; Liu, Y.; Sun, G. Response of evapotranspiration to changes in land use and land cover and climate in China during 2001–2013. Sci. Total. Environ. 2017, 596-597, 256–265. [Google Scholar] [CrossRef]
  59. Sun, Z.; Wei, B.; Su, W.; Shen, W.; Wang, C.; You, D.; Liu, Z. Evapotranspiration estimation based on the SEBAL model in the Nansi Lake Wetland of China. Math. Comput. Model. 2011, 54, 1086–1092. [Google Scholar] [CrossRef]
  60. Wu, Y.; Zhang, G.; Rousseau, A.N.; Xu, Y.J. Foulon, Étienne on how wetlands can provide flood resilience in a large river basin: A case study in Nenjiang river Basin, China. J. Hydrol. 2020, 587, 125012. [Google Scholar] [CrossRef]
  61. Liu, Z.; Lu, X.; Yonghe, S.; Zhike, C.; Wu, H.; Zhao, Y. Hydrological Evolution of Wetland in Naoli River Basin and its Driving Mechanism. Water Resour. Manag. 2012, 26, 1455–1475. [Google Scholar] [CrossRef]
  62. Ahmed, F. Influence of Wetlands on Black-Creek Hydraulics. J. Hydrol. Eng. 2017, 22, D5016001. [Google Scholar] [CrossRef]
  63. Bullock, A.; Acreman, M. The role of wetlands in the hydrological cycle. Hydrol. Earth Syst. Sci. 2003, 7, 358–389. [Google Scholar] [CrossRef] [Green Version]
  64. Jones, J.A.A. Soil piping and catchment response. Hydrol. Process. 2010, 24, 1548–1566. [Google Scholar] [CrossRef]
  65. Zhang, Q.; Gu, X.; Singh, V.P.; Xu, C.-Y.; Kong, D.; Xiao, M.; Chen, X. Homogenization of precipitation and flow regimes across China: Changing properties, causes and implications. J. Hydrol. 2015, 530, 462–475. [Google Scholar] [CrossRef]
  66. Duan, L.; Man, X.; Kurylyk, B.L.; Cai, T. Increasing Winter Baseflow in Response to Permafrost Thaw and Precipitation Regime Shifts in Northeastern China. Water 2017, 9, 25. [Google Scholar] [CrossRef] [Green Version]
Figure 1. Location and distribution of hydrometeorological stations and landcover in 1980 (baseline year) in the study area.
Forests 12 01021 g001
Figure 2. Comparison between simulated and measured monthly runoff in calibration and validation period.
Forests 12 01021 g002
Figure 3. Scatter plots of the simulated and observed values during the calibration and validation.
Forests 12 01021 g003
Figure 4. Land-use types in the Tahe River Basin in different years.
Forests 12 01021 g004
Figure 5. Simulation of annual runoff under extreme land-use scenarios.
Forests 12 01021 g005
Figure 6. Simulation of monthly runoff under extreme land-use scenarios.
Forests 12 01021 g006
Figure 7. Variation in the rate of monthly runoff in future scenarios.
Forests 12 01021 g007
Table 1. Land-use scenarios in the Tahe River Basin.
ScenarioLand Use (Period)Range of Climate Data
historicalscenario 1(1980)1975–2016
scenario 2(1995)1975–2016
scenario 3(2015)1975–2016
extremescenario 4slope < 10° is wetland; slope > 10° is forestland1996–2016
scenario 5grassland1996–2016
scenario 6forestland1996–2016
scenario 7shrubland1996–2016
futurescenario 8shrubland to forestland1996–2016
scenario 9shrubland to wetland1996–2016
Note: Future scenarios were based on land use in 2015; except for shrublands, other land-use types were unchanged.
Table 2. Sensitivity analysis and value range of SWAT model parameters in Tahe River Basin.
NameSensitivity RankingCalibration MethodMinimumMaximumBest Value
CN21R−1.01.00.5920
ALPHA_BNK2V0.01.00.2958
ESCO3V0.01.00.7003
SOL_AWC4R−0.50.5−0.3520
GW_DELAY5V0.0500.0499.2500
ALPHA_BF6V0.01.00.9895
HRU_SLP7R−0.50.50.0037
GWQMN8V0.01000.042.2500
CH_K29V5.0150.0148.4250
SOL_K10R−0.240.25−0.0857
Note: The calibration methods R and V in the table represent the initial value × (1 + calibration value) and replace the initial value, respectively.
Table 3. Evaluation of monthly runoff simulation results of SWAT Model in Tahe River Basin.
NSER2PBIASStreamflow/(m3/s)
ObservedSimulated
calibration0.780.79−0.149.0349.08
validation0.720.74−1.952.6753.68
Table 4. Land-use change in the Tahe River Basin.
Land Use Type198019952015Change from 1980–1995 (km2)Change from 1995–2015 (km2)
Area (km2) Proportion (%)Area (km2)Proportion (%)Area (km2)Proportion (%)
cropland23.450.3637.180.5619.440.3013.73−17.74
forestland5030.5176.434636.1670.444874.5874.06−394.36238.43
shrubland951.1114.451312.0019.93352.685.36360.89−959.32
grassland272.474.14286.714.36144.702.2014.23−142.00
water1.340.021.500.0223.300.350.1621.80
residential14.110.2120.620.3127.450.426.516.83
wetland288.404.38287.234.361139.7017.32−1.17852.46
unused0.460.010.460.010.000.000.00−0.46
Table 5. Variation of simulated runoff for different years.
Land Use PeriodMean Annual Runoff (mm)Change in Runoff (mm)Rate of Change Rate (%)
1980249.87
1995255.085.22.08
2015261.8711.994.80
Table 6. Simulated annual mean runoff and its rate of change in future scenarios.
Land Use (Period)Mean Annual Runoff (mm)Change in Runoff (mm)Rate of Change Rate (%)
(2015)267.49
shrub to forestland259.30−8.19−3.06
shrub to wetland262.90−4.58−1.71
Publisher’s Note: MDPI stays neutral with regard to jurisdictional claims in published maps and institutional affiliations.

