Article

Relation between Energy Efficiency and GHG Emissions in Drying Units Using Forest Biomass

by
Débora Luana Pasa
1,*,
Luana Dessbesell
2,
Jorge Antonio de Farias
1 and
Dionatan Hermes
3
1
Department of Forest Sciences, Federal University of Santa Maria-UFSM, Santa Maria 59464, RS, Brazil
2
Ecole Polytechnique de Montreal, EPM, Quebéc, QC H2Y1B5, Canada
3
Japan Tobacco International (JTI) Sector of ADET—World Center for Research, Development, Training and Extension, Santa Cruz do Sul 96810, RS, Brazil
*
Author to whom correspondence should be addressed.
Forests 2021, 12(8), 1056; https://doi.org/10.3390/f12081056
Submission received: 19 May 2021 / Revised: 21 June 2021 / Accepted: 24 June 2021 / Published: 9 August 2021

Abstract

:
The impacts of climate change are inevitable and driven by increased levels of greenhouse gases (GHG) in the atmosphere, requiring mitigation and re-adaptation measures. In this context, this article critically analyzes the influence of drying technology type, forest biomass, and GHG emissions resulting from the energy required for drying agricultural crops, by presenting a case study of tobacco drying. In this study, the influence of increasing the technological level of drying unit (curing units CUs), using E. saligna and E. dunnii firewood and Pinus sp. pellets, was evaluated; considering consumption efficiency, energy efficiency, and concentration of gas emissions (CO, CO2, CXHY and NOX), as well as emission factors in tCO₂-eq. The results showed that when increasing the technological level of the CUs, there is a decrease in fuel consumption and emissions. The reduction can reach 60.28% for the amount of biomass consumed and 67.06% in emissions in tCO₂-eq; for the scenario of a production crop, using a CU with a continuous load (Chongololo) and firewood from E. dunnii. The use of pellets proved to be efficient, with the lowest consumption of biomass and emissions with more technological CUs.

1. Introduction

Climate change brings a series of implications for various sectors of society, requiring mitigation and re-adaptation measures capable of minimizing the risks involved [1], and with energy efficiency and greenhouse gas (GHG) reduction being the most significant challenges for humanity [2]. Hence, sustainability strategies need to be implemented by all sectors and emphasizing aspects that contribute to the new concept of a green economy or low carbon economy, which focuses on minimizing socio-environmental impacts and is sustained by three pillars: low carbon intensity, efficiency in the use of natural resources, and being socially inclusive [3].
Brazil’s vulnerability to climate change, due to its continental dimensions and regional differences of a geographic and socioeconomic nature, makes the country’s contribution to the global effort to reduce GHG emissions essential to guarantee the security and well-being of the population. Brazil signed the Paris Agreement in 2015, pledging to develop policies seeking sustainable development following the three pillars of a low carbon economy. Brazil is committed to reducing greenhouse gas emissions by 37% by 2025 and by 43% by 2030. For this, the country must increase the share of sustainable bioenergy in its energy matrix by approximately 18% by 2030 [4].
In view of these commitments, the public, private sector, and society itself jointly have the responsibility for leading efforts to reduce GHG emissions and develop the construction of a low carbon economy that involves all productive sectors and aiming at sustainability. Among the sectors that stand out, the agriculture and forest-based sectors are key actors in implementing low-carbon economy systems. Brazil is a country that produces primary raw materials, such as wood and grains. Agriculture was responsible for 21.4% of Brazilian national GDP in 2019 [5], and the planted forest sector represented 1.3% of Brazilian GDP and 6.9% of industrial GDP in 2019 [6].
The Brazilian forestry sector has become prominent for initiatives to reduce carbon emissions. The 7.83 million hectares of planted trees capture 1.70 billion tons of CO₂-eq from the atmosphere [6]. The forestry sector is renewable at its core; where its potential to mitigate climate change is directly proportional to creating and taking advantage of carbon market mechanisms. In addition to removals and carbon stocks from planted trees, the sector generates and maintains carbon reserves in the order of 2.5 billion tons of CO₂-eq and 5.6 million hectares in the form of conservation native forest areas.
A study carried out in the state of Uttarakhand, India showed that different forms of forest can significantly affect the amount of carbon in the soil. For the region, the authors found a greater amount of soil carbon in Abies pindrow forests, with 128.54 t ha−1 [7]. Pure forest stands with Cedrus deodara species, occurring in the Western Himalayas, also have a great potential for carbon retention in biomass and soil, ranging between 545 t ha−1 and 330 t ha−1, thus helping to mitigate climate change. These studies help policy makers and environmentalists to take preventive measures and promote forest species that can sequester more carbon [8].
Consequently, several types of climate benefits characterize the sector’s potential: removal and storage of carbon by natural and planted forests, the emissions avoided by the use of renewable sources such as biomass, and carbon stocks in wood products.
Given the opportunity for forestry biomass to balance environmental impacts and the importance of agriculture for the economy, this article focuses on a case study for tobacco farming in Brazil; a crucial income source for small farmers in the South of the country. Most farms manage their land in mosaics, interlarding native forests, tobacco, and planted forests, including the agrosilvopastoral system. In this context, the forestry sector is directly inserted into tobacco farming systems to supply planted forest biomass as an energy source for drying Virginia-type tobacco, which is the most planted species in Brazil [9].
Even if conducted with renewable energy through planted forest biomass, tobacco drying is one of the main generators of polluting gases in this production chain. This is due to the combustion necessary to transfer thermal energy into producing heat for drying the tobacco leaves [10]. Particles and gases derived from incomplete combustion are among the main environmental and health problems, reinforcing the need to study the relationship between biofuel consumption and GHG emissions. Currently, some studies allow verifying how pollutant gas emissions behave with the use of firewood in grain drying [11,12] and the importance of using forest biomass in the energy generation process, both with the use of firewood [13,14] and pellets [15,16]. However, to the best of our knowledge, the combination of the technological level of drying units with the type of biomass consumed, the resultant biomass consumption, and GHG emissions have not been addressed.
One of the biggest challenges in agroforestry systems is maintaining a constant increase in production sustainably. This challenge arises in the midst of debates and social pressures for a new development model that can reconcile economic growth and environmental conservation, while increasing the resilience of production systems and reducing GHG emissions. For example, for most tobacco companies, sustainability pledges are based on the Paris Agreement. According to JTI (Japan Tobacco International), the journey towards a zero-carbon future will be achieved by increasing the use of energy from renewable sources, while continually looking for innovative ways to achieve and exceed the goal of reducing absolute GHG emissions [17].
Hence, in addition to biomass, drying structures, or so-called curing units (CU), can significantly influence combustion efficiency and gas emissions. The gain in technology can maximize the use of biofuels and the efficiency of the curing process. It should be noted that investing in climate adaptation is not only an environmental decision but also an economic one, as investments will be affected by climate change due to the need to redirect capital towards clean energy technologies that will survive in the future, and aiming at guaranteeing the competitiveness of countries, companies, and the product itself.
This paper seeks to increase the knowledge regarding a low carbon economy in the agricultural sector that relies on forest biomass for energy. The methodology presented here can serve other sectors for measuring the carbon intensity (or carbon footprint) of drying processes. Furthermore, we provide recommendations for supporting a more sustainable tobacco production in the case study context.
From this perspective, this article aims specifically to define which types of forest biomass are more energy-efficient, supporting the reduction of GHG, while linking this factor to the technological advancement of drying units in Brazil. Thus, it was possible to verify how the different scenarios affect energy consumption and GHG emissions, and how much these changes achieve the Paris Agreement’s goals.

2. Materials and Methods

This section initially presents the characterization of the drying units and the type of biomass used in the process.
Subsequently, the analysis is delimited according to the objectives to be presented, namely: consumption efficiency and energy efficiency in the use of forest biomass. Pollutant gas emissions and corresponding emission factors are then identified for each curing unit evaluated, presented in the form of carbon equivalent for each type of biomass. The scenarios of the different curing units with the different biomasses were taken into consideration, extrapolating the values for a tobacco production crop (2020/2021).

2.1. Drying Units

The analyzed drying units (drying/curing units: CU) can be found throughout Brazil’s tobacco-growing regions. For this study, four CU types were taken into account, all being technologically distinct from each other (Table 1 and Figure 1). The basic tobacco drying scenario uses firewood in conventional curing units, which is the CU with the lowest technological level. The number of drying units presented corresponds to 9.79% of the total units used by the sector, 159,000 drying units in total for 114,000 Virginia-type tobacco growers [18].

2.2. Biomass Types

Three different forest biomass sources were investigated: firewood of Eucalyptus dunnii Maiden and Eucalyptus saligna Smith, and pellets of Pinus sp. Eucalyptus firewood is the most affordable biomass and commonly used in tobacco production [19]. Pellets are less employed in tobacco drying because this requires adaptation of the CUs. Nevertheless, pellets allow the use of the forest residues available in the region and therefore have an important role in research on energy efficiency and GHG emissions.

2.3. Analysis and Characterization

2.3.1. Biomass Characterization

The chemical analysis was performed using the ASTM D-143 standard, for moisture content, basic wood density, lignin content, ash content, superior heating value, and energy density.

2.3.2. Biomass Consumption

The verification of biomass consumption was carried out by measuring the biomass in cubic meters and weighing the biomass used during the tobacco drying cycle (168 h on average).

2.3.3. Energy Efficiency

The calculation of the energy efficiency followed a methodology adopted by Campos [11]. The energy from the fuel used to heat the air inside the curing unit was determined by Equation (1):
EPC =   QC   ×   PCI
  • where:
  • EPC = energy from the fuel, kJ;
  • QC = amount of fuel, kg;
  • PCI = lower calorific value of fuel, kJ.kg−1.
To determine the calorific value of the firewood, Equation (2) [20] was used:
PCI = PCS − 0.0114 × PCS × UC%
  • where:
  • PCI = lower calorific value of fuel, kJ.kg−1;
  • PCS = fuel superior calorific power, kJ.kg−1;
  • UC = fuel moisture content, % b.u. (35%).
The drying energy efficiency, the amount of energy required to evaporate a unit of water mass from the product, was obtained as follows (Equation (3)).
EEs = EPC   ( M 1 Mf )
  • where:
  • EEs = energy efficiency related to drying, kJ.kg−1;
  • EPC = energy consumed in the form of fuel, kJ;
  • Mi = initial product mass, kg; and
  • Mf = final product mass, kg.

2.3.4. GHG Quantification

For the quantification of chimney gas emissions, gas concentrations in smoke were measured, in mg/m3 and percentage, using a chimney gas analyzer model Chemist 500× Seitron. The gases analyzed were carbon monoxide (CO), carbon dioxide (CO2), nitrous oxide (NOx), and hydrocarbons (CxHy). Measurements were taken for one hour, obtaining samples every 10 s, totaling 360 samples. Data collected in the field was transferred to a computer using the equipment’s software and analyzed in an Excel spreadsheet.

2.3.5. Emission Factors

An emission factor represents the amount of mass emitted from a gas when one kilogram of dry biomass is consumed in combustion; that is, it is a pollution indicator that expresses the relationship between the amount of pollution produced and the amount of material processed. This factor is expressed as the ratio between the pollutant’s weight and a unit of weight or volume [21]. The emission factor (FEX) was calculated according to Equation (4) [21,22], considering g/kg (grams of tobacco per kg of dry biomass burnt).
FEx = V chimney total m dry basis fuel   [   ] X   M X V X   [ g X kg dry basis fuel ]
  • where:
  • Vchimney − total = total volume of gases flowing through the chimney (m3);
  • []X = average concentration of X (ppmv) at 8% oxygen [23];
  • MX = molar mass (g/mol);
  • M (dry − basis fuel) = mass of dry − basis fuel (kg);
  • Vx = molar volume of 1 mol at 0 °C and 1 atm (L/mol) (=0.0224 m3).
Emission factors in g/kg were transformed into tons of carbon equivalent according to Equation (5).
CO 2 eq = ( PAGt × GEEi )
  • where:
  • CO₂-eq = GHG emissions.
  • PAG = Global warming potential of gas i;
  • GEE = Mass of gas i; and,
  • i = greenhouse gas.

2.3.6. Firewood Consumption and Emissions Scenarios

JTI provided data for the scenario analysis, projecting them for the 2020/2021 tobacco production crop scenario. This represented 10,877 producers and 15,578 CUs, with an average tobacco production of 5700 kg per farmer or 3980 kg of dry tobacco per CU. For the consumption and emissions scenarios, results were projected considering the conversion of the technological base and biomass used in the drying process.
The results were evaluated by univariate statistical analysis (analysis of variance-ANOVA) and Tukey’s test of means. In all statistical analyses, a 5% probability was adopted, and the statistical software R was used.

3. Results and Discussions

3.1. Biomass Characterization

The desired characteristics of an “ideal” solid fuel are high calorific value, high wood density, and low ash and moisture content [24]. Furthermore, the energy density of wood can be considered one of the main characteristics of biomass, as it reveals the amount of energy per unit volume of a fuel [25]. Thus, the biomass with the highest energy density (DE) in this analysis was Pinus sp. pellets, followed by E. dunnii and E. saligna. It was possible to observe that the greater the wood density, the greater the DE, which encourages an interest in denser woods for burning. Pellets had a value of 0.70 g/cm3, much higher than any kind of firewood, and characteristic of the densification process. In Table 2, it is possible to verify the parameters analyzed for the firewood and pellets used in the combustion process.
A similar CV were found for wood chips (19.40 MJ/kg or 4633.61 kcal/kg), which have a higher CV compared to sunflower husk, oat husk, wheat straw, and hay, as assessed in the study of [26]. The wood chips presented 10.4 MJ/Kg (2484 kcal/kg) for the low calorific value and had 40% moisture [26]. In this research, the wood moisture ranged between 25–35%. In contrast, pellets have, in addition to a high density, a lower moisture value (8% b.u), which results in greater efficiency in the use of fuel energy.
The biomass constituents that most affected the calorific value were, in order of importance, lignin content, carbon content, and extractives content [27]. In Table 2, it is possible to observe the characteristics supporting pellets as the best energy source. A study by Welter [28] recommended pellets as an efficient energy source for crop drying, emphasizing the greater calorific power, lignin, and higher energy density compared to firewood.

3.2. Efficiency in Biomass Consumption

It was possible to notice that E. dunnii firewood showed a better performance for consumption efficiency, being 1.91 kg/kg of dry tobacco for continuous load CU and 2.03 kg/kg for forced air (Figure 2). The use of pellets achieved a 67.53% increase in efficiency in consumption compared to continuous load CU with E. dunnii firewood. The firewood consumption efficiency of E. saligna was on average 11.63% lower for the most technological CU, 6.87% for forced air, and only 0.21% for conventional CU, compared to E. dunnii firewood.
The Chongololo CU had the highest energy efficiency for firewood from E. dunnii and E. saligna, followed by the forced air CU. The core furnace systems of the CUs discussed above were similar. They comprise hot air generated in the combustion chamber circulating through the structure, where the product is placed for drying, circulation being activated by a fan that pulls and directs hot air through tobacco leaves returning to the heating zone by a difference of pressure. An air injection system allows more oxygen to enter the combustion process, which reacts directly with the fuel and slows down the furnace supply, making the biomass combustion more efficient.
It is also evident that the efficiency of biomass consumption is directly related to the tobacco’s weight (its moisture content) and the installed capacity of the CU. As the weight of tobacco increases, the kg of biomass per kg of dry tobacco ratio decreases, as seen in Table A1 in Appendix A. The Chongololo CU-type has 55.60% more installed capacity than forced air; thus it has a higher consumption of firewood per cycle. However, with greater capacity, the drying process and efficiency are optimized.
A study carried out on a forced air curing unit of tobacco growers in southern Brazil, showed a consumption of Eucalyptus sp. firewood in the range of 3.96 kg per kg of tobacco [15], a value higher than that verified in this research. The curing unit capacity was not available in the study for comparison; however, the firewood moisture and forest species used may partially explain the difference in results.
In the same region, an Eucalyptus sp. firewood consumption of 2.71 kg per kg of tobacco was evidenced in a conventional CU, with capacity for 800 sticks per cycle [29]. It is noteworthy that the study in question was carried out in a CU with 37.5% more capacity than the CU used in this study, which had an average consumption of 3.3 kg/kg (Figure 2). This comparison demonstrates a possible relationship, whereby the same amount of firewood can dry a greater amount of tobacco and the energy that is spent for a single curing cycle can be optimized. The authors did not link firewood consumption to GHG emissions.
Nevertheless, Tippayawong et al. [30] remarked that the more efficientl use of wood in tobacco curing processes is necessary and that it is one of the ways to optimize this resource, since cured tobacco is grown in countries classified by the FAO as having a deficit, or a prospective deficit of firewood. On the other hand, Brazil is one of the leading countries globally in sustainable forest plantations [31]. The tobacco sector’s objective is to make each farmer self-sufficient in forest biomass, mainly firewood, without repercussions for native forests, with approximately 1 ha of trees supporting 2 hectares of cured tobacco (yield 2000 kg/ha).

3.3. Energy Efficiency

The combustion process’s energy efficiency (EE) is associated with the amount of energy necessary to dry one kg of product. The forced air CU was the most energy-efficient when considering a firewood biomass, consuming less energy to dry the same amount of tobacco, with 6762.78 kJ.kg−1 with E. dunnii firewood. The continuous load CU obtained a similar value of 7043.05 kJ.kg−1 for the same species (Figure 3).
Analyzing the EE in other agricultural systems using firewood, a value of 12,752 kJ·kg−1 was found for grain dryers [11]. In conventional tobacco greenhouses, the energy consumption with the use of firewood was 11,665.73 kJ·kg−1 and 8836.65 kJ·kg−1 for pellets [29], values higher than those found in this research. Both results were associated with the amount of biomass used per kg of dry product. More details on the data obtained in this study can be found in Appendix B.
Pellets presented the highest EE among the biomass types (Figure 3), even though the combustion process was carried out in an adapted conventional unit with a lower technological level. Therefore, one can expect an improved EE for pellets in more technological CUs.
The lower the EE value, the more efficient the drying of tobacco will be; that is, a greater removal of water from a larger amount of tobacco with the same amount of biomass used in the combustion process. The more fuel (forest biomass) is used in the process, the greater the energy expenditure for drying 1kg of tobacco is, due to the fact that the use of more fuel than necessary leads to a low consumption efficiency and an incomplete combustion process.

3.4. GHG Emissions

The quantitative analysis of residual gases from the combustion process in different CUs with the biomass types showed that the CU using pellets had the lowest gas concentrations (CO2 = 11.5%; CO = 954.99 mg/m3; CxHy = 0.15%), except for NOx (29.58 mg/m3) that was higher than the other CUs with firewood. The lower emissions of CO and CxHy indicate complete combustion. Among the CUs that employed firewood, the conventional type obtained the lowest concentration of emissions in mg/m3 of CO, CxHy, and NOx, both for E. dunnii (4679 mg/m3; 1.31% and 85, 12 mg/m3) and E. saligna (7230.73 mg/m3; 0.56% and 173.51 mg/m3), respectively (Appendix B).
The continuous load and forced air CUs had the highest concentrations of gases for the types of firewood analyzed, which is expected when incomplete combustion occurs (CO, CxHy, and NOx). This result may have been linked to the lack of homogenization between the air and fuel. The system’s fan allows air to enter under the furnace at high speed (3000 rpm), into the ashtray, stimulating smoke formation. There is a large air intake, which is good, but this air might be poorly distributed inside the furnace.
On the other hand, CO emissions were lower by 49.64% for the Chongololo CU using E. dunnii compared to E. saligna. Contrastingly, the CxHy and NOx emissions increased by 20% and 55.22%, respectively. For the forced air CU, the reduction was 28.84% for CO, 98.09% for CxHy, and 66.75% for NOx, (Appendix B). It is also evident that CxHy and NOx emissions were higher in the curing units when E. dunnii firewood was used, which can be explained by two potential reasons: the possible higher amount of nitrogen in E. dunnii compared to in E. saligna, and the combustion that may have occurred at higher temperatures. The formation of NOx depends on the combustion temperature, the flow between the fuel, and the moisture [32], and is formed by breaking the bonds of nitrogen present in the fuel and the reaction with O2 [33]. The emission curves of NOx and CO must be analyzed simultaneously, since the reduction of one pollutant can increase the formation of the other, as was also evidenced in this research [34].
The formation of NOx, CO, and CxHy can be reduced by acting directly on the process, from operational changes (excess air, dissipated power, flue gas recirculation) to substantial modifications, such as staging in the air or fuel supply.
In combustion chambers, where the residence time is short, the final concentrations of CO will be higher than in those large furnaces, where the time is longer [35]. Therefore, in chambers where the gas is retained longer, this gas is re-burned, reducing its concentration in the atmosphere. In this sense, it is worth mentioning that all the evaluated CUs have only one main chamber, where the gas goes directly to the heating pipes. Hence, implementing a blast system in the CU, or a second combustion chamber, can be an interesting modification, allowing the gas to leave the main chamber and pass to a second level, where the combustion can continue.
The gas velocity was higher in the continuous load CU and the forced air CU than in the others (Appendix B), mainly due to the high speed of the air entering the fan, which often drives the gas firing out of the furnace too quickly. Theoretically, if the gas outlet speed increases, the combustion chamber’s internal pressure decreases because more gas is coming out more quickly. Thus, the gases do not stay in the chamber long enough to be burned, causing higher emissions of polluting and particulate gases. Conversely, if the speed is reduced, the pressure inside the chamber tends to be higher, increasing the combustion process’s efficiency, as the gases are trapped and burn for longer.
Appendix B shows the mean and standard deviation of the concentration of gases emitted during the burning process of the biomass fuels studied.

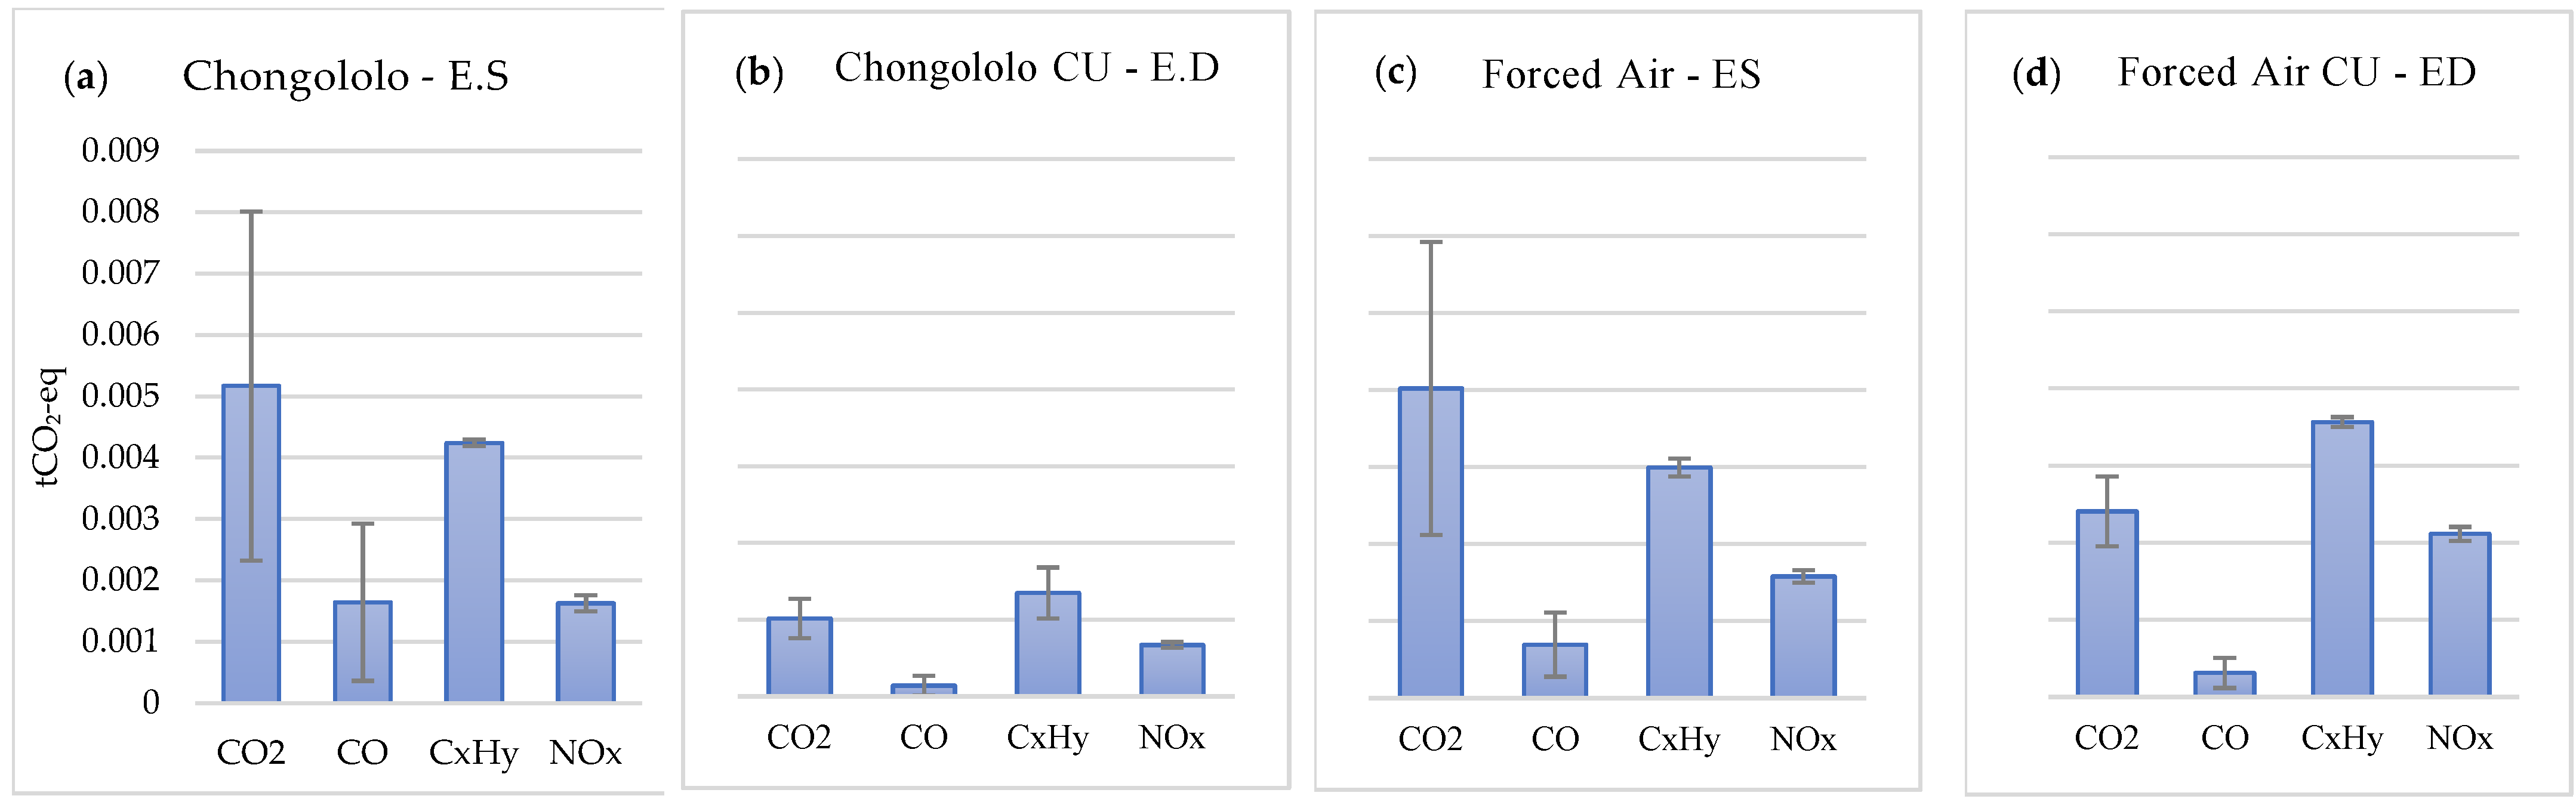
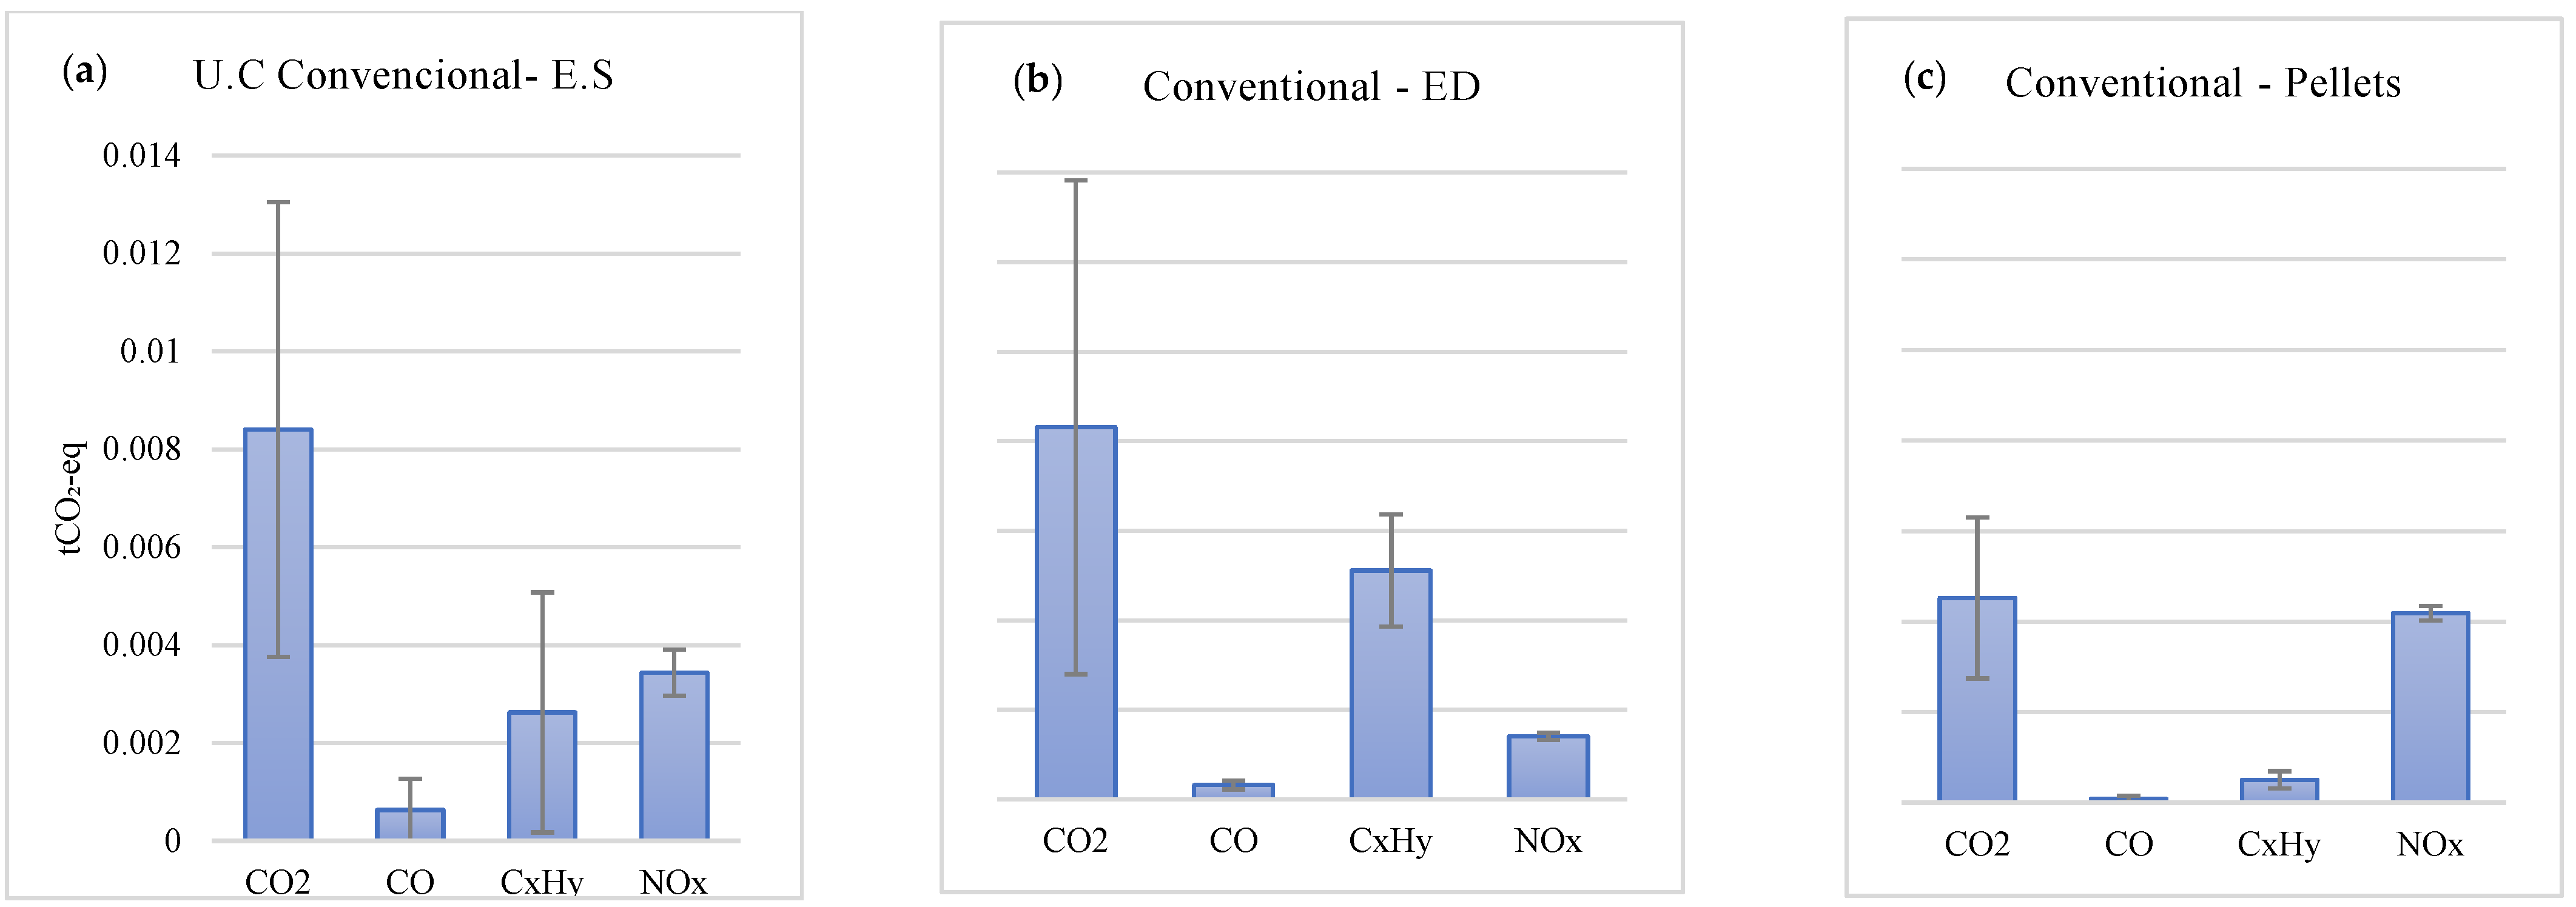
3.5. Emission Factor in Tons of Carbon Equivalent (tCO₂-eq)

In general, the continuous load CU showed the lowest emissions per kg of dried tobacco, totalling 0.004078 tCO₂-eq (Figure 4b). This value is still lower than for pellets, which resulted in 0.007755 tCO₂-eq (Figure 5c). It should be noted that the emissions concentrated in mg/m3 of gas were lower for pellets, as shown in item 3.3; however, because the Chongololo’s efficiency in biomass consumption is higher (lower ratio of kg of firewood per kg of dry tobacco), the emission factor per kg of biomass was also lower. Therefore, the efficiency in biomass consumption is strictly related to pollutant gas emissions. More information can be obtained in Table A3 in Appendix C and Figure 4 and Figure 5.

3.6. Scenarios

3.6.1. Efficiency in Forest Biomass Consumption

In relation to the base scenario of conventional PAs using E. saligna firewood, there was a reduction in firewood consumption of 41.21% when compared to the use of Chongololo PA and E. dunnii firewood type biomass. The reduction was even greater if pellets are used, even in adapted conventional PAs, with a reduction of 60.28% in the amount of biomass consumed, as shown in Table 3.
There was a clear difference in the amount of biomass consumed during the harvest when the scenario changed. However, the analysis of variance did not show a significant interaction between the factors “type of biomass” and “cure units”. Thus, the comparative test of means was performed analyzing each effect separately using the Tukey test at 95% probability. It was found that firewood from E. saligna and E. dunnii did not differ, but both differed from the pellets of Pinus sp. Among the curing units, only the conventional one differs from the others, as seen in Table 4.
Even though there was no significant difference between firewood from E. saligan and E. dunnii, and between the forced air and Chongololo CUs, it is evident that the reduction in consumption observed is a major step towards the implementation of a low carbon process. Improving the efficiency in the consumption of biomass, whether from firewood or pellets, is fundamental for reducing energy dependence, which increases the security of energy supplies and sustainability.

3.6.2. Emissions-tCO₂-eq

The change in technological base of the tobacco drying scenario, i.e., converting conventional CUs with E. saligna firewood to continuous-load CUs with E. dunnii firewood led to a 67.06% reduction in emissions in tCO₂-eq per kg of smoke. In addition, the transition of the technological base considering the use of Pinus sp. would result in a 37.15% reduction in emissions compared to conventional CUs with E. saligna firewood. Quantifications are presented in Table 5.
According to the Shapiro–Wilk test at 5% significance, the results are considered normal (p-value: 0.07823198). However, even with a reduction in emissions regarding the different scenarios, the analysis of variance did not show a significance between and within the factors (curing units and biomass). Hence, there was no significant difference between the means of the analyzed treatments.
It is noteworthy that the goal of reducing GHG emissions, ratified in the Paris Agreement in 2015 and pledged by the tobacco sector, would be surpassed with the implementation of a continuous load CU or with a change in the type of biomass in conventional curing units. It should be noted that this study is based only on technical and environmental considerations. The economic and social aspects should be analyzed together, in order to reach a complete recommendation regarding the implementation of these strategies. In addition, the emission calculations only took into account the biomass combustion process, not a comprehensive analysis of the production life cycle. Therefore, the firewood planting cycle, pellet production, and biomass logistics, for example, were outside the scope of this research.

4. Conclusions

The continuous load CU (Chongololo) using E. dunnii firewood can be considered the best scenario for reducing GHG emissions in the tobacco sector. This is the most effective technology with the highest tobacco drying capacity per hour, less biomass consumption, better energy efficiency, and less tCO₂-eq emitted per kg of tobacco. It is also evident that the use of Pinus sp. pellets in adapted conventional CUs obtained lower GHG concentrations in mg/m3 and can contribute even more to the improvement of results using more technological CUs. For the conditions of the study, a reduction between 60.28–41.21% in the consumption of forest biomass and 67.06–37.15% in carbon emissions (tCO₂-eq) can be obtained by combining the best CU technology with the best forest biomass.
Further studies are recommended on the economic analysis of the technological base conversion in addition to the environmental aspects presented here, as well as the social impacts, to enable the implementation of the most sustainable choice. In addition, it is suggested to perform a quantification of carbon intensity considering the entire supply chain form the acquisition of biomass used in the combustion process to the curing units, thus contributing to the effective implementation of a low-carbon activity.

Author Contributions

D.L.P.: Conceptualization, methodology, Formal analysis, Research, Writing—Original Draft, Writing—Review and Editing, Visualization. L.D.: Formal analysis, Visualization, Writing—Review and Editing, Supervision. J.A.d.F.: Supervision, Project Management, Financing Acquisition. D.H.: Validation, Supervision, Financing Acquisition. All authors have read and agreed to the published version of the manuscript.

Funding

This work was carried out with the support of the Coordination for the Improvement of Higher Education Personnel-Brazil (CAPES)-Financing Code 001.

Acknowledgments

We also thank the company JTI (Japan Tobacco International) for financial and logistical help in data collection.

Conflicts of Interest

The authors declare no conflict of interest.

Appendix A

Table A1. Detailed data of forest biomass types studied in the different curing units.
BiomassCUAnalysisBiomass QuantityCapacityDrying HoursGreen Tobacco CUDry Tobacco by CU (kg)kg/kg ¹EE 2 (kJ.kg)Cs 3 (kg/h)
E. salignaChongololo014397.17608,00168,0011,639.821988.162.218023.3469.28
024631.89608,00168,0011,639.821988.162.338451.6369.28
033806.87608,00168,0011,639.821988.161.916946.2469.28
Average4278.64608,00168,0011,639.821988.162.157807.0769.28
DP425.090.000.000.000.000.21775.640.00
Forced Air012004.98270,00168,005556.53882.902.277555.1033.07
022244.77270,00168,005556.53882.902.548458.6733.07
031532.05270,00168,005556.53882.901.745773.0233.07
Average1927.27270,00168,005556.53882.902.187262.2633.07
DP362.660.000.000.000.000.411366.560.00
Conventional012508.48500,00168,005065.00765.003.2810,273.6830.15
022378.00500,00168,005065.00765.003.119739.2930.15
032577.16500,00168,005065.00765.003.3710,554.9730.15
Average2487.88500,00168,005065.00765.003.2510,189.3230.15
DP101.170.000.000.000.000.13414.330.00
E. dunniiChongololo014712.00608,00168,0011,639.821988.162.378608.4468.04
023345.40608,00168,0011,639.821988.161.685046.4183.24
033345.40608,00168,0011,639.821988.161.685098.9983.24
Average3800.93608,00168,0011,639.821988.161.916251.2878.17
DP789.010.000.000.000.000.322041.538.78
Forced Air011586.68270,00168,005556.53882.901.806996.5228.59
021893.36270,00168,005556.53882.902.146953.8934.57
031904.10270,00168,005556.53882.902.166418.0338.16
Average1794.71270,00168,005556.53882.902.036789.4833.77
DP180.240.000.000.000.000.20322.394.83
Conventional012232.83500,00168,005065.00765.002.9211,086.3623.85
022583.08500,00168,005065.00765.003.3812,289.1427.00
032807.46500,00168,005065.00765.003.679070.9739.63
Average2541.13500,00168,005065.00765.003.3210,815.4930.16
DP289.60.000.000.000.000.381626.108.35
PelletsConventional01879.4500,00168,005065.00765.001.153700.8130.15
021185.00500,00168,005065.00765.001.554986.8830.15
03900500,00168,005065.00765.001.183787.5030.15
Average988.13500,00168,005065.00765.001.294158.4030.15
DP170.800.000.000.000.000.22718.790.00
¹ kg of firewood per kg of dry tobacco. 2 Energy efficiency. 3 Drying capacity.

Appendix B

Table A2. Oxygen as a reference.
BiomassCuring Unit O2CO2COCxHyNOxSpeed
%8%8% mg/m38%8% mg/m3m/s
E. salignaChongololoAverage15.811.5529,577.551.55140.5810.65
DP0.920.047451.800.3178.890.75
Forced AirAverage11.9210.0215,557.851.05130.867.9
DP4.361.375542.560.5184.80.19
ConventionalAverage14.2711.67230.730.56173.517.11
DP0.990.024711.870.4218.950.58
E. dunniiChongololoAverage13.3611.5414,896.031.86218.227.21
DP0.640.413037.961.3937.891.25
Forced AirAverage11.7711.6511,069.442.08291.37
DP3.412.281994.160.31105.980.77
ConventionalAverage12.9711.624679.001.3185.126.37
DP1.831.13841.490.6510.350.87
PelletsConventionalAverage16.6211.5954.990.15293.535.66
DP1.330.021029.020.1631.720.80
Where: O2 (oxygen). CO2 (carbon dioxide). CO (carbon monoxide). CxHy (Hydrocarbons). NOx (nitrous oxides).

Appendix C

Table A3. Emission factors in tonnes of carbon equivalent per kg of dried tobacco and per curing unit.
Biomass Curing Unit tCO₂-eq Per kg of Cured TobaccoSumtCO₂-eq Per Curing Unit
CO2COCxHyNOxCO2COCH4N2OTotaltCO₂-eq /kg Tobacco
E. salignaChongololoAverage0.0051690.0016440.0042400.0016280.0126819.0519692.7224402.2530414.31137518.3388250.009230
DP0.0028450.0012800.0000530.0001330.0043122.1135651.3329990.7405271.4170572.5267740.004125
Forced AirAverage0.0080470.0013890.0059910.0031630.0185895.2658110.8593940.8753351.6750238.6755630.011239
DP0.0038090.0008310.0002290.0001600.0050290.3911850.2318160.4349200.8322541.5444370.004618
ConventionalAverage0.0084040.0006310.0026250.0034350.0150955.3836250.3745470.9009001.7239448.3830160.010552
DP0.0046430.0006350.0024540.0004740.0082050.4406330.2463790.5015920.9598371.9584910.005212
E. dunniiChongololoAverage0.0020290.0002790.0026960.0013390.0063434.0701670.5604772.2752581.2758188.1817190.004078
DP0.0005100.0002620.0006640.0000770.0015120.5756030.3837380.3648340.6111851.9353610.006016
Forced AirAverage0.0048130.0006220.0071310.0042280.0167924.4453130.5740951.0474761.7138417.7807250.008423
DP0.0009060.0003930.0001240.0001800.0016030.4733950.3352190.2012040.6262601.6360780.009221
ConventionalAverage0.0083090.0003160.0051100.0014060.0151406.3471370.2415510.8662500.7549408.2098790.010748
DP0.0055180.0000980.0012540.0000850.0069540.7262160.0457400.4055110.0173141.1947810.003341
PelletsConventionalAverage0.0045230.0000850.0005050.0041850.0092983.5823980.0675170.8982601.5950126.1431870.007755
DP0.0017780.0000710.0001920.0001610.0022030.4302140.0367070.4075190.3479531.2223930.003401

References

  1. Nicolletti, X.M.; Lefèvre, G.B. Precificação de carbono no Brasil: Perspectivas e aprendizados a partir de uma simulação de mercado cap-and-trade. Cad. Adenauer XVII 2016, 2, 145–169. [Google Scholar]
  2. Zhao, Q.; Ding, S.; Wen, Z.; Toppinen, A. Energy Flows and Carbon Footprint in the Forestry-Pulp and Paper Industry. Forests 2019, 10, 725. [Google Scholar] [CrossRef] [Green Version]
  3. Pinsky, V.; Kruglianskas, I. Inovação tecnológica para a sustentabilidade: Aprendizados de sucessos e fracassos. Estud. Av. 2017, 31, 107–126. [Google Scholar] [CrossRef] [Green Version]
  4. Tolmasquim, M.T.; Gorini, R.; Matsumura, R.E.; Soares, J.B.; Oliveira, L.B.; Lisboa, M.L.V.; G. Faria, G.V.R.; Conde, R.M.; Moraes, N.G. The Brazilian Commitment to Combating Climate Change: Energy Production and Use; Empresa de Pesquisa Energética-EPE: Rio de Janeiro, Brazil, 2016; p. 96. [Google Scholar]
  5. Brasil, C.N.A. Confederação da Agricultura e Pecuária do Brasil—CNA PIB do Agronegócio; CNA: Arlington County, VA, USA, 2020; p. 18. [Google Scholar]
  6. Industria Brasileira de Árvores—IBÁ—Relatório 2019. 2019. Available online: https://iba.org/datafiles/publicacoes/relatorios/iba-relatorioanual2019.pdf (accessed on 10 October 2020).
  7. Kumar, A.; Sharma, M.P.; Taxak, A.K. Effect of vegetation communities and altitudes on the soil organic carbon stock in Kotilbhel-1A catchment, India. Soil Air Water 2017, 8, 1600650. [Google Scholar] [CrossRef]
  8. Sheikh, M.A.; Kumar, M.; Todaria, N.P.; Bhat, J.A.; Kumar, A.; Pandey, R. Contribution of Cedrus Deodara Forests for Climate Mitigation along Altitudinal Gradient in Garhwal Himalaya, India. Mitig. Adapt. Strateg. Glob. Chang. 2021, 26, 5. [Google Scholar] [CrossRef]
  9. Beling, R.R. Anuário Brasileiro do TABACO 2018; Editora Gazeta: Curitiba, Brazil, 2018; p. 69. [Google Scholar]
  10. Greff, H.P.; de Farias, J.A.; Schulte, T.F. Mercado de lenha voltado ao beneficiamento de grãos e tabaco na região central do Rio Grande Do Sul. Cad. Pesqui. 2015, 27, 16. [Google Scholar]
  11. Campos, A.T.; Saglietti, J.R.C.; Bueno, O.D.C.; Campos, A.T.D.; Klosowski, E.S.; Gasparino, E. Balanço energético na produção de feno de alfafa em sistema intensivo de produção de leite. Ciênc. Rural 2004, 34, 245–251. [Google Scholar] [CrossRef] [Green Version]
  12. Segura, M.A.; Andrade, H.J. Huella de carbono en cadenas productivas de café (Coffea arabica L.) con diferentes estándares de certificación en Costa Rica. Rev. Luna Azul 2012, 35, 18. [Google Scholar]
  13. Gomes, A.F.; Martins, M.A.; Pereira, E.G. Simulação computacional de dispositivos de mistura em câmara de combustão para gases de carbonização. Ciênc. Florest. 2019, 29, 673–684. [Google Scholar] [CrossRef] [Green Version]
  14. Pérez, J.F.; Graciano, D.S.; Gómez, J.A. Caracterización energética y emisiones de una estufa de cocción ecoeficiente con biomasa a diferentes altitudes. Ingeniería Mecánica. Ing. Mec. 2013, 16, 227–237. [Google Scholar]
  15. Dessbesell, L.; Farias, J.A.D.; Roesch, F. Complementing Firewood with Alternative Energy Sources in Rio Pardo Watershed, Brazil. Ciênc. Rural 2017, 47. [Google Scholar] [CrossRef] [Green Version]
  16. Hernandez Solorzano, L.C.; Forero Nuñez, C.A.; Sierra, F.E. Biomass Densification: A Review of the Market and Recent R&D Trends. TECCIENCIA 2017, 12, 81–92. [Google Scholar]
  17. Japan Tobacco JT Strengthens Commitment to Climate Action with Approved Science Based Target. 2020. Available online: https://www.jti.com/jt-strengthens-commitment-climate-action-approved-science-based-target (accessed on 5 January 2021).
  18. Associação dos Fumicultores do Brasil—Afubra Dados Sobre o Setor Tabacaleiro. 2020. Available online: https://afubra.com.br/fumicultura-brasil.html (accessed on 20 January 2021).
  19. de Farias, J.A. Atividade Florestal No Contexto da Fumicultura: Oportunidade de Desenvolvimento Regional, Diversificação, Geração de Emprego e Renda; Tese de Doutorado, Universidade Federal de Santa Maria: Santa Maria, Brazil, 2010. [Google Scholar]
  20. Osório, A.G.S. Projeto e Construção de Um Secador Intermitente de Fluxo Concorrente e Sua Avaliação Na Secagem de Café; Universidade Federal de Viçosa: Viçosa, Brazil, 1982; p. 57. [Google Scholar]
  21. Amorim, E.B. de Gases de Efeito Estufa Produzidos Pela Combustão de Biomassa; Universidade Estadual Paulista “Júlio de Mesquita Filho”: Guaratinguetá, Brazil, 2012. [Google Scholar]
  22. França, D.D.A.; Longo, K.M.; Neto, T.G.S.; Santos, J.C.; Freitas, S.R.; Rudorff, B.F.T.; Cortez, E.V.; Anselmo, E.; Carvalho, J.A. Pre-Harvest Sugarcane Burning: Determination of Emission Factors through Laboratory Measurements. Atmosphere 2012, 3, 164–180. [Google Scholar] [CrossRef] [Green Version]
  23. Conselho Nacional Do Meio Ambiente-CONAMA. Resolução No 436, de 22 de Dezembro de 2011. 2011. Available online: https://www.novaconcursos.com.br/blog/pdf/resolucao-436-2011.pdf (accessed on 20 January 2021).
  24. Purohit, A.N.; Nautiyal, A.R. Fuelwood Value Index of Indian Mountain Tree Species. Int. Tree Crops J. 1987, 4, 177–182. [Google Scholar] [CrossRef]
  25. Garcia, D.P.; Caraschi, J.C.; Ventorim, G. Caracterização energética de pellets de madeira. Rev. Madeira 2013, 24, 14–16. [Google Scholar]
  26. Roman, K.; Barwicki, J.; Hryniewicz, M.; Szadkowska, D.; Szadkowski, J. Production of Electricity and Heat from Biomass Wastes Using a Converted Aircraft Turbine AI-20. Processes 2021, 9, 364. [Google Scholar] [CrossRef]
  27. Foelkel, C. Utilização da Biomassa do Eucalipto para Produção de Calor, Vapor e Eletricidade. 2016. Available online: https://www.eucalyptus.com.br/eucaliptos/PT44_Geracao_Calor_Vapor_Eletricidade.pdf (accessed on 20 January 2021).
  28. Welter, C.A.; Farias, J.A.D.; Silva, D.A.D.; Rech, R.D.S.; Teixeira, D.D.S.; Pedrazzi, C. Consumption and Characterization of Forestry Biomass Used in Tobacco Cure Process. Floresta E Ambient. 2019, 26. [Google Scholar] [CrossRef]
  29. Welter, C.A. Uso da Biomassa Florestal Como Estratégia de Redução dos Gases de Efeito Estufa: Estudo de Caso na Fumicultura do Sul do Brasil; Universidade Federal De Santa Maria Centro De Ciências Rurais Programa De Pós-Graduação Em Engenharia Florestal: Santa Maria, Brazil, 2017. [Google Scholar]
  30. Tippayawon, N.; Tantakitt, C.; Thavornun, S. Investigation of Lignite and Firewood Co-Combustion in a Furnace for Tobacco Curing Application. Am. J. Appl. Sci. 2006, 3, 1775–1780. [Google Scholar] [CrossRef]
  31. Wang, J.; Zhang, Q.; Wei, Y.; Yang, G.; Wei, F. Integrated Furnace for Combustion/Gasification of Biomass Fuel for Tobacco Curing. Waste Biomass Valoriz. 2019, 10, 2037–2044. [Google Scholar] [CrossRef] [Green Version]
  32. Amaral, M.C.F. Estudo Sobre a Emissão de NOX por Turbinas a Gás. 2014; Volume 1, p. 71. Available online: http://www.uezo.rj.gov.br/tcc/cn/Maria-Carolina-Francisco-Amaral.pdf (accessed on 20 January 2021).
  33. Gioda, A. Comparação dos níveis de poluentes emitidos pelos diferentes combustíveis utilizados para cocção e sua influência no aquecimento global. Quím. Nova 2018, 8, 839–848. [Google Scholar] [CrossRef]
  34. Francisco, R.P. Estudo Termoquímico da Queima de Combustíveis em Caldeiras Usando Balanços de Energia. Dissertação de Mestrado; Universidade Federal De São João Del-Rei: São João Del Rei, Brazil, 2012. [Google Scholar]
  35. Garcia, R. Combustíveis e Combustão Industrial; Editora Interciência: Rio de Janeiro, Brazil, 2002. [Google Scholar]
Figure 1. (a) Continuous load CU (Chongololo), (b) Forced air CU, (c) conventional CU, and (d) conventional adapted for pellets CU. Source: images “a” and “b” available on the manufacturer’s website: http://www.be1.com.br (accessed on 25 November 2020) and images “c” and “d” photographed by the authors.
Forests 12 01056 g001
Figure 2. Efficiency in biomass consumption for different curing units.
Forests 12 01056 g002
Figure 3. Energy efficiency for different types of CU and biomass.
Forests 12 01056 g003
Figure 4. Emission factors for the Chongololo (a,b) and forced air (c,d) CUs, considering the firewood biomass of two forest species E. saligna (ES) and E. dunnii (ED).
Forests 12 01056 g004
Figure 5. Emission factors for conventional curing units, considering the biomass firewood (ac) of E. saligna (ES), firewood of E. dunnii (ED), and Pellets.
Forests 12 01056 g005
Table 1. Characteristics of the curing/drying units evaluated.
CUCapacityMain Technological CaracteriticsStructureChimney Useful Arean of Greenhouses 2
Continuous load (Chongololo)608 clampsFan
Double-firing system
Temperature and humidity control
Steel0.045 m228
Forced air 1207 clampsFan
Temperature and humidity control
Steel0.049 m29532
Conventional with firewood500 sticksAutomatic damper
Temperature and humidity control
Masonry0.045 m26015
Conventional adapted for pellets500 sticksFan
Temperature and humidity control
Masonry0.045 m23
¹ Forced air corresponds to CU with clamp and loose leaf. 2 The number of greenhouses mentioned above corresponds to a total of 10,877 tobacco growers whiting JTI (Japan Tobacco International), producing an average of 3980 kg of tobacco per CU.
Table 2. Biomass characteristics evaluated in the energy generation process.
BiomassMoisture ContentAsh (%)Extractives (%)Lignin (%)DB (g/cm3)CV (Kcal/kg)ED (Gcal/m3)
Eucalyptus saligna firewood25–35% b.u0.412.7315.960.444686.602.07
Eucalyptus dunnii firewood25–35% b.u0.542.6921.640.564715.002.62
Pinus sp. Pellets8% b.u0.336.5428.020.704728.003.30
DB: basic density; CV: superior calorific value; ED: energy density.
Table 3. Quantification of biomass consumption considering the different scenarios of curing units and biomass.
BiomassCuring Unitkg of Firewood per 2020/2021 Harvest
E. salignaChongololo133,428,783.03 ± 13,256,339.90
Forced Air135,339,654.92 ± 25,467,270.99
Conventional201,633,535.51 ± 8,199,087.37
E. dunniiChongololo118,531,475.87 ± 24,605,048.68
Forced Air126,031,279.12 ± 12,657,258.45
Conventional205,948,712.10 ± 23,471,298.98
PelletsConventional80,084,577.05 ± 13,842,905.58
Table 4. Tukey test results at 95% probability.
Curing UnitMeansGroupsBiomassMeansGroups
Conventional162555608aWood E. saligna156800658a
Forced Air130685467bWood E.dunnii150170489a
Chongololo125980129bPellets Pinus sp.80084577b
According to the Shapiro–Wilk test at 5% significance, the residuals can be considered normal, (p-value: 0.6733348).
Table 5. Quantification of carbon emissions considering the different scenarios.
BiomassCuring UnittCO2-eq in the 2020/2021 Harvest
E. salignaChongololo627,221.23 ± 255,733.12
Forced Air789,861.02 ± 286,295.15
Conventional765,012.20 ± 323,115.42
E. dunniiChongololo252,030.91 ± 67,919.43
Forced Air522,256.56 ± 74,448.80
Conventional666,348.32 ± 379,930.40
PelletsConventional480,838.66 ± 160,333.43
Publisher’s Note: MDPI stays neutral with regard to jurisdictional claims in published maps and institutional affiliations.

