Article

The Possibility of Regenerating a Pine Stand through Natural Regeneration

1
Forest Research Institute, Braci Leśnej 3, Sękocin Stary, 05-090 Raszyn, Poland
2
Department of Forest Sites and Ecology, Faculty of Forestry and Wood Technology, Poznań University of Life Sciences, Wojska Polskiego 71F, 60-625 Poznań, Poland
3
Kampinoski National Park, Tetmajera 38, 05-080 Izabelin, Poland
*
Author to whom correspondence should be addressed.
Forests 2021, 12(8), 1055; https://doi.org/10.3390/f12081055
Submission received: 22 June 2021 / Revised: 2 August 2021 / Accepted: 3 August 2021 / Published: 8 August 2021
(This article belongs to the Special Issue Tree Regeneration by Seeds in Natural Forests)

Abstract

:
Scots pine (Pinus sylvestris L.) is a widespread species in Eurasia, but its natural range can be significantly altered by a variety of stressors. The ability of pine to regenerate naturally is significantly reduced by its occurrence in unsuitable habitats. The processes of natural selection of pine from select habitats can be followed in stands of national parks where forestry activities are excluded. The possibility of pine regeneration is influenced by the following factors: characteristics of produced seeds, competition, and genetic characteristics. In the present study, selected factors associated with limiting the natural regeneration potential of pine were analysed. The present work generated important information related to the natural regeneration potential of pine in Central and Eastern Europe. The main objective of the analyses was to discuss the possibility of the natural regeneration of pine stands without human intervention. In addition, the genetic diversity of naturally germinating seedlings was analysed. The obtained results confirmed the high reproductive potential of pine despite the advanced age of the studied trees. The obtained seeds produced by old growth Scots pine trees had high viability, while a significant difference was observed in terms of the average number of cones per dominant tree between studied stands. Thus, the number of cones was the main element determining the regeneration potential of the stands. It should be emphasised that the number of cones did not influence the occurrence of natural regeneration. Based on the obtained results, the regeneration potential of pine stands depends mainly on the habitat and the competitive pressure. In addition, a correlation between genetic parameters and the regeneration potential of stands should be established, which may be the beginning of further research on the process discussed in this publication.

1. Introduction

Scots pine (Pinus sylvestris L.) is a widespread species throughout the Eurasian region and, due to its natural plasticity, colonises a wide range of habitats, from peat swamps (91D0 Natura 2000) to sand dunes (91T0 Natura 2000) (by Interpretation Manual—EUR28. Available online: https://ec.europa.eu/environment/nature/legislation/habitatsdirective/docs/Int Manual_EU28.pdf (accessed on 2 August 2021)) [1]. It is likely that the number of species in tree stands will decrease in the coming years. One of the reasons for the probable displacement of pine trees from the forest ecosystems in which they currently grow is changes in climatic conditions [2]. In Poland, the most important reduction factor in pine areas may be the restoration of the natural species composition of stands wherever pine was planted under unsuitable conditions. Currently, significant changes in the relationship between artificial and natural regeneration can already be observed. Nowadays, the percentage of natural forest regeneration is steadily increasing and the share of pine forest is decreasing in Poland (by State Forests information available online https://www. lasy.gov.pl (accessed on 2 August 2021)) [3]. This phenomenon may be indicative of a lack of ecological conditions for the natural regeneration of pine in stands where it is currently the main species.
In the forest area of Poland, the proportion of pine is 58.2% (State Forests (lasy.gov.pl)), which probably exceeds the natural occurrence of the species. Therefore, it is expected that in most of the current range of pine, the expected natural regeneration will not occur. The studies conducted by Miścicki [4] in forest areas under legal protection show a steady decrease in the area of pine forests. The main factors limiting the natural regeneration of pine are temperature, humidity, and light. Pine seeds are able to germinate at 6 °C, but the optimum temperature is 20–25 °C, with a seed moisture content of approximately 35% [5]. A pine seedling also physiologically requires approximately 30% full light [5]. External factors that limit pine seed germination include dense understory cover or the presence of a thick layer of overburden humus that prevents roots from reaching the mineral layer of the soil [6]. Pine seedling dieback is also due to diseases caused by biotic factors [7] and damage caused by abiotic factors [8,9].
Scots pine trees produce seeds every year, but under the climatic conditions in Poland, mast years usually occur every 3–5 years. The main method of pine seed dispersal is wind. Effective seed dispersal occurs up to a maximum distance of 100 m from the parent tree [10]. Within a stand, this distance can decrease to as little as 30 m [11].
The adaptation of Scots pine to current growing conditions is related to the genetic variation [12] and allelic richness present in the population [13]. In forestry science, research is being conducted in order to describe the influence of molecular markers on the external characteristics of plants. One of the dominant lines of work is the identify gene variants that are linked with adaptive traits or are under natural selection. Genetic markers were used for studying survival [14], growth [15], and resistance to drought [16], fungi, and insects [17] in pine.
Analyses of genetic variation in forest stands include the use of nuclear microsatellite DNA (simple sequence repeats (SSRs)—their polymorphism is due to the variation in the number of tandem repeats) markers [18,19]. These markers are considered to be selection-neutral, so their use in analyses of environmental effects on genotype is misguided. SSR sequences are located in the single-copy region [20] and their linkage to genes under negative selection is very likely [21]. Consequently, differences in the level of polymorphism detected by SSR analysis may correlate with the adaptability of stands to changing environmental factors [22]. SSR analyses are additionally subject to the error associated with frequent null alleles [23]. A microsatellite null allele is an allele at a microsatellite locus that does not amplify to detectable levels in a polymerase chain reaction test. These alleles do not allow for the detection of heterozygotes containing such alleles, falsely inflating the homozygosity of the population. However, it should be noted that the statistical methods for their detection may be biased [24].
In the literature, the most important factors affecting the regeneration of pine are temperature, humidity, and light, which depend on seasonal and terrain conditions and the interactions between these factors [25,26]. Among the habitat conditions conducive to pine regeneration, the top layer of soil, including litter thickness, the humus content, and the moisture content, is important [5,27]. One of the factors that significantly limits the development of pine seedlings is the luxuriantly developed undergrowth cover or the presence of a thick layer of humus that impedes the seedling roots from reaching the mineral layer of the soil [28].
In the present study, the natural regeneration of old-growth pine stands in legally protected forest areas is analysed. The age of the stands (older than 150 years) and the period of their protection (longer than 50 years) suggest the ecological processes occurring in them. The natural production potential of seeds and pine seedlings is analysed in terms of the number of actual natural regeneration occurrences. The main objective of the analyses conducted was to discuss the possibility of the natural regeneration of pines in stands with no human activity [29,30]. In addition, the genetic variation of naturally germinating seedlings in the studied stands is analysed. The formulated hypothesis assumes the possibility of the natural regeneration of pine stands without forestry management.

2. Materials and Methods

2.1. Research Area

The study was conducted in Kampinoski National Park ((KNP); 52°19′13′′ N, 20°47′23′′ E), a location dominated by Scots pine (P. sylvestris L.) stands in the upper layer, which are located in strictly protected areas and excluded from forest management (Figure 1). The characteristics of the locations are presented in Table 1.

2.2. Regeneration Potential of the Studied Stands

The cone yield was determined by visually counting the number of cones. The yield was determined in five locations (CG, Gr, W, Wi, and S; see Table 1 and Figure 1) on 50 randomly selected trees (Figure 2) per stand belonging to the dominant trees. The cones were counted around the crown and then, in order to estimate the number of cones out of sight, the result was multiplied by two in order to obtain the number of cones for the entire crown. This procedure was previously described by Tyszkiewicz [31]. On account of the two-year life cycle of cones (from pollination to ripening), only closed cones of that year were counted. To compare the estimated number of cones determined from observations of 50 trees with their actual occurrence, a sample of 11 randomly selected trees from which cones were collected was taken for location CG, Gr, and S, while in W and Wi, cones from 12–13 randomly selected trees were collected. From the collected cones of 11 trees for each location, 1000 seeds were collected for evaluation of germination energy and seed germination capacity determined according to ISTA international standards for seed evaluation [32].
Germination energy was calculated according to the formula:
G E = n 1 + n 2 + + n n N × 100 ,  
where
GE—germination energy (%);
n1…nn—number of germinated seeds in consecutive days in the time necessary for calculating GE (after 7 days of incubation);
N—number of all seeds.
Germination capacity was calculating according to the formula:
G C = n 1 + n 2 + + n n N × 100
GC—germination capacity (%);
n1…nn—number of germinated seeds in consecutive days in the time necessary for calculating GC (after 14 days of incubation);
N—number of all seeds.
The average number of full seeds per cone for the locations was counted. This allowed us to calculate the average number of seedlings for 50 random trees in each location according to the following formula: number of seeds per cone (Table S1) × germination capacity (Table S1) x number of cones in each location (Figure 3).

2.3. Species Diversity Sampling

At each of the five locations (CG, Gr, W, Wi, and S; Table 1 and Figure 1), four experimental plots were established (Figure 2), randomly distributed in order to represent the greatest possible variation in ecological plant growth conditions. At each location, all trees and shrubs were counted and divided into five height classes: 20 cm, 21–50 cm, 51–150 cm, 151–200 cm, and taller than 200 cm. For trees taller than 200 cm, their accurate height (H) and diameter at breast height (DBH) were also measured. Trees from the upper layer of the stand were counted in a location (Figure 1) range of 400 m2. Shorter trees and shrubs were counted in circular experimental plots (Figure 2) with a radius of 5.64 m (area: 100 m2).

2.4. Molecular Analyses

In each of the locations studied, 50 randomly distributed seedlings were selected (Figure 2). Plant material was obtained from the seedlings (Scots pine shorter than 10 cm) in the form of needles, which were then placed in closed Eppendorf test tubes and transported to the laboratory at 4–8 °C, where they were stored at −20 °C until DNA extraction. Total genomic DNA was isolated from the collected material using a commercial kit (Macherey–Nagel Gmbh&Co Valencienner Str. 11; 52355 Dueren. Germany). The quality of the DNA isolate was controlled using 2% agarose gel and a Quawell ([email protected]) spectrophotometer. All samples were diluted to 20–30 ng/uL using deionised water and were stored at −20 °C.
Molecular analyses were performed using five polymorphic microsatellite markers [33,34], as in studies on the maternal generation of the analysed stands [13]. The sequences of primers used are shown in Table 2. The forward primers are marked with a set of fluorochromes, VIC, PET, NED, and 6-FAM, as shown in Table 2. Five microsatellite loci were amplified in one multiplex reaction. For PCR, we used 1 µL of extracted DNA, 0.2 µL of each primer (10 µM concentration), a 5 µL Multiplex PCR Kit (Qiagen), and 2 µL of PCR water. The PCR thermal profile was as follows: 95 °C for 15 min, followed by 35 cycles at 94 °C for 30 s, 60 °C for 90 s, and 72 °C for 90 s, ending with 60 °C for 30 min. Genotyping was performed using an ABI 3500 Genetic Analyzer (Applied Biosystems; Scientific. Inc., Carlsbad, CA, USA), and allele lengths were scored using GeneMapper® ver. 5 (Thermo Fisher Scientific. Inc., Carlsbad, CA, USA).

2.5. SSR Analysis

The values of the following attributes were calculated using GenALEx 6.5 [35]: number of alleles (Na), effective number of alleles, Shannon’s information index (I), observed heterozygosity (Ho), expected heterozygosity (He), Wright’s coefficient (F), and inbreeding coefficients (Fis). The p value for each locus and population was calculated for the Fis factor value using Fstat ver. 2.9.3 [36]. By using Arlequin ver. 3.5 [37], the Fst genetic distance value, including the p value for this factor, was calculated between tested populations. The principal coordinates analysis (PCoA) in the GenALEx 6.5 [35] program was carried out based on the value of Fst, the fixation index providing an estimation of the genetic differentiation of the tested populations. The test for the presence of null alleles was performed using Micro-Checker v2.2.3 (http://www.microchecker.hull.ac.uk (accessed on 2 August 2021)) [38]. Loci in which null alleles are likely to be present were determined by checking whether the frequency of homozygotes exceeded a threshold value.

2.6. Statistical Analysis

One-way analysis of variance (ANOVA) was used to compare the average mean number of cones per one dominant tree at each location. The analyses were carried out using the R package stats [39] according to the following model:
yij = μi + eij
where yij is the number of cones at the i-th location on the j-th sample dominant tree, μi is the mean number of cones per one dominant tree at the i-th location, and eij is the difference (random error) between mean number of cones per one dominant tree on the i-th location and obtained value for the ij-th sample. Tukey’s post hoc test was carried out using the R package agricolae [40], and a Pearson correlation analysis was conducted using the packages stats [39] and corrplot [41].

3. Results

3.1. Reproductive Potential

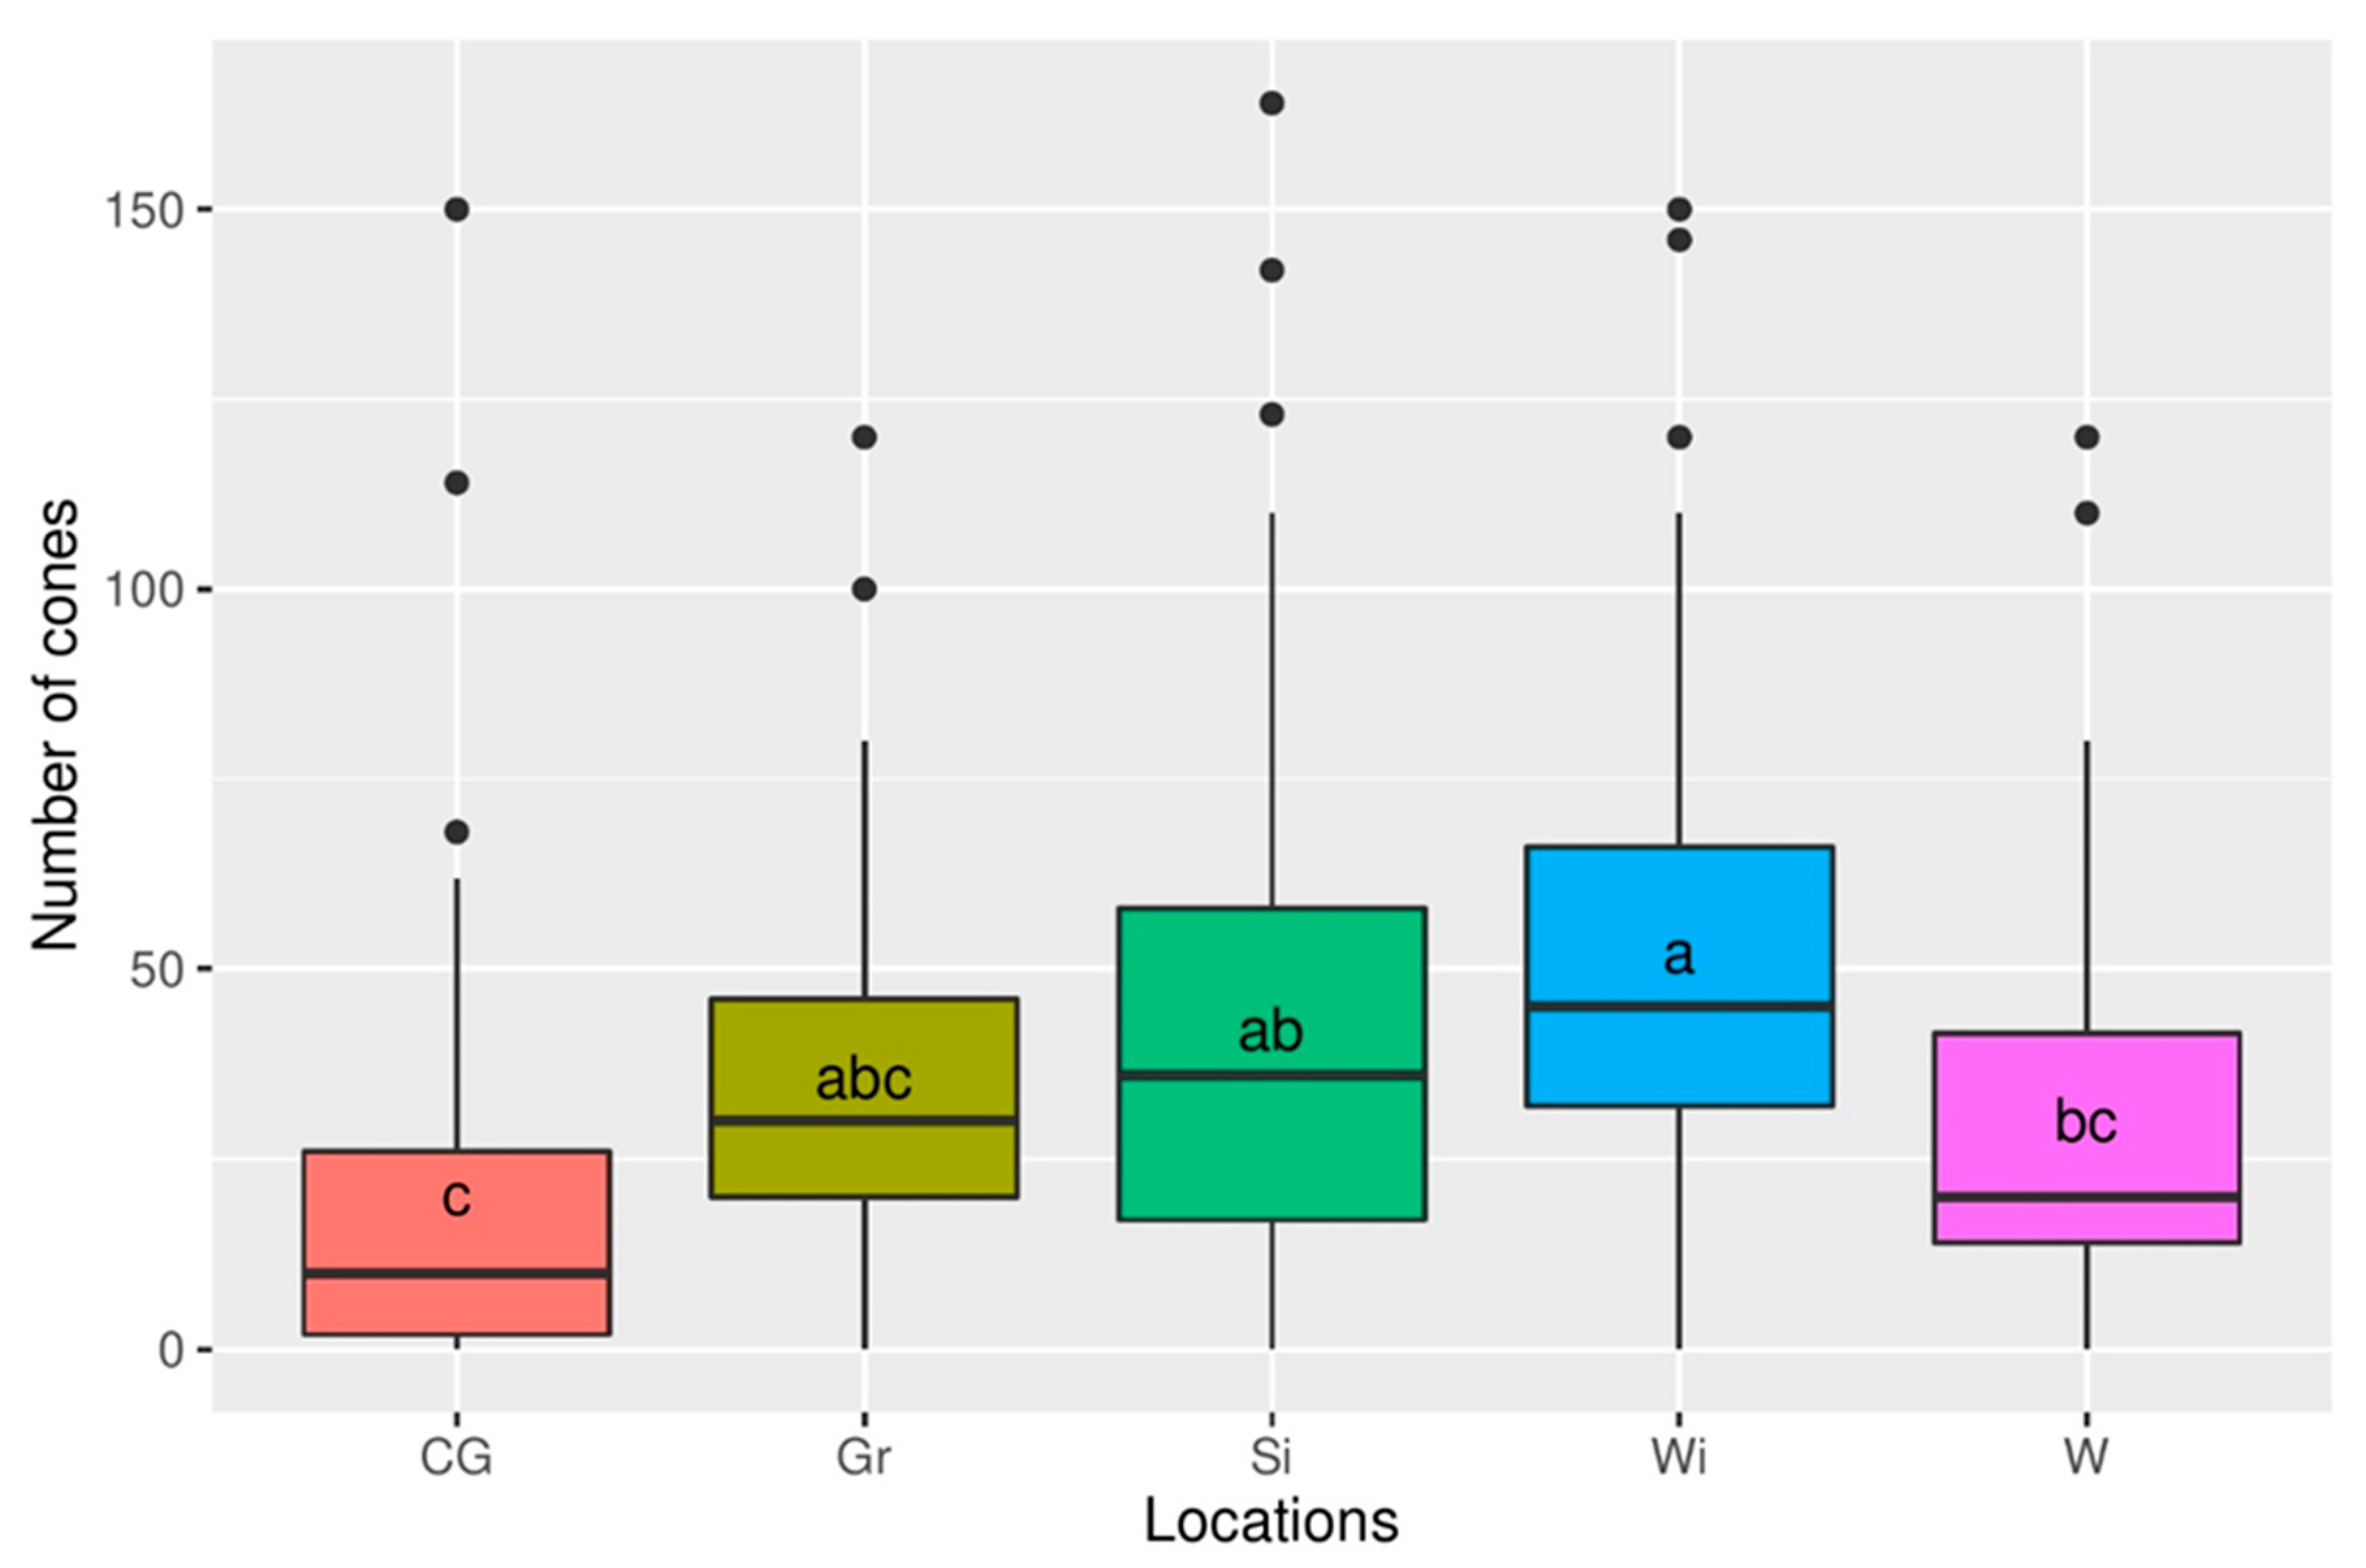
The results of analysis of variance showed that the studied locations are significantly different (p ≤ 0.001) by the mean number of cones per one dominant tree. According to the results of the Tukey post hoc test, the Wi location is significantly different (p ≤ 0.05) to the CG and W locations (Figure 3). Based on the cone count, it was found that the highest yield was characteristic of the Wi stand, where 2560 cones were found (an average of 52 cones/tree), representing 28.7% of the cones in all the stands studied. A similar number of cones were found in the S stand (2103 cones, 42 cones/tree). The cones from this stand accounted for 23.6% of the total number of cones. In total, more than half of all cones from the studied stands (52.3%) were found in these two stands. In the Gr and W stands, 1752 and 1506 cones were found, corresponding to an average of 36 and 30 cones/tree, respectively. The lowest cone yield in 2018 was in the CG stand, where 999 cones (20 cones/tree) were found. The percentage of fruiting in the CG stand was only 11.2% (Figure 3).
Detailed results of seed evaluation for the studied stands are presented in the Supplementary Materials. Seeds from the studied stands showed a similar and very high mean energy and germination capacity (98.4‒99.9%).
The average number of full seeds per cone for the locations was:
  • CG—15.63 seeds;
  • Gr—17.45 seeds;
  • S—14.54 seeds;
  • Wi—14.54 seeds;
  • W—11 seeds.
According to the formula given in the Section 2.2, the theoretical number of seedlings that can be obtained from 50 randomly selected trees at each location are:
  • CG—15.63 × 0.99 × 999 = 15,458 seedlings;
  • Gr—17.45 × 0.99 × 1752 = 30,267 seedlings;
  • S—14.54 × 0.99 × 2103 = 30,272 seedlings;
  • Wi—14.54 × 0.99 × 2560 = 36,850 seedlings;
  • W—11 × 0.99 × 1506 = 16,400 seedlings.

3.2. Species Variability of a Stand

In Wi, the forest stand consists of Scots pine (P. sylvestris) aged 147–167 years, with an average height (H) of 26.1 m and an average diameter at breast height (DBH) of 42.3 cm, mixed with birch (Betula pendula) with a height of 25 m and a DBH of 30 cm. The lower layers, such as the undergrowth, contain birch, oak (Quercus robur), buckthorn (Frangula alnus), and occasionally juniper (Juniperus communis). Of the naturally regenerating trees (in our study, plants taller than 20 cm), seedlings of oak, and occasionally pine, were recorded. The current plant community represents the features of subcontinental fresh forest (Peucedano-Pinetum) and continental mixed forest (Querco roboris-Pinetum) plant associations.
The tree stand of CG is two-storeyed. The first tier consists of pines, which are approximately 200 years old and have an average H of 26.3 m and an average DBH of 55.1 cm. The second tier is dominated by oak, with an average H of 14.6 m and a DBH of 22.2 cm, and sporadic pear trees (Pyrus pyraster). The shrub layer is dominated by buckthorn. A few specimens of juniper and sporadic rowan (Sorbus aucuparia) were also noted. Oak seedlings (taller than 20 cm) and sporadic pear seedlings were recorded among the naturally regenerating trees. No pine seedlings were found. The stand at the CG site represents a typical form of the Querco roboris-Pinetum complex.
The stand structure at the W site is similar to that at the CG site. In the two-storey stand, the first storey consists of pine with an average H of 27.5 m and an average DBH of 50.2 cm. The second storey is dominated by oak, with an average height of 14.0 m and a diameter at breast height of 16.7 cm, with an admixture of birch with an average height of 14.3 m and a DBH of 13.3 cm. Only juniper and buckthorn were noted in the shrub layer. A few oak and pine seedlings were also found. The W stand represents the same type of plant community as the CG, i.e., Querco roboris-Pinetum. The presence of natural regeneration at the W site thus indicates the possibility of oak and pine regeneration at the CG.
The Gr area differs from the stands described above in having the richest composition in species. The stand is multilayered, with pine in the first storey, with an average H of 30.1 m and a DBH of 65.5 cm. The second storey consists of oak, with an average H of 13.1 m and a DBH of 17.1 cm, with a single admixture of hornbeam (H = 6 m, DBH = 7 cm). The shrub and understory layer is rich, with Quercus robur, Pyrus pyraster, Malus sp., Sorbus aucuparia, Viburnum opulus, Acer platanoides, Frangula alnus, Corylus avellana, Prunus spinosa, and Euonymus europaeus. Tree seedlings occurred sporadically, including oak and hornbeam, but no pine seedlings were observed. It can be assumed that the species composition of the seedlings reflects a complex of environmental factors, including the vegetation cover and habitat conditions. A more fertile substrate with patches of podzol provides suitable conditions for the development of a deciduous hornbeam–oak forest type. The proportion of these species in the forest stand limits the access of light to the forest floor, which restricts the regeneration of pine.
The tree population of S consists of three storeys. The upper storey consists of pines, which are approximately 200 years old and have an average height of 22.3 m and an average breast height of 48.5 cm. The second storey contains birch trees, with an average height of 13.1 m and an average diameter at breast height of 11.8 cm. The third (lower) tier of the stand is formed by oak, with an average H of 6.5 m and an average DBH of 11.5 cm. The understory includes Betula pendula, Quercus robur, Juniperus communis, Sorbus aucuparia, Frangula alnus, and Pinus sylvestris. The plant community and its dynamic trends are similar to those of the Wi site, although in this case they can be considered an expression of natural stand development processes, due to the age of the stand. A detailed summary of tree and shrub species at the listed sites, along with their frequency of occurrence and H, is presented in the Supplementary Materials (Table S2). Due to the role of seedlings in stand regeneration processes, only a summary of the number of seedlings of all tree and shrub species is provided below (Table 3).

3.3. Genetic Analysis

On average, 15.68 alleles per population were identified in the studied populations. Comparing the studied populations, the highest number of alleles (Na) was found in CG (17.4) and the lowest in Wi (14). The lowest effective number of alleles (Ne) was also described in the Wi population, but the highest Ne was calculated for S despite the highest Na in the CG population described above (Table 4).
In all populations, the Fis coefficient was positive, indicating a higher than expected frequency of homozygotes (Table 4). The obtained value of the inbreeding coefficient Fis was statistically significant for all populations except the Wi population. The highest level of homozygosity was recorded in the W population; consequently, the lowest observed heterozygosity (Ho) was found in this population. The highest Ho was described in the Wi population.
An analysis of null alleles [40] revealed their presence for one (SPAC 11.6) of the five loci analysed. The frequency of null alleles at the SPAC 11.6 locus ranged from 0.15 to 0.46 (Table 5).
The analysis of genetic diversity Fst, together with the statistical level of its significance, showed the genetic homogeneity of four populations: S, W, CG, and Gr. These populations were statistically different from the Wi population at the genetic level (p-value from 0.000 to 0.002) (Table 6).

3.4. Correlations between Parameters

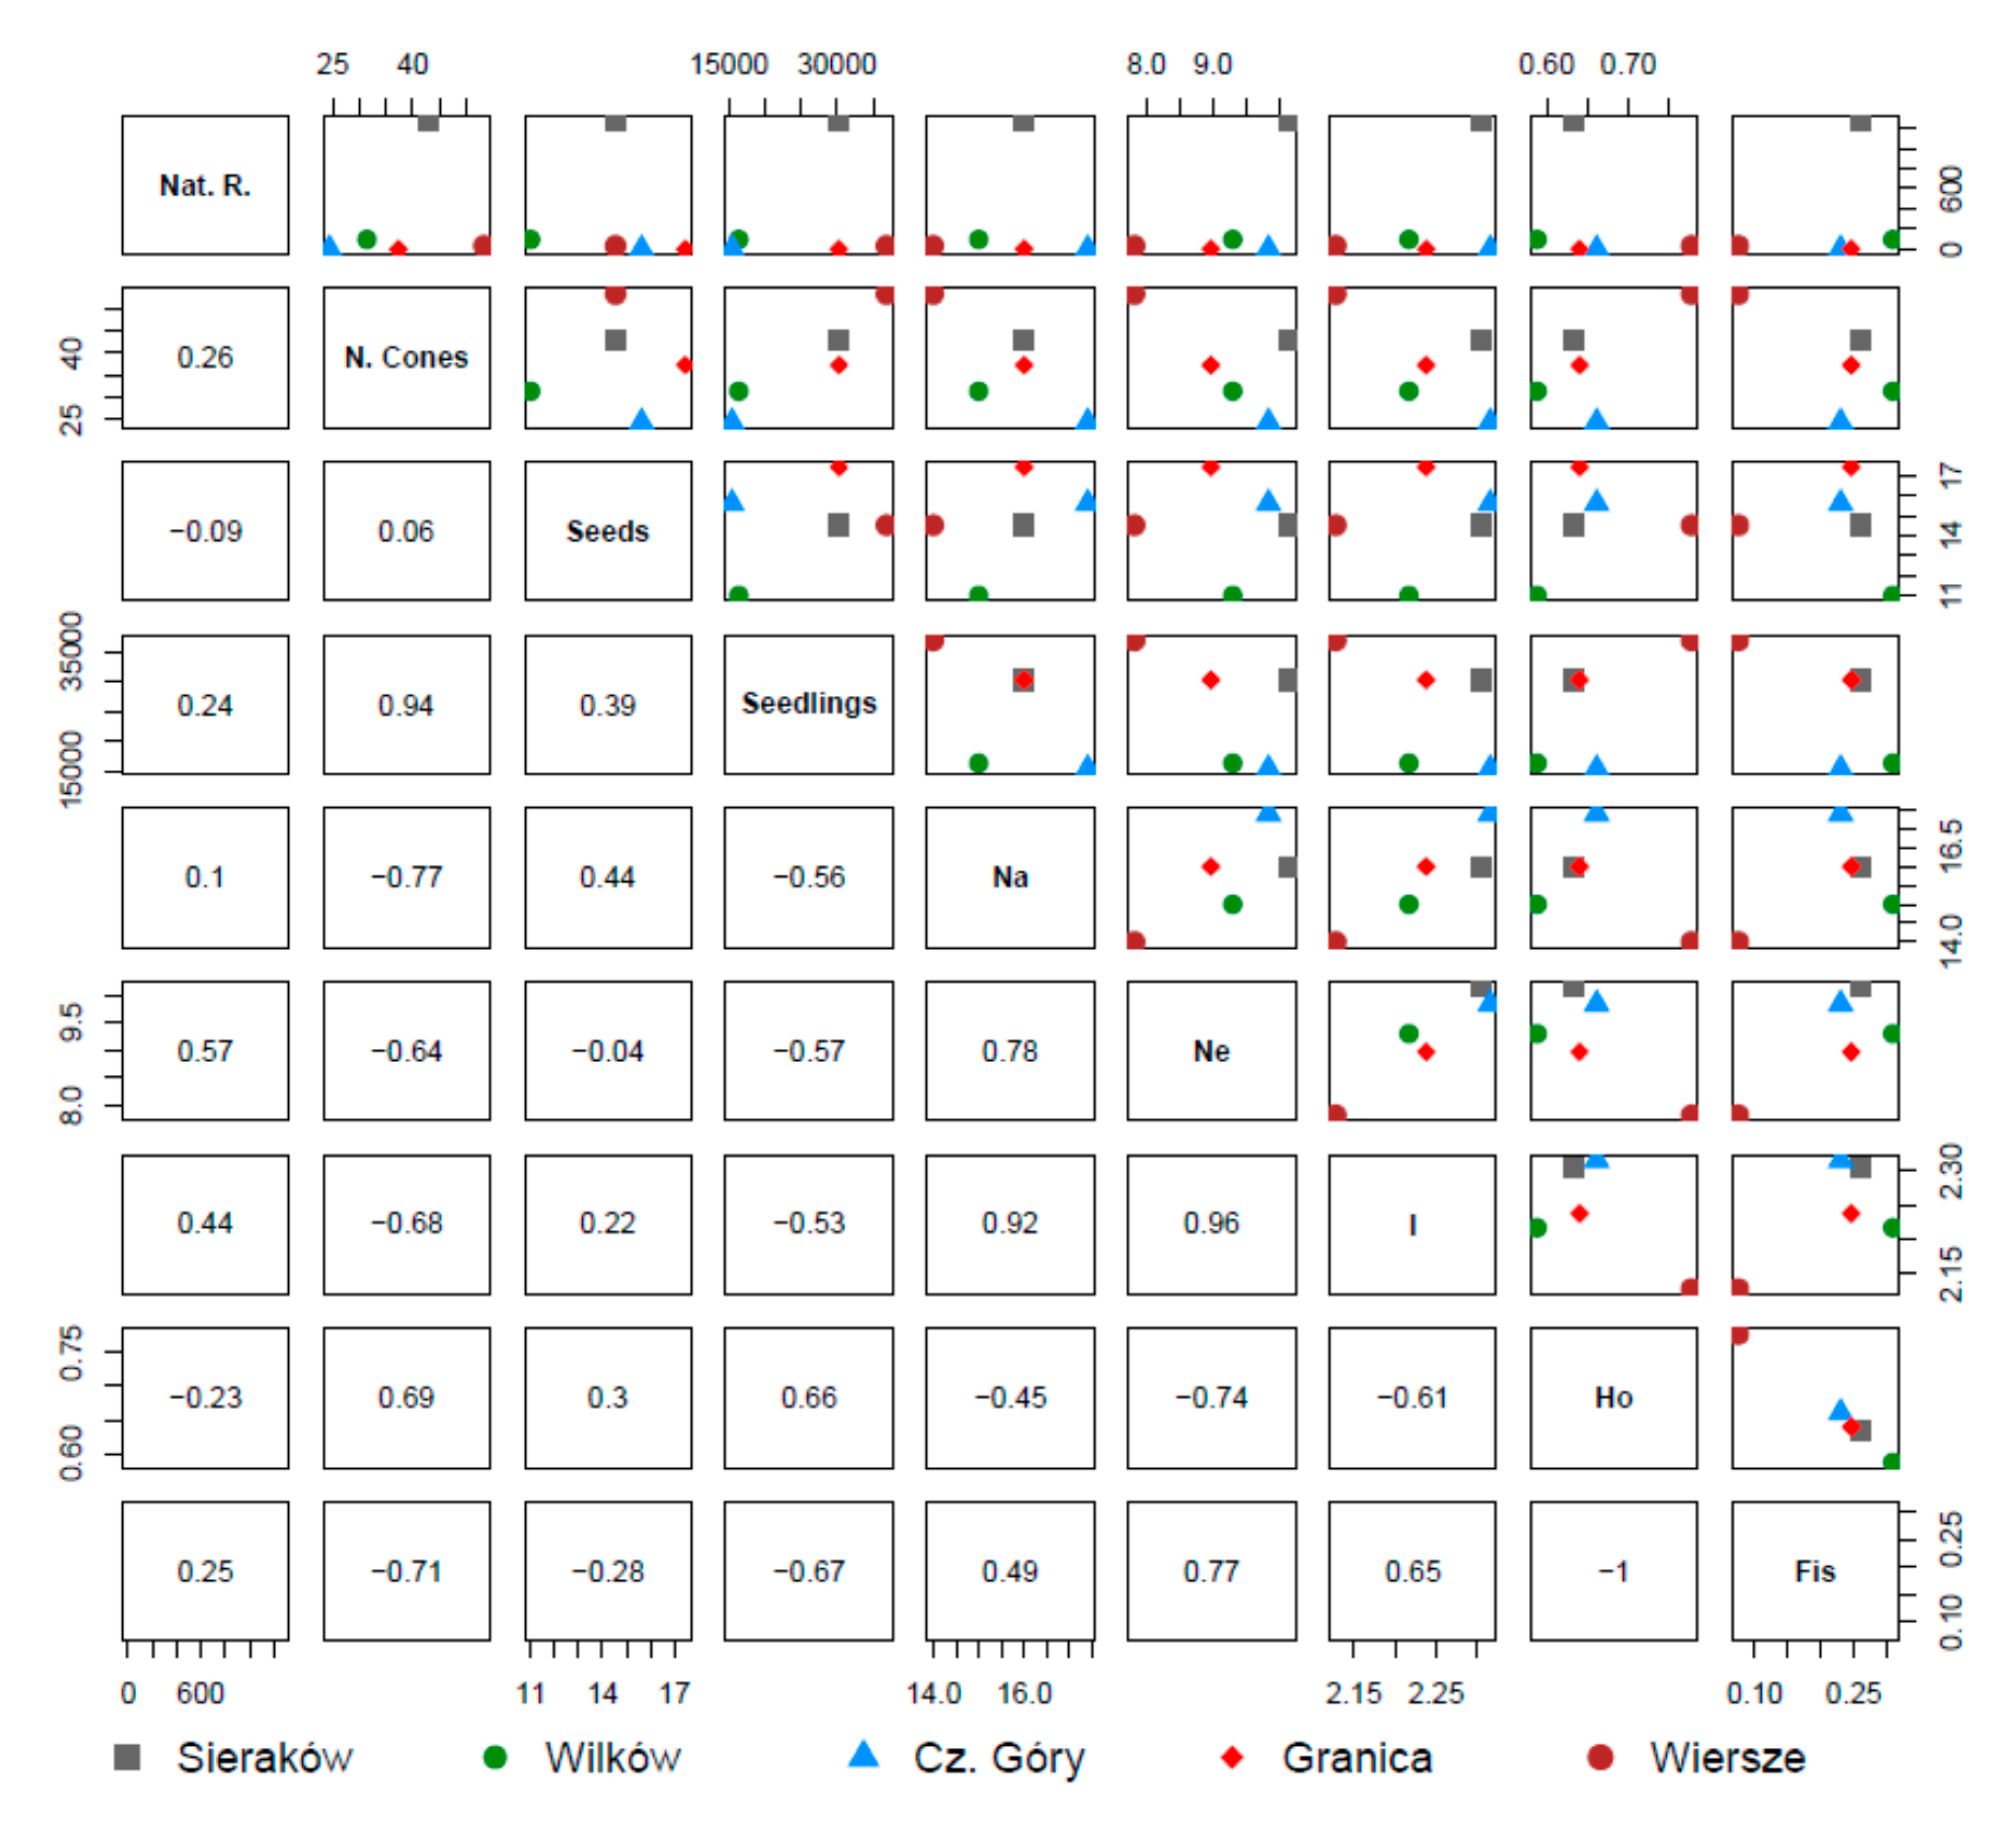
The analysis of the correlations between the studied traits and the distribution of their values for the study sites are shown in Figure 4. For natural regeneration, a correlation (0.57) was found with the parameter of the effective number of alleles, but the value of this parameter did not depend on the number of cones observed (0.26). Natural regeneration had the highest parameter value at site S. The second parameter important for stand stability, the number of cones observed, correlated positively (0.94) with seedlings resulting from the calculations in the performed analyses. For the seedling trait, a strong negative correlation with the evaluated genetic traits was additionally demonstrated: Na (–0.77), Ne (–0.64), and Fis (–0.71). The correlation obtained between the hypothetical number of seedlings that can be obtained from the seeds produced by the trees and the natural regeneration that occurs in the stands is positive but of low value (0.24). The data visualise the discrepancy between the hypothetical seedlings that can be obtained and the actual natural regeneration of the stand.

4. Discussion

Many European forest ecosystems are not management-dependent and can only be driven by natural dynamics, including natural regeneration and development phases, as well as large-scale disturbance dynamics driven by fires, windstorms, or insect outbreaks. The original natural forests of Europe are characterised by different patterns of natural dynamics. Small-scale gap dynamics and medium-scale mosaics of different development phases are typical for most deciduous forests, while large-scale natural disturbances are probably typical for coniferous forests [44]. Pine forests should therefore be subject to large-scale natural disturbances and phenomena, such as fires, windstorms, or insect outbreaks. The study area is in a national park where, similar to other national parks in Poland, fire protection is one of the tasks of park staff. Windstorms are not a significant threat. In the history of KNP (since 1959), windstorms have occurred six times, destroying 95 ha in 1972, 20 ha in 1993 [45], 180 ha in 2004, 52 ha in 2005, 27 ha in 2007, and 120 ha in 2017 (unpublished data on Kampinoski NP), which is not a significant proportion of the total park area (larger than 38,500 ha). Additionally, Matula et al. [46] pointed to the resprouting of trees as one of the drivers of understory vegetation dynamics after disturbances, but, as mentioned above, disturbances in the park do not affect a significant area, and above all, the pine is not a species that produces sprouts. Therefore, in the forest plant communities of the KNP dominated by pine stands, natural succession processes take place, leading to the gradual disappearance of the typical forms of poor pine forests and the entering of the oak trees under the pine canopy.
According to research by Enander [47], one characteristic of old stands is the production of seeds that are small and light, but no less vigorous than those of young trees. This thesis was confirmed by the present study, in which the analysed characteristics of seeds from old pine stands did not differ from the average values for the species. Similar results were provided by the study of Ganatsas et al. [48] on Pinus pinea L. in areas classified as Natura 2000. An objective measure of tree reproduction is the number of seeds or seedlings produced per unit area [49]. However, many researchers still question whether seeds can be treated as seedlings. Harper and White [50] suggest that the “birth equivalent” for plants is seed germination. Accordingly, progeny is merely a heterotrophic seedling that becomes independent of the resources of the parent organism. The treatment of seeds as progeny follows from the assumption that each seed is a potential individual. However, the germination capacity of many plants is not 100% and can sometimes be as low as 1–5%, despite treatment with various stimulating factors [51]. The results obtained in this research may not reflect the actual regeneration potential under natural conditions. The study presented here showed considerable differences between the areas in terms of reproductive potential, which has no proportional effect on the occurrence of natural regeneration. Factors affecting the differentiation of reproductive potential include the age of the parent tree [52] and the size of the cone and its position in the crown [53]. Light also influences the germination process [54]. Pines usually start producing seeds at the age of 35 years and can produce them until old age (150 years) without a loss in viability [55]. Our studies showed that even 200-year-old pines still produced vigorous seeds. The method used in our study to estimate the cone yield in tree canopies does not differ significantly from the actual cone number, as confirmed by data from real cone collection (unpublished data from the Forest Research Institute in Poland).
Harju et al. [56] and Hilli et al. [57] reported that qualitatively and quantitatively good seed reproductive years are rare in northern pine distribution areas, mainly due to the short and cool growing season. Between 1960 and 2004, in four natural pine stands in northern Finland, the average annual seed yield was 77 seeds/m2 (5–225 seeds/m2). The average expected germination was only 61%. For this reason, the natural regeneration of this species in Finland is very difficult. From the number of potentially germinable seeds, both in terms of the average number of seeds per cone and the total potential number of germinable seeds, it appears that the regeneration potential of Scots pine is considerable in the case of the stands of Kampinos National Park. It is important to remember that pine, as a pioneer species, is characterised by regeneration associated with various types of ecosystem disturbance. In natural pine ecosystems, Sabor [58] found that 1000 pine seeds grew into approximately 200–250 seedlings, of which only four to five trees survived until the felling age. The phenomena of natural selection and gene flow significantly influence the formation of the genetic pool of stands, which has a direct impact on the size of the population, its genetic variation, and local adaptations. Pine is characterised by high genetic variability due to dominant cross-pollination. A dominant phenomenon in the stands is the predominance of heterozygotes over homozygotes (Ho > He), especially in the adult generation [22]. Previous studies also indicated a correlation between a higher degree of heterozygosity in the population and a higher resistance to abiotic and biotic factors [7,8,9]. The studied locations, with the exception of Wi, showed a significant excess of homozygotes, which, given the demonstrated absence of null alleles, may have consequences for the selection processes. An excess of homozygotes and increased inbreeding in the progeny is a phenomenon frequently observed in conifer populations [59]. The excess of homozygotes is generally reduced as the progeny generation grows by eliminating inbred individuals [60]. Such a reduction is observed in naturally regenerated pine stands. For example, Yazdani et al. [61] found the elimination of homozygous supernumerary individuals in pine populations from natural regeneration in Sweden as early as 10–20 years of age. Muona et al. [62] showed in their study that there is a natural reduction of homozygosity in relation to the gene pool of sown seeds already at the age of three years. In the present study, a higher inbreeding index (Fis) was described in populations with lower reproductive potential. The gene pool of pine populations is mainly shaped by the transfer of genetic information with pollen. Seeds play a minor role in shaping the gene pool due to their limited dispersal potential [63]. Nowakowska et al. [64], using microsatellite markers, discovered that progeny pines had a slightly higher gene pool richness compared to the adult tree population. In a similar study on P. strobus L., Rajora [65] showed that the genetic structure of the progeny did not differ significantly from that of the parent generation. Small changes in the genetic variation of the progeny generation are generally associated with high pollen flow efficiency between neighbouring stands [66]. The research presented suggests that an additional factor shaping the genetic pools of stocks is selection, which occurs during germination and the early stages of growth. Genetic differences between the Wi population and the other populations studied, with consequences in genetic traits typical of other stands, were found between locations when their reproductive potential or the number of seedlings of natural regeneration were analysed.
Taking into account all of the above data, the key question seems to be the possibility of natural regeneration for the next pine generation, taking into account the present age (160–200 years) of the tested stands. The results of the research show that these possibilities should be assessed individually for each stand.
Regardless of the genetic potential and seed germination capacity of the tested pine trees, a lack of Pinus sylvestris regeneration was demonstrated for the Gr location due to the competition from deciduous species specific to a potential oak–hornbeam forest community. The regenerative capacity of pine did not consider the hypothetical probability of disturbances such as windstorms, which mainly affect the upper layer. Moreover, thinning of the upper layer of the stand by wind (or people) often favours the development of the lower layer species, including those recorded in the research plots, such as Corylus avellana or Carpinus betulus. The natural regeneration of pine was also not found in the CG location, despite favourable habitat conditions, the suitable age of the stand, and the type of plant community in which pine should be a natural component (Querco roboris-Pinetum). The impact of competition from Frangula alnus should be excluded too, despite the highest number of seedlings of Frangula alnus in CG (34; see Table 3). In S, the total number of buckthorn specimens was comparable, and the highest number of pine seedlings of all the tested research plots was present. One explanation may be the processes described by Rutkowski and Konatowska [67], indicating the anthropogenic nature of some forms of Querco roboris-Pinetum and its disappearance in favour of deciduous forests if the regeneration process is long enough. It should be noted, however, that in the case of Querco roboris-Pinetum described by Rutkowski and Konatowska [67], the habitat conditions were more favourable to the development of oak stands. Taking into account the number of oak seedlings, Wi can be considered most favourable for this species. In this location, pine seedlings were noted only sporadically. Theoretically, oak could find more favourable soil conditions in the Gr location, but in this case, the oak seedlings are affected by competition from other deciduous species, as well as for pine. In general, apart from location S, pine regeneration showed regression, giving way to oaks and—in the case of Gr— to other deciduous species. The constant loss of pine forest habitats was also pointed to in Kampinoski National Park by Kowalska and Kołaczkowska [68]. However, it could be considered an effect of natural regeneration processes taking place in pine forests [69].

5. Conclusions

Despite the high reproductive potential of seeds and the habitat conditions considered typical for Pinus sylvestris, the number of seedlings at the sites studied (with the exception of site S) does not guarantee the continuity of pine stands. This may mean that the form of strict protection under which the studied stands are located guarantees a free course of natural processes, which may mean the gradual disappearance of Pinus sylvestris.
The obtained data indicate the influence of selection pressure on the genetic pools of the studied locations, indicating that the smaller the number of possible seedlings in a stock, the higher the effective number of alleles and the lower the inbreeding coefficient. On the other hand, the higher the number of natural regeneration incidents in the stand, the higher the effective number of alleles.

Supplementary Materials

The following are available online at https://www.mdpi.com/article/10.3390/f12081055/s1, Table S1, details of seed characterisation carried out according to ISTA standards; Table S2, a detailed summary of tree and shrub species at the listed sites, along with their frequency of occurrence, diameter at breast height (DBH), and height (H).

Author Contributions

Conceptualization, P.P.; methodology, P.P., M.K., S.J. and V.M.; software, V.M. and A.T.; validation, P.P.; formal analysis, P.P., A.T., M.K., V.M., S.J. and P.R.; investigation, P.P.; resources, P.P. and Ł.T.; data curation, V.M. and P.R.; writing—original draft preparation, P.P.; writing—review and editing, P.R., M.K. and S.J.; visualization, P.P. and V.M.; supervision, P.P.; project administration, P.P; funding acquisition, Ł.T. All authors have read and agreed to the published version of the manuscript.

Funding

This research was funded by the forest fund of Polish State Forest, grant numbers DE/373-180/2019 (KNP) and 67 02 54.

Data Availability Statement

Data publicly available in annual reports held in the library of the Forest Research Institute in Poland.

Conflicts of Interest

The authors declare no conflict of interest. The funders had no role in the design of the study; in the collection, analyses, or interpretation of data; in the writing of the manuscript; or in the decision to publish the results.

References

  1. Interpretation Manual. EUR28. pp. 113–122. Available online: https://ec.europa.eu/environment/nature/legislation/habitatsdirective/docs/Int Manual_EU28.pdf (accessed on 2 August 2021).
  2. Dyderski, M.K.; Paź, S.; Frelich, L.E.; Jagodziński, A.M. How much does climate change threaten European forest tree species distributions? Glob. Chang. Biol. 2018, 24, 1150–1163. [Google Scholar] [CrossRef]
  3. State Forest in Poland. Zasoby Leśne—Lasy Państwowe; State Forest in Poland. Available online: https://www. lasy.gov.pl (accessed on 2 August 2021).
  4. Miścicki, S. Changes in the stands of the Białowieża National Park from 2000 to 2015. For. Res. Pap. 2016, 77, 371–379. [Google Scholar] [CrossRef] [Green Version]
  5. Oleskog, G.; Sahlén, K. Effects of seedbed substrate on moisture conditions and germination of Scots pine (Pinus sylvestris) seeds in a mixed conifer stand. New For. 2000, 20, 119–133. [Google Scholar] [CrossRef]
  6. Hille, M.; den Ouden, J. Improved recruitment and early growth of Scots pine (Pinus sylvestris L.) seedlings after free and soil scarifcation. Eur. J. For. Res. 2004, 123, 213–218. [Google Scholar] [CrossRef]
  7. Nowakowska, J.A.; Oszako, T. Stan zdrowotny buków w Nadleśnictwie Siewierz a ich zróżnicowanie genetyczne określone na podstawie analiz chloroplastowego DNA. Sylwan 2008, 152, 11–20. [Google Scholar]
  8. Prus-Głowacki, W.; Godzik, S. Genetic structure of Picea abies trees tolerant and sensitive to industrial pollution. Silvae Genet. 1995, 44, 62–65. [Google Scholar]
  9. Oleksyn, J.; Prus-Głowacki, W.; Giertych, M.; Reich, P.B. Relation between genetic diversity and pollution impact in a 1912 experiment with East European Pinus sylvestris provenances. Can. J. For. Res. 1994, 24, 2390–2394. [Google Scholar] [CrossRef]
  10. Adams, W.T. Gene dispersal within forest tree populations. New For. 1992, 6, 217–240. [Google Scholar] [CrossRef]
  11. Farmer, R.E. Seed Ecophysiology of Temperate and Boreal Zone Forest Trees; Dispersal. St. Lucie Press: Delray Beach, FL, USA, 1997; pp. 45–65. [Google Scholar]
  12. Klisz, M.; Ukalski, K.; Ukalska, J.; Jastrzębowski, S.; Puchałka, R.; Przybylski, P.; Mionskowski, M.; Matras, M. What can we learn an erly test on the adaptation of silver fir populations to marginal envirments. Forest 2018, 9, 441. [Google Scholar] [CrossRef] [Green Version]
  13. Przybylski, P.; Mohytych, V.; Rutkowski, P.; Tereba, A.; Tyburski, Ł.; Fyalkowska, K. Relationships between Some Biodiversity Indicators and Crown Damage of Pinus sylvestris L. in Natural Old Growth Pine Forests. Sustainability 2021, 13, 1239. [Google Scholar] [CrossRef]
  14. Bergmann, F.; Scholz, F. Selection effects of air pollution in Norway spruce (Picea abies) populations. In Genetic Effects of Air Pollutants in Forest Tree Populations; Scholz, F., Gregorius, H.R., Rudin, D., Eds.; Springer: Berlin/Heidelberg, Germany, 1989; pp. 143–162. [Google Scholar]
  15. Durel, C.E.; Bertin, P.; Kremer, A. Relationship between inbreeding depression and inbreeding coefficient in maritime pine (Pinus pinaster). Theor. Appl. Genet. 1996, 92, 347–356. [Google Scholar] [CrossRef] [PubMed]
  16. Eckert, A.J.; van Heerwaarden, J.; Wegrzyn, J.L.; Nelson, C.D.; RossIbarra, J.; Gonzalez-Martınez, S.C.; Neale, D.B. Patterns of population structure and environmental associations to aridity across the range of loblolly pine (Pinus taeda L., Pinaceae). Genetics 2010, 185, 969–982. [Google Scholar] [CrossRef] [Green Version]
  17. Quesada, T.; Gopal, V.; Cumbie, W.P.; Eckert, A.J.; Wegrzyn, J.L.; Neale, D.B.; Goldfarb, B.; Huber, D.A.; Casella, G.; Davis, J.M. Association mapping of quantitative disease resistance in a natural population of loblolly pine (Pinus taeda L.). Genetics 2010, 186, 677–686. [Google Scholar] [CrossRef] [PubMed] [Green Version]
  18. Rajora, O.P.; Rahman, M.H.; Buchert, G.P.; Dancik, B.P. Microsatellite DNA analysis of genetic effects of harvesting on old-growth eastern white pine (Pinus strobus L.) in Ontario. Can. Mol. Ecol. 2000, 9, 339–348. [Google Scholar] [CrossRef] [PubMed]
  19. Klisz, M.; Ukalska, J.; Koprowski, M.; Tereba, A.; Puchałka, R.; Przybylski, P.; Jastrzębowski, S.; Nabais, C. Effect of provenance and climate in intra-annual density fluctuations of Norway spruce Picea abies (L.) Karst. Pol. Agric. Meteorol. 2019, 269–270, 145–156. [Google Scholar] [CrossRef]
  20. Williams, C. The peculiarities of pine genome. In Proceedings of the Plant and Animal Genome VII Conference, San Diego, CA, USA, 17–21 January 1999. [Google Scholar]
  21. Scalfi, M.; Piotti, A.; Rossi, M.; Piovani, P. Genetic variability of Italian southern Scots pine (Pinus sylvestris L.) populations: The rear edge of the range. Eur. J. For. Res. 2009, 128, 377. [Google Scholar] [CrossRef]
  22. Konecka, A.; Tereba, A.; Studnicki, M.; Nowakowska, J.A. Allele rzadkie i prywatne jako miara bogactwa puli genetycznej materiału sadzeniowego sosny zwyczajnej. Sylwan 2019, 163, 948–956. [Google Scholar] [CrossRef]
  23. Scotti, I.; Burelli, A.; Cattonaro, F.; Chagné, D.; Fuler, J.; Hedley, P.E.; Jansson, G.; Lalanne, C.; Madur, D.; Neale, D.; et al. Analysis of the distribution of marker classes in a genetic linkage map: A case study in Norway spruce (Picea abies Karst). Tree Genet. Genomes 2005, 1, 93–102. [Google Scholar] [CrossRef]
  24. Dąbrowski, M.J.; Pilot, M.; Kruczyk, M.; Żmihorski, M.; Umer, H.M.; Gliwicz, J. Reliability assessment of null allele detection: Inconsistencies between and within 2 different methods. Mol. Ecol. Resour. 2013, 14, 361–373. [Google Scholar] [CrossRef] [Green Version]
  25. Mason, W.L.; Edwards, C.; Hale, S.E. Survival and early seedling growth of conifers with different shade tolerance in a Sitka spruce spacing trial and relationship to understorey light climate. Silva Fenn. 2004, 38, 357–370. [Google Scholar] [CrossRef] [Green Version]
  26. Castro, J.; Zamora, R.; Hódar, J.A.; Gómez, J.M. Ecology of seed germination of Pinus sylvestris L. at its southern. Mediterranean distribution range. Investig. Agrar. Sist. Recur. For. 2005, 14, 143–152. [Google Scholar] [CrossRef] [Green Version]
  27. Aleksandrowicz-Trzcińska, M.; Drozdowski, S.; Brzeziecki, B.; Rutkowska, P.; Jabłońska, B. Effect of different methods of site preparation on natural regeneration of Pinus sylvestris in eastern Poland. Dendrobiology 2014, 71, 73–81. [Google Scholar] [CrossRef] [Green Version]
  28. Czyżyk, K. The diversity of characteristics of the natural regeneration of Scots pine (Pinus sylvestris L.) in the clear-cutting. In Polish: Przestrzenne zróżnicowanie cech naturalnego odnowienia sosny zwyczajnej (Pinus sylvestris L.) w rębni zupełnej. Acta Sci. Pol. Form. Circumiectus 2017, 16, 59–70. [Google Scholar] [CrossRef] [Green Version]
  29. Bastien, C.; Alía, R. What might be useful measures of genetic variability for adaptive traits within populations of Scots pine? Investig. Agr. Sist. Recur. For. 2000, 9, 97–110. [Google Scholar]
  30. Grivet, D.; Sebastiani, F.; González-Martínez, S.C.; Vendramin, G.G. Patterns of polymorphism resulting from long-range colonization in the Mediterranean conifer Aleppo pine. New Phytol. 2009, 184, 1016–1028. [Google Scholar] [CrossRef] [PubMed]
  31. Tyszkiewicz, S. Nasiennictwo Leśne; Forest Research Institute: Warsaw, Poland, 1949. [Google Scholar]
  32. ISTA. International Rules for Seed Testing. Intentional Seed Testing Association; ISTA: Bassersdorf, Switzerland, 2013. [Google Scholar]
  33. Soranzo, N.; Provan, J.; Powell, W. Characterization of microsatellite loci in Pinus sylvestris L. Mol. Ecol. 1998, 7, 1260–1261. [Google Scholar]
  34. Chagne, D.; Chaumeil, P.; Ramboer, A.; Collada, C.; Guevara, A.; Cervera, M.T.; Vendramin, G.G.; Garcia, V.; Frigerio, J.M.; Echt, C.; et al. Cross-species transferability and mapping of genomic and CDNA SSRs in pines. Theor. Appl. Genet. 2004, 109, 1204–1214. [Google Scholar] [CrossRef] [PubMed]
  35. Peakall, R.; Smouse, P. GENEALEX 6.5: Genetic Analysis in Excel. Population genetic software for teaching and research. Mol. Ecol. Notes 2006, 6, 288–295. [Google Scholar]
  36. Goudet, J. FSTAT, a Program to Estimate and Test Gene Diversities and Fixation Indices (Version 2.9.4). Available online: http://www2.unil.ch/popgen/softwares/fstat.htm (accessed on 21 November 2003).
  37. Excoffier, L.; Lischer, H.E.L. Arlequin suite ver 3.5: A new series of programs to perform population genetics analyses under Linux and Windows. Mol. Ecol. Resour. 2010, 10, 564–567. [Google Scholar] [CrossRef] [PubMed]
  38. Van Oosterhout, C.; Hutchinson, W.F.; Wills, D.P.M.; Shipley, P. MICRO-CHECKER—Software for identifying and correcting g enotyping errors in microsatellite data. Mol. Ecol. Notes 2004, 4, 535–538. [Google Scholar] [CrossRef]
  39. R Core Team. R: A Language and Environment for Statistical Computing; R Foundation for Statistical Computing: Vienna, Austria, 2020; Available online: https://www.R-project.org (accessed on 15 February 2021).
  40. de Mendiburu, F. Agricolae: Statistical Procedures for Agricultural Research. R package Version 1.3-3. 2020. Available online: https://CRAN.R-project.org/package=agricolae (accessed on 15 February 2021).
  41. Wei, T.; Simko, V.R. R Package “Corrplot”: Visualization of a Correlation Matrix (Version 0.84). 2017. Available online: https://github.com/taiyun/corrplot (accessed on 15 February 2021).
  42. Chakraborty, R.; De Andrade, M.; Daiger, S.P.; Budowle, B. Apparent heterozygote deficiencies observed in DNA typing data and their implications in forensic applications. Ann. Hum. Genet. 1992, 56, 45–57. [Google Scholar] [CrossRef] [PubMed]
  43. Brookfield, J.F.Y. A simple new method for estimating null allele frequency from heterozygote deficiency. Mol. Ecol. 1996, 5, 453–455. [Google Scholar] [CrossRef] [PubMed]
  44. Kremer, F.; Vand der Stegen, J.; Gomez-Zamalloa, M.G.; Szedlak, T. Natura 2000 and Forests. Part I-II. European Commission. Technical Report—2015–088; Publications Office of the European Union: Luxembourg, 2015. [Google Scholar] [CrossRef]
  45. Andrzejewska, A. Klimat. Przyroda Kampinoskiego Parku Narodowego; Andrzejewski, R., Ed.; Kampinoski Park Narodowy: Izabelin, Poland, 2003; Volume 1, p. 728. [Google Scholar]
  46. Matula, R.; Řepka, R.; Šebesta, J.; Pettit, J.L.; Chamagne, J.; Šrámek, M.; Horgan, K.; Maděra, P. Resprouting trees drive understory vegetation dynamics following logging in a temperate forest. Sci. Rep. 2020, 10, 9231. [Google Scholar] [CrossRef]
  47. Enander, M. Val ar frötrad samt sortering av frö och plantar ar tall och gran, Svenska Skogsvfören. Tidskrift 1946, 44, 310–328. [Google Scholar]
  48. Ganatsas, P.; Tsakaldimi, M.; Thanos, C. Seed and cone diversity and seed germination of Pinus pinea in Strofylia Site of the Natura 2000 Network. Biodivers. Conserv. 2008, 17, 2427–2439. [Google Scholar] [CrossRef]
  49. Falińska, K. Przewodnik do Badań Biologii Populacji Roślin; PWN: Warsaw, Poland, 2002. [Google Scholar]
  50. Harper, J.L.; White, J. The dynamics of plant populations. In Proceedings of the Advanced Study Institute on Dynamics of Numbers in populations, Oosterbeek, The Netherlands, 7–18 September 1970; den Boer, P.J., Gradwell, G.R., Eds.; pp. 41–63. [Google Scholar]
  51. Sarukhán, J.; Harper, J.L. Studies on plant demography: Ranunculus repens L., R. bulbosus L. and R. acris L. I. Population flux and survivorship. J. Ecol. 1973, 61, 675–716. [Google Scholar] [CrossRef] [Green Version]
  52. Bergsten, U. Invigoration and IDS-sedimentation of Pinus sylvestris seeds from northern Finland. Silva Fenn. 1985, 22, 323–327. [Google Scholar] [CrossRef] [Green Version]
  53. Zentsch, W. Über Eigenschaften von Kiefernsaatgut aus verschiedenen Kronenregionen. Forstwiss. Cent. 1965, 80, 287–294. [Google Scholar] [CrossRef]
  54. Grzesiuk, S.; Kulka, K. Fizjologia i Biochemia Nasion; PWRiL: Warsaw, Poland, 1981. [Google Scholar]
  55. Jastrzębowski, S. Variability of Selected Traits of Scots Pine (Pinus Sylvestris L.) Preservation Stands’ Progeny in Poland. Ph.D. Thesis, Warsaw Agriculture University with Abstract in English, Warszawa, Poland, 2013, unpublished. [Google Scholar]
  56. Harju, A.M.; Kärkkäinen, K.; Ruotsalainen, S. Phenotypic and genetic variation in the seed maturity of Scots pine. Silvae Genet. 1996, 45, 205–211. [Google Scholar]
  57. Hilli, A.; Hokkanen, T.; Hyvönen, J.; Sutinen, M.L. Long-term variation in Scots pine seed crop size and quality in northern Finland. Scand. J. For. Res. 2008, 23, 395–403. [Google Scholar] [CrossRef]
  58. Sabor, J. Wpływ stosowanych zabiegów pielęgnacyjnych i rębni na zmianę struktury genetycznej drzewostanów. Sylwan 2003, 2, 39–48. [Google Scholar]
  59. Mitton, J.B. Apparent overdominance in natural plant populations. In: Concepts and breeding of heterosis in crop plants. Crop Sci. Soc. Am. 1998, 677, 57–69. [Google Scholar]
  60. Dzialuk, A.; Burczyk, J. Zmiany struktury genetycznej pomiędzy populacją rodzicielską a potomną w drzewostanie nasiennym sosny zwyczajnej (Pinus sylvestris L.). Sylwan 2006, 10, 30–38. [Google Scholar]
  61. Yazdani, R.; Muona, O.; Rudin, D.; Szmidt, A.E. Genetic Structure of a Pinus sylvestris L. Seed-Tree Stand and Naturally Regenerated Understory. For. Sci. 1985, 31, 430–436. [Google Scholar]
  62. Muona, O.; Yazdani, R.; Rudin, D. Genetic change between life stages in Pinus sylvestris L.: Allozyme variation in seeds and planted seedlings. Silvae Genet. 1987, 36, 39–42. [Google Scholar]
  63. Petit, C.; Fréville, H.; Mignot, A.; Colas, B.; Riba, M.; Imbert, E.; Hurtrez-Boussés, S.; Virevaire, M.; Olivieri, I. Gene flow and local adaptation in two endemic plant species. Biol. Conserv. 2001, 100, 21–34. [Google Scholar] [CrossRef]
  64. Nowakowska, J.A.; Zachara, T.; Konecka, A. Zmienność genetyczna odnowienia i drzewostanu macierzystego sosny (Pinus sylvestris L.) i świerka (Picea abies L. Karst.). Leśne Pr. Badaw. 2014, 75, 47–54. [Google Scholar]
  65. Rajora, O.P. Genetic biodiversity impacts of silvicultural practices and phenotypic selection in white spruce. Theor. Appl. Genet. 1999, 99, 954–961. [Google Scholar] [CrossRef]
  66. Kosińska, J.; Lewandowski, A.; Chalupka, W. Genetic variability of Scots pine maternal populations and their progenies. Silva Fenn. 2007, 41, 5–12. [Google Scholar] [CrossRef] [Green Version]
  67. Rutkowski, P.; Konatowska, M. Influence of human activity on forest plant communities, during the past 200 years, in the example of Zielonka Experimental Forest (Poland). In Conservation and Sustainable Use of Wild Plant Diversity; Andrianos, L., Sneep, J.W., Kenanidis, K., Eds.; Institute of Theology and Ecology Orthodox Academy of Crete: Chania, Greece, 2011. [Google Scholar]
  68. Kowalska, A.; Kołaczkowska, E. Regeneration-degeneration processes in the inland dune forests in protected areas of central Poland (Kampinos National Park). Misc. Geogr. Reg. Stud. Dev. 2016, 19, 56–63. [Google Scholar] [CrossRef] [Green Version]
  69. Konatowska, M.; Rutkowski, P. Porównanie Zbiorowisk Roślinnych z Połowy XX i Początku XXI Wieku w Nadleśnictwie Doświadczalnym Zielonka (Comparison of Plant Communities of Zielonka Experimental Forest from the Half of the 20th and the Beginning of 21th Century); University of Life Sciences in Poznan: Poznan, The Netherlands, 2021; p. 526. [Google Scholar]
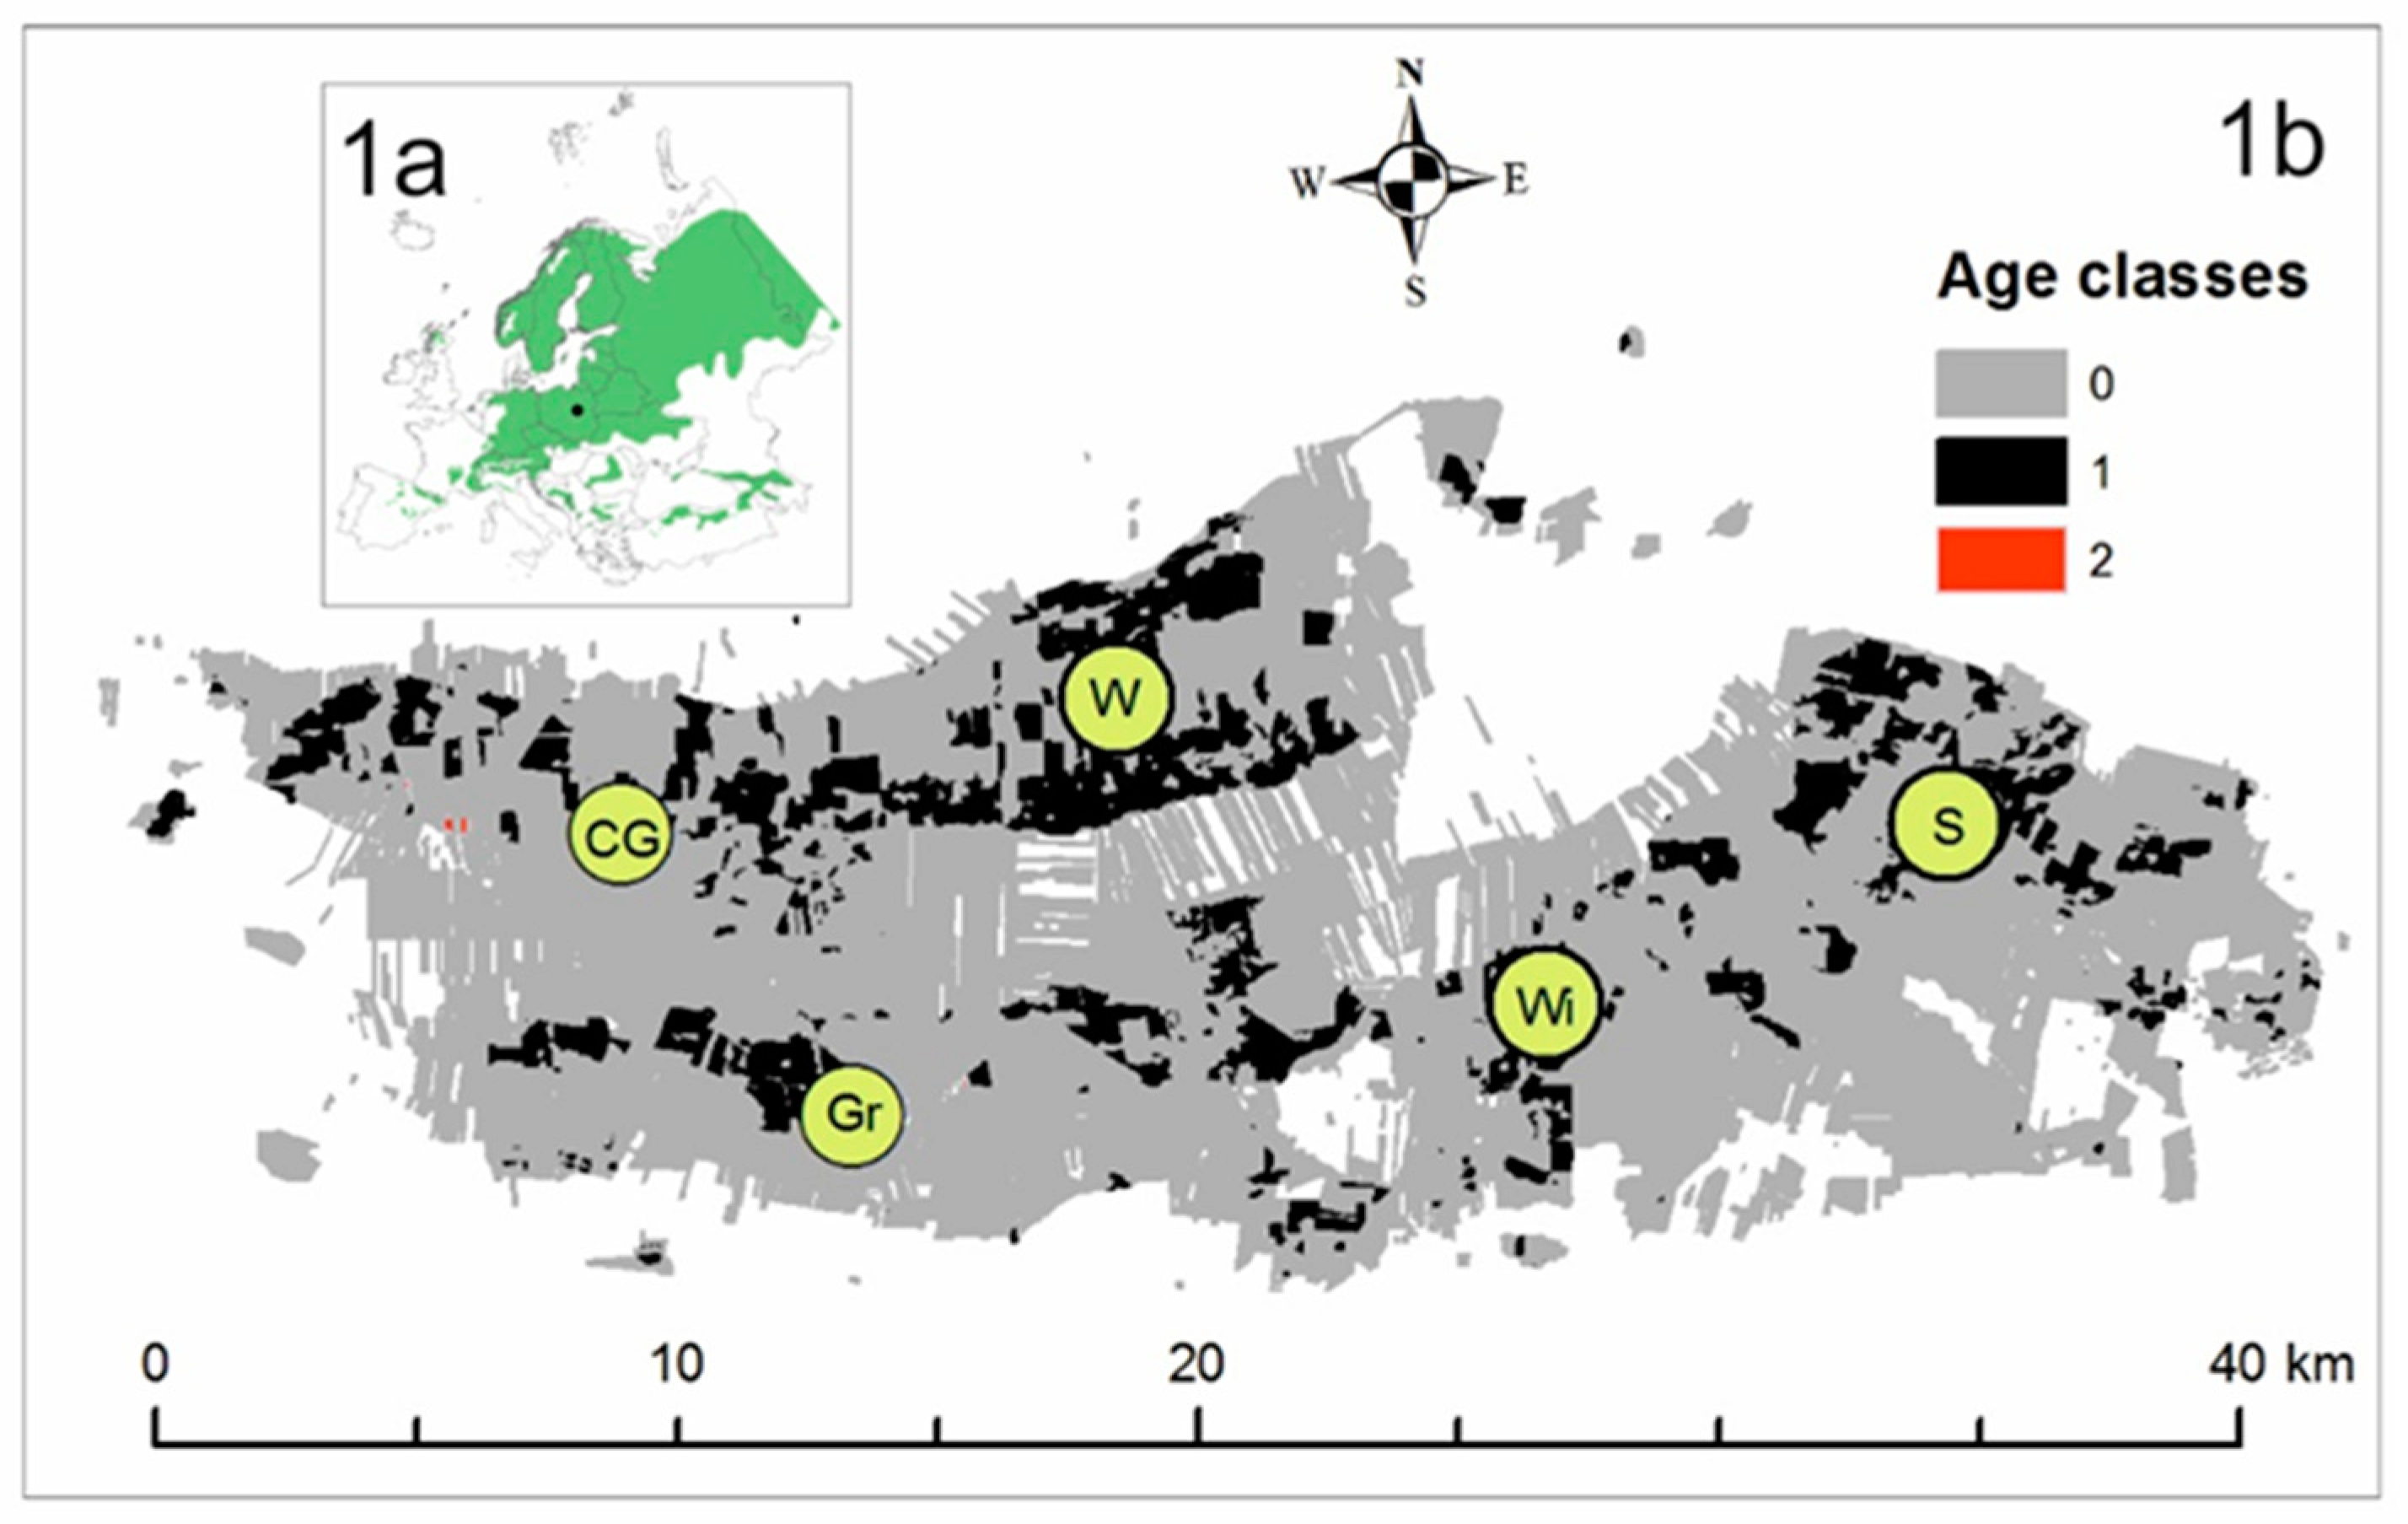
Figure 1. Study area of the national park (1a) showing the natural range of the pine and analysed locations (1b): CG—Czerwińskie Góry; Gr—Granica; W—Wilków; S—Sieraków; Wi—Wiersze. Age classes: 0 (≤100 years), 1 (101‒200 years), 2 (>200 years).
Forests 12 01055 g001
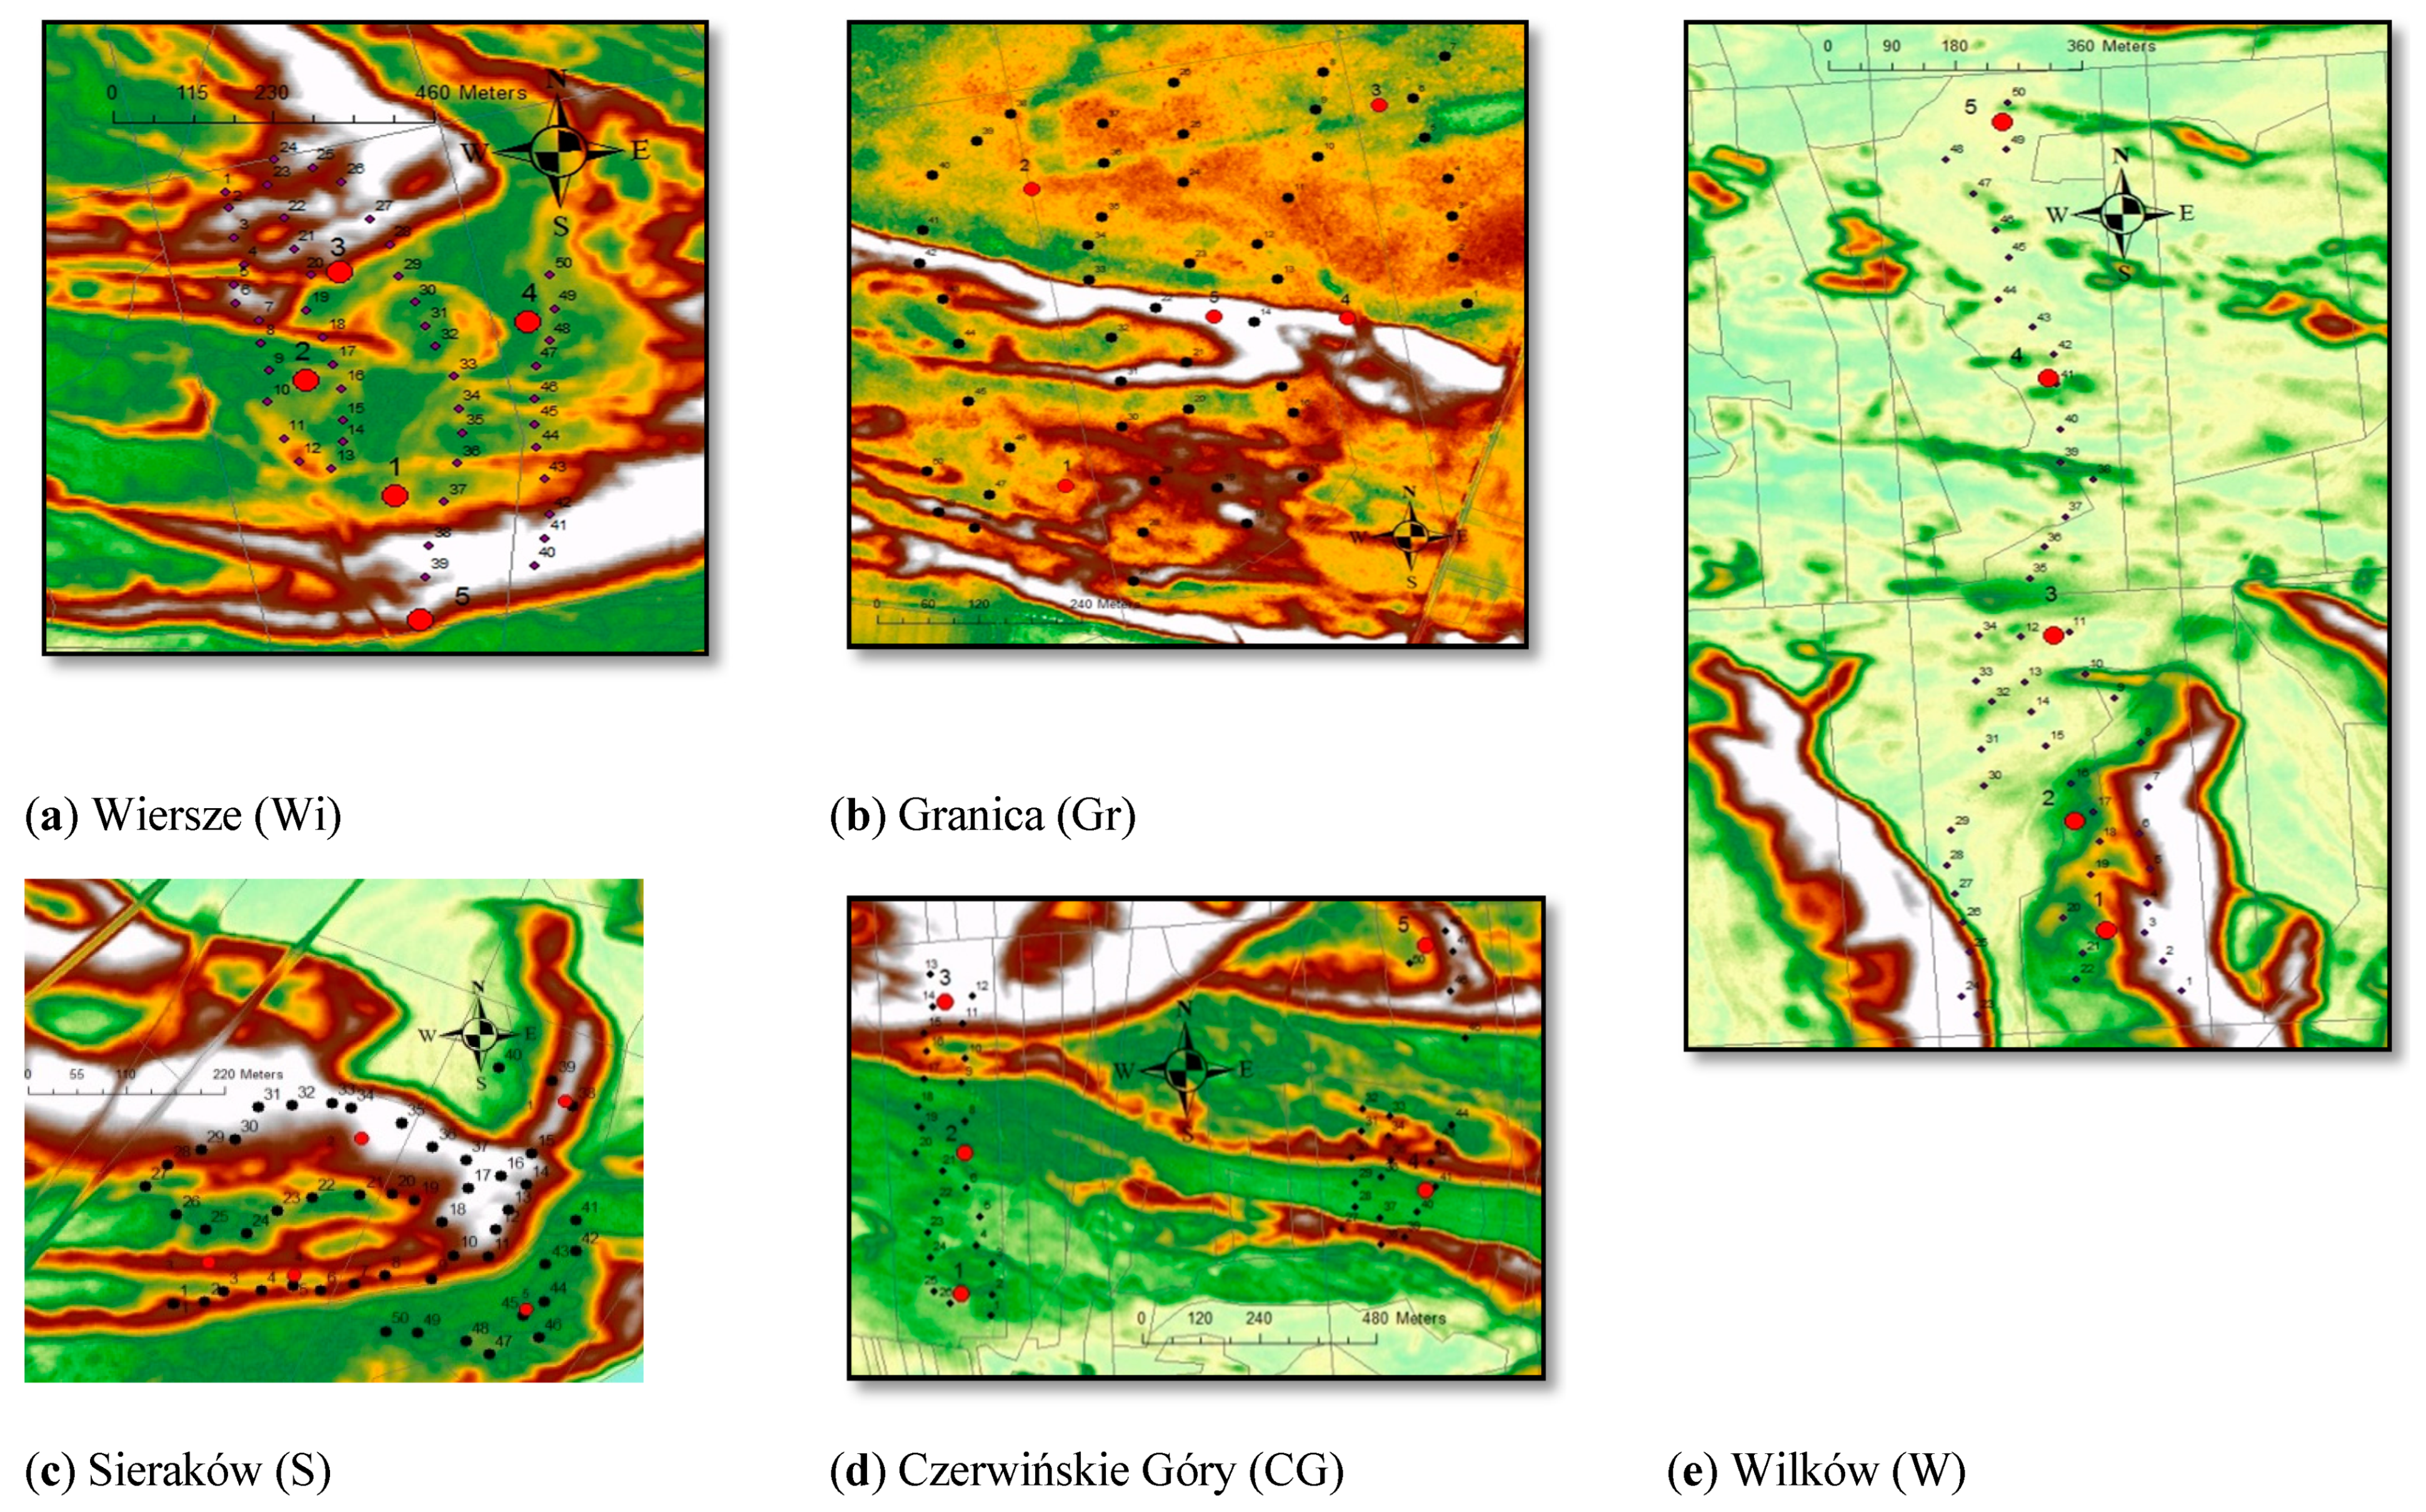
Figure 2. Distribution of the studied trees (black dots) in research localizations ((a)-Wi; (b)-Gr; (c)-S; (d)-CG; (e)-W) on the relief maps (white—the highest parts of the inland dunes; brown, yellow, and green—intermediate; light blue—lower terrain locations). Red dots show the locations of soil pits.
Forests 12 01055 g002
Figure 3. Box plot of the number of cones on sampled dominant trees for each location. The groups assigned the same letter are not statistically different (p ≤ 0.05) according to the results of Tukey post hock test. CG—Czerwińskie Góry; Gr—Granica; W—Wilków; S—Sieraków; Wi—Wiersze.
Forests 12 01055 g003
Figure 4. Pair plots for selected variables: Nat. R.—natural regeneration based on field observations; N. Cones—mean number of cones per tree; Seeds—mean seeds per cone; Seedlings—possible regeneration of 50 trees for each location; Na—number of alleles; Ne—effective number of alleles; I—Shannon index (genotypes); Ho—observed heterozygosity; Fis—coefficient of inbreeding. Pairs are shown as scatterplots (above the diagonal) and summarised by the Pearson correlation (below the diagonal).
Forests 12 01055 g004
Table 1. The characteristics of the locations.
LocationCzerwińskie GóryWilkówGranicaSierakówWiersze
AbbreviationCGWGrSWi
Coordinates20°23′36.67′′ E 52°20′27.693′′ N20°32′34.005′′ E 52°21′45.607′′ N20°27′50.019′′ E 52°17′21.605′′ N20°46′34.957′′ E 52°20′12.144′′ N20°39′45.706′′ E 52°18′34.157′′ N
Age * of the dominant P. sylvestris200–210 (avg.: 205)180–200 (avg.: 190)160–170 (avg.: 165)190–200 (avg.: 195)app. 160
Plant communityQuerco roboris-PinetumQuerco roboris-Pinetum.SNFPC/Querco CarpinetumQuerco roboris-PinetumQuerco roboris-Pinetum
Dominant soil typeAP, partially DBAAP, partially DBAAP, partially LvAP, partially DBAAP, partially DBA
SNFPC—substitute of natural forest plant community; AP—Albic podzols; DBA—Dystric Brunic Arenosols (rusty soils in Polish nomenclature); Lv—Luvisols soils. * Unpublished data from Kampinoski National Park.
Table 2. Characteristics of amplified loci of microsatellite nuclear DNA.
LociRepeat Motif.Starter SequencesProduct Size
SPAG 7.14(VIC)(TG)17(AG)21F: TTCGTAGGACTAAAAATGTGTG
R: CAAAGTGGATTTTGACCG
113–189
SPAC 11.6(NED)(CA)29(TA)7F: CTTCACAGGACTGATGTTCA
R: TTACAGCGGTTGGTAAATG
131–167
NZPR 11.4(6-FAM)(CA)15(CA)13(TA)22F: AAGATGACCCACATGAAGTTTGG
R: GGAGCTTTATAACATATCTCGATGC
180–236
SsrPt_ctg4363(VIC)(AT)10F: TAATAATTCAAGCCACCCCG
R: AGCAGGCTAATAACAACACGC
86–112
PtTX3107(PET)(CAT)14F: AAACAAGCCCACATCGTCAATC
R: TCCCCTGGATCTGAGGA
150–174
Table 3. Summary of the number of seedlings of all tree and shrub species in each location.
Research PlotsCGGrSWiWTotal
Carpinus betulus 1 1
Corylus avellana 7 7
Frangula alnus3419265 84
Juniperus communis 11
Pinus sylvestris 321336
Pyrus pyraster1 1
Quercus robur62510326
Sorbus aucuparia 2 2
Viburnum opulus 14 14
Total414563167172
Table 4. Biodiversity at the genetic level in the analysed forest locations: Na—number of alleles; Ne—effective number of alleles; I—Shannon index (genotypes); Ho—observed heterozygosity; Fis—coefficient of inbreeding. Statistical significance: * p ≤ 0.05.
Population SamplesNaNeIHoFis
SMean5016.00010.1412.3040.6340.260 *
SE 3.5073.2050.3110.089
WMean5015.0009.2952.2170.5880.309 *
SE 3.6062.7640.3210.056
CGMean5017.4009.8332.3160.6610.230 *
SE 4.1302.7950.3220.079
GrMean5016.0008.9672.2380.6400.246 *
SE 3.5362.7790.2980.091
WiMean4714.0007.8192.1280.7770.075
SE 3.7552.1330.3080.081
Table 5. Probable frequencies of null alleles calculated in Micro-Checker [38].
LocusNull PresentOosterhout et al., 2004 [38]Chakraborty et al., 1992 [42]Brookfield 1996a [43]Brookfield 1996b [43]
PtTX3107no0.09260.10810.07640.5257
SsrPt_ctg4363no–0.1321–0.1065–0.09980.2675
SPAG 7.14no–0.0513–0.0393–0.03820.2629
NZPR 11.4no0.01410.01250.01160.3135
SPAC 11.6yes0.15690.18470.14980.4661
Table 6. Comparison of genetic differentiation (Fst) between populations. Statistically significant differences are shown above the diagonal.
PopulationsS WCGGrWi
S 0.000nsNsns0.000
W0.0000.000Nsns0.000
CG 0.0010.0030.000ns0.001
Gr0.0000.0000.0000.0000.002
Wi 0.0260.0260.0190.0170.000
Ns—no statistical significance.
Publisher’s Note: MDPI stays neutral with regard to jurisdictional claims in published maps and institutional affiliations.