Article

Comparative Transcriptome Profiling of Resistant and Susceptible Taxodium Trees in Responding to the Infection by Pestalotiopsis maculans

1
Jiangsu Engineering Research Center for Taxodium Rich, Germplasm Innovation and Propagation, Institute of Botany, Jiangsu Province and Chinese Academy of Sciences, Nanjing 210014, China
2
Jiangsu Key Laboratory for the Research and Utilization of Plant Resources, Institute of Botany, Jiangsu Province and Chinese Academy of Sciences, Nanjing 210014, China
*
Author to whom correspondence should be addressed.
Forests 2021, 12(8), 1090; https://doi.org/10.3390/f12081090
Submission received: 4 May 2021 / Revised: 6 August 2021 / Accepted: 11 August 2021 / Published: 14 August 2021
(This article belongs to the Section Genetics and Molecular Biology)

Abstract

:
With the tolerance of flooding and strong winds, Taxodium has been widely recognized as an ecologically important tree in China. Red blight disease, caused by the fungal pathogen Pestalotiopsis maculans, is known as one of the most severe leaf diseases of Taxodium. However, limited information is available regarding the host plant defense response to this pathogen. To uncover the mechanism of the plant–pathogen interaction, we performed an essential comparative transcriptome analysis of the resistant species T. distichum and susceptible species T. mucronatum after P. maculans infection. A total of 50,763 unigenes were assembled, of which 34,651 unigenes were annotated in eight public databases. Differentially expressed gene (DEG) analysis identified 3420 and 4414 unigenes in response to infection in T. distichum and T. mucronatum, respectively. The transcriptome analysis exhibited differential expression patterns in the two species in response to the infection. Moreover, this study first found that, compared to susceptible T. mucronatum, T. distichum can effectively perceive the invasion of P. maculans and make a valid response through SA signal pathway. These data provided not only new insights into the resistance mechanisms in the highly resistant species but also promising genetic resources for improving the fungal pathogen tolerance in Taxodium breeding.

1. Introduction

Taxodium mucronatum Tenore and Taxodium distichum (L.) Rich are coniferous trees, 30–40 m high, belonging to the Taxodiaceae family [1]. T. mucronatum is distributed in Mexico, while T. distichum is native to the southeastern United States [2]. T. distichum is well known for its tolerance to flooding and strong winds; in comparison, T. mucronatum is more tolerant to salinity and alkalinity soils but less tolerant to flooding [3,4]. They were introduced to southeastern China for ecological and ornamental purposes in the last century. Nowadays, both of them have been proved to be adaptable in southeastern China and are now widely used for coastal shelter forest construction and ecological restoration of wetlands [5]. In our previous work, controlled Taxodium hybridization (mainly between T. distichum and T. mucronatum) was performed to select superior clones from the progeny [6], such as T. ‘Zhongshanshan 302′ (T. distichum ♀ × T. mucronatum ♂), which showed great improvements in growth rate, salt, and flooding tolerance [7].
Red blight disease, caused by Pestalotiopsis maculans, induces severe damage in the leaves of Taxodium species. Notably, T. mucronatum is sensitive to this pathogen, while T. distichum is more resistant to red blight disease. The diseased leaves of Taxodium plants exhibit chlorosis, wilting, and premature falling off, especially under high-temperature and high-humidity conditions, which affect plant growth and development seriously. However, techniques for chemically controlling red blight disease are limited and uneconomical. Therefore, the most economical, environmentally safe, and effective strategies are generating disease-resistant hybrid Taxodium plants by understanding the molecular defense mechanisms.
Through evolution, plants have developed a multilayered defense system of innate immunity conferring resistance against pathogens. The first layer is the recognition of pathogen-associated molecular patterns (PAMPs) through pattern recognition receptors (PRRs) in plants, which then triggers a series of defense responses that are collectively known as pattern-triggered immunity (PTI). PTI is considered to be usually triggered by extracellular receptor proteins and induces ion fluxes across the plasma membrane, oxidative bursts, and activation of the mitogen-activated protein kinase (MAPK) cascade that results in defense responses [8]. In the second layer, to bypass PTI, pathogens secrete a series of small unique protein molecules (effectors) that prevent recognition by the host cells. In response, plants develop a resistance (R) gene that can interact with these effectors to initiate the second layer of defense response, or effector-triggered immunity (ETI). ETI always activates the plant’s hypersensitivity response (HR), causing tissue necrotic lesions and programmed cell death to restrict further penetration of infected pathogens to adjacent tissue and further inducing plant systemic acquired resistance. Unfortunately, the mechanisms involved in the pathogen resistance in Taxodium have barely been explored [9].
In this study, to obtain detailed genetic information and to understand the resistance mechanism in Taxodium, the transcriptome profiles of the leaves of resistant and susceptible species infected with P. maculans were obtained. The genome-wide data were analyzed to identify candidate genes and critical pathways involved in pathogen resistance, signaling perception, transduction, and metabolism in T. distichum and T. mucronatum. The comparison of expression profiles after fungal infection in the two closely related Taxodium species will facilitate further investigation of the molecular mechanism of fungal pathogen tolerance in other ecologically important trees.

2. Materials and Methods

2.1. Plant Materials and P. maculans Inoculation

Two-year-old T. mucronatum and T. distichum clones were planted, one per plant, in plastic pots containing 3:1:1 (ν:ν:ν) clay, perlite, and vermiculite in a ventilated greenhouse of the Nanjing Botanical Garden (35°50′ N, 45°70′ E). P. maculans pathogen isolated from the leaves of T. mucronatum with red blight disease was incubated on potato-dextrose agar plates. Conidia were harvested from the plates by rinsing with sterile distilled water and diluted to a concentration of 1.5 × 10⁷ spores/mL for inoculation. The suspension of conidia was sprayed on the leaves of T. mucronatum and T. distichum. The plants were incubated for 48 h at 28 °C and under 95.0% relative humidity and then were transferred back to the previous growth conditions. Control leaves were treated with sterile water. After 5 days, observable symptoms were found only on the leaves of T. mucronatum after P. maculans inoculation, and the samples were cut and immediately placed in liquid nitrogen and then stored at −80 °C for RNA extraction and further analysis. Each sample contained five leaves from three different lines, as biological replicates. The plant materials were collected in July 2018.

2.2. RNA Extraction and cDNA Library Construction and Sequencing

Total RNA was extracted using the TRIzolfi kit (Invitrogen, Carlsbad, CA, USA) in accordance with the manufacturer’s protocol. Before library preparation and sequencing, RNA concentration was estimated using a Qubit RNA Assay kit in a Qubit 2.0 Flurometer (Life Technologies, Carlsbad, CA, USA), and the integrity of all extracted RNA was assessed using the RNA Nano 6000 assay kit of the Agilent Bio-analyzer 2100 system (Agilent Technologies, Santa Clara, CA, USA). cDNA libraries were generated using NEBNext Ultra RNA Library Prep Kit for Illumina (NEB, Ipswich, MA, USA) following the manufacturer’s recommendations. The libraries were then sequenced on an Illumina HiSeq 2000 platform, and 150 bp paired-end reads were generated.

2.3. De Novo Assembly and Functional Annotation

To acquire valid sequencing data, the raw data were evaluated using FastQC software (http://www.bioinformatics.babraham.ac.uk/projects/fastqc/; accessed on 30 January 2019), and reads with adapters, poly-Ns, as well as low-quality reads were discarded. All the clean reads were assembled using a de novo assembly program Trinity. For all libraries, short reads with a certain length were first assembled into longer contiguous sequences (contigs) based on their overlap regions. Then different contigs from another transcript and their distance were further recognized by mapping clean reads back to the corresponding contigs based on their paired-end information, and thus the sequence of the transcripts was produced. Finally, the Tgicl software package was used to remove spliced and redundant sequences to acquire non-redundant unigenes that were as long as possible. Potential transcript sequences were clustered using the TGI Clustering tool to obtain uni-transcripts [10]. For gene function annotation, all acquired unigenes were searched against the following databases: NR (NCBI non-redundant protein sequences), Protein family (Pfam), KOG/COG/eggNOG (Clusters of Orthologous Groups of proteins), Swiss-Prot (a manually annotated and reviewed protein sequence database), Kyoto Encyclopedia of Genes and Genomes (KEGG), and Gene Ontology (GO).

2.4. Analysis of Differential Expression Genes and Gene Annotation

All valid reads from each sample were back-aligned to the assembled transcriptome using RSEM software [11], and the read count for each gene was then generated from the mapping results. For differential expression analysis, the two different groups were statistically compared by the DESeq R package (1.10.1). This package provides statistical methods for testing the differential expression via a negative binomial distribution in the digital gene expression data [12].
Criteria for classification as significant DEGs included false detection rates (FDRs) ≤ 0.05 and unigenes with at least a four-fold change (|log2 (fold change)| ≥ 2) were assigned as differentially expressed [13].

2.5. Validation of RNA-Seq Data by Quantitative Real-Time PCR (qRT-PCR) Analysis

To verify the RNA-Seq analysis, 9 unigenes were randomly selected for validation by qRT-PCR. All specific primers employed are presented in Table S1. A total of 1 μg of extracted RNA was reverse-transcribed to cDNA using a PrimeScript RT Kit with gDNA Eraser (TaKaRa, Dalian, China). Quantitative real-time PCR was conducted in 96-well plates and performed on the Analitik Jena qTOWER2.2 PCR System (Biometra, Gottingen, Germany). Each reaction used the following program: 95 °C for 2 m, followed by 40 cycles of 95 °C for 10 s, 58 °C for 10 s, and 72 °C for 15 s. Three technical replicates were taken for each sample, and experiments were performed on three biological replicates to ensure reproducibility and reliability. The gene expression levels were analyzed by the comparative Ct method [14].

3. Results

3.1. Transcriptome Sequencing and De Novo Assembly

A total of 12 cDNA libraries were constructed from the leaves of T. mucronatum and T. distichum with or without P. maculans infection (three biological replicates for each treatment). Raw data were qualified and screened to generate 285,841,217 clean reads, ranging from 20.30 to 27.83 million for each sample. GC contents ranged from 44.08% to 45.78%. The Q30 ranged from 93.64% to 94.81%, suggesting the high quality of these data (Table 1). The de novo assembly generated 50,763 unigenes with an average length of 1482.48 bp and an N50 of 2315 bp. Of these unigenes, 13,977 (27.53%) were 300–500 bp in length, 11,159 (21.98%) were 501–1000 bp in length, 12,497 (24.62%) were 1–2 kb in length, and the remaining 13,130 (25.87%) were >2 kb in length (Table S2).

3.2. Gene Annotation of Assembled Transcripts

All the 50,763 assembled unigenes were annotated by BLASTing against the eight public databases. In total, there were 34,651 unigenes annotated in at least one of the eight databases, accounting for 68.26%. Among the annotated unigenes, 33,027 (95.31%) had high homology with the sequences in the NR database, 32,010 (92.38%) were annotated in the eggNOG database, and 22,635 (65.32%) were annotated in the Swiss-Prot database (Figure 1A). The details of the other database proportions are shown in Figure 1A. Moreover, the species distribution of all annotated unigenes is shown in Figure 1B, and the top-three matches were Picea sitchensis (24.82%), Dothistroma septosporum (8.56%), and Amborella trichopoda (7.73%) (Figure 1B).
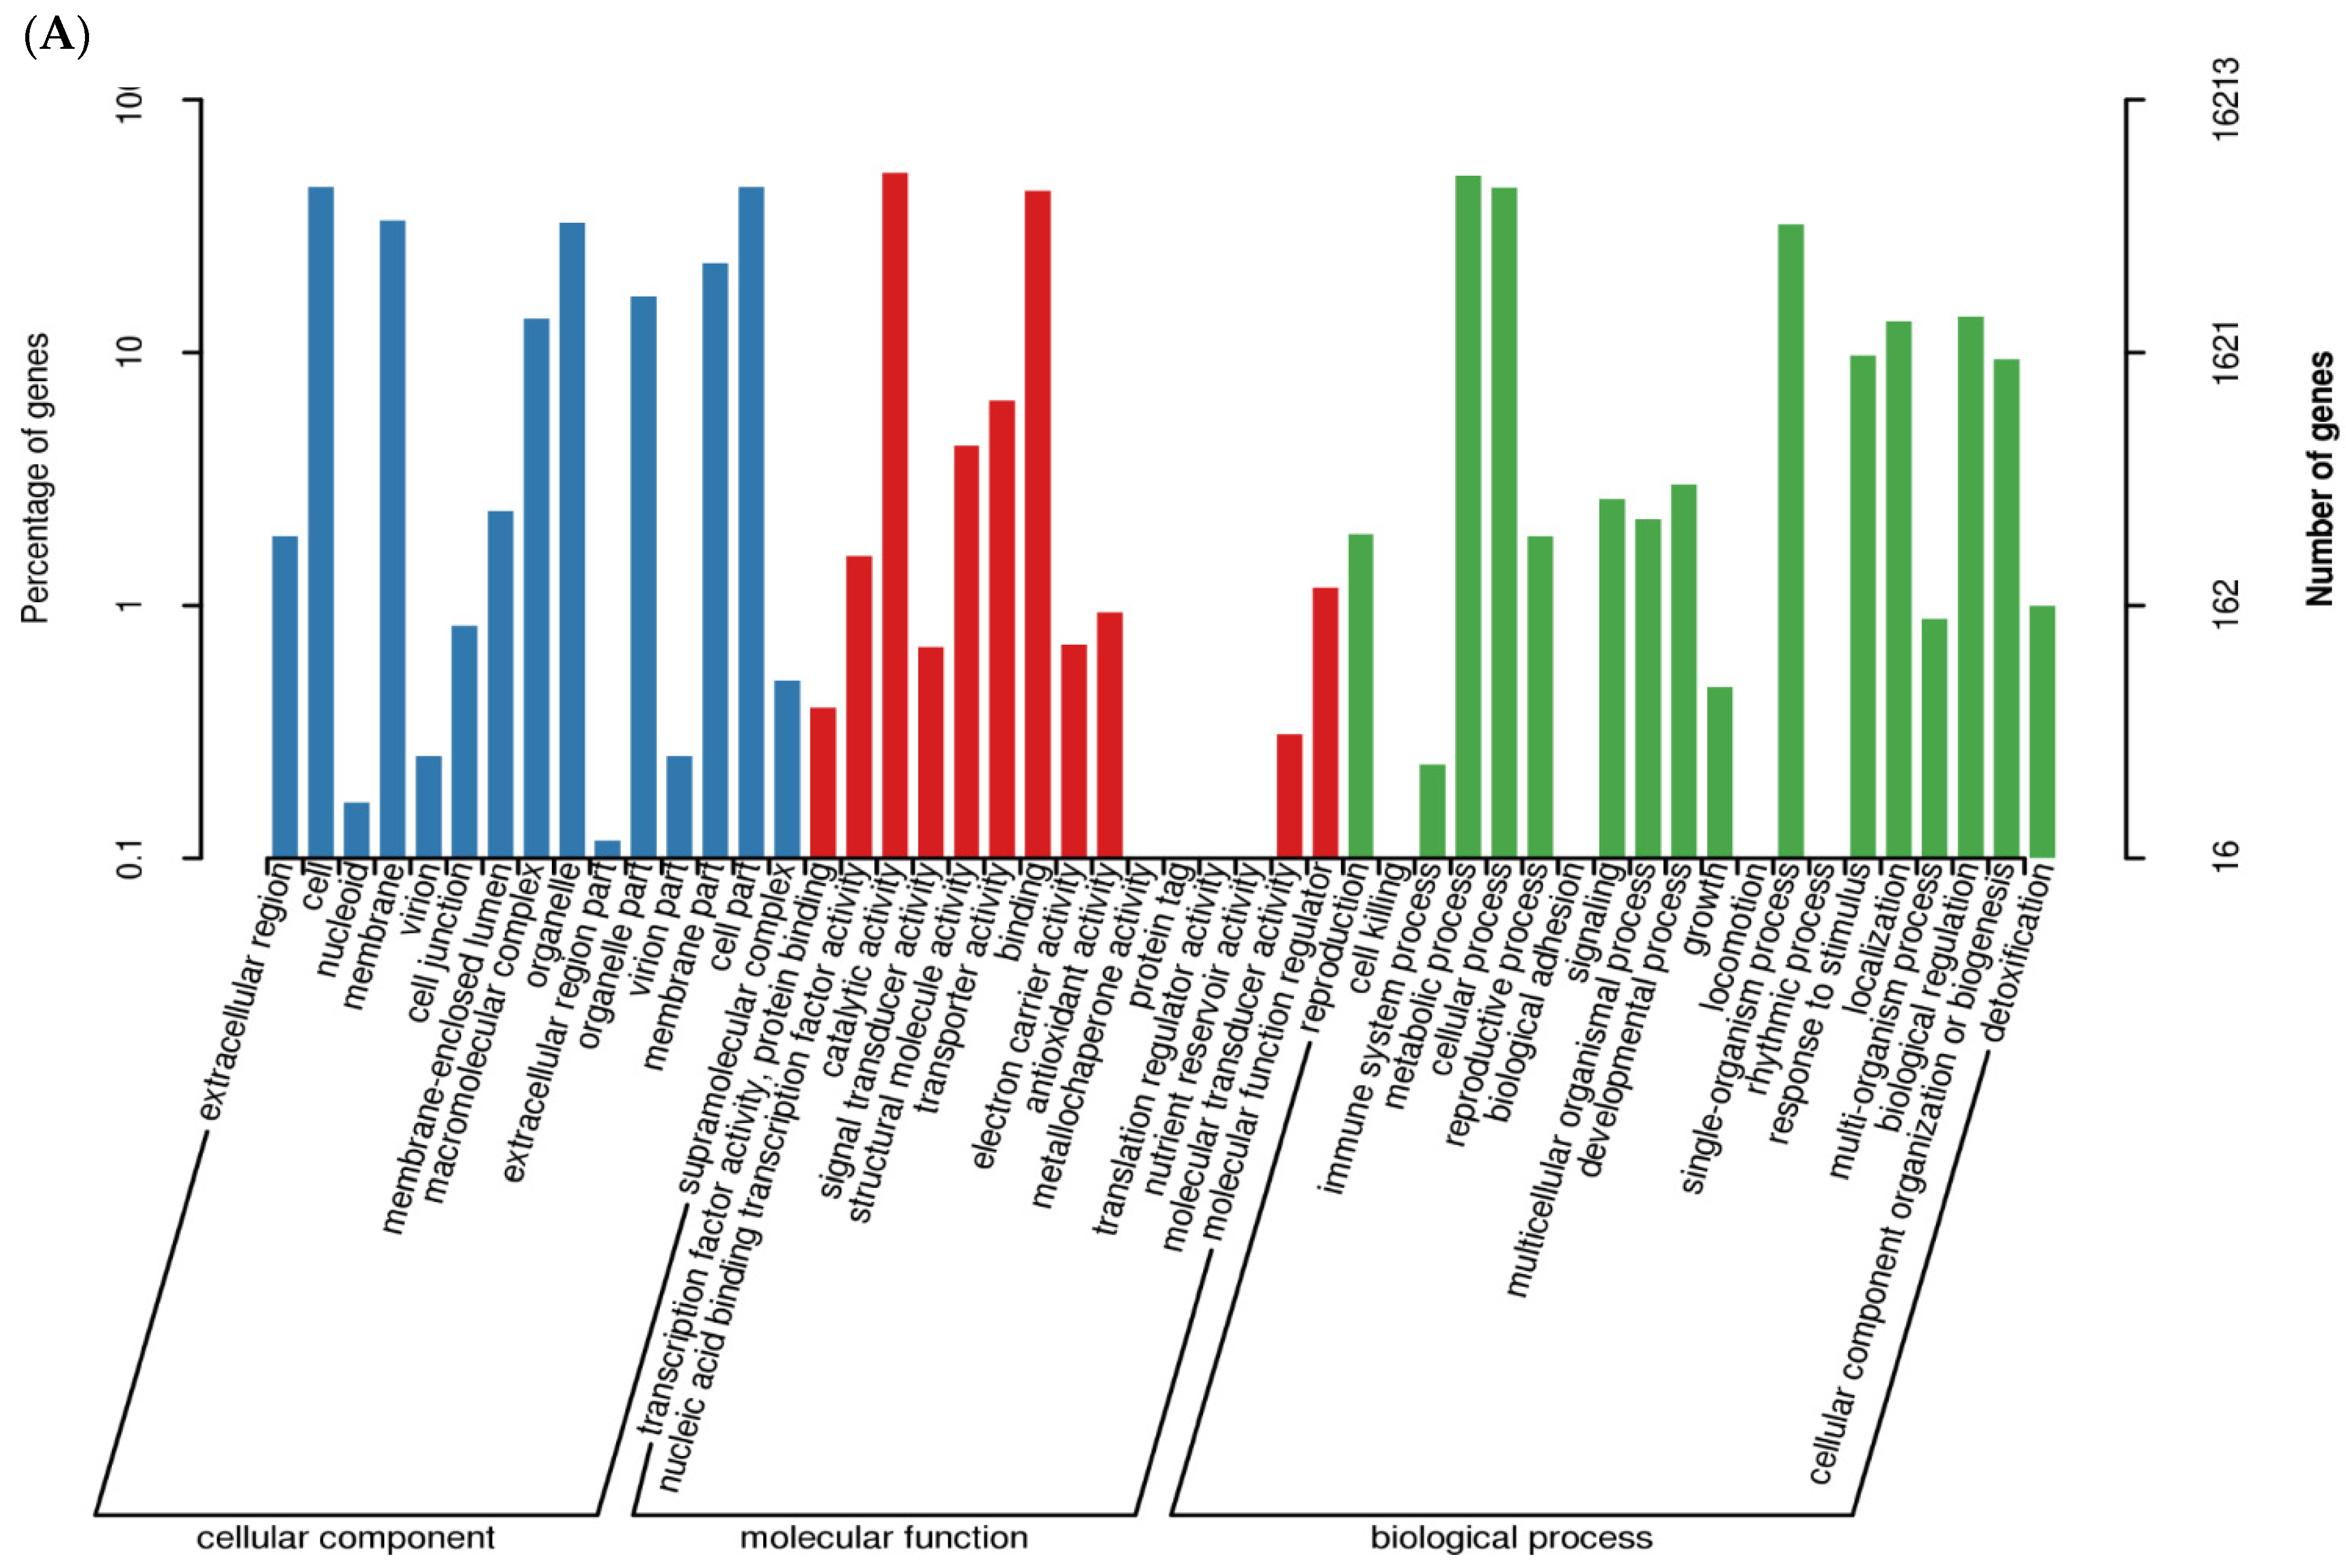
In our study, there were 16,213 unigenes successfully annotated to 50 Gene Ontology (GO) terms. The highest number of unigenes was associated with the molecular function category, possessing 21,983 (36.16%) GO annotations with 15 GO terms, followed by 21,780 (35.83%) unigenes defined to be involved in the biological process category with 20 GO terms, and 17,028 (28.01%) unigenes were classified into the cellular component category with 15 GO terms. Genes in the molecular functions category were primarily sorted into “catalytic activity, binding, transporter activity, and structural molecule activity.” Of the biological process and cellular component categories, the most frequent assignments were “metabolic processes, cellular process, single-organism process, and biological regulation” and ”cell, cell part, membrane, and organelle,” respectively (Figure 2A).
To elucidate the functionality of the transcriptomes at the protein level, COG analysis revealed 13,390 unigenes that were assigned to 25 COG clusters (Figure 2B). Among these clusters, the highest representation group was “general function prediction only” (1749, 13.26%), followed by “translation, ribosomal structure, and biogenesis” (1393, 10.56%), “carbohydrate transport and metabolism” (1310, 9.93%), “posttranslational modification, protein turnover, and chaperones” (1208, 9.16%), and “signal transduction mechanisms” (1159, 8.79%).
To further identify the biological pathways activated in this dataset, KEGG pathway analyses were conducted, which in total showed that 9288 unigenes were assigned to 128 KEGG pathways. Among them, the top mapped pathways included ribosome (pathway ID Ko03010), carbon metabolism (pathway ID Ko01200), biosynthesis of amino acids (pathway ID Ko01230), and protein processing in the endoplasmic reticulum (pathway ID Ko04141), with 639, 500, 388, and 348 unigenes assigned, respectively (Table S3).

3.3. Different Expressed Genes with and without P. maculans Inoculation

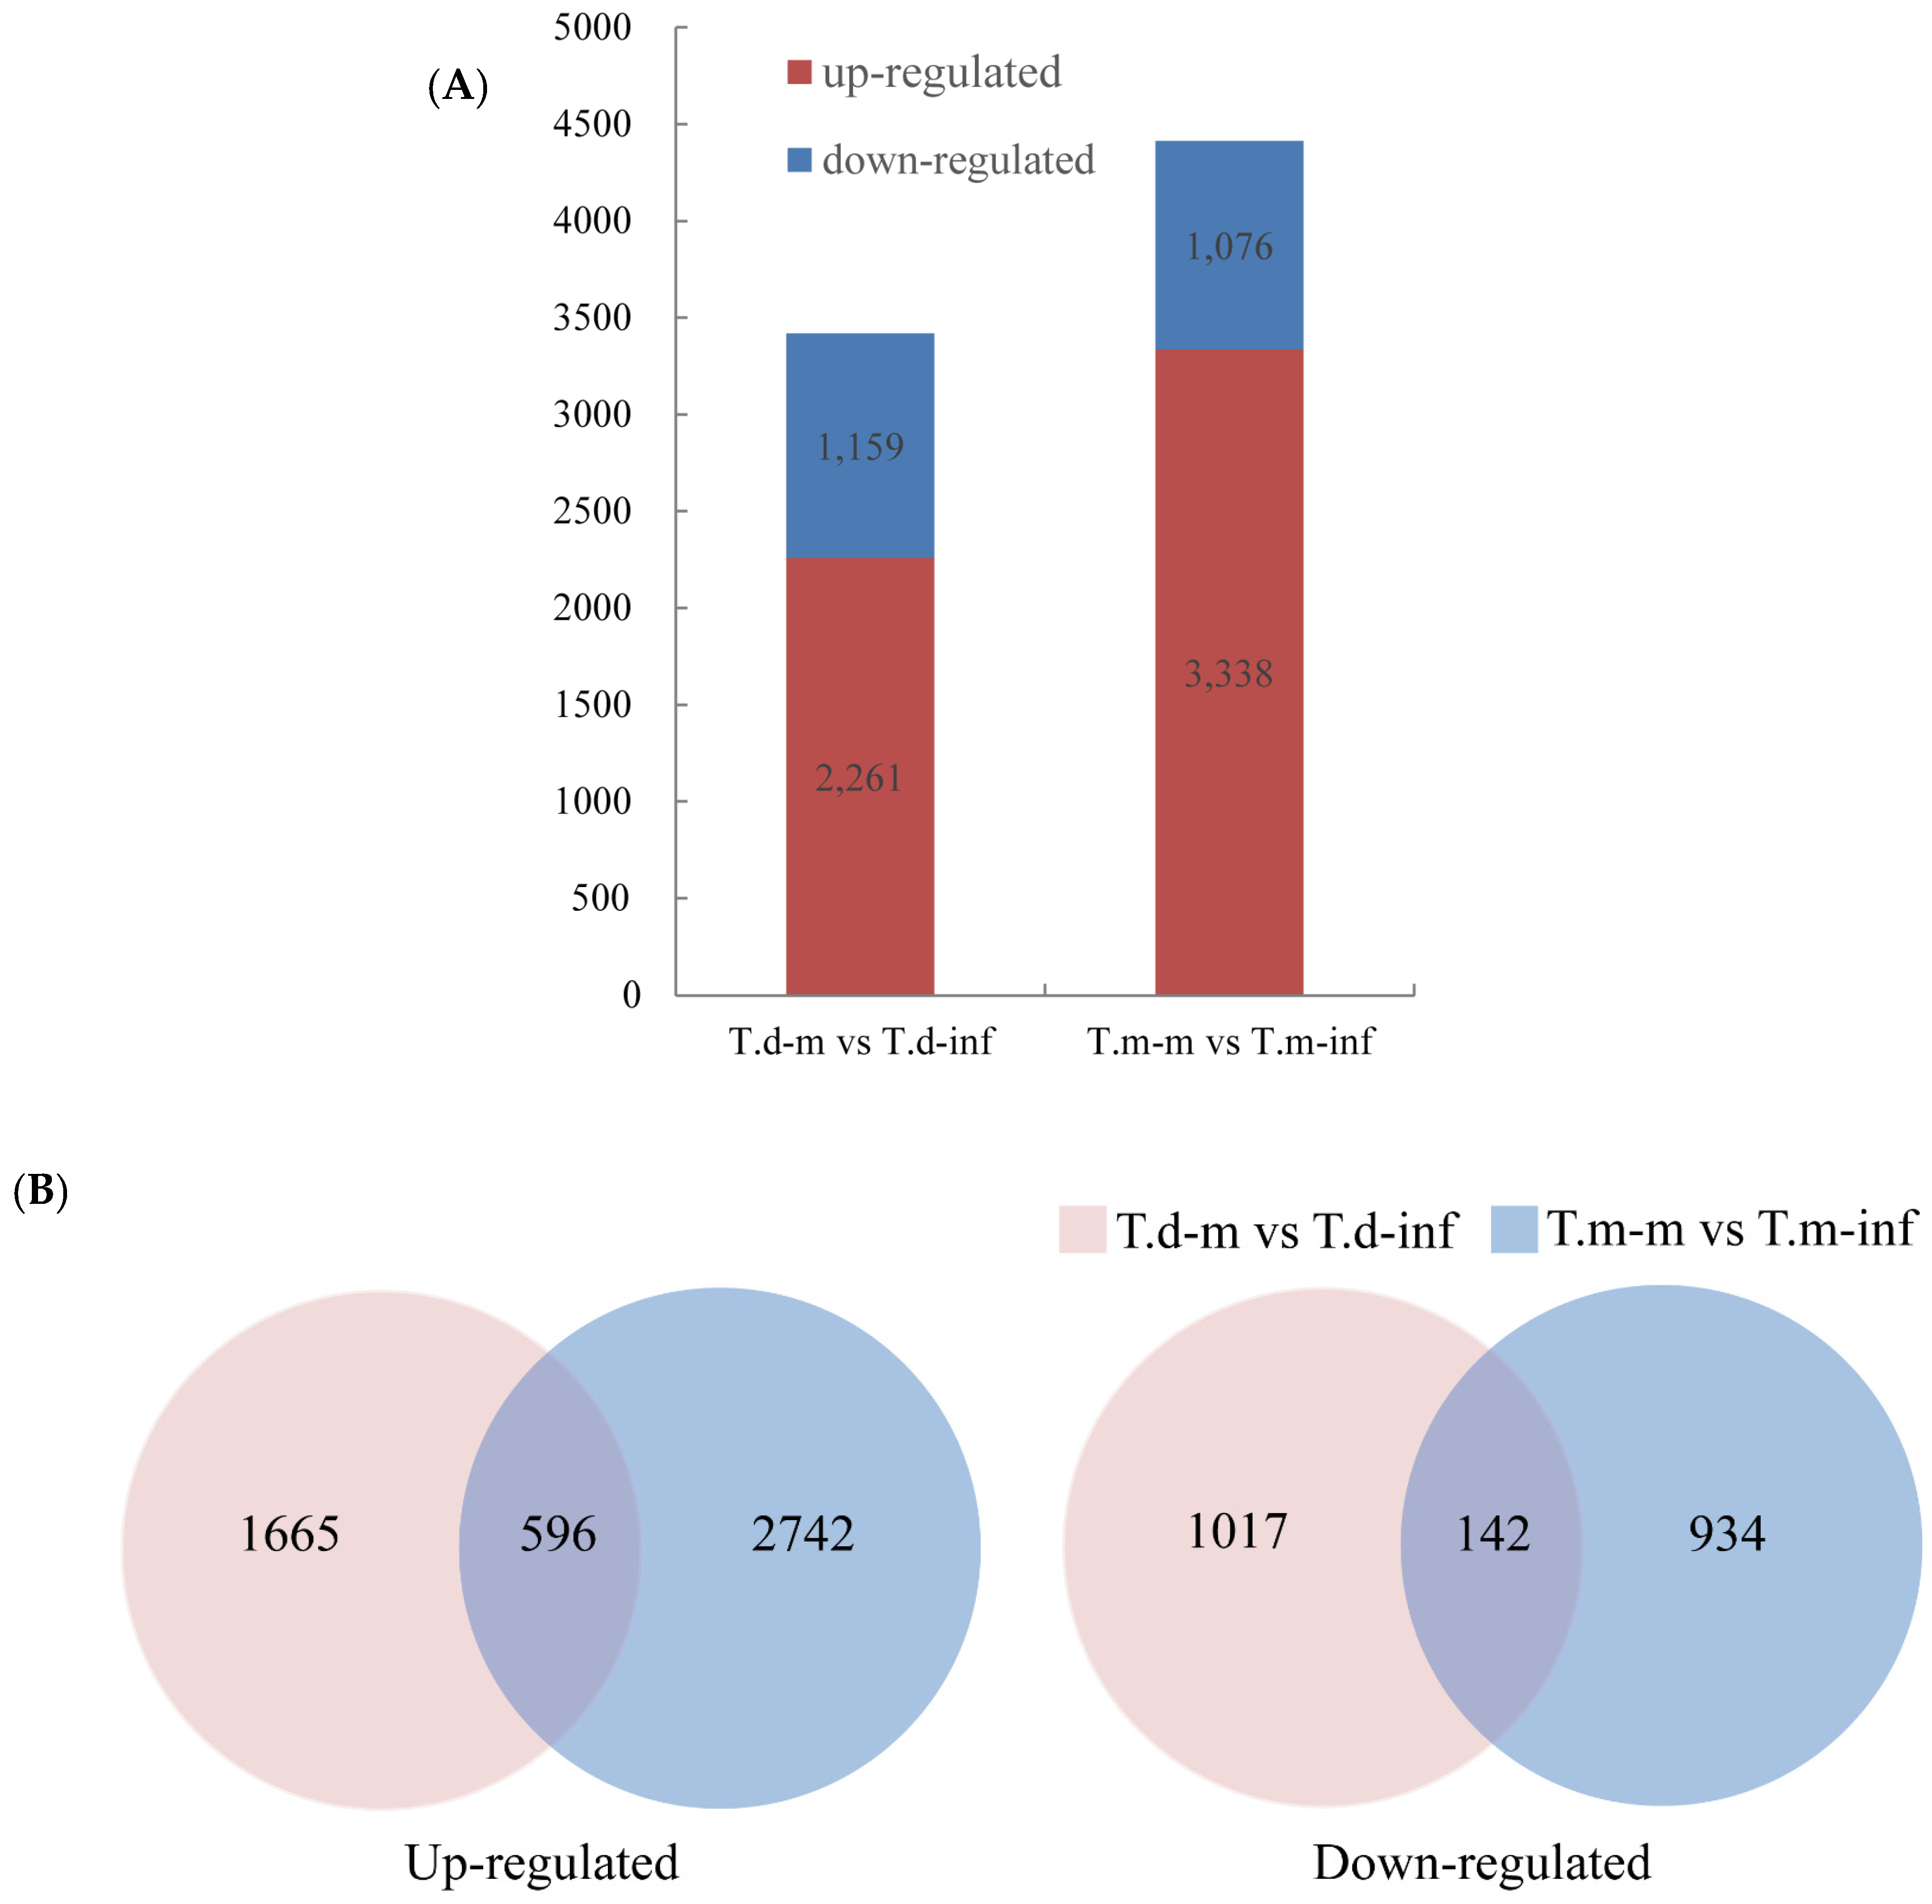
To find out the important pathogen response genes, differentially expressed genes (DEGs) between inoculated and non-inoculated (mock treatment) samples were calculated using the fragments per kilobase of transcript per million fragments mapped (FPKM) approach. A total of 3420 genes showed significant expression changes among the comparisons in resistant T. distichum (T.d-m vs. T.d-inf), including 2261 upregulated and 1159 downregulated genes. In contrast, in the susceptible T. mucronatum, 4414 DEGs were identified between T. mucronatum mock and T. mucronatum infection (T.m-m vs. T.m-inf), including 3338 upregulated and 1076 downregulated genes (Figure 3A). In addition, among the detected DEGs, 596 upregulated and 142 downregulated genes were present in both resistant and susceptible plants (Figure 3B). Furthermore, 3044 of 3420 and 3960 of 4414 DEGs’ response to fungal inoculation had function annotation in T. distichum and T. mucronatum, respectively (Table S4).

3.4. GO Enrichment Analysis of DEGs after P. maculans Inoculation

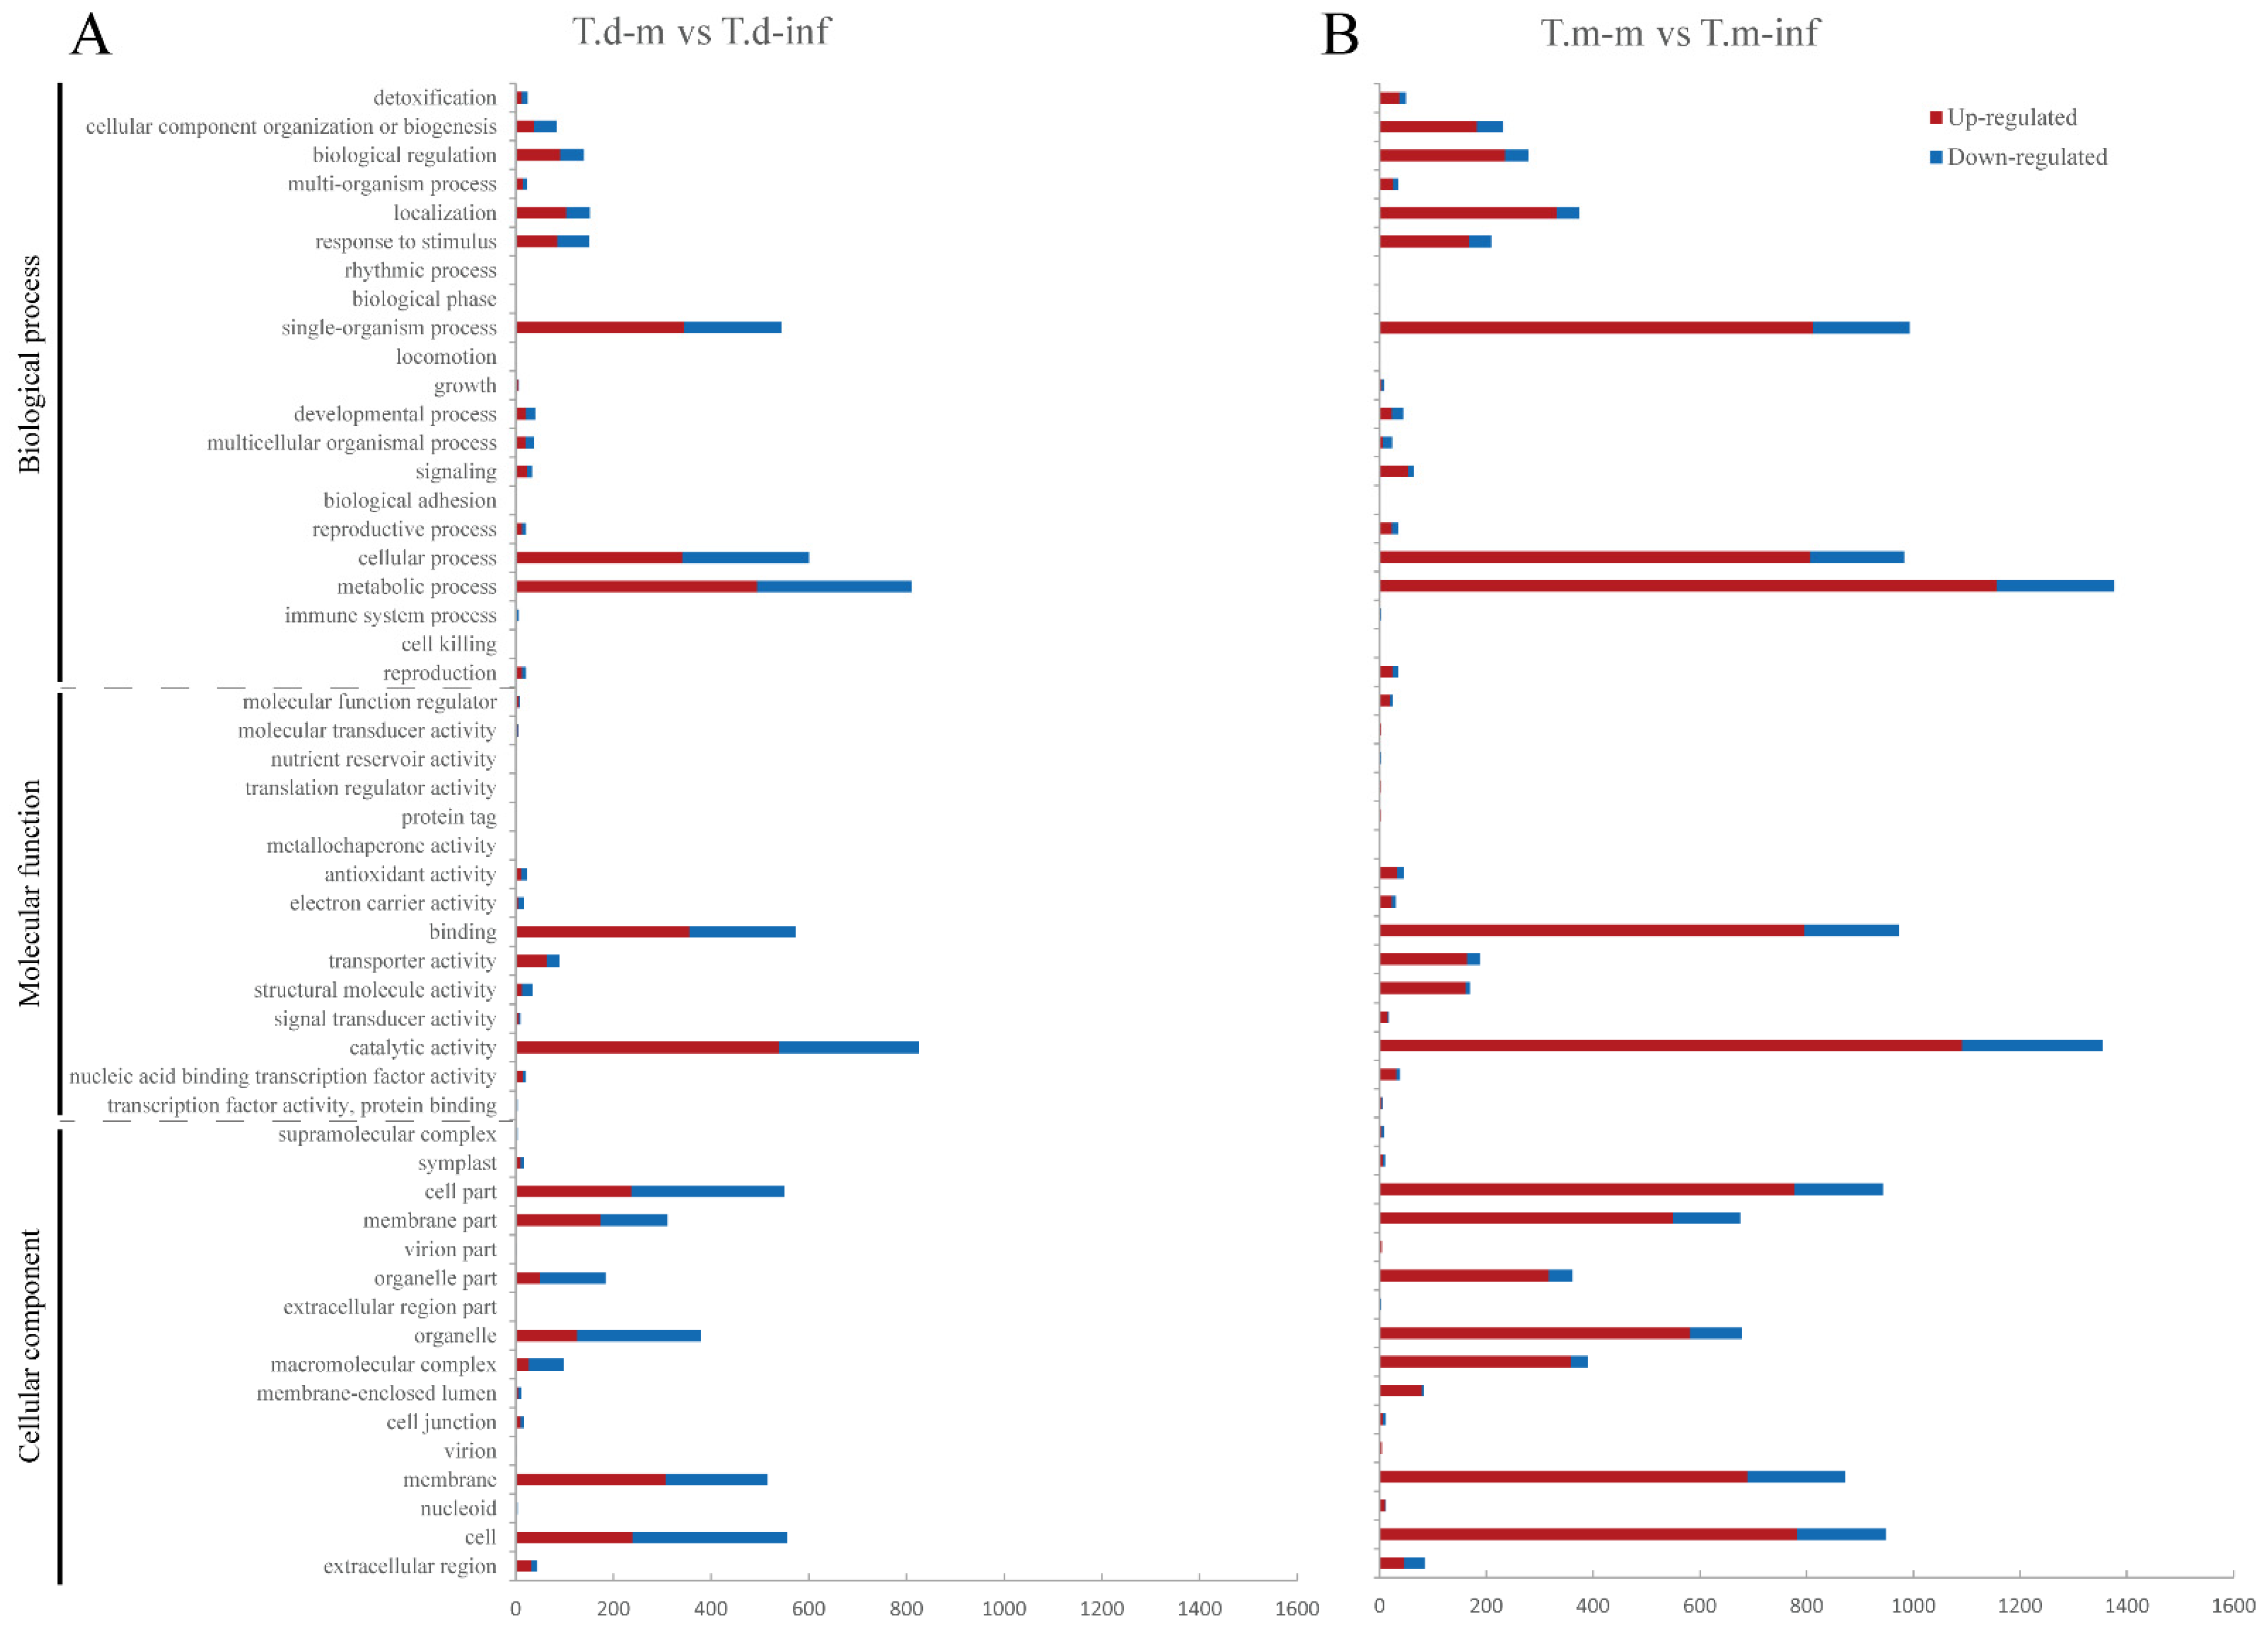
To further explore the DESs detected in Taxodium in response to the pathogen, GO functional enrichment analysis was performed between T. mucronatum and T. distichum after P. maculans infection. In all, 1391 DEGs could be assigned annotations in 44 functional groups, including 839 (60.3%) and 552 (39.7%) up- and downregulated genes in T.d-m vs. T.d-inf (Figure 4A). As for T.m-m vs. T.m-inf groups, 2306 DEGs were classified into 48 functional groups, with 1895 (82.2%) and 411 (17.8%) up- and downregulated genes (Figure 4B). In T.d-m vs. T.d-inf groups, significant enriched GO annotations involved the biological process category (2689 genes), followed by cellular component (2688 genes) and molecular function (1606 genes) categories. In contrast, in T.m-m vs. T.m-inf groups, the genes were primarily sorted into cellular component (5083 genes), biological process (4739 genes), and molecular function (2852 genes) categories (Figure 4, Table S5).
Compared to T. distichum, after P. maculans infection, more than twice the DEGs were upregulated in T. mucronatum, with less DEGs downregulated as well (Figure 4 and Table S5). In addition, although nearly all the enriched GO terms revealed more DEGs in T. mucronatum, a few terms were enriched in T. distichum after P. maculans infection. Strikingly, the termm of the biological process category, which included phenylpropanoid metabolic process, phenylpropanoid biosynthetic process, secondary metabolite biosynthetic process, secondary metabolic process, cellular response to lipid, and response to hormone, had more upregulated DEGs in T. distichum (Figure S1); in addition, these process were proved to play an important role in pathogen resistance.

3.5. KEGG Pathway Enrichment Analysis of DEGs after P. maculans Inoculation

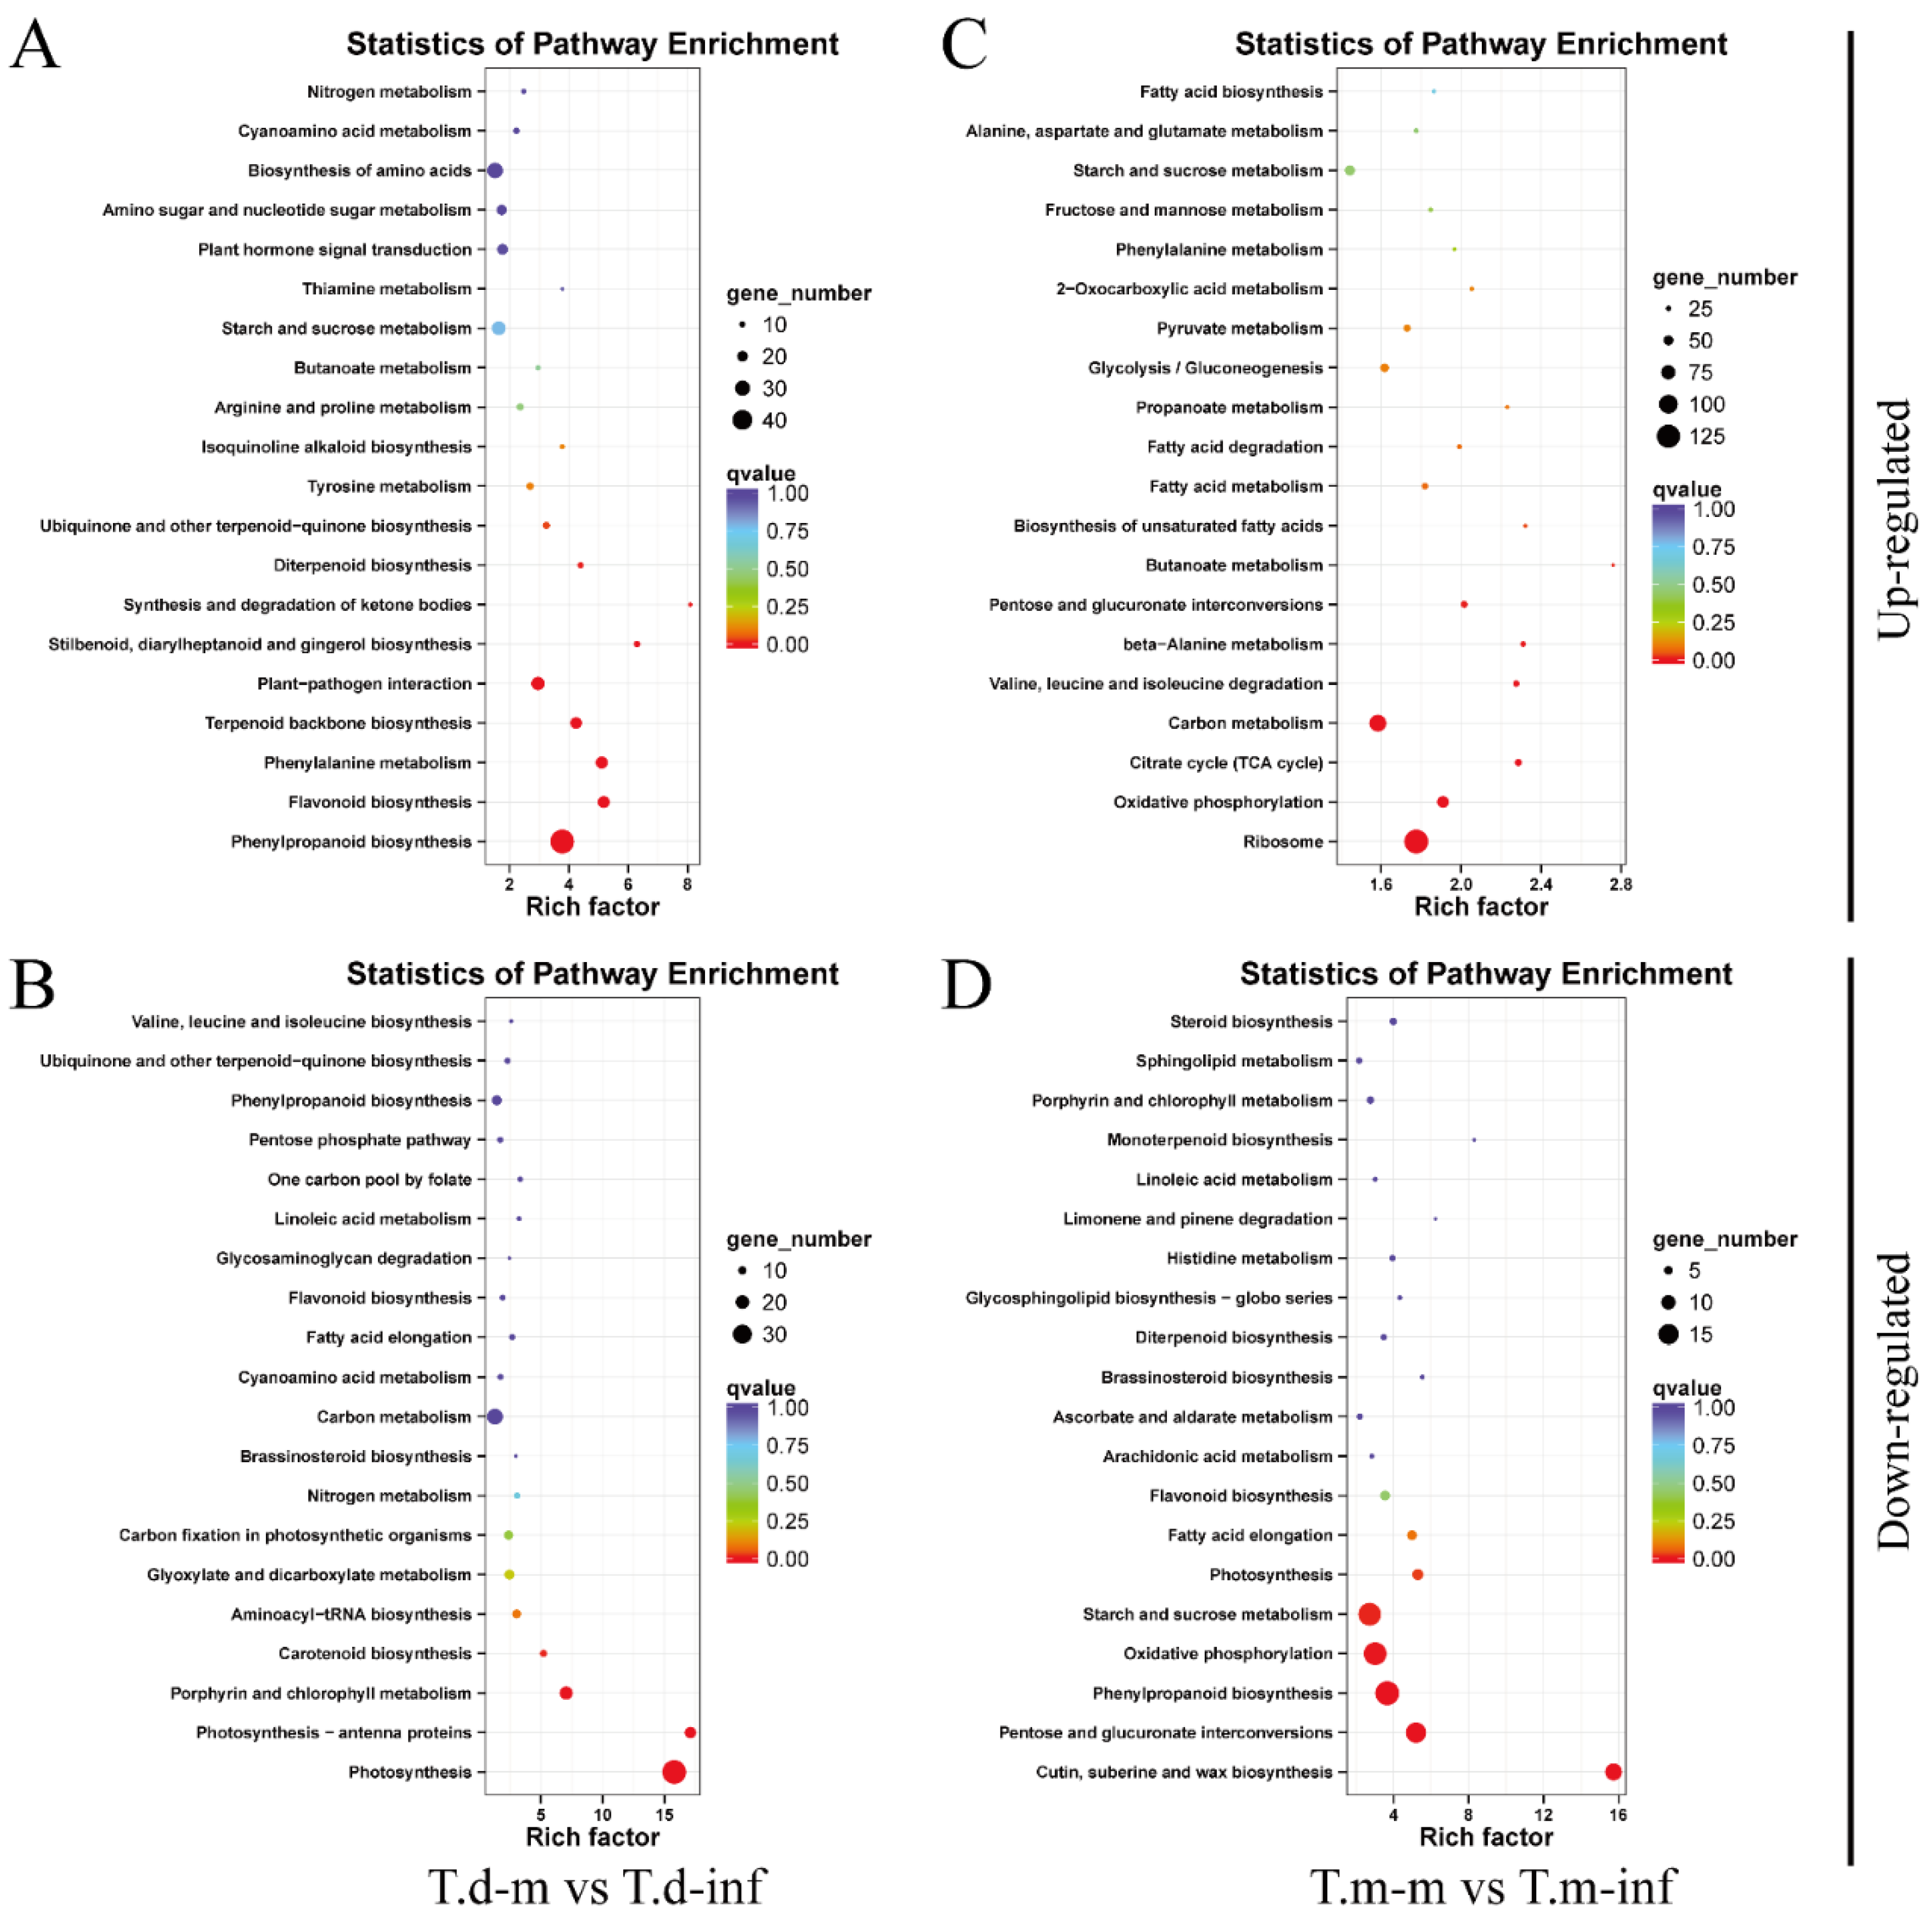
To further identify the major pathways in response to the pathogen, DEGs were searched against the KEGG pathway database as well. The up- and downregulated genes in the resistant and/or susceptible Taxodium species were also categorized into the KEGG database, with the top 50 significantly enriched genes identified into five KEGG categories, including cellular processes, environmental information processing, genetic information processing, metabolism, and organismal systems (Figure S2). By comparing T.d-inf with T.d-m, the DEGs in the pathways of “phenylpropanoid biosynthesis” (ko00940, 49 DEGs, 12.47%), “plant–pathogen interaction” (ko04626, 26 DEGs, 6.62%), and “phenylalanine metabolism” (ko00360, 23 DEGs, 5.85%) in the upregulated group were significantly enriched (Figure 5A and Figure S2A). However, in T.m-m vs. T.m-inf groups, the most upregulated of the enriched pathway was “ribosome” (ko03010, 129 DEGs, 15.28%), followed by “carbon metabolism” (ko01200, 90 DEGs, 10.66%) and “oxidative phosphorylation” (ko00190, 61 DEGs, 7.23%) (Figure 5C and Figure S2C). In addition, pathways involved in “photosynthesis” (ko00195, 39 DEGs, 14.03%) and “porphyrin and chlorophyll metabolism” (ko00860, 19 DEGs, 6.83%) were significantly enriched in the downregulated group in T. distichum after fungal infection (Figure 5B and Figure S2B). It is worth noting that compared with T. distichum, genes involved in “phenylpropanoid biosynthesis” (ko00940, 18 DEGs, 12.08%), “pentose and glucuronate interconversions” (ko00040, 15 DEGs, 10.07%), and “cutin, suberine, and wax biosynthesis” (ko00073, 12 DEGs, 8.05%) pathways were more suppressed in T. mucronatum (Figure 5D and Figure S2D). These results suggested that the DEGs involved in pathogen resistance might be more active in T. distichum.

3.6. Quantitative Real-Time Reverse Transcription-PCR Validation of Differential Expression

To validate the transcript profiles produced in this study, nine unigenes were randomly selected for qRT-PCR analysis. As shown in Figure S3, the expression patterns detected by qRT-PCR were similar to the results of the RNA-seq analyses. Therefore, these results indicated that our RNA-seq data were reliable for additional investigations of key DEGs involved in pathogens related to Taxodium.

4. Discussion

In this study, unigene annotation exhibited that 8.56% of unigenes are matched with D. septosporum. On the one hand, we speculate that since there is no reference genome for Taxodium, it may contain incorrect annotation when comparing the transcriptome data with the NR database. On the other hand, only the samples from infected T. mucronatum contain this annotation information. Therefore, we infer that this may be an interesting biological phenomenon, and the ability to inhibit the growth of microorganisms may be impaired in T. mucronatum after P. maculans invasion, which leads to the growth of D. septosporum.
The DEG analysis showed a higher number of DEGs identified in the susceptible T. mucronatum compared to the resistant T. distichum, which suggested that more genes are recruited to resist fungal infection in T. mucronatum (Figure 4, Table S5). In addition, although several DEGs were detected in the two species in control and infection groups (Figure 3B), most of them revealed different expression modes between the two species, implying that these DEGs may play an important role in response to P. maculans infection (Figure 3B). Thereby, the screening of the resistance genes primarily focused on DEGs with different response modes in T. mucronatum and T. distichum after P. maculans infection.

4.1. Key DEGs in Signal Perception

Plants have a series of defense mechanisms to respond to pathogen attack [15]. Originally, PRRs localized in the plasma membrane can recognize the PAMPs and trigger multitudinous plant immunity to protect the host from pathogen infection, which is known as PTI [16,17]. PTI is the first line of defense formed during long-term interaction between plants and pathogens [18]. PRRs, receptor-like kinases (RLKs), are divided into various subfamilies based on their extracellular domains, such as lysine motif (LysM) and leucine-rich repeat (LRR) domains [19]. Chitin elicitor receptor kinase 1 (CERK1) is a Lysin motif (LysM) receptor kinase. Arabidopsis CERK1 contains one intracellular Ser/Thr kinase domain and three tightly packed LysM domains in the ectodomain, which can perceive the polysaccharide chitin of the fungal cell surface and cause a defense response in plant cells [20,21]. Our study revealed that after inoculation with P. maculans, the expression of the putative CERK1-like gene (Unigene_205888) was 9.7-fold upregulated in T. distichum, while it did not appear in T. mucronatum (Figure 6, Table S6). Flagellin sensing 2 (FLS2) is another significant pattern recognition receptor in plants, which recognizes a 22-amino-acid epitope of bacterial flagellin (flg22) [22] and subsequently triggers defense responses that contribute to plant immunity to bacterial and fungal pathogens and nematodes [23,24,25]. Recent research shows that activation of FLS2 induces phosphorylation on the juxtamembrane (JM) domain of CERK1 in a BAK1-dependent manner, which stabilizes CERK1 and enhances chitin-triggered antifungal immunity [26]. Moreover, the JM domains of CERK1, FLS2, and BR1-associated kinase 1 (BAK1) plays a conserved role in chitin signaling, and by replacing the JM domain of CERK1 with that of BAK1 or FLS2, the chimeric CERK1 receptors keep their functionality to activate chitin signaling in Arabidopsis [27]. In this study, seven putative FLS2 genes were significantly induced in the resistant T. distichum, whereas no obvious changes were detected in the susceptible T. mucronatum inoculated with P. maculans (Figure 6, Table S6). Our results indicated that FLS2 genes might be implicated in protecting T. distichum from infection by the fungus. In addition, these results likewise indicated that T. mucronatum might not correctly perceive the signal of fungal invasion.

4.2. Key DEGs in Signal Transduction

Multiple studies have demonstrated that members of WRKY transcription factors are dominant regulators of numerous defense responses in higher plants [28,29,30]. For instance, Oryza sativa WRKY6 (OsWRKY6) has been identified as a positive regulator in pathogen defense responses [31]. The expression of OsWRKY6 is rapidly induced by SA and Xanthomonas oryzae pv. oryzae (Xoo), and OsWRKY6 overexpression enhances the resistance to Xoo by increasing SA accumulation and activating several PR genes [32]. PtrWRKY35 (Populus trichocarpa WRKY35), activated by PtrWRKY89, has been identified to be involved in SA-mediated signaling, and its overexpression in transgenic poplars could increase the resistance to the fungal pathogen Melampsora [33].
It is interesting that OsWRKY42, functioning as a transcriptional repressor, suppresses resistance to Magnaporthe oryzae by suppressing JA signaling-related genes [34]. WRKY42-RNA interference lines showed increased resistance to M. oryzae via increased JA content, while WRKY42-overexpressing plants revealed susceptibility to the fungus due to reduced JA content [34]. In addition, WRKY57 directly binds to the promoters of JASMONATE ZIM-DOMAIN1 (JAZ1) and JAZ5, which encode two important repressors of the JA signaling pathway, and activates their transcription [35]. For instance, wrky57 mutant lines enhanced the resistance of Arabidopsis against Botrytis cinerea infection [35]. Furthermore, WRKY51 was reported to be induced upon the reduction in stearic-acid-to-oleic-acid (18:1) levels and might serve as a positive regulator of SA-mediated signaling but a negative regulator of JA-mediated signaling in Arabidopsis [36]. Chun et. al. proved that WRKY51 coupled with JASMONATE-ASSOCIATED VQ MOTIF GENE 1(JAV1) and JAZ8 as a JAV1-JAZ8-WRKY51 (JJW) complex binds and represses JA biosynthesis genes to suppress JA content [37].
In this study, putative WRKY6-, WRKY35-, WRKY42-, WRKY57-, and WRKY51-like genes were induced or highly upregulated in T. distichum compared with T. mucronatum during P. maculans infection. Among them, WRKY6- and WRKY35-like genes were significantly induced in T. distichum, which might be involved in the SA and SAR pathways to respond to fungal infection. Moreover, upregulation of WRKY42-, WRKY57-, and WRKY51-like genes was also found in T. distichum, with the main functions of inhibiting JA biosynthesis and signaling transduction (Figure 6, Table S6). In summary, we inferred that SA signaling pathways could play a more important role in the resistance mechanism in T. distichum against P. maculans infection.

4.3. Key DEGs in Phytohormone Metabolism

Many studies have shown that phytohormones, such as salicylic acid (SA) and jasmonic acid (JA), play a vital role in the response to pathogen invasion [38,39]. Therefore, in our study, the roles of SA and JA were studied in the response process of T. distichum and T. mucronatum to P. maculans attack. In a previous study, the biosynthesis of SA was reported through two different pathways, the cinnamic acid pathway, which requires phenylalanine ammonia lyase (PAL), and the isochorismate pathway, which requires isochorismate synthase (ICS) [40,41]. In Arabidopsis, the isochorismate pathway is also regarded as the predominant biosynthetic pathway during a pathogenic threat [42,43]. Loss of ICS1 abrogates pathogen-induced SA biosynthesis and SAR in Arabidopsis and barley [44,45,46]. In contrast, in soybean, the PAL and ICS pathways are functionally equally to pathogen-induced SA accumulation, while knock-down of either pathway shuts down SA biosynthesis and abolishes pathogen resistance [47]. Since there is little research on this aspect, interest in whether these two pathways vary in different plants for pathogen-induced SA synthesis is increasing [48]. In our study, four putative PAL-like genes were significantly upregulated in T. distichum, whereas these genes were only slightly induced or unchanged in T. mucronatum after P. maculans infection. It is worth noting that there was no change in ICS-like genes in either T. distichum or T. mucronatum after P. maculans infection (Figure 6, Table S6). Based on these results, we speculated that the PAL pathway might play a main role in pathogen-induced SA biosynthesis in T. distichum. Nevertheless, more evidence is required to confirm this speculation.
Furthermore, to determine whether JA is involved in fungal resistance in T. distichum and T. mucronatum, the key genes in the biosynthesis and signaling transduction of JA were analyzed [39]. Lipoxygenases (LOXs), allene oxide synthase 2 (AOS2), allene oxide cyclase (AOC), and 12-oxo-phytodienoic acid reductase 3 (OPR3) were proposed to participate in JA biosynthesis [49,50,51]. In the JA signaling transduction pathway, COI1-JAZ-MYC is considered a core positive regulatory module of JA signaling components [52,53]. Therein, JA-Ile, known as the most potent endogenous form of JA [50,51], is perceived by coronatine-insensitive 1 (COI1). COI1 mediates the 26S proteasome-dependent degradation of JAZ (JA ZIM-domain) family proteins that act as transcriptional repressors in JA signaling [54]. MYC2 acts as a positive regulator that activates the expression of JA biosynthesis genes, such as LOX, AOS2, AOC, and OPR3 [55]. In this study, transcripts encoding LOX-, AOS-, AOC2-, OPR3-, JAR1-, COI1-, and MYC2-like genes were detected (Table S6). Based on our data, no changes were found in all of these genes, either in T. distichum or in T. mucronatum after P. maculans infection. It is worth noting that 5 and 3 of 15 putative JAZ-like genes were obviously upregulated in T. distichum and T. mucronatum, respectively, after P. maculans infection (Table S6). More research is needed to clarify the function of these JAZ-like genes in the disease resistance process of Taxodium. These results showed that JA may not be the critical factor in the disease resistance of T. distichum.

4.4. Key DEGs in SA-Dependent Pathogen Response

In plants, SA is a phenolic compound that plays an essential role in PTI, ETI, and systemic acquired resistance (SAR) induction [56]. SAR is characterized by a broad-spectrum and long-lasting immune response in plants that provides enhanced resistance against a broad range of pathogens [57]. In Arabidopsis, nonexpressor of pathogenesis-related genes 1 (NPR1) is verified to act as an SA receptor linking SA perception, transcription, and activation and promotes cell survival during the plant immune response [58,59,60]. Overexpression of NPR1 in different plants generally results in enhancing disease resistance to a wide range of pathogens [61]. In contrast, the NPR1 loss-of-function mutant (npr1 mutants) shows higher disease susceptibility and a decrease in SAR-induced pathogenesis-related (PR) gene expression, such as PR1 [62,63]. PR1 is universally known as a molecular indicator to monitor SAR deployment [64,65]. Overexpression of PR1 in various plant species causes enhanced disease resistance against many pathogens [66]. In this study, the NPR1-like gene (Unigene_136298) was significantly induced in T. distichum after infection, whereas no obvious difference was found in T. mucronatum after fungal infection. Simultaneously, PR-like genes were strikingly upregulated in T. distichum, whereas no obvious change was found in T. mucronatum. These results further confirmed that pathogen-induced SAR might play a vital role in resistance to P. maculans in T. distichum.

4.5. Key DEGs in Cutin, Suberin, and Wax Modification

Cutin, suberin, and wax are important hydrophobic interfaces between plant and environment, and they serve as physical barriers to protect plants from water loss as well as diverse biotic and abiotic stresses [67,68,69]. Increasing research shows that cutin, suberin, and wax do not merely form a passive mechanical shield but play an active role in both local and systemic resistance against various plant pathogens [70,71]. In this study, based on KEGG analysis (Figure 5), five genes involved in the cutin, suberin, or wax pathway were downregulated in T. mucronatum after P. maculans infection, including CYP86A2, CYP86B1, HHT1, FAR3, and WSD1, whereas no obvious change was observed in T. distichum (Figure 6, Table S6).
In the suberin synthesis pathway, hydroxycinnamoyl-CoA:ω-hydroxyacid/fatty alcohol transferase (HHT) catalyzes the formation of aromatic esters in lipidic polymers [72,73]. The T-DNA insertion mutant of hht1 showed a substantial reduction in the ferulate content of seed and root suberins and, as a result, an elevated permeability to ionic dyes in Arabidopsis [74]. In potato (Solanum tuberosum), suppression of ω-hydroxyacid/fatty alcohol hydroxycinnamoyl transferase (FHT), a homolog gene of AtHHT1/AtASFT, reduced both ferulate ester and ω-hydroxy fatty acid contents in suberin and in the related wax fraction, causing a thicker, russet skin of the potato tuber, with increased water loss [75]. CYP86B1 is a long-chain fatty acid hydroxylase and plays a vital role in suberin biogenesis. In Arabidopsis, cyp86B1 mutant lines had a root and a seed coat aliphatic polyester composition in which C22- and C24-hydroxyacids and α,ω-dicarboxylic acids were strongly reduced [76]. Downregulation of putative HHT1- and CYP86B1-like genes in T. mucronatum suggested that the lipid polymers and suberin formation are directly or indirectly impaired after fungal infection.
In wax biosynthesis, primary alcohols are generated by fatty acyl–CoA reductase (FAR3/CER4), and the generated fatty alcohols and C16:0 acyl–CoA are condensed into wax esters by the bi-functional wax synthase/acyl–CoA:diacylglycerol acyltransferase (WS/DGAT) enzyme, WSD1 [77]. In Arabidopsis, cer4 mutants reveal major decreases in primary alcohols and wax esters [78]; in addition, wsd1 mutants show severe reduction in wax ester levels in stems [79]. In T. mucronatum, the expression of FAR3- and WSD1-like genes was remarkably reduced, implying that wax esters synthase was seriously damaged.
In Arabidopsis, a cytochrome P450 CYP86A2, encoded by ATT1, functions in the biosynthesis of extracellular lipids and plays a major role in cutin formation. Moreover, CYP86A2 is also identified to enhance the resistance to Pseudomonas syringae by repressing bacterial type III gene expression in the intercellular spaces [80]. In this study, the expression of the CYP86A2-like gene was significantly suppressed in T. mucronatum, whereas no change in T. distichum was observed, indicating that not only cutin biosynthesis but also resistance to the pathogen were inhibited.
Overall, these genes play an important role in forming the first line of defense, and inhibiting their expression might cause disease symptoms. Moreover, we suggest that the fungus P. maculans may accelerate the invasion by suppressing the expression of these key genes in T. mucronatum.

4.6. Key DEGs Involved in Cell Wall Modification

The plant cell wall is a dynamic and complex structure that is essential for plant growth, development, and response to pathogen-induced stresses [81]. Polygalacturonase has been identified as being produced by fungi to degrade the plant cell wall [82], as well as polygalacturonase inhibitor proteins (PGIPs), which protect plants by avoiding fungi that break the plant cell wall [83]. In Arabidopsis, overexpression of AtPGIP1 and AtPGIP2 genes enhanced the resistance to Botrytis cinerea and reduced disease symptoms [84]. However, inhibiting the activity of AtPGIP1 by antisense expression led to increasing susceptibility to B. cinerea [85]. In addition, overexpression of the apple PGIP and/or the grapevine PGIP gene in transgenic tobacco plants was also reported to enhance the resistance to fungal pathogens [86]. In this study, one PGIP-like gene (Unigene_122428) was identified, and it was significantly induced in T. distichum, whereas no change was found in T. mucronatum (Figure 6, Table S6). This indicated that the cell walls in T. distichum might get better protection compared to T. mucronatum after fungal infection.
Laccases are polyphenol oxidases involved in the process of reinforcing the cell wall of many different cell types, which provide mechanical support, nutrient transportation, and defense against pathogens by catalyzing the oxidation of monolignols in lignification in plants [87,88]. In Arabidopsis, double mutants of laccase-4 (AtLac4) and laccase-17 (AtLac17) caused severe defects in the lignification of interfascicular fibers and vessels of stems [89]. In wheat, transient silencing of TaLAC4 resulted in increased susceptibility, leading to the spread of Fusarium graminearum within the entire spike in 15 dpi [90]. In this study, four putative LAC4-like and six putative LAC17-like genes were annotated, 3/4 LAC4-like and 2/6 LAC17-like genes were remarkably suppressed in T. mucronatum, and 1 LAC4-like gene was downregulated in T. distichum (Figure 6, Table S6). These results indicated that compared with T. distichum, the integrity of cell walls in T. mucronatum is more severely injured after fungal infection.
To sum up, these results demonstrated that after P. maculans infection, T. distichum can correctly perceive the fungal invasion and then respond to the infection though SA-induced SAR. In contrast, the T. mucronatum plants might not perceive the invasion of the fungus, so they are unable to make a valid response. Therefore, it is necessary to analyze the reasons why T. mucronatum cannot effectively respond to the fungus P. maculans.

5. Conclusions

Taxodium is a genus of trees with economic and ecological importance in southeastern China. However, red blight disease (caused by P. maculans) seriously restricts the development and application of this genus. This study provided the first large-scale transcriptome data sets of the resistant T. distichum and the susceptible T. mucronatum with/without P. maculans infection. Based on our analysis, we inferred that SA signaling pathways could play a more important role in the resistance mechanism of T. distichum against P. maculans infection. In addition, we speculated that since T. mucronatum fail to recognize the fungus P. maculans, the response to fungal invasion is inhibited, leading to accelerated invasion and broken cell walls, further triggering more disease symptoms in the plants. These data provide valuable information for further studies on the resistance mechanisms of Taxodium, as well as the key DEGs to control red blight disease via genetic engineering, which may be promising for the genetic breeding of T.‘zhongshanshan’.

Supplementary Materials

The following are available online at https://www.mdpi.com/article/10.3390/f12081090/s1, Table S1. Primer sequences of the genes for qRT-PCR. Table S2. Summary of transcript and unigene assembly data. Table S3. All unigenes were assigned to different KEGG terms. Table S4. Summary statistics of DEGs annotation against public databases. Table S5. Assignment to Gene Ontology (GO) categories of differentially expressed genes (DEGs) in T. distichum and T. mucronatum after fungal infection. Table S6: List of DEGs in the T. mucronatum and T. distichum response to P. maculans infection.

Author Contributions

Conceptualization, F.Z. and X.L.; methodology, Y.Y.; formal analysis, F.Z.; investigation, F.Z. and L.X.; resources, C.Y.; writing—original draft preparation, F.Z. and X.C.; writing—review and editing, F.Z., H.C., and Y.Y.; funding acquisition, F.Z. All authors have read and agreed to the published version of the manuscript.

Funding

This work was supported by the National Natural Science Foundation of China (grant no. 31971660), the Natural Science Foundation of Jiangsu Province (grant no. BK20201244), and the Open Fund of Jiangsu Key Laboratory for Research and Utilization of Plant Resources (JSPKLB201603).

Data Availability Statement

The data have been deposited to the National Center for Biotechnology Information (NCBI) under accession number PRJNA723419.

Acknowledgments

We sincerely thank Beijing Biomarker Technology Co., Ltd. for performing the transcriptome sequencing.

Conflicts of Interest

The authors declare no conflict of interest.

References

  1. Duan, H.; Guo, J.; Xuan, L.; Wang, Z.; Li, M.; Yin, Y.; Yang, Y. Comparative chloroplast genomics of the genus Taxodium. BMC Genom. 2020, 21, 114. [Google Scholar] [CrossRef] [Green Version]
  2. Denny, G.C.; Arnold, M.A. Taxonomy and Nomenclature of Baldcypress, Pondcypress, and Montezuma Cypress: One, Two, or Three Species? Horttechnology 2007, 17, 125–127. [Google Scholar] [CrossRef]
  3. Creech, D.; Zhou, L.; Yunlong, Y.; Eguiluz-Piedra, T. Can Taxodium Be Improved? Arnoldia 2011, 69, 11–20. [Google Scholar]
  4. Zhou, L.; Creech, D.L.; Krauss, K.W.; Yunlong, Y.; Kulhavy, D.L. Can We Improve the Salinity Tolerance of Genotypes of Taxodium by Using Varietal and Hybrid Crosses? HortScience 2010, 45, 1773–1778. [Google Scholar] [CrossRef] [Green Version]
  5. Guo, J.; Duan, H.; Xuan, L.; Wang, Z.; Hua, J.; Yu, C.; Yin, Y.; Li, M.; Yang, Y. Identification and functional analysis of LecRLK genes in Taxodium ‘Zhongshanshan’. PeerJ 2019, 7, e7498. [Google Scholar] [CrossRef] [Green Version]
  6. Yang, Y.; Xuan, L.; Yu, C.; Wang, Z.; Xu, J.; Fan, W.; Guo, J.; Yin, Y. High-density genetic map construction and quantitative trait loci identification for growth traits in (Taxodium distichum var. distichum × T. mucronatum) × T. mucronatum. BMC Plant Biol. 2018, 18, 263. [Google Scholar] [CrossRef]
  7. Wang, Z.; Cheng, Y.; Yin, Y.; Yu, C.; Yang, Y.; Shi, Q.; Hao, Z.; Li, H. Genetic linkage map construction and QTL mapping of seedling height, basal diameter and crown width of Taxodium ‘Zhongshanshan 302’ × T. mucronatum. SpringerPlus 2016, 5, 1–13. [Google Scholar] [CrossRef] [Green Version]
  8. Bigeard, J.; Colcombet, J.; Hirt, H. Signaling Mechanisms in Pattern-Triggered Immunity (PTI). Mol. Plant 2015, 8, 521–539. [Google Scholar] [CrossRef] [PubMed] [Green Version]
  9. Han, G. Origin and evolution of the plant immune system. New Phytol. 2018, 222, 70–83. [Google Scholar] [CrossRef] [PubMed] [Green Version]
  10. Yu, C.; Xu, S.; Yin, Y. Transcriptome analysis of the Taxodium ‘Zhongshanshan 405’ roots in response to salinity stress. Plant Physiol. Biochem. 2016, 100, 156–165. [Google Scholar] [CrossRef]
  11. Li, B.; Dewey, C.N. RSEM: Accurate transcript quantification from RNA-Seq data with or without a reference genome. BMC Bioinform. 2011, 12, 323. [Google Scholar] [CrossRef] [Green Version]
  12. Love, M.I.; Huber, W.; Anders, S. Moderated estimation of fold change and dispersion for RNA-seq data with DESeq2. Genome Biol. 2014, 15, 550. [Google Scholar] [CrossRef] [Green Version]
  13. Zhao, M.; Zhong, Q.; Tian, M.; Han, R.; Ren, Y. Comparative transcriptome analysis reveals differentially expressed genes associated with the development of Jerusalem artichoke tuber (Helianthus tuberosus L.). Ind. Crop. Prod. 2020, 151, 112455. [Google Scholar] [CrossRef]
  14. Livak, K.J.; Schmittgen, T.D. Analysis of relative gene expression data using real-time quantitative PCR and the 2−ΔΔCT method. Methods 2001, 25, 402–408. [Google Scholar] [CrossRef] [PubMed]
  15. Ghosh, S.; Malukani, K.K.; Chandan, R.K.; Sonti, R.V.; Jha, G. How Plants Respond to Pathogen Attack: Interaction and Communication. In Sensory Biology of Plants; Springer: Berlin/Heidelberg, Germany, 2019; pp. 537–568. [Google Scholar]
  16. Zhou, J.-M.; Zhang, Y. Plant Immunity: Danger Perception and Signaling. Cell 2020, 181, 978–989. [Google Scholar] [CrossRef]
  17. Sun, L.; Zhang, J. Regulatory role of receptor-like cytoplasmic kinases in early immune signaling events in plants. FEMS Microbiol. Rev. 2020, 44, 845–856. [Google Scholar] [CrossRef]
  18. Zipfel, C. Early molecular events in PAMP-triggered immunity. Curr. Opin. Plant Biol. 2009, 12, 414–420. [Google Scholar] [CrossRef]
  19. Zipfel, C. Pattern-recognition receptors in plant innate immunity. Curr. Opin. Immunol. 2008, 20, 10–16. [Google Scholar] [CrossRef]
  20. Huaping, H.; Xiaohui, J.; Lunying, W.; Junsheng, H. Chitin elicitor receptor kinase 1 (CERK1) is required for the non-host defense response of Arabidopsis to Fusarium oxysporum f. Sp. cubense. Eur. J. Plant Pathol. 2017, 147, 571–578. [Google Scholar] [CrossRef]
  21. Erwig, J.; Ghareeb, H.; Kopischke, M.; Hacke, R.; Matei, A.; Petutschnig, E.; Lipka, V. Chitin-induced and CHITIN ELICITOR RECEPTOR KINASE1 (CERK1) phosphorylation-dependent endocytosis of Arabidopsis thaliana LYSIN MOTIF-CONTAINING RECEPTOR-LIKE KINASE5 (LYK5). New Phytol. 2017, 215, 382–396. [Google Scholar] [CrossRef] [Green Version]
  22. Geldner, N.; Robatzek, S. Plant Receptors Go Endosomal: A Moving View on Signal Transduction. Plant Physiol. 2008, 147, 1565–1574. [Google Scholar] [CrossRef] [Green Version]
  23. Asai, T.; Tena, G.; Plotnikova, J.; Willmann, M.R.; Chiu, W.-L.; Gomez-Gomez, L.; Boller, T.; Ausubel, F.M.; Sheen, J. MAP kinase signalling cascade in Arabidopsis innate immunity. Nat. Cell Biol. 2002, 415, 977–983. [Google Scholar] [CrossRef] [PubMed]
  24. Tena, G.; Asai, T.; Chiu, W.-L.; Sheen, J. Plant mitogen-activated protein kinase signaling cascades. Curr. Opin. Plant Biol. 2001, 4, 392–400. [Google Scholar] [CrossRef]
  25. Zhang, H.; Yang, Y.; Wang, C.; Liu, M.; Li, H.; Fu, Y.; Wang, Y.; Nie, Y.; Liu, X.; Ji, W. Large-scale transcriptome comparison reveals distinct gene activations in wheat responding to stripe rust and powdery mildew. BMC Genom. 2014, 15, 898. [Google Scholar] [CrossRef] [PubMed] [Green Version]
  26. Gong, B.-Q.; Guo, J.; Zhang, N.; Yao, X.; Wang, H.-B.; Li, J.-F. Cross-Microbial Protection via Priming a Conserved Immune Co-Receptor through Juxtamembrane Phosphorylation in Plants. Cell Host Microbe 2019, 26, 810–822. [Google Scholar] [CrossRef]
  27. Zhou, Q.; Liu, J.; Wang, J.; Chen, S.; Chen, L.; Wang, J.; Wang, H.; Liu, B. The juxtamembrane domains of Arabidopsis CERK1, BAK1, and FLS2 play a conserved role in chitin-induced signaling. J. Integr. Plant Biol. 2019, 62, 556–562. [Google Scholar] [CrossRef] [PubMed]
  28. Loake, G.; Grant, M. Salicylic acid in plant defence—The players and protagonists. Curr. Opin. Plant Biol. 2007, 10, 466–472. [Google Scholar] [CrossRef]
  29. Pandey, S.P.; Somssich, I.E. The Role of WRKY Transcription Factors in Plant Immunity. Plant Physiol. 2009, 150, 1648–1655. [Google Scholar] [CrossRef] [Green Version]
  30. Sarris, P.F.; Duxbury, Z.; Huh, S.U.; Ma, Y.; Segonzac, C.; Sklenar, J.; Derbyshire, P.; Cevik, V.; Rallapalli, G.; Saucet, S.B.; et al. A Plant Immune Receptor Detects Pathogen Effectors that Target WRKY Transcription Factors. Cell 2015, 161, 1089–1100. [Google Scholar] [CrossRef] [Green Version]
  31. Hwang, S.-H.; Yie, S.W.; Hwang, D.-J. Heterologous expression of OsWRKY6 gene in Arabidopsis activates the expression of defense related genes and enhances resistance to pathogens. Plant Sci. 2011, 181, 316–323. [Google Scholar] [CrossRef] [PubMed]
  32. Choi, C.; Hwang, S.; Fang, I.R.; Kwon, S.I.; Park, S.R.; Ahn, I.; Kim, J.B.; Hwang, D. Molecular characterization of Oryza sativa WRKY 6, which binds to W-box-like element 1 of the Oryza sativa pathogenesis-related (PR) 10a promoter and confers reduced susceptibility to pathogens. New Phytol. 2015, 208, 846–859. [Google Scholar] [CrossRef] [PubMed]
  33. Jiang, Y.; Guo, L.; Ma, X.; Zhao, X.; Jiao, B.; Li, C.; Luo, K. The WRKY transcription factors PtrWRKY18 and PtrWRKY35 promote Melampsora resistance in Populus. Tree Physiol. 2017, 37, 665–675. [Google Scholar] [CrossRef]
  34. Cheng, H.; Liu, H.; Deng, Y.; Xiao, J.; Li, X.; Wang, S. The WRKY45-2 WRKY13 WRKY42 Transcriptional Regulatory Cascade Is Required for Rice Resistance to Fungal Pathogen. Plant Physiol. 2015, 167, 1087–1099. [Google Scholar] [CrossRef] [PubMed] [Green Version]
  35. Jiang, Y.; Yu, D. The WRKY57 Transcription Factor Affects the Expression of Jasmonate ZIM-Domain Genes Transcriptionally to Compromise Botrytis cinerea Resistance. Plant Physiol. 2016, 171, 2771–2782. [Google Scholar] [CrossRef] [Green Version]
  36. Gao, Q.-M.; Venugopal, S.; Navarre, D.; Kachroo, A. Low Oleic Acid-Derived Repression of Jasmonic Acid-Inducible Defense Responses Requires the WRKY50 and WRKY51 Proteins. Plant Physiol. 2011, 155, 464–476. [Google Scholar] [CrossRef] [Green Version]
  37. Yan, C.; Fan, M.; Yang, M.; Zhao, J.; Zhang, W.; Su, Y.; Xiao, L.; Deng, H.; Xie, D. Injury Activates Ca2+/Calmodulin-Dependent Phosphorylation of JAV1-JAZ8-WRKY51 Complex for Jasmonate Biosynthesis. Mol. Cell 2018, 70, 136–149.e7. [Google Scholar] [CrossRef] [PubMed] [Green Version]
  38. Han, X.; Kahmann, R. Manipulation of Phytohormone Pathways by Effectors of Filamentous Plant Pathogens. Front. Plant Sci. 2019, 10, 822. [Google Scholar] [CrossRef] [PubMed] [Green Version]
  39. Berens, M.L.; Berry, H.M.; Mine, A.; Argueso, C.T.; Tsuda, K. Evolution of Hormone Signaling Networks in Plant Defense. Annu. Rev. Phytopathol. 2017, 55, 401–425. [Google Scholar] [CrossRef]
  40. Vlot, A.C.; Dempsey, D.A.; Klessig, D.F. Salicylic acid, a multifaceted hormone to combat disease. Annu. Rev. Phytopathol. 2009, 47, 177–206. [Google Scholar] [CrossRef] [Green Version]
  41. Gao, Q.-M.; Zhu, S.; Kachroo, P.; Kachroo, A. Signal regulators of systemic acquired resistance. Front. Plant Sci. 2015, 6, 228. [Google Scholar] [CrossRef] [Green Version]
  42. Strawn, M.A.; Marr, S.K.; Inoue, K.; Inada, N.; Zubieta, C.; Wildermuth, M.C. Arabidopsis Isochorismate Synthase Functional in Pathogen-induced Salicylate Biosynthesis Exhibits Properties Consistent with a Role in Diverse Stress Responses. J. Biol. Chem. 2007, 282, 5919–5933. [Google Scholar] [CrossRef] [Green Version]
  43. Garcion, C.; Lohmann, A.; Lamodière, E.; Catinot, J.; Buchala, A.; Doermann, P.; Métraux, J.-P. Characterization and Biological Function of the ISOCHORISMATE SYNTHASE2 Gene of Arabidopsis. Plant Physiol. 2008, 147, 1279–1287. [Google Scholar] [CrossRef] [Green Version]
  44. Nawrath, C.; Métraux, J.-P. Salicylic acid induction–deficient mutants of Arabidopsis express PR-2 and PR-5 and accumulate high levels of camalexin after pathogen inoculation. Plant Cell 1999, 11, 1393–1404. [Google Scholar] [PubMed] [Green Version]
  45. Wildermuth, M.C.; Dewdney, J.; Wu, G.; Ausubel, F.M. Isochorismate synthase is required to synthesize salicylic acid for plant defence. Nature 2001, 414, 562–565. [Google Scholar] [CrossRef]
  46. Hao, Q.; Wang, W.; Han, X.; Wu, J.; Lyu, B.; Chen, F.; Caplan, A.; Li, C.; Wu, J.; Wang, W.; et al. Isochorismate-based salicylic acid biosynthesis confers basal resistance to Fusarium graminearum in barley. Mol. Plant Pathol. 2018, 19, 1995–2010. [Google Scholar] [CrossRef] [PubMed] [Green Version]
  47. Shine, M.B.; Yang, J.; El-Habbak, M.; Nagyabhyru, P.; Fu, D.; Navarre, D.; Ghabrial, S.; Kachroo, P.; Kachroo, A. Cooperative functioning between phenylalanine ammonia lyase and isochorismate synthase activities contributes to salicylic acid biosynthesis in soybean. New Phytol. 2016, 212, 627–636. [Google Scholar] [CrossRef] [PubMed] [Green Version]
  48. Zhang, Y.; Li, X. Salicylic acid: Biosynthesis, perception, and contributions to plant immunity. Curr. Opin. Plant Biol. 2019, 50, 29–36. [Google Scholar] [CrossRef]
  49. Wasternack, C.; Hause, B. Jasmonates: Biosynthesis, perception, signal transduction and action in plant stress response, growth and development. An update to the 2007 review in Annals of Botany. Ann. Bot. 2013, 111, 1021–1058. [Google Scholar] [CrossRef] [PubMed]
  50. Westfall, C.S.; Zubieta, C.; Herrmann, J.; Kapp, U.; Nanao, M.H.; Jez, J.M. Structural Basis for Prereceptor Modulation of Plant Hormones by GH3 Proteins. Science 2012, 336, 1708–1711. [Google Scholar] [CrossRef]
  51. Sheard, L.B.; Tan, X.; Mao, H.; Withers, J.; Ben-Nissan, G.; Hinds, T.R.; Kobayashi, Y.; Hsu, F.-F.; Sharon, M.; Browse, J.; et al. Jasmonate perception by inositol-phosphate-potentiated COI1–JAZ co-receptor. Nat. Cell Biol. 2010, 468, 400–405. [Google Scholar] [CrossRef]
  52. Thaler, J.S.; Humphrey, P.T.; Whiteman, N.K. Evolution of jasmonate and salicylate signal crosstalk. Trends Plant Sci. 2012, 17, 260–270. [Google Scholar] [CrossRef] [PubMed]
  53. Chini, A.; Boter, M.; Solano, R. Plant oxylipins: COI1/JAZs/MYC2 as the core jasmonic acid-signalling module. FEBS J. 2009, 276, 4682–4692. [Google Scholar] [CrossRef] [PubMed]
  54. Thines, B.; Katsir, L.; Melotto, M.; Niu, Y.; Mandaokar, A.D.; Liu, G.; Nomura, K.; He, S.Y.; Howe, G.A.; Browse, J. JAZ repressor proteins are targets of the SCFCOI1 complex during jasmonate signalling. Nature 2007, 448, 661–665. [Google Scholar] [CrossRef] [PubMed]
  55. Chung, H.S.; Koo, A.; Gao, X.; Jayanty, S.; Thines, B.; Jones, A.D.; Howe, G.A. Regulation and Function of Arabidopsis JASMONATE ZIM-Domain Genes in Response to Wounding and Herbivory. Plant Physiol. 2008, 146, 952–964. [Google Scholar] [CrossRef] [PubMed] [Green Version]
  56. Ryals, J.A.; Neuenschwander, U.H.; Willits, M.G.; Molina, A.; Steiner, H.-Y.; Hunt, M.D. Systemic Acquired Resistance. Plant Cell 1996, 8, 1809. [Google Scholar] [CrossRef] [Green Version]
  57. Durrant, W.; Dong, X. Systemic Acquired Resistance. Annu. Rev. Phytopathol. 2004, 42, 185–209. [Google Scholar] [CrossRef]
  58. Zavaliev, R.; Mohan, R.; Chen, T.; Dong, X. Formation of NPR1 Condensates Promotes Cell Survival during the Plant Immune Response. Cell 2020, 182, 1093–1108.e18. [Google Scholar] [CrossRef] [PubMed]
  59. Wang, W.; Withers, J.; Li, H.; Zwack, P.J.; Rusnac, D.-V.; Shi, H.; Liu, L.; Yan, S.; Hinds, T.R.; Guttman, M.; et al. Structural basis of salicylic acid perception by Arabidopsis NPR proteins. Nature 2020, 586, 311–316. [Google Scholar] [CrossRef]
  60. Wu, Y.; Zhang, D.; Chu, J.Y.; Boyle, P.; Wang, Y.; Brindle, I.D.; De Luca, V.; Després, C. The Arabidopsis NPR1 protein is a receptor for the plant defense hormone salicylic acid. Cell Rep. 2012, 1, 639–647. [Google Scholar] [CrossRef] [Green Version]
  61. Backer, R.; Naidoo, S.; van den Berg, N. The nonexpressor of pathogenesis-related genes 1 (NPR1) and related family: Mechanistic insights in plant disease resistance. Front. Plant Sci. 2019, 10, 102. [Google Scholar] [CrossRef] [Green Version]
  62. Cao, H.; Bowling, S.A.; Gordon, A.S.; Dong, X. Characterization of an Arabidopsis mutant that is nonresponsive to inducers of systemic acquired resistance. Plant Cell 1994, 6, 1583–1592. [Google Scholar] [CrossRef] [PubMed]
  63. Glazebrook, J.; Rogers, E.E.; Ausubel, F.M. Isolation of Arabidopsis mutants with enhanced disease susceptibility by direct screening. Genetics 1996, 143, 973–982. [Google Scholar] [CrossRef] [PubMed]
  64. Jung, H.W.; Hwang, B.K. Isolation, Partial Sequencing, and Expression of Pathogenesis-Related cDNA Genes from Pepper Leaves Infected by Xanthomonas campestris pv. vesicatoria. Mol. Plant-Microbe Interact. 2000, 13, 136–142. [Google Scholar] [CrossRef] [Green Version]
  65. Jung, H.W.; Tschaplinski, T.J.; Wang, L.; Glazebrook, J.; Greenberg, J.T. Priming in systemic plant immunity. Science 2009, 324, 89–91. [Google Scholar] [CrossRef]
  66. Breen, S.; Williams, S.; Outram, M.; Kobe, B.; Solomon, P.S. Emerging Insights into the Functions of Pathogenesis-Related Protein 1. Trends Plant Sci. 2017, 22, 871–879. [Google Scholar] [CrossRef] [PubMed]
  67. Schreiber, L. Transport barriers made of cutin, suberin and associated waxes. Trends Plant Sci. 2010, 15, 546–553. [Google Scholar] [CrossRef]
  68. Fich, E.; Segerson, N.A.; Rose, J.K. The Plant Polyester Cutin: Biosynthesis, Structure, and Biological Roles. Annu. Rev. Plant Biol. 2016, 67, 207–233. [Google Scholar] [CrossRef] [PubMed]
  69. Philippe, G.; Sørensen, I.; Jiao, C.; Sun, X.; Fei, Z.; Domozych, D.S.; Rose, J.K. Cutin and suberin: Assembly and origins of specialized lipidic cell wall scaffolds. Curr. Opin. Plant Biol. 2020, 55, 11–20. [Google Scholar] [CrossRef]
  70. Lim, G.-H.; Singhal, R.; Kachroo, A.; Kachroo, P. Fatty acid–and lipid-mediated signaling in plant defense. Annu. Rev. Phytopathol. 2017, 55, 505–536. [Google Scholar] [CrossRef]
  71. Ziv, C.; Zhao, Z.; Gao, Y.G.; Xia, Y. Multifunctional Roles of Plant Cuticle During Plant-Pathogen Interactions. Front. Plant Sci. 2018, 9, 1088. [Google Scholar] [CrossRef]
  72. Pollard, M.; Beisson, F.; Li, Y.; Ohlrogge, J.B. Building lipid barriers: Biosynthesis of cutin and suberin. Trends Plant Sci. 2008, 13, 236–246. [Google Scholar] [CrossRef]
  73. Graça, J. Suberin: The biopolyester at the frontier of plants. Front. Chem. 2015, 3, 62. [Google Scholar] [CrossRef]
  74. Gou, J.-Y.; Yu, X.-H.; Liu, C.-J. A hydroxycinnamoyltransferase responsible for synthesizing suberin aromatics in Arabidopsis. Proc. Natl. Acad. Sci. USA 2009, 106, 18855–18860. [Google Scholar] [CrossRef] [Green Version]
  75. Serra, O.; Hohn, C.; Franke, R.; Prat, S.; Molinas, M.; Figueras, M. A feruloyl transferase involved in the biosynthesis of suberin and suberin-associated wax is required for maturation and sealing properties of potato periderm. Plant J. 2010, 62, 277–290. [Google Scholar] [CrossRef] [PubMed]
  76. Compagnon, V.; Diehl, P.; Benveniste, I.; Meyer, D.; Schaller, H.; Schreiber, L.; Franke, R.; Pinot, F. CYP86B1 is required for very long chain ω-hydroxyacid and α, ω-dicarboxylic acid synthesis in root and seed suberin polyester. Plant Physiol. 2009, 150, 1831–1843. [Google Scholar] [CrossRef] [PubMed] [Green Version]
  77. Kunst, L.; Samuels, L. Plant cuticles shine: Advances in wax biosynthesis and export. Curr. Opin. Plant Biol. 2009, 12, 721–727. [Google Scholar] [CrossRef] [PubMed]
  78. Rowland, O.; Zheng, H.; Hepworth, S.; Lam, P.; Jetter, R.; Kunst, L. CER4 encodes an alcohol-forming fatty acyl-coenzyme a reductase involved in cuticular wax production in Arabidopsis. Plant Physiol. 2006, 142, 866–877. [Google Scholar] [CrossRef] [Green Version]
  79. Li, F.; Wu, X.; Lam, P.; Bird, D.; Zheng, H.; Samuels, A.L.; Jetter, R.; Kunst, L. Identification of the wax ester synthase/acyl-coenzyme a: Diacylglycerol acyltransferase WSD1 required for stem wax ester biosynthesis in Arabidopsis. Plant Physiol. 2008, 148, 97–107. [Google Scholar] [CrossRef] [Green Version]
  80. Xiao, F.; Goodwin, S.M.; Xiao, Y.; Sun, Z.; Baker, D.; Tang, X.; Jenks, M.A.; Zhou, J.-M. Arabidopsis CYP86A2 represses Pseudomonas syringae type III genes and is required for cuticle development. EMBO J. 2004, 23, 2903–2913. [Google Scholar] [CrossRef]
  81. Bacete, L.; Mélida, H.; Miedes, E.; Molina, A. Plant cell wall-mediated immunity: Cell wall changes trigger disease resistance responses. Plant J. 2018, 93, 614–636. [Google Scholar] [CrossRef]
  82. Mehli, L.; Schaart, J.G.; Kjellsen, T.D.; Tran, D.H.; Salentijn, E.M.J.; Schouten, H.J.; Iversen, T. A gene encoding a polygalacturonase-inhibiting protein (PGIP) shows developmental regulation and pathogen-induced expression in strawberry. New Phytol. 2004, 163, 99–110. [Google Scholar] [CrossRef] [PubMed]
  83. Miedes, E.; Vanholme, R.; Boerjan, W.; Molina, A. The role of the secondary cell wall in plant resistance to pathogens. Front. Plant Sci. 2014, 5, 358. [Google Scholar] [CrossRef] [Green Version]
  84. Bellincampi, D.; Cervone, F.; Lionetti, V. Plant cell wall dynamics and wall-related susceptibility in plant–pathogen interactions. Front. Plant Sci. 2014, 5, 228. [Google Scholar] [CrossRef] [PubMed] [Green Version]
  85. Ferrari, S.; Vairo, D.; Ausubel, F.M.; Cervone, F.; De Lorenzo, G. Tandemly Duplicated Arabidopsis Genes That Encode Polygalacturonase-Inhibiting Proteins Are Regulated Coordinately by Different Signal Transduction Pathways in Response to Fungal Infection. Plant Cell 2003, 15, 93–106. [Google Scholar] [CrossRef] [Green Version]
  86. Oelofse, D.; Dubery, I.A.; Meyer, R.; Arendse, M.S.; Gazendam, I.; Berger, D. Apple polygalacturonase inhibiting protein1 expressed in transgenic tobacco inhibits polygalacturonases from fungal pathogens of apple and the anthracnose pathogen of lupins. Phytochemistry 2006, 67, 255–263. [Google Scholar] [CrossRef] [PubMed] [Green Version]
  87. Barros-Rios, J.; Serk, H.; Granlund, I.; Pesquet, E. The cell biology of lignification in higher plants. Ann. Bot. 2015, 115, 1053–1074. [Google Scholar] [CrossRef] [Green Version]
  88. Xie, T.; Liu, Z.; Wang, G. Structural basis for monolignol oxidation by a maize laccase. Nat. Plants 2020, 6, 231–237. [Google Scholar] [CrossRef]
  89. Zhao, Q.; Nakashima, J.; Chen, F.; Yin, Y.; Fu, C.; Yun, J.; Shao, H.; Wang, X.; Wang, Z.-Y.; Dixon, R.A. Laccase is necessary and nonredundant with peroxidase for lignin polymerization during vascular development in Arabidopsis. Plant Cell 2013, 25, 3976–3987. [Google Scholar] [CrossRef] [Green Version]
  90. Soni, N.; Hegde, N.; Dhariwal, A.; Kushalappa, A.C. Role of laccase gene in wheat NILs differing at QTL-Fhb1 for resistance against Fusarium head blight. Plant Sci. 2020, 298, 110574. [Google Scholar] [CrossRef]
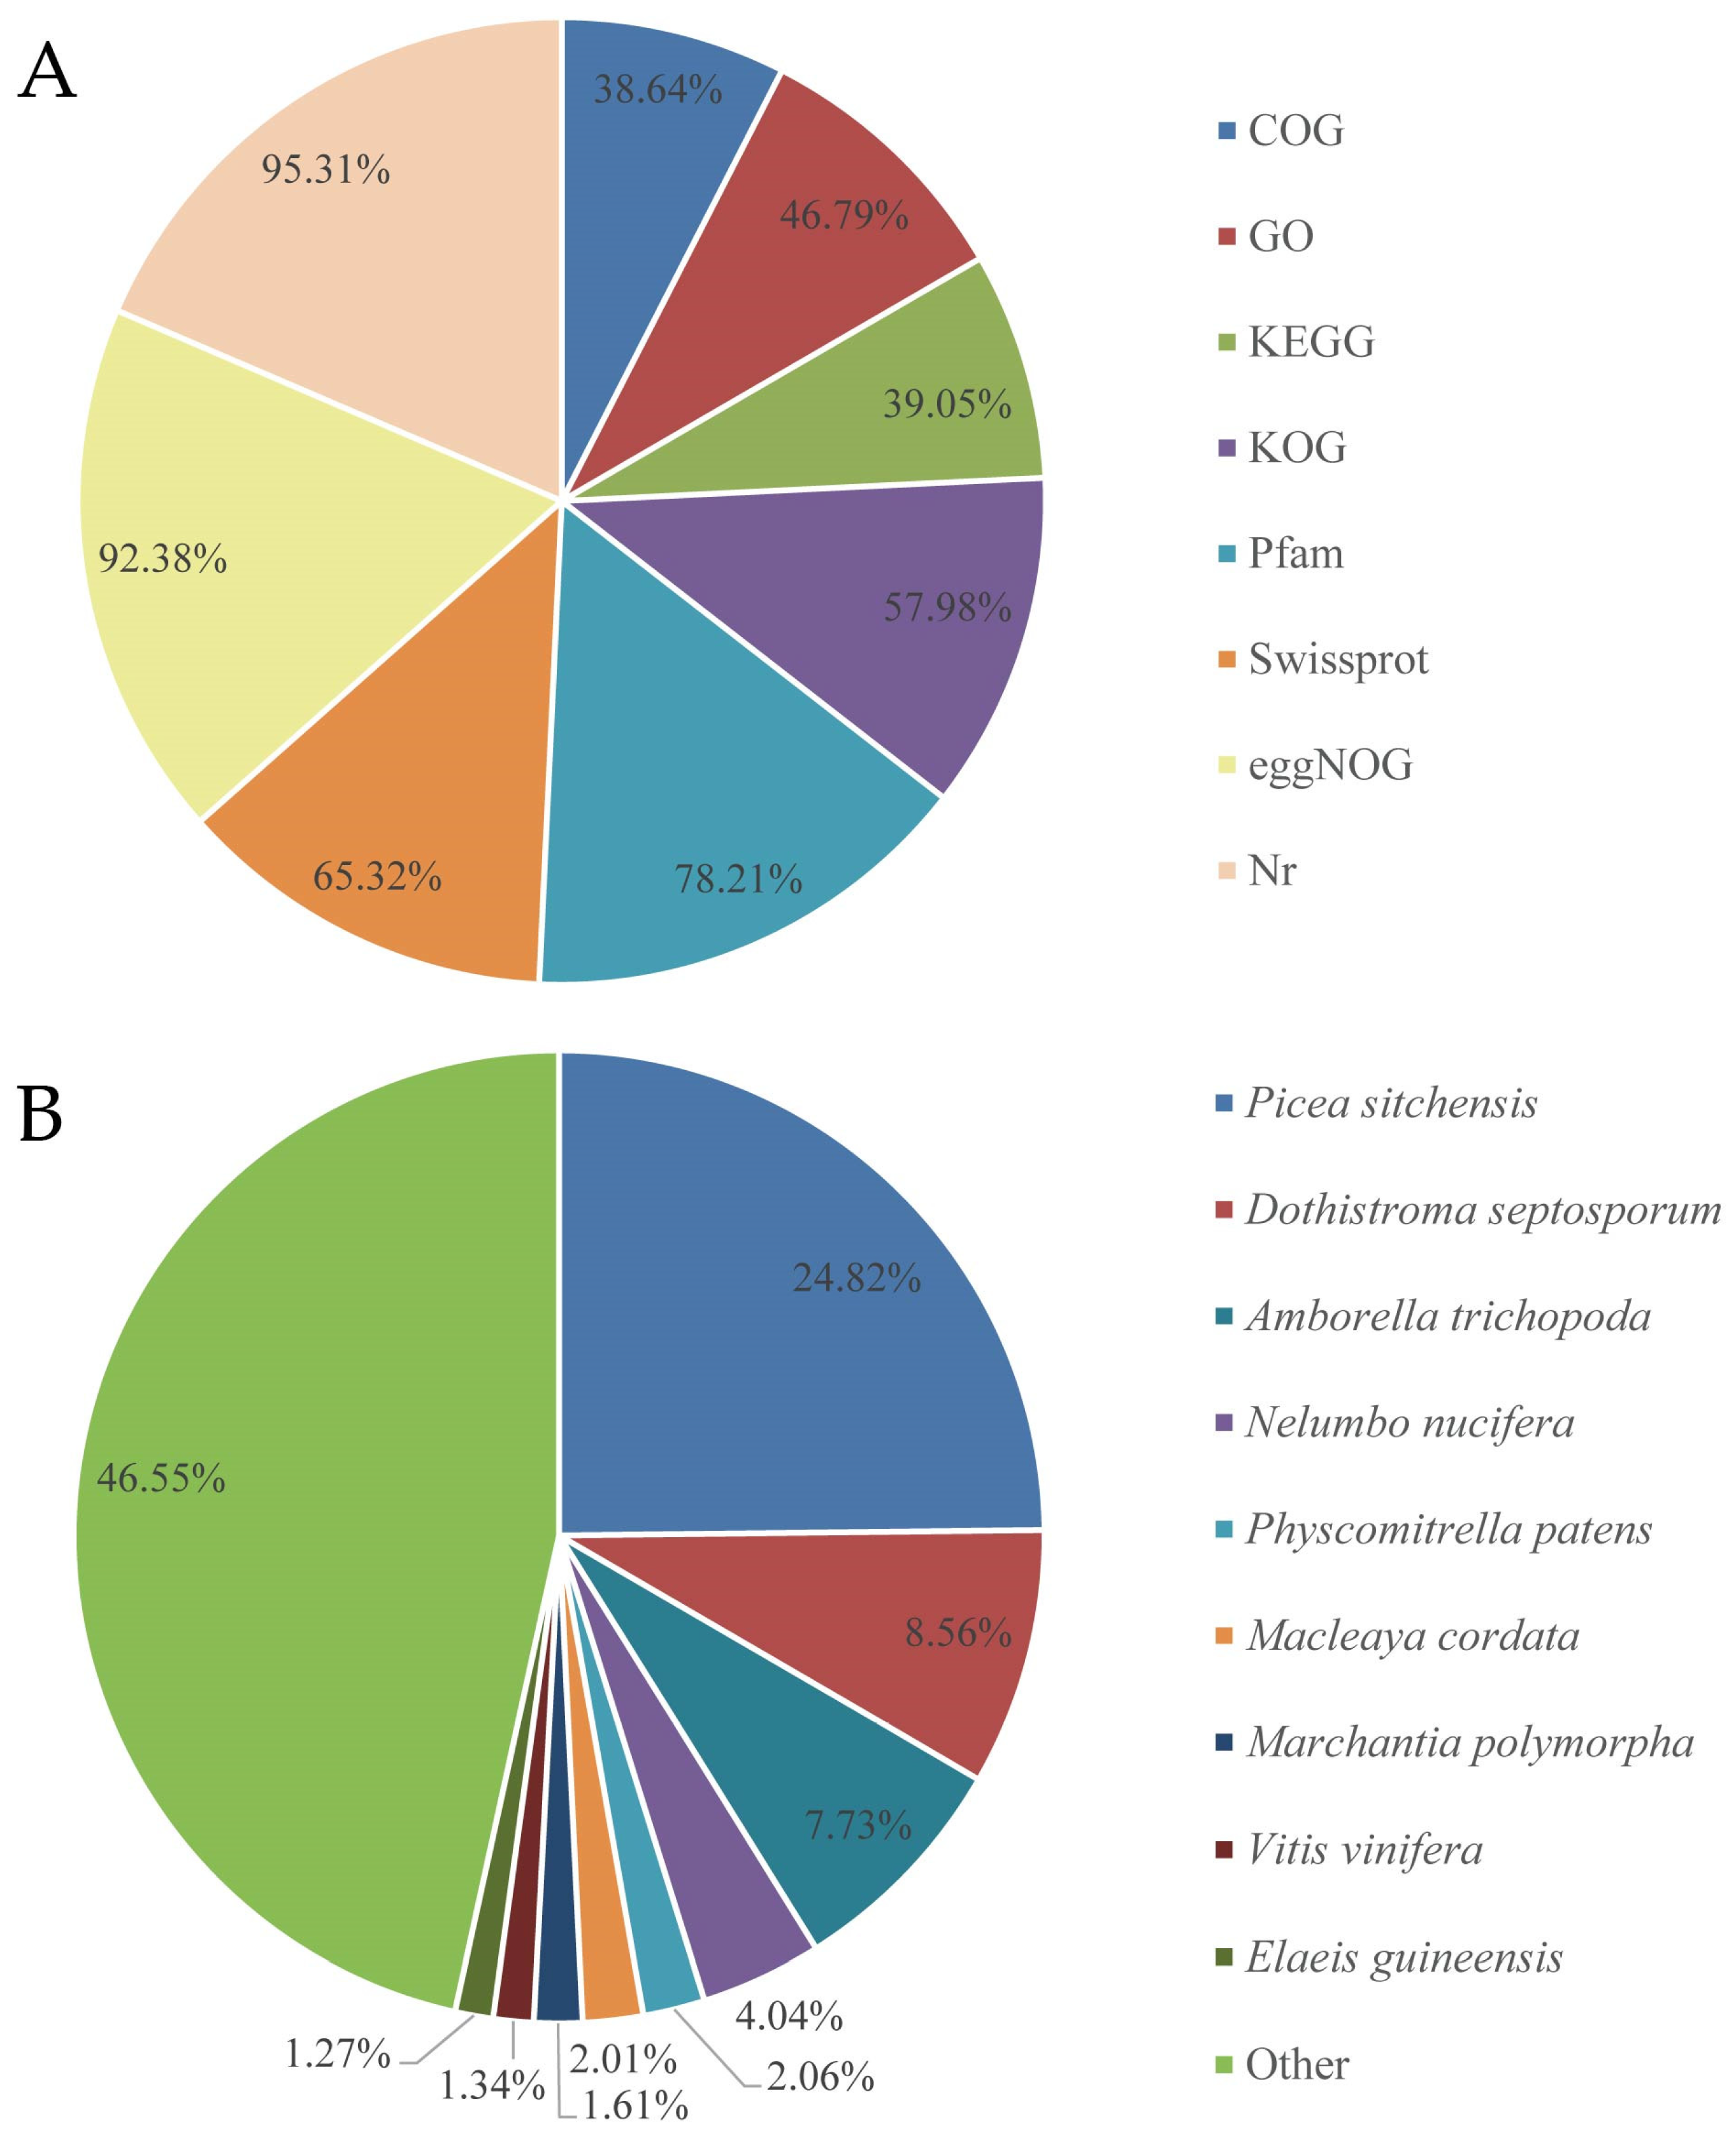
Figure 1. Unigene annotation by searching against public databases. (A) Database matches of all the annotated unigenes. NR (NCBI non-redundant protein sequences), Protein family (Pfam), KOG/COG/eggNOG (Clusters of Orthologous Groups of proteins), Swiss-Prot (a manually annotated and reviewed protein sequence database), Kyoto Encyclopedia of Genes and Genomes (KEGG), and Gene Ontology (GO). (B) Species distribution of all the top BLASTx hits. Annotation of unigenes obtained from combined transcriptomes of 12 cDNA libraries, including samples of T. mucronatum and T. distichum leaves with and without inoculation of P. maculans.
Forests 12 01090 g001
Figure 2. Classification of enriched GO and COG terms. (A) GO classifications of annotation unigenes. (B) All unigenes were assigned to different COG terms.
Forests 12 01090 g002aForests 12 01090 g002b
Figure 3. Differential gene expression in resistant T. distichum and susceptible T. mucronatum after fungal infection. (A) Histogram representing variation of DEGs after inoculation of P. maculans in resistant/susceptible plants. (B) Venn diagram represent DEGs in upregulated and downregulated groups. T.m-m: leaves of T. mucronatum with water treatment; T.m-inf: leaves of T. mucronatum with the fungal P. maculans infection; T.d-m: leaves of T. distichum with water treatment; T.d-inf: leaves of T. distichum with the fungal P. maculans infection.
Forests 12 01090 g003
Figure 4. Gene ontology (GO) analysis of up- and downregulated DEGs, respectively, in T. distichum and T. mucronatum. Merging groups of significant GO enrichment in T. distichum (A) and T. mucronatum (B).
Forests 12 01090 g004
Figure 5. Scatter plot of KEGG pathway enrichment of DEGs. (A,B) KEGG pathways based on up-/downregulated DEGs in the T.d-m vs. T.d-inf comparison, respectively. (C,D) KEGG pathways based on up-/downregulated DEGs in the T.m-m vs. T.m-inf comparison, respectively. The color of the dots represents the range of the Q-value, and the size of the dots represents the number of DEGs.
Forests 12 01090 g005
Figure 6. Model depicting the potential regulatory mechanisms involved in resistance to P. maculans in T. distichum (A) and T. mucronatum (B). Red and blue colors indicate up- and downregulated DEGs, whereas the gray color indicates no obvious changes. SA, salicylic acid; JA, jasmonic acid; CERK1, chitin elicitor receptor kinase 1; FLS2, flagellin sensing 2; JAZ, JASMONATE ZIM-DOMAIN; PAL, phenylalanine ammonia lyase; ICS, isochorismate synthase; NPR1, nonexpressor of pathogenesis-related genes 1; PR, pathogenesis-related; JAV, JASMONATE-ASSOCIATED VQ MOTIF GENE; LOXs, lipoxygenases; AOS, allene oxide synthase; AOC, allene oxide cyclase; OPR3, 12-oxo-phytodienoic acid reductase 3; COI1, coronatine-insensitive 1; HHT, hydroxycinnamoyl-CoA:ω-hydroxyacid/fatty alcohol transferase; FAR3/CER4, fatty acyl–CoA reductase; CYP86A, cytochrome P450 86A; PGIPs, polygalacturonase inhibitor proteins; Lacs, laccases.
Forests 12 01090 g006
Table 1. Summary of Illumina transcriptome sequencing for different samples.
SampleClean ReadsClean BaseQ30 (%)GC Content (%)
T.m-m123,234,6636,908,744,52044.22%94.81%
T.m-m227,191,4548,117,561,81645.78%94.34%
T.m-m326,655,6737,963,346,39245.29%94.50%
T.m-inf123,359,2806,958,966,30444.08%94.59%
T.m-inf225,414,7667,588,528,28044.82%93.92%
T.m-inf323,958,5617,165,086,89044.63%93.99%
T.d-m120,405,2346,082,914,05644.73%94.71%
T.d-m227,830,3768,321,579,48845.46%93.84%
T.d-m320,303,0956,062,394,89845.53%94.06%
T.d-inf120,896,9706,219,980,10644.79%94.50%
T.d-inf224,190,7927,222,586,66644.97%93.64%
T.d-inf322,400,3536,685,760,18445.50%94.1%
T.m-m: leaves of T. mucronatum with water treatment; T.m-inf: leaves of T. mucronatum with the fungal P. maculans infection; T.d-m: leaves of T. distichum with water treatment; T.d-inf: leaves of T. distichum with the fungal P. maculans infection.
Publisher’s Note: MDPI stays neutral with regard to jurisdictional claims in published maps and institutional affiliations.