Abstract
Because nutrients including nitrogen and phosphorus are generally limited in tropical forest ecosystems in Puerto Rico, a quantitative understanding of the nutrient budget at a watershed scale is required to assess vegetation growth and predict forest carbon dynamics. Hurricanes are the most frequent disturbance in Puerto Rico and play an important role in regulating lateral nitrogen and phosphorus exports from the forested watershed. In this study, we selected seven watersheds in Puerto Rico to examine the immediate and lagged effects of hurricanes on nitrogen and phosphorous exports. Our results suggest that immediate surges of heavy precipitation associated with hurricanes accelerate nitrogen and phosphorus exports as much as 297 ± 113 and 306 ± 70 times than the long-term average, respectively. In addition, we estimated that it requires approximately one year for post-hurricane riverine nitrogen and phosphorus concentrations to recover to pre-hurricane levels. During the recovery period, the riverine nitrogen and phosphorus concentrations are 30 ± 6% and 28 ± 5% higher than the pre-hurricane concentrations on average.
1. Introduction
Field measurements indicate tropical forest ecosystems in Puerto Rico are generally characterized by lack of nutrients including nitrogen and phosphorous to net primary productivity [1,2,3,4,5]. In a forested watershed, soil nitrogen and phosphorus can be moved by the surface runoff from soils to inland waters, then transported by the streamflow, and finally exported from the watershed through the outlet [6,7]. Because exports of nitrogen and phosphorus from forested watersheds substantially strip nutrients from soils and affect input-output budgets, there has been increasing attention on its role in affecting vegetation growth, forest management, carbon storage in forests, and acidifying inland waters [8,9,10].
Tropical forests in Puerto Rico are undergoing constant hurricane disturbances, which are considered agents of ecosystem structuring through direct defoliation as well as drivers of terrestrial-aquatic nitrogen and phosphorus transport [11,12]. The surges of heavy precipitation associated with hurricanes immediately increase surface runoff, which can directly move the soil nitrogen and phosphorous to inland waters [13,14]. In addition, the wind storm associated with hurricanes introduces the defoliation and transfer of nitrogen and phosphorous from canopy leaves to the forest floor [15,16], and the litterfall pulses contain detached green leaves with more nitrogen and phosphorus than senescent leaves and twigs with lower contents than green leaves [17]. The post-hurricane decomposition of nitrogen- and phosphorus- rich litterfall results in high soil nitrogen and phosphorus contents, and thus can lead to greater load to inland waters [18,19]. Therefore, a better quantification of the immediate and lagged hurricane effects on terrestrial–aquatic nitrogen and phosphorus fluxes is required to assess available soil nutrients, develop forest management strategies, and model the forest ecosystem [20,21].
Given the increasing frequency and severity of hurricanes in Puerto Rico [22] and their significant effects on soil nitrogen and phosphorous contents [23,24], a quantitative understanding of the immediate and lagged effects of hurricanes on riverine nitrogen and phosphorous exports from tropical forest ecosystems is required for assessing the nutrient budget. In this project, we analyzed the trajectories of pre-, during-, and post-hurricane nitrogen and phosphorus exports from seven tropical forested watersheds in Puerto Rico to assess (1) the immediate magnitudes of hurricanes on the lateral nitrogen and phosphorous loadings from soils to inland waters, and (2) the time period required for nitrogen and phosphorus concentrations to recover to pre-hurricane levels. We hypothesized that as a result of hurricane impacts, the nitrogen and phosphorus exports would increase immediately and post-hurricane riverine concentrations increasing temporarily, then return to pre-hurricane levels.
2. Materials and Methods
2.1. Study Area, Discharge, Nitrogen, and Phosphorous Data
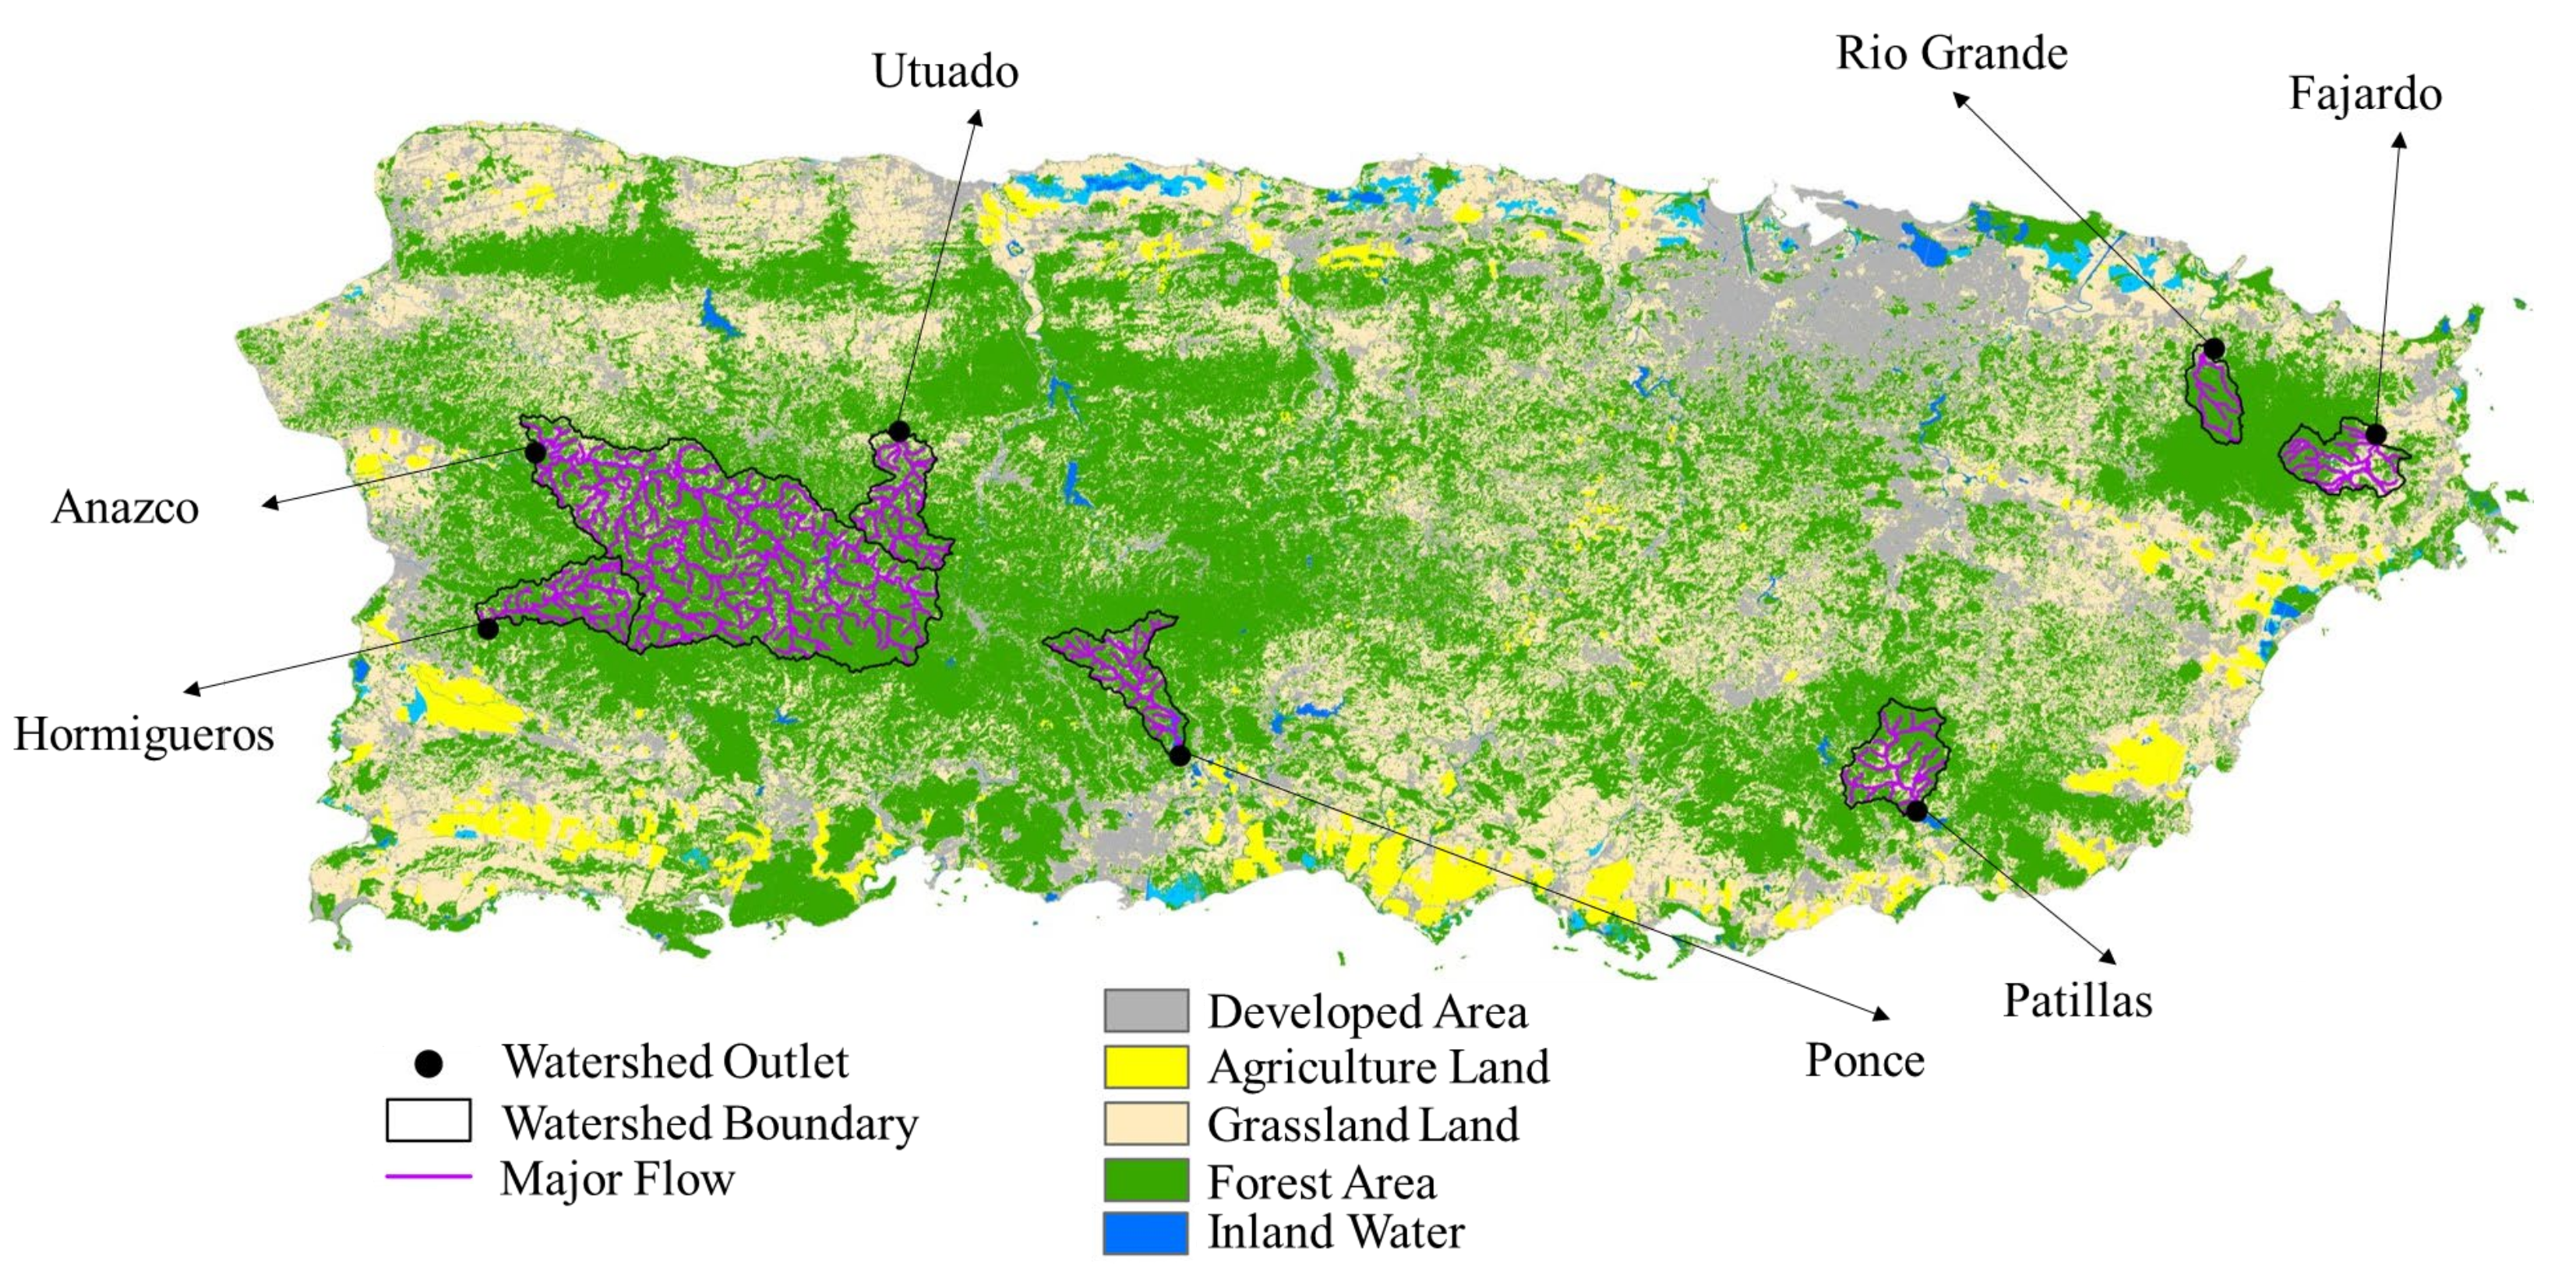
In this study, seven watersheds in Puerto Rico with more than 70% tropical forest cover and less than 1% inland water cover were selected (Figure 1, Table 1). The geographic data including major surface flow as well as watershed boundary and outlet location of each selected watershed were provided by the USGS Watershed Boundary Dataset (WBD; https://www.usgs.gov/core-science-systems/ngp/national-hydrography, accessed on 2 January 2022). The seven watersheds used in this study ranged from 22 km2 (Rio Grande) to 244 km2 (Anasco).

Figure 1.
The geographic data including major surface flow as well as watershed boundary and outlet location of the seven analyzed watersheds in Puerto Rico.

Table 1.
The name, US Geological Survey (USGS) site number, outlet location, watershed size, forest area as well as the number of recorded nitrogen and phosphorous concentrations and their time periods (N = nitrogen, P = phosphorus) of each watershed.
To estimate the pre-, during-, and post- hurricane daily riverine nitrogen (nitrogen, nitrate, nitrite, ammonia, and organic nitrogen) and phosphorus concentrations at the watershed outlet, the long-term measurements provided by the US Geological Survey (USGS) National Water Information System (NWIS; https://waterdata.usgs.gov/nwis/, accessed on 2 January 2022) were used. Four criteria were used to select these seven watersheds: (1) the riverine nitrogen and phosphorous concentrations had more than 50 records in different days; (2) the nitrogen and phosphorous concentrations were measured more than ten times during the post-hurricane year; (3) the daily discharges were all recorded; (4) the watershed experienced at least one hurricane that can greatly affect the watershed. The criteria (1), (2), and (3) were required to build the model, which can estimate the daily riverine nitrogen and phosphorous concentrations, and the criterion (4) was used to observe major hurricane effects on the nitrogen and phosphorous exports (see Section 2.3).
2.2. Land Cover, Hurricane, and Leaf Area Index Data
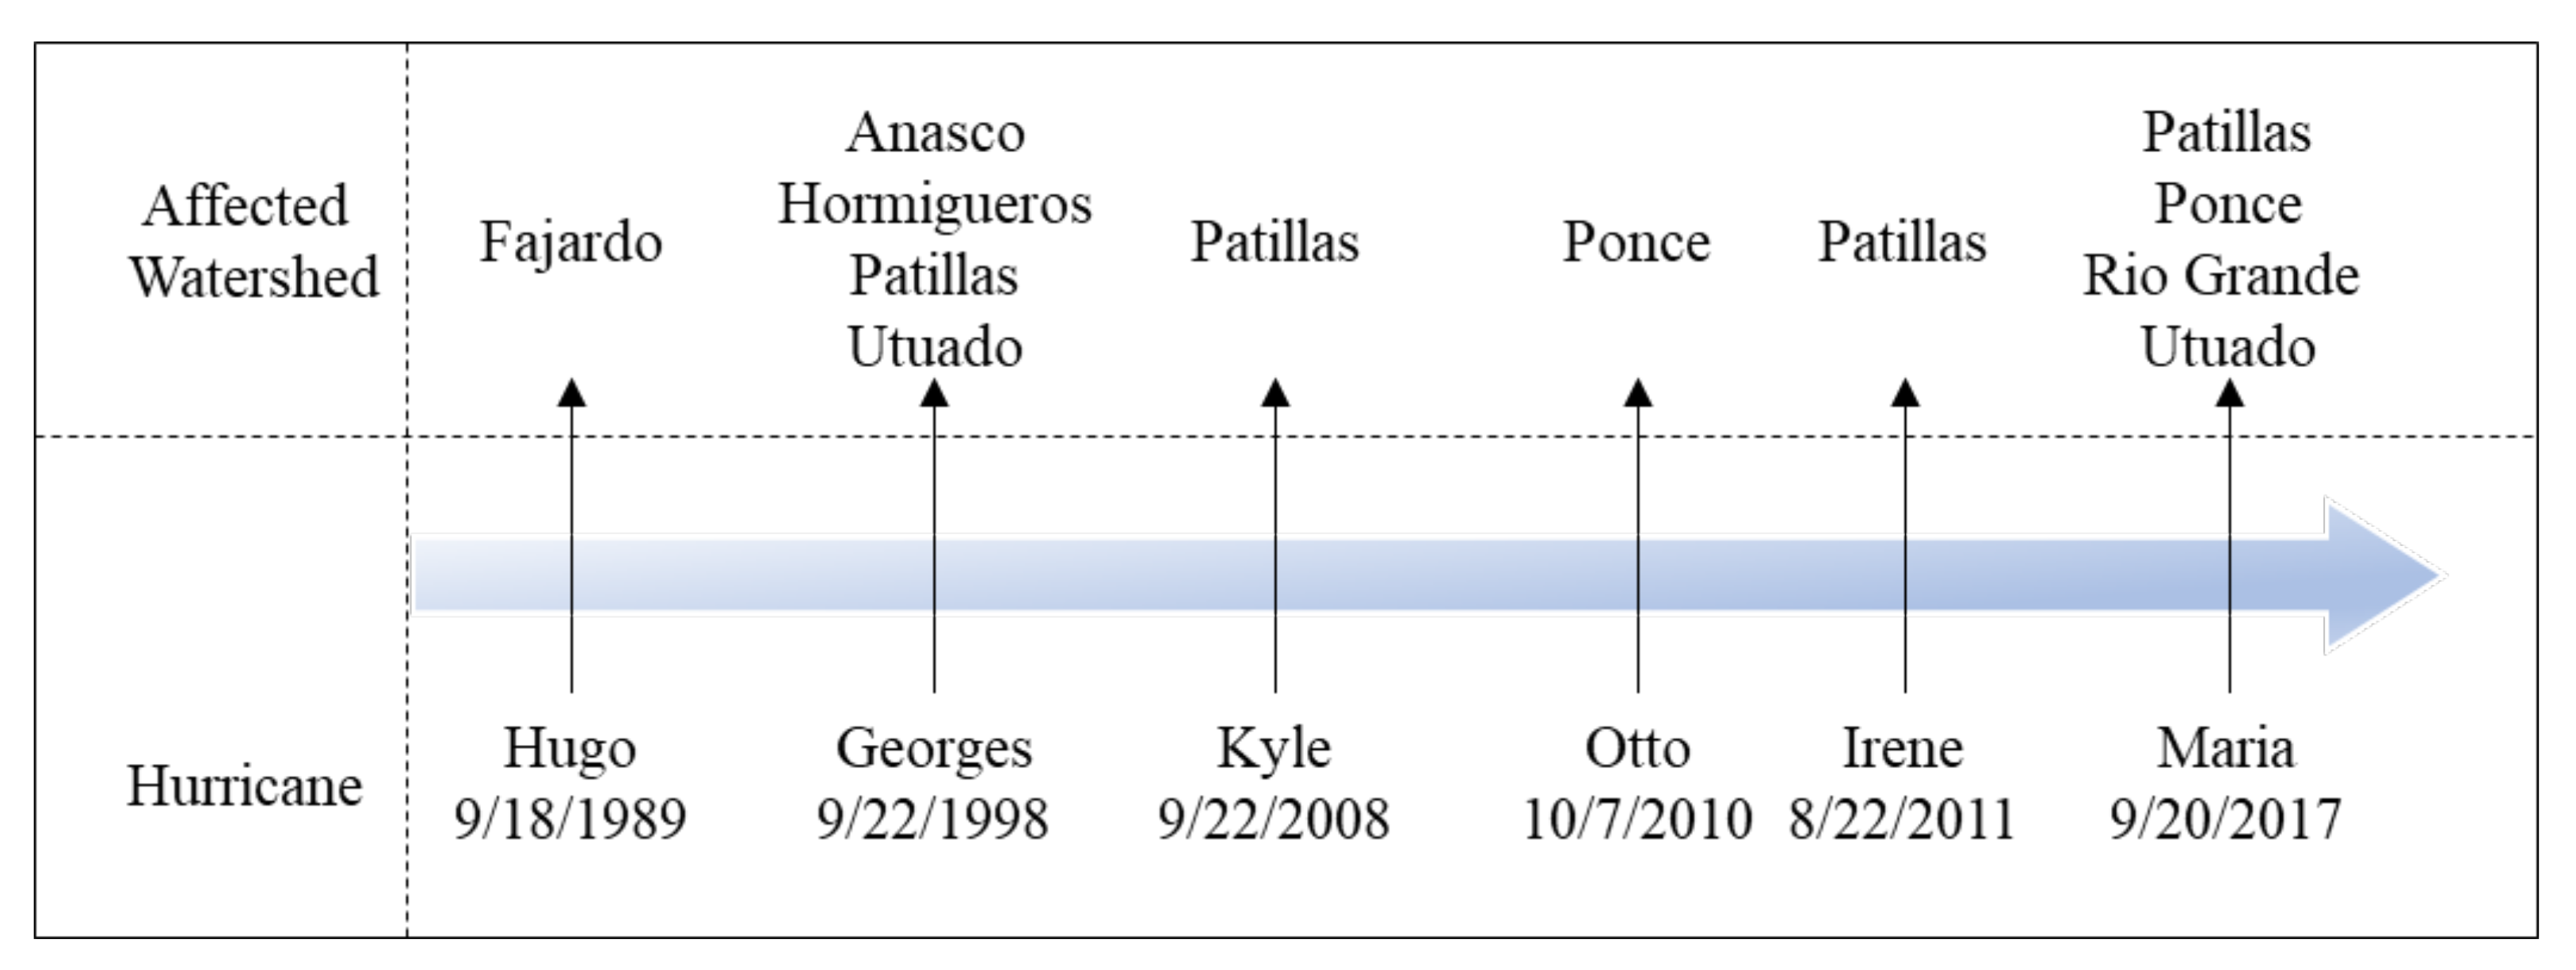
To characterize the forest cover and inland water area of each watershed, we used the landcover data National Land Cover Database 2016 (NLCD2016) [25], which was provided by the Multi-Resolution Land Characteristics (MRLC) Consortium (https://www.mrlc.gov/, accessed on 2 January 2022) (Figure 1). NLCD2016 indicated that these seven watersheds were covered by mixed forest. The hurricane data was provided by the National Oceanic and Atmospheric Administration (NOAA). The major hurricanes that impacted these watersheds were included in this study (Figure 2). In this study, the immediate effect of a hurricane was defined as the effect of the hurricane on nitrogen and phosphorous exports during the hurricane period. The start date of a hurricane period was the day when the watershed started to experience the heavy precipitation (daily total precipitation > 100-fold long-term average) and the end date was the day when the heavy precipitation ended.

Figure 2.
Timeline of these hurricanes and affected watersheds (note that the date of a hurricane is the day when the watershed started to experience heavy precipitation).
The pre- and post- hurricane Leaf Area Index (LAI) of each watershed was obtained from MOD15A2H Version 6 Moderate Resolution Imaging Spectroradiometer (MODIS) dataset (https://lpdaac.usgs.gov/products/, accessed on 2 January 2022). The LAI data has a spatial resolution of 500 m × 500 m for every 8 days from 2000 to present. We calculated the spatially averaged grid LAI of each watershed to represent its LAI.
2.3. Riverine Nitrogen and Phosphorus Exports Estimate
We could not base our long-term dynamics analysis of riverine nitrogen and phosphorous concentrations directly on lab-based measurements recorded by USGS. This is because of the limited records and sample bias of the available data [26]. Using the limited measurements, Hirsch et al. [26] proposed the Weighted Regressions on Times, Discharges, and Season model (WRTDS, Equation (1)), which has been widely used to estimate the long-term surface water-quality (e.g., riverine nitrogen, phosphorous, and dissolved organic carbon concentrations) [27,28,29,30].
where C is the riverine nitrogen or phosphorous concentration (mg/L) at daily scale, Q is the total daily discharge (L). A measurement is taken in date t, td represents the order of the day (i.e., 1, 2, 3 … 365 or 366), tm represents the order of month (i.e., 1, 2, 3 … 12), ty represents the order of the year (i.e., 1, 2, 3 … T). Parameters θ, α, β, γ, and δ are fitted coefficients. ε is the unexplained variation.
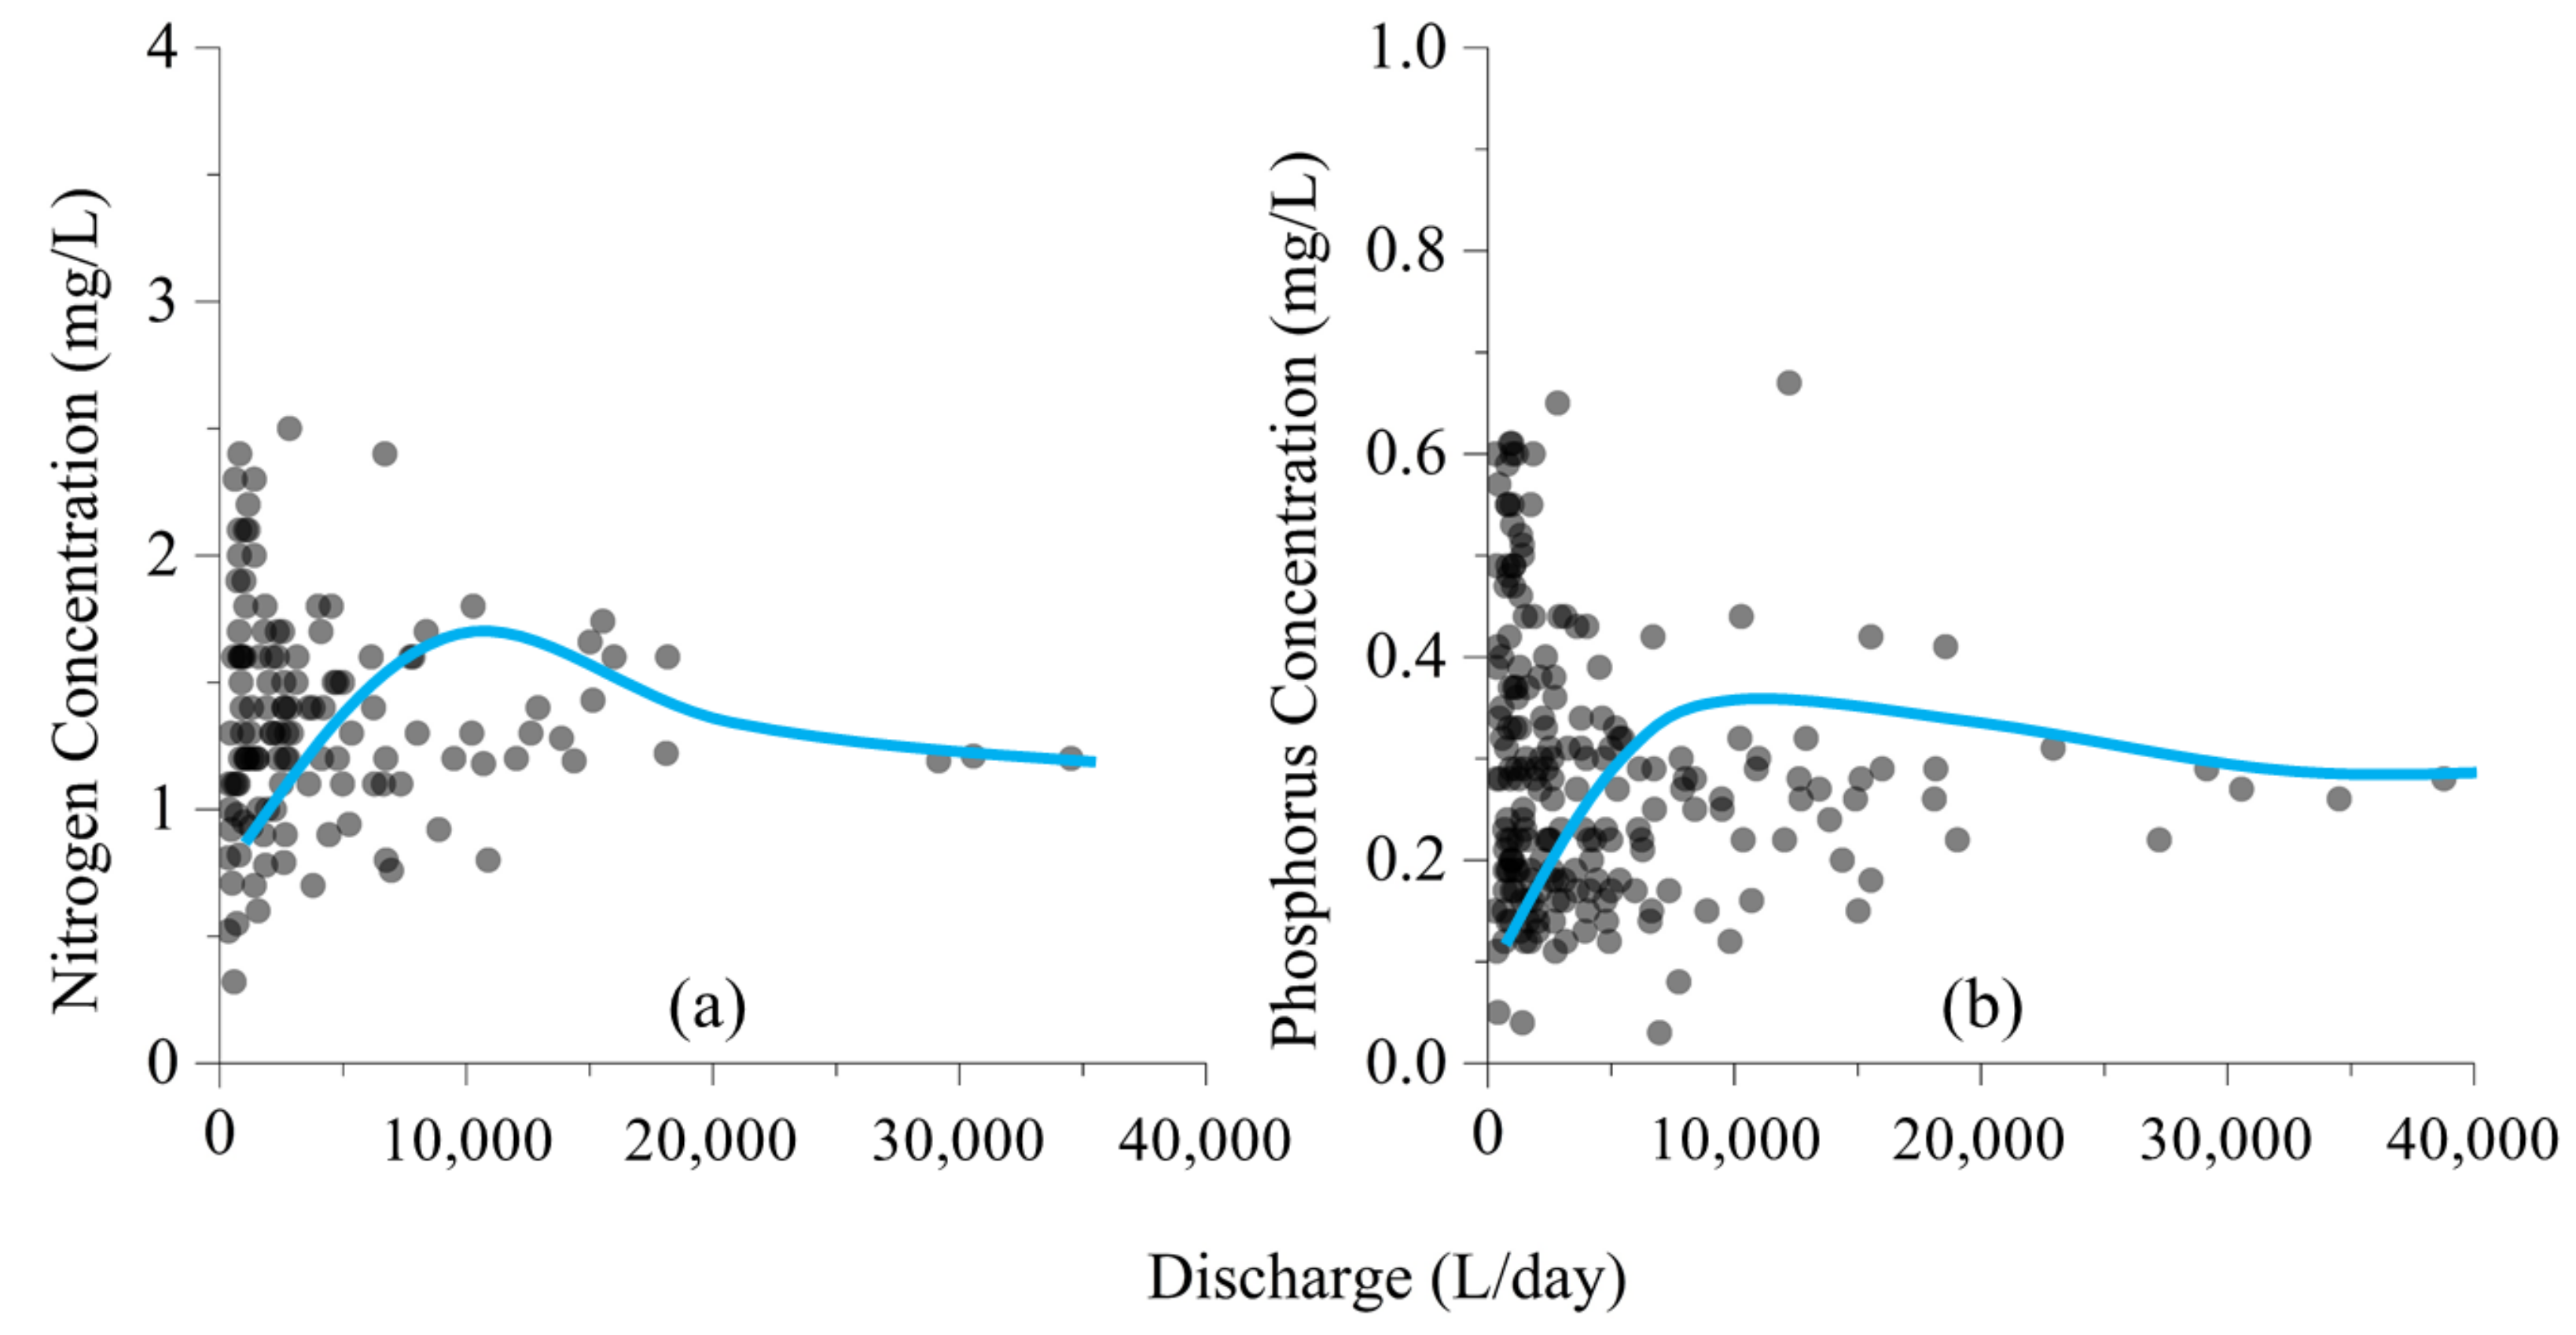
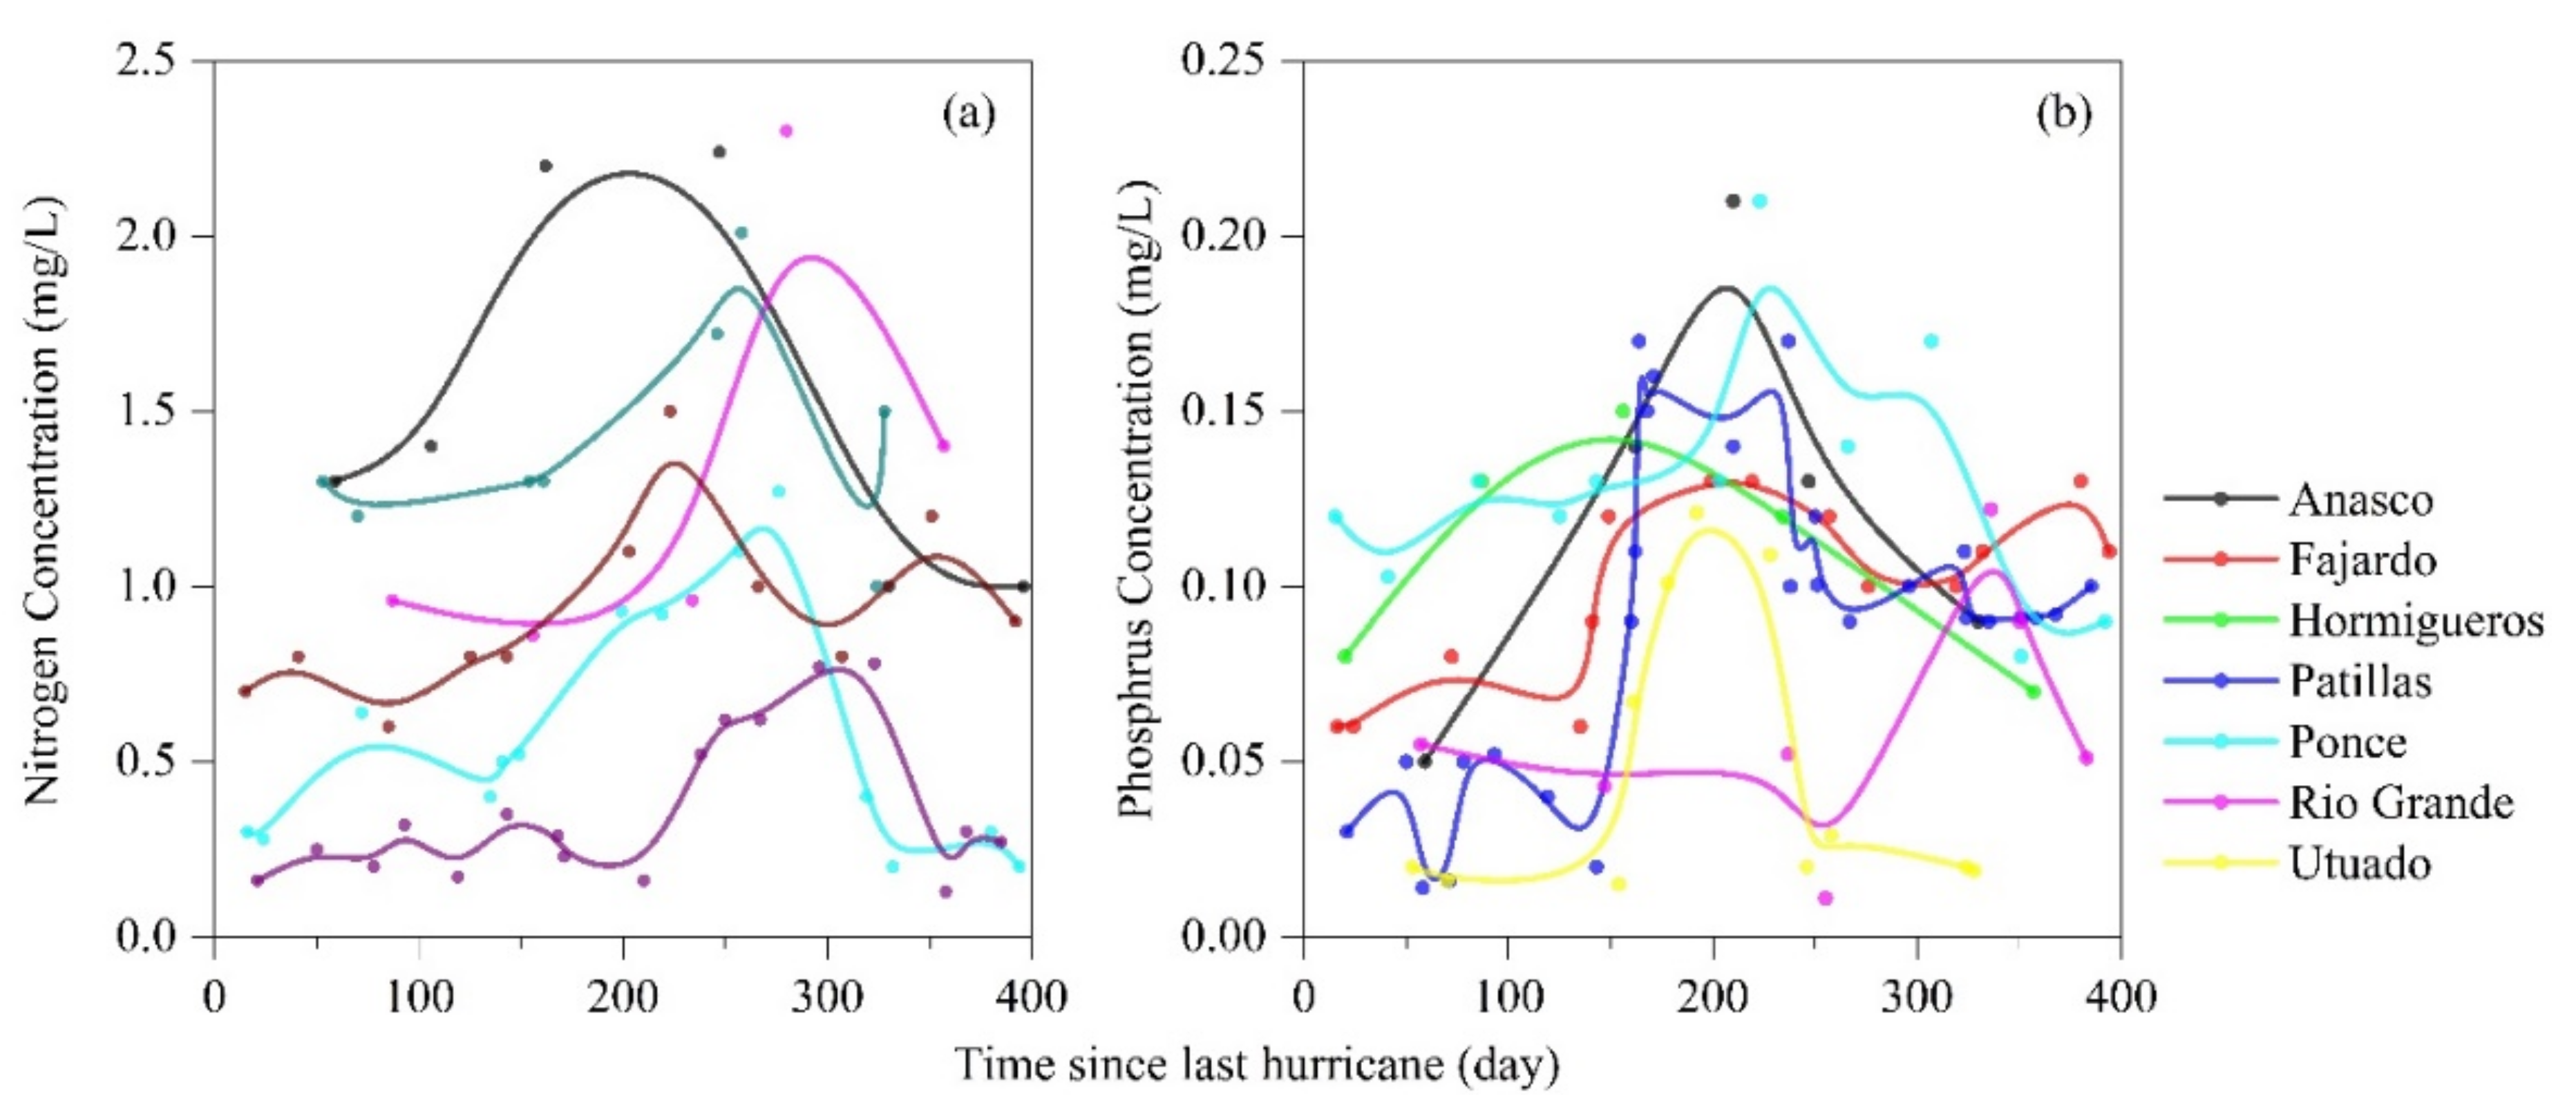
However, the instant and lagged effects of hurricanes on riverine nitrogen and phosphorous concentrations are not represented in the original WRTDS model. The relationship between recorded discharges and nitrogen or phosphorous concentrations suggested that the nitrogen or phosphorous concentrations initially increases with the increasing discharge, then starts to decrease and become stable (Figure A1). To model this pattern, we used thresholds to limit the estimated nitrogen and phosphorous concentrations. In addition, because the recorded post-hurricane riverine nitrogen or phosphorous concentrations are log-normal distributed (Figure 3), the lagged effects were modeled with a log-normal model (Equation (2)). Therefore, the riverine nitrogen or phosphorous concentrations under hurricane disturbance was modeled by the WRTDS-hurricane model (Equation (3)).
where HF is the hurricane effects on nitrogen and phosphorous concentrations, TSLH is the time since the last hurricane, τ, μ, and σ are fitted coefficients. The total daily nitrogen or phosphorus export from a watershed was calculated as the product of daily total discharge and daily nitrogen or phosphorus concentration.

Figure 3.
The patterns of post-hurricane riverine nitrogen (a) and phosphorous (b) concentrations based on the seven direct measurements.
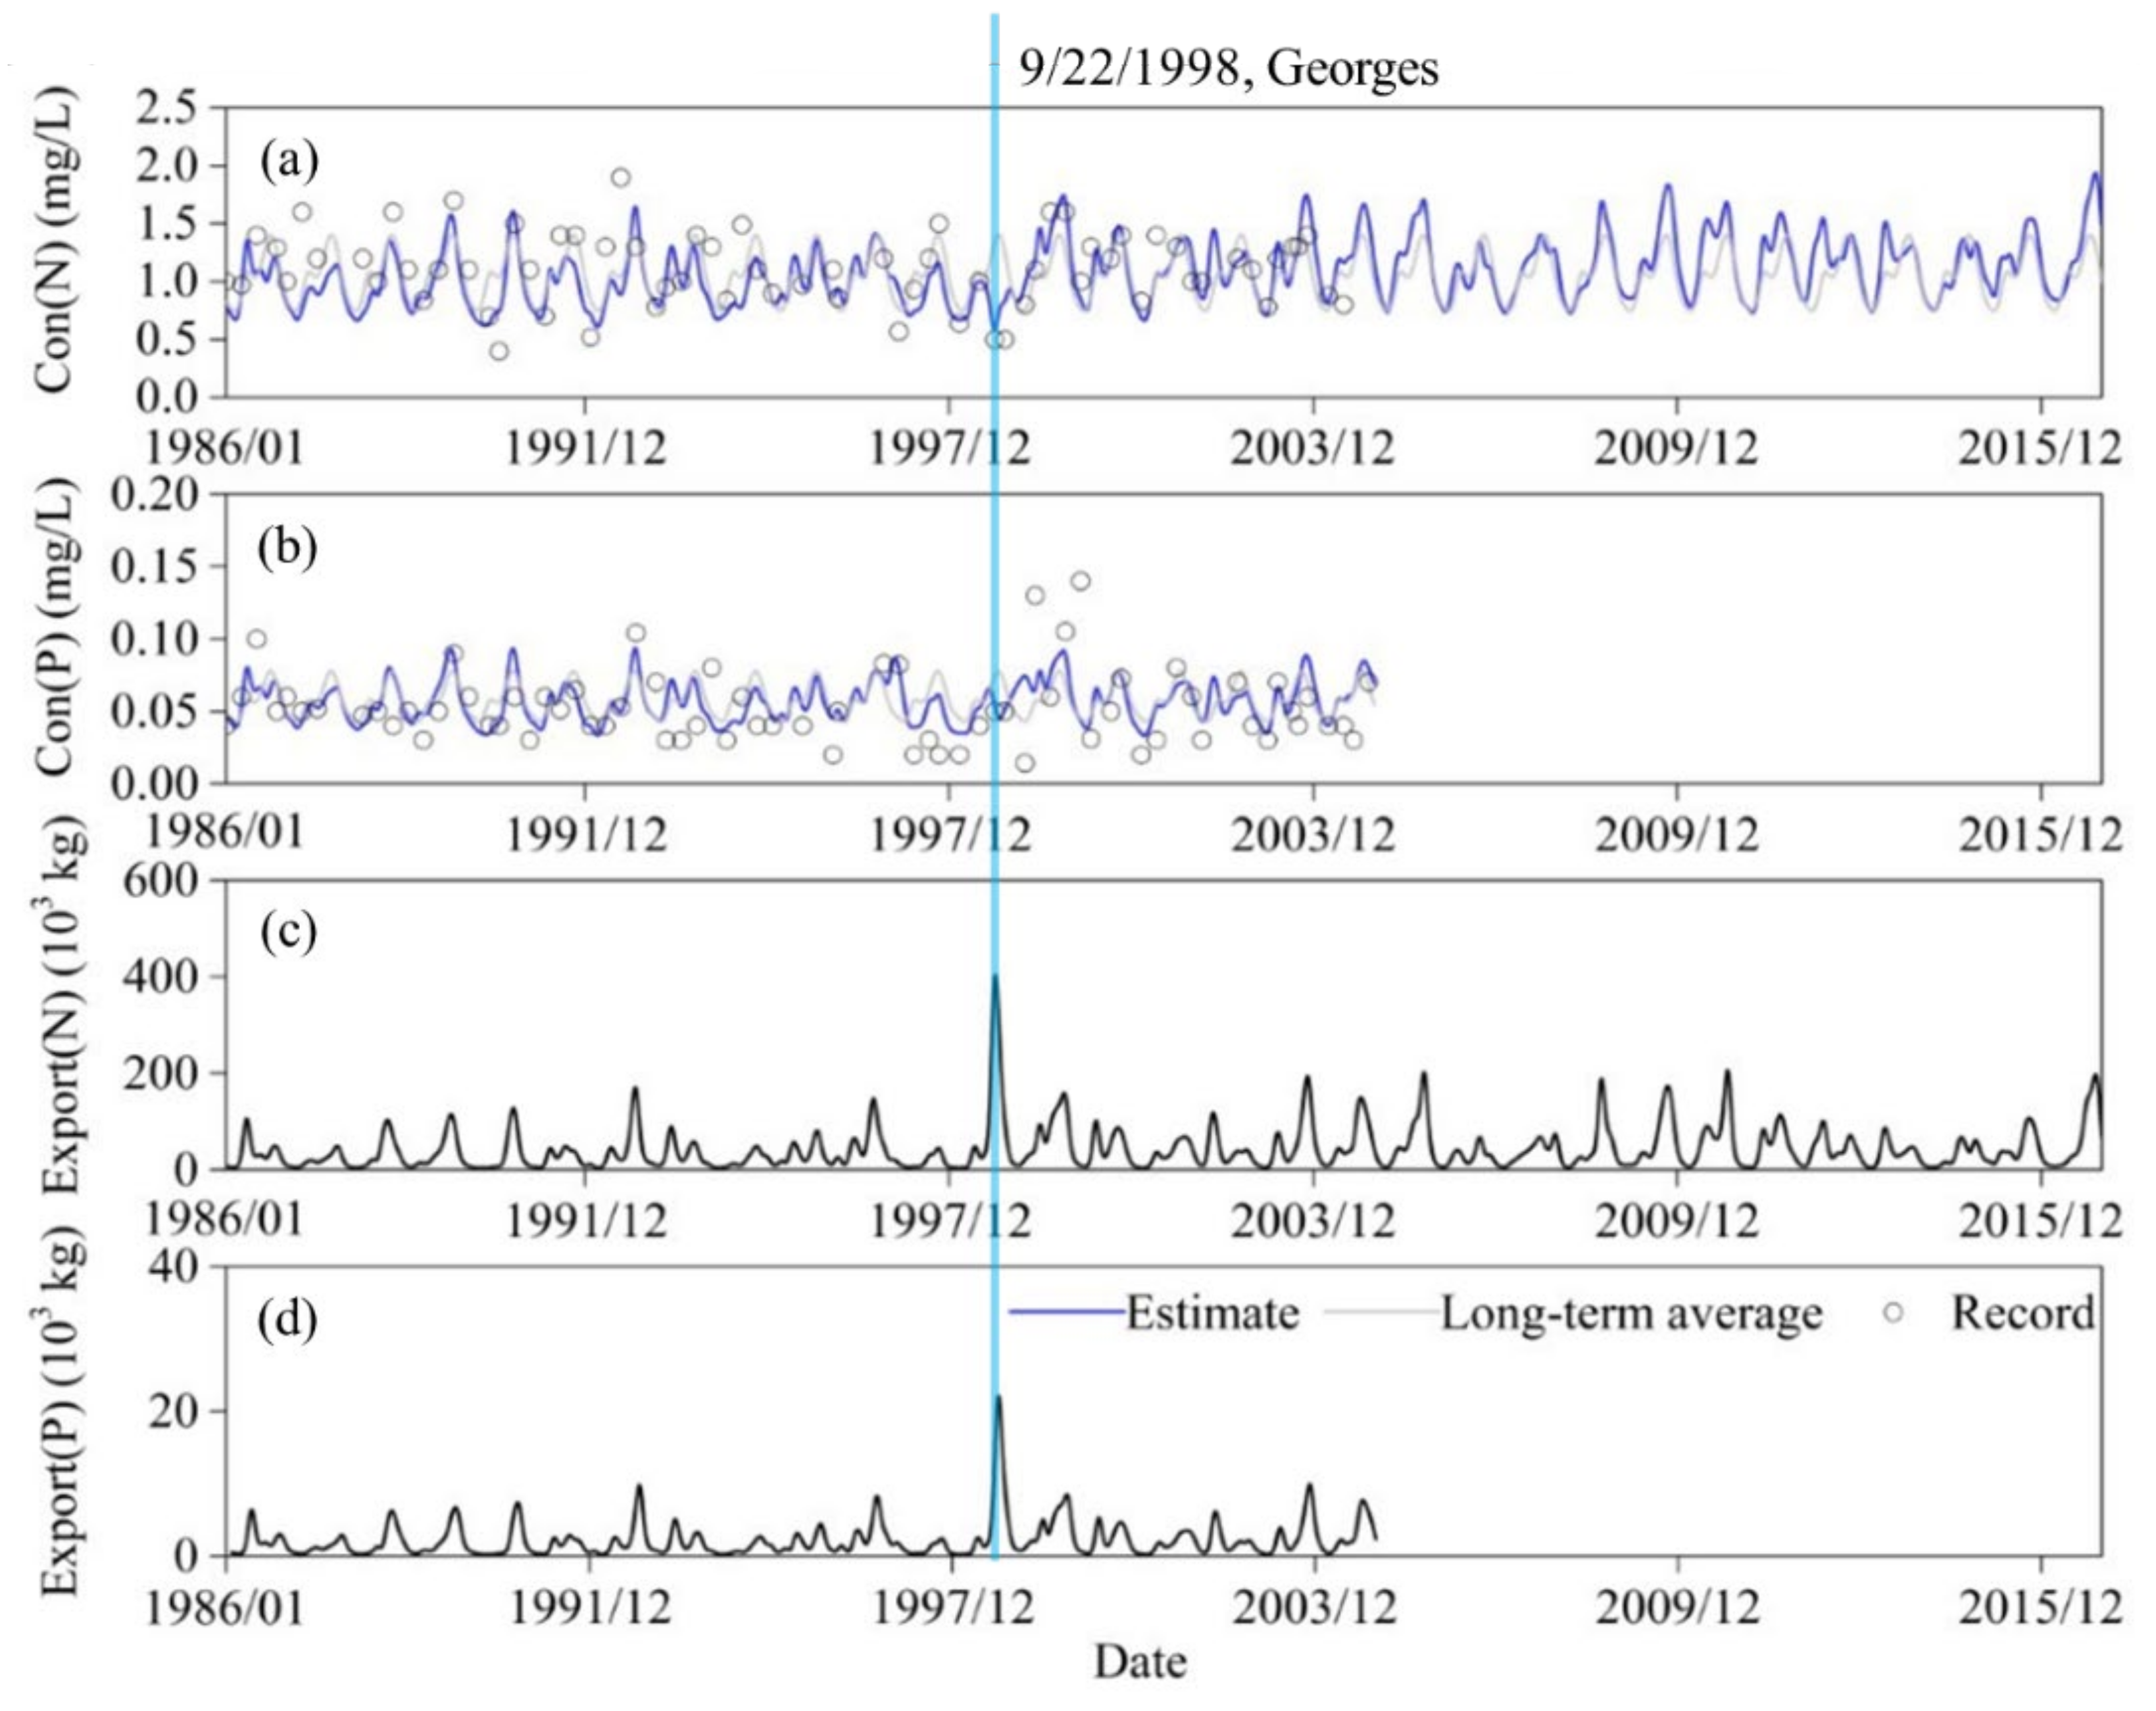
We used a rotation estimation method to estimate these fitted coefficients. First, 30% of the total nitrogen or phosphorous measurements were randomly removed, and the rest 70% records were applied to calculate each fitted coefficient. Secondly, we repeated 100 times of the first process, and thus we estimated 100 times of each fitted coefficient. Third, the mean value of these 100 estimates was calculated as the value of this fitted coefficient. Then, the WRTDS-hurricane model of a watershed was parameterized and applied to estimate the time-series of daily riverine nitrogen and phosphorous concentrations, respectively (Figure 4). The total daily nitrogen or phosphorus export was calculated as the product of daily concentration and total discharge.

Figure 4.
An example of the estimated and recorded riverine nitrogen (a) and phosphorus (b) concentrations of the Anasco watershed as well as the total nitrogen (c) and phosphorus (d) exports at a monthly scale (Con = concentration, N = nitrogen, P = phosphorus).
The absolute difference index (AD, %, Equation (4)) [31] was used to access the performance of the WRTDS-hurricane model, which can evaluate the difference between recorded riverine nitrogen or phosphorus concentration and estimated concentration for a given day.
where AD is the absolute difference (%), Cone is the estimated nitrogen or phosphorous concentration, Conr is the recorded concentration for the same day. A higher AD indicates a lower similarity.
2.4. Post-Hurricane Nutrient Concentrations Analysis
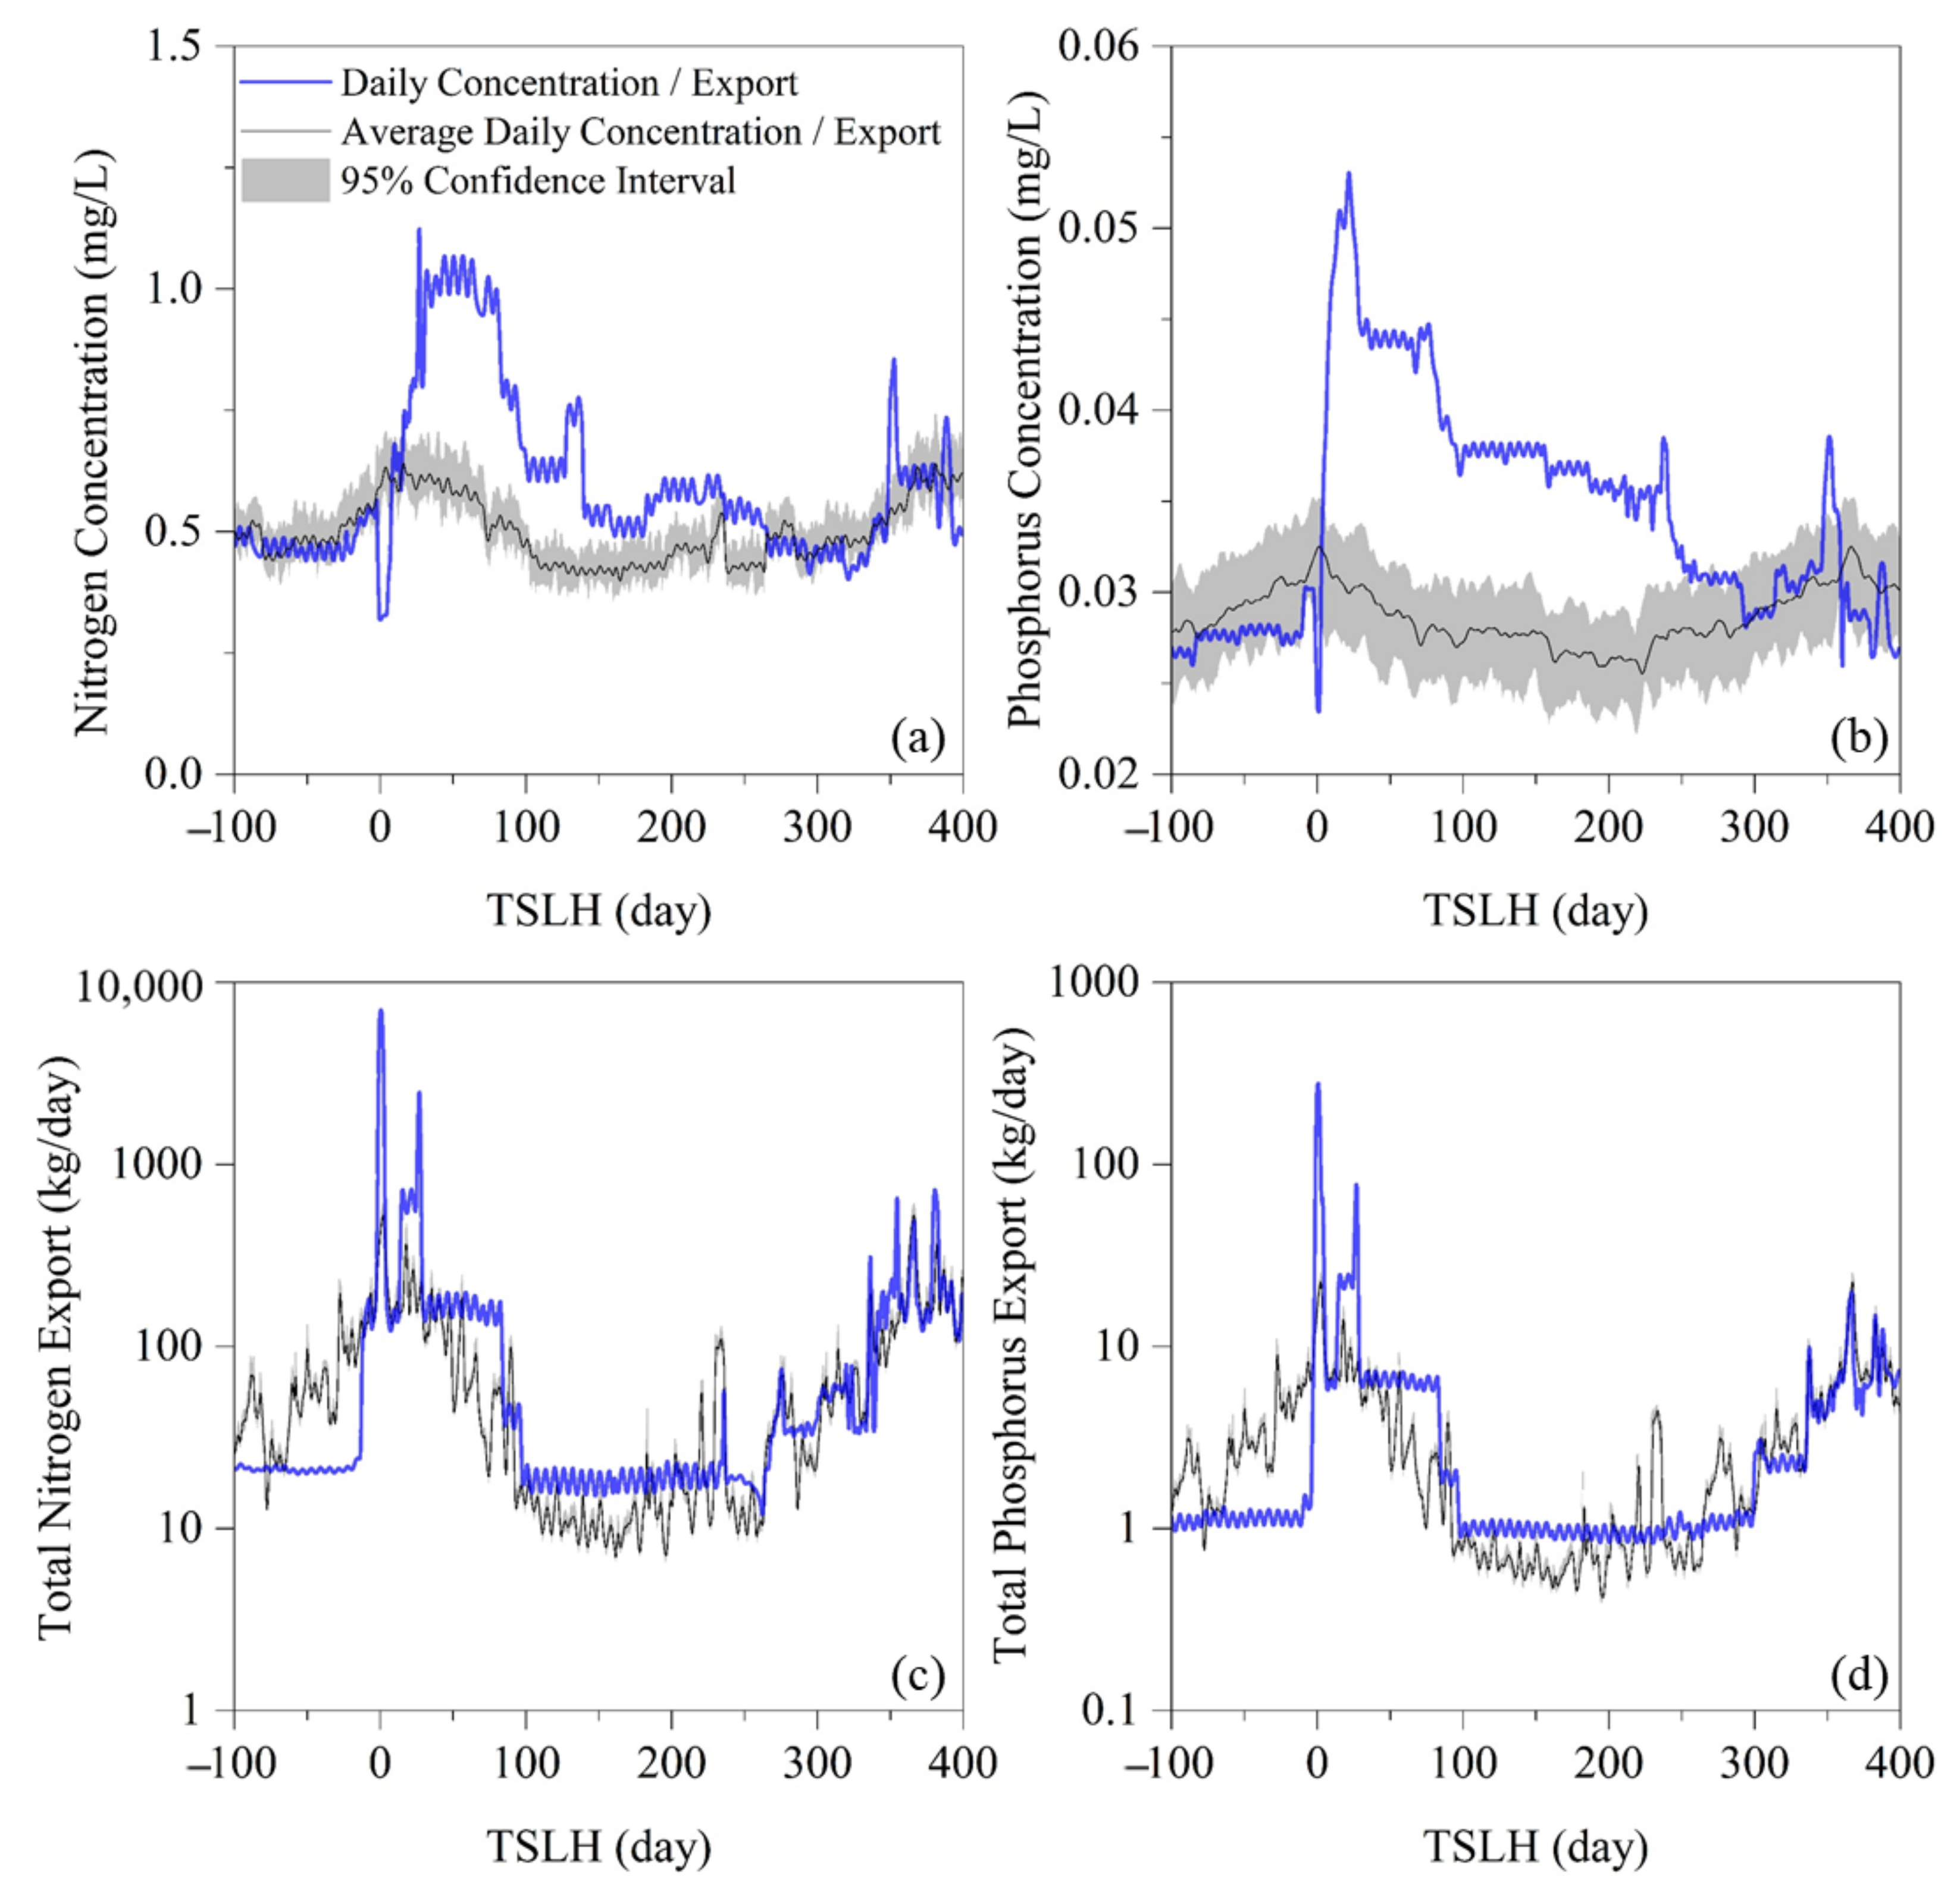
For a watershed, to examine the instant hurricane effects, we compared the total nitrogen or phosphorous export during the hurricane period with the long-term average export in the same period (Figure 5c,d). To determine the length required for the post-hurricane riverine nitrogen or phosphorous concentration to recover to the pre-hurricane level, we initially calculated the long-term average daily nitrogen or phosphorous concentration, which was the average concentration calculated from the estimate in a given day of every year in the analyzed period. Then, we compared their post-hurricane time series with the long-term average daily estimates (Figure 5a,b). Finally, we used the stable status decision method moving average mean stable decision method [32,33] to measure the length of recovery period for nitrogen or phosphorous concentration. The length of recovery period was the period from the end day of the hurricane to when the moving average concentration of 30-day (~ one month): (1) was below the higher boundary and above the lower boundary of the 95% confidence interval of the long-term average level of daily concentration, and (2) was lower than the higher threshold and higher than the lower threshold in the subsequent 30 days (~ one month) (Figure 5a,b).

Figure 5.
An example of the pre-, during, and post-hurricane (Otto) riverine nitrogen (a) and phosphorous (b) concentrations in Ponce watershed as well as total nitrogen (c) and phosphorus (d) exports. (TSLH is the time since the last hurricane).
3. Results
3.1. Estimated Nitrogen and Phosphorous Exports
The average daily pre-hurricane riverine nitrogen concentrations recorded by the USGS of the seven watersheds was 0.67 ± 0.35 mg/L, which was similar to the estimated average daily concentration (0.67 ± 0.36 mg/L) (Table 2). The recorded nitrogen concentration had a minimum of 0.27 ± 0.32 mg/L in the Patillas and a maximum of 1.11 ± 0.31 mg/L in the Utuado. The estimated nitrogen concentrations of the same two watersheds ranged from 0.26 ± 0.22 mg/L to 1.11 ± 0.31 mg/L. The mean absolute difference (AD, see Section 2.3) of nitrogen concentration across these seven watersheds was 9 ± 4%.
Table 2.
A summary of the recorded and estimated nitrogen and phosphorous concentrations as well as statistical indexes (N = nitrogen, P = phosphorus, AD = absolute difference (see Section 2.3)).
The recorded phosphorous concentrations ranged from 0.021 ± 0.002 mg/L in the Rio Grande to 0.062 ± 0.033 mg/L in Anasco. The estimated phosphorous concentrations of the same two watersheds ranged from 0.019 ± 0.007 mg/L to 0.061 ± 0.022 mg/L. The average daily riverine phosphorous concentration recorded by the USGS of the seven watersheds was 0.032 ± 0.013 mg/L, which was similar to the estimate (0.032 ± 0.016 mg/L) (Table 2). The mean AD of phosphorous concentration across these seven watersheds was 10 ± 4%. Therefore, comparisons of the riverine nitrogen and phosphorous concentration estimates using the improved WRTDS-hurricane model had good agreement with the USGS records.
The recorded nitrogen export from the watershed was ranged from 0.99 kg N/km2/day (Ponce) to 5.57 kg N/km2/day (Anasco) with a mean of 2.82 kg N/km2/day, which was similar to the model estimated 2.69 kg N/km2/day. The recorded phosphorous export had a minimum of 0.05 kg P/km2/day from Ponce watershed and a maximum of 0.33 kg P/km2/day from Anasco watershed. The mean of recorded phosphorous export from these seven watersheds was 0.16 kg P/km2/day, which was similar to the estimated 0.15 kg P/km2/day.
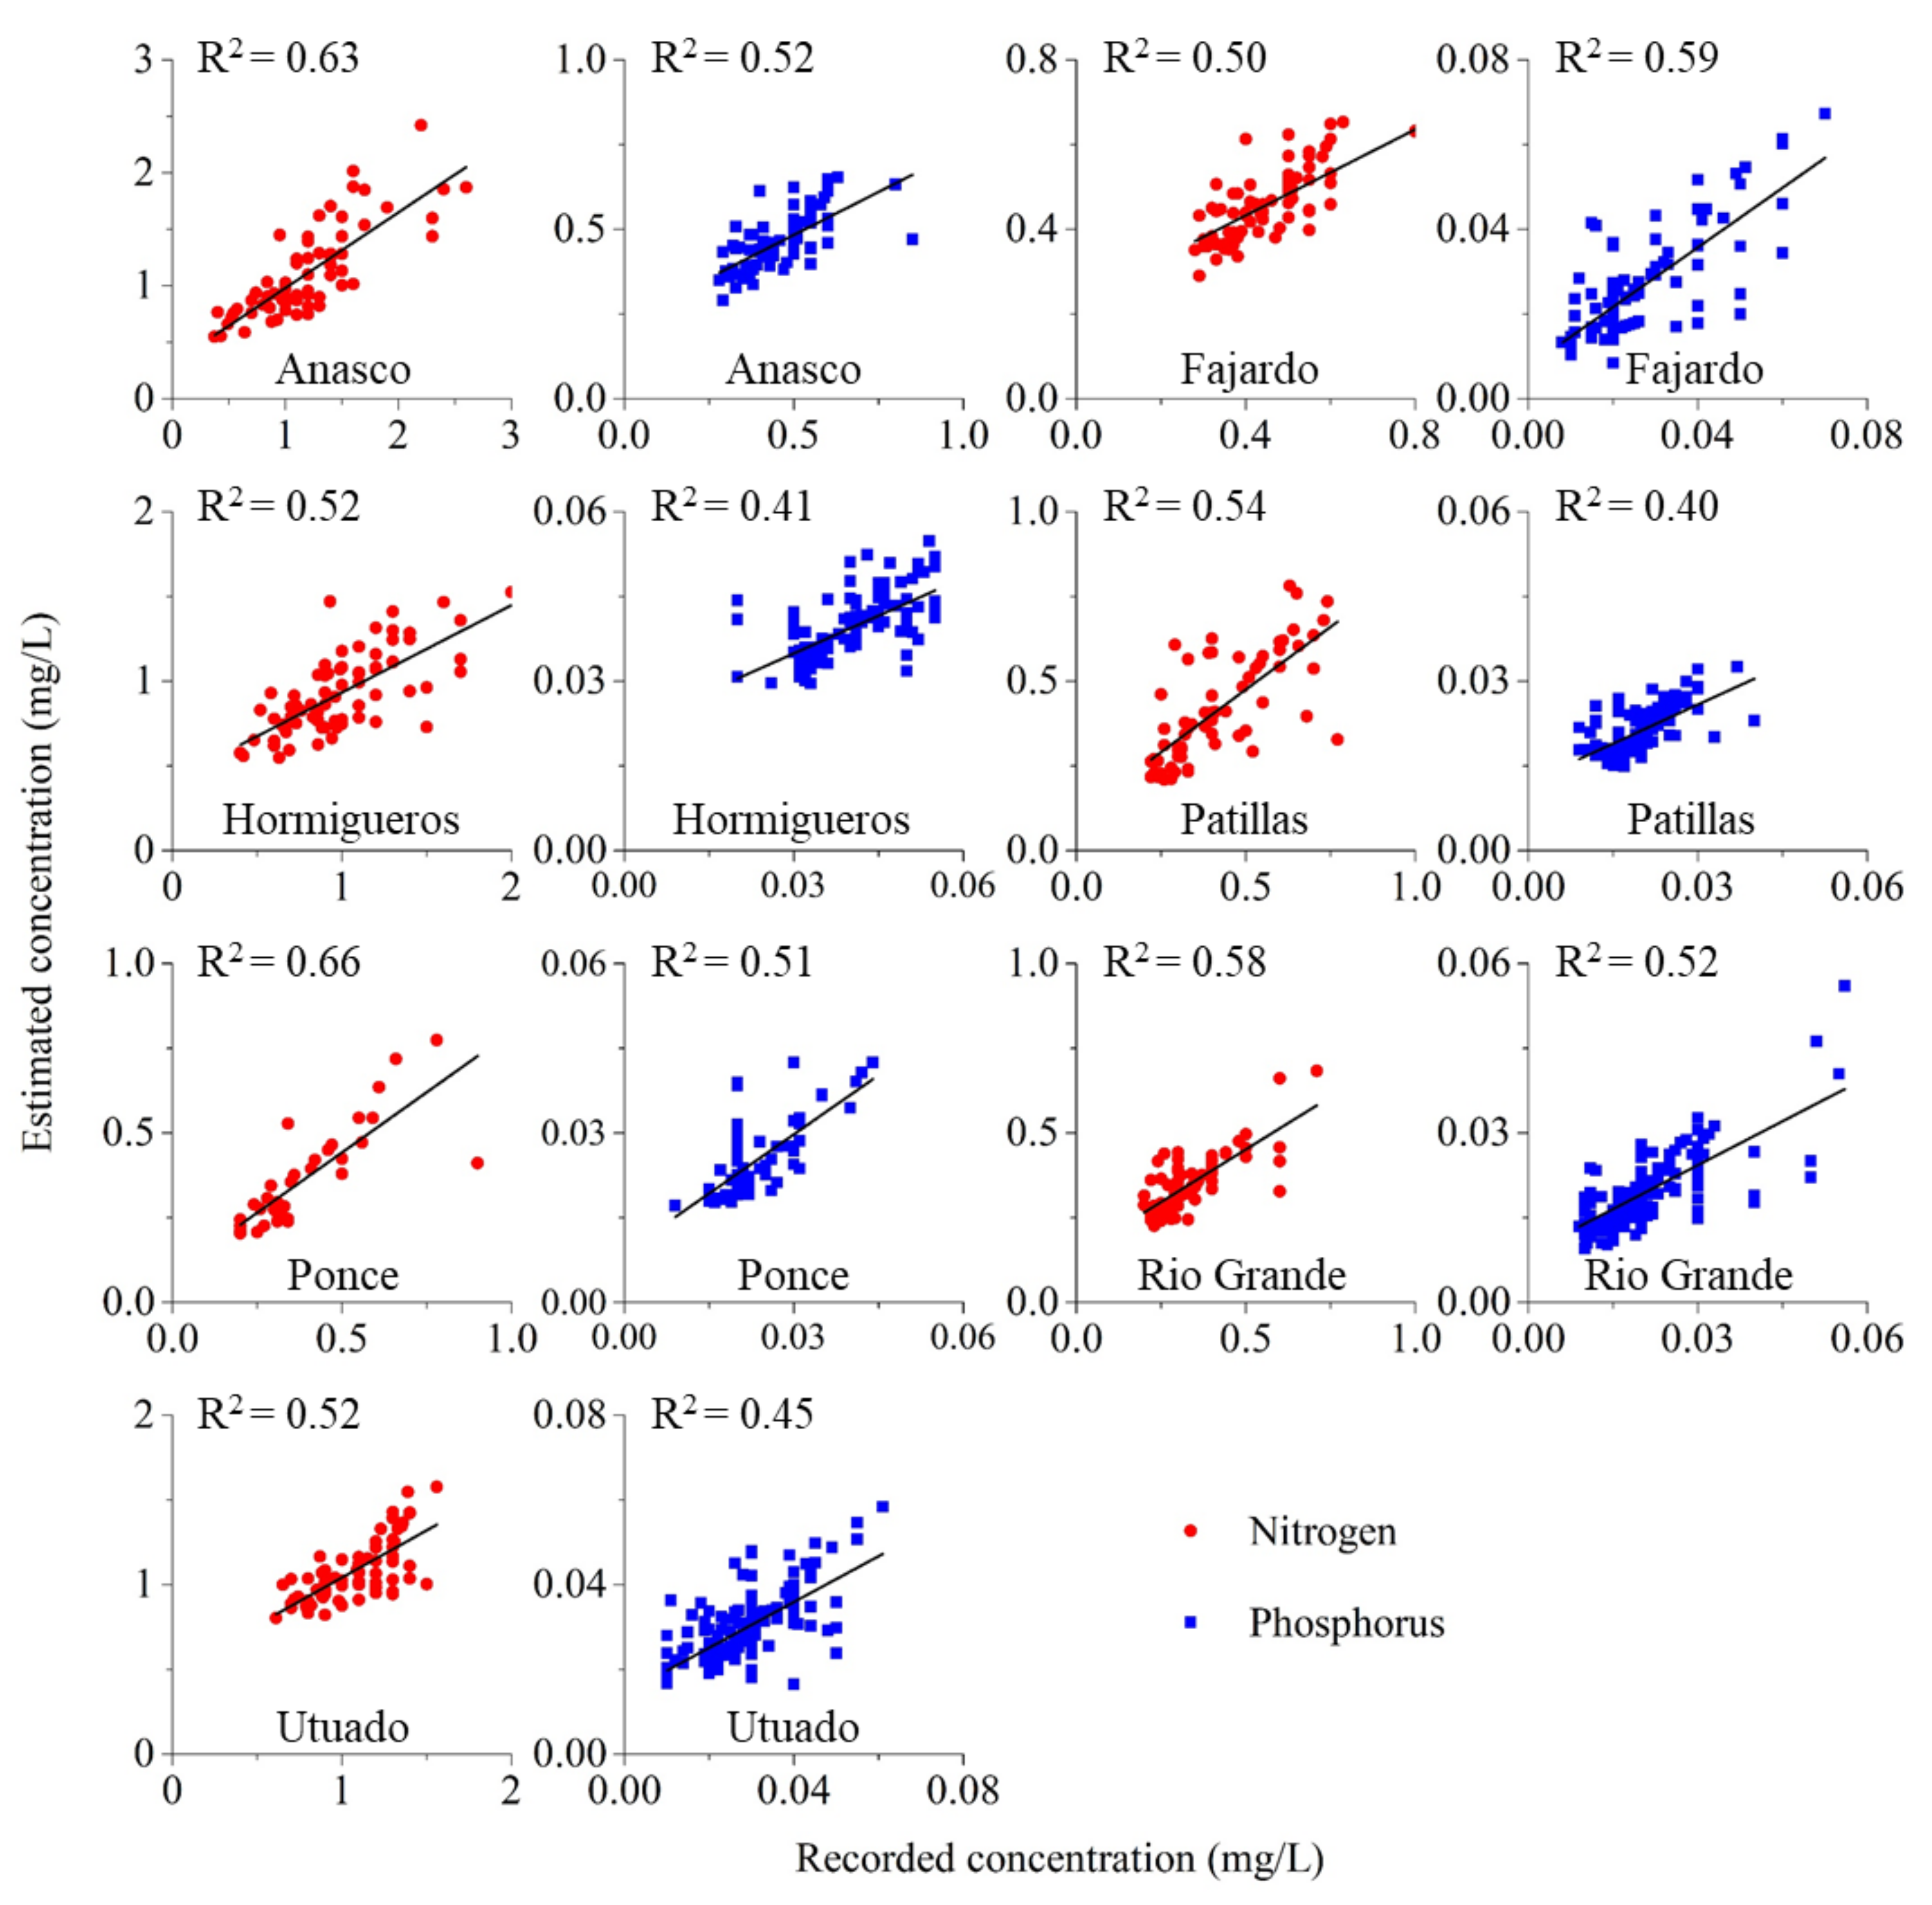
The R2 between estimated nitrogen concentrations and records of these seven watersheds had a minimum value of 0.50 (Fajardo) and a maximum value of 0.66 (Ponce) with a mean of 0.56 (Figure 6). The R2 between estimated phosphorous concentrations and records of these seven watersheds ranged from 0.40 (Patillas) to 0.59 (Fajard) with a mean of 0.56 (Figure 6). Therefore, the estimated nitrogen or phosphorous concentrations were similar to recorded measurements.

Figure 6.
The R2 between recorded measurements and estimates of the seven watersheds.
3.2. Hurricane Effects on Nitrogen and Phosphorus Exports
Compared with the long-term average, the immediate increase of nitrogen concentration during each hurricane ranged from 121 to 564 times and had a mean of 297 ± 113 in the seven watersheds (Table 3), while the immediate increase of phosphorous concentration had a minimum increase of 204 and maximum of 401 times with a mean of 306 ± 70. The summarized results suggest that daily riverine nitrogen concentrations required a period ranged from 301 to 509 days with a mean of 340 ± 79 days to recover to the pre-hurricane or long-term average level, while the time required for phosphorus concentration ranged from 201 to 466 days with a mean of 369 ± 77 days. The average daily nitrogen concentration increased 30 ± 6% (ranged from 20 to 39) and 28 ± 5% (ranged from 19 to 36) for phosphorus during the recovery period.
Table 3.
The immediate increase of total nitrogen and phosphorous exports during the hurricane (times), their recovery time period (days), and the average increase of their concentrations over the recovery period.
4. Discussion
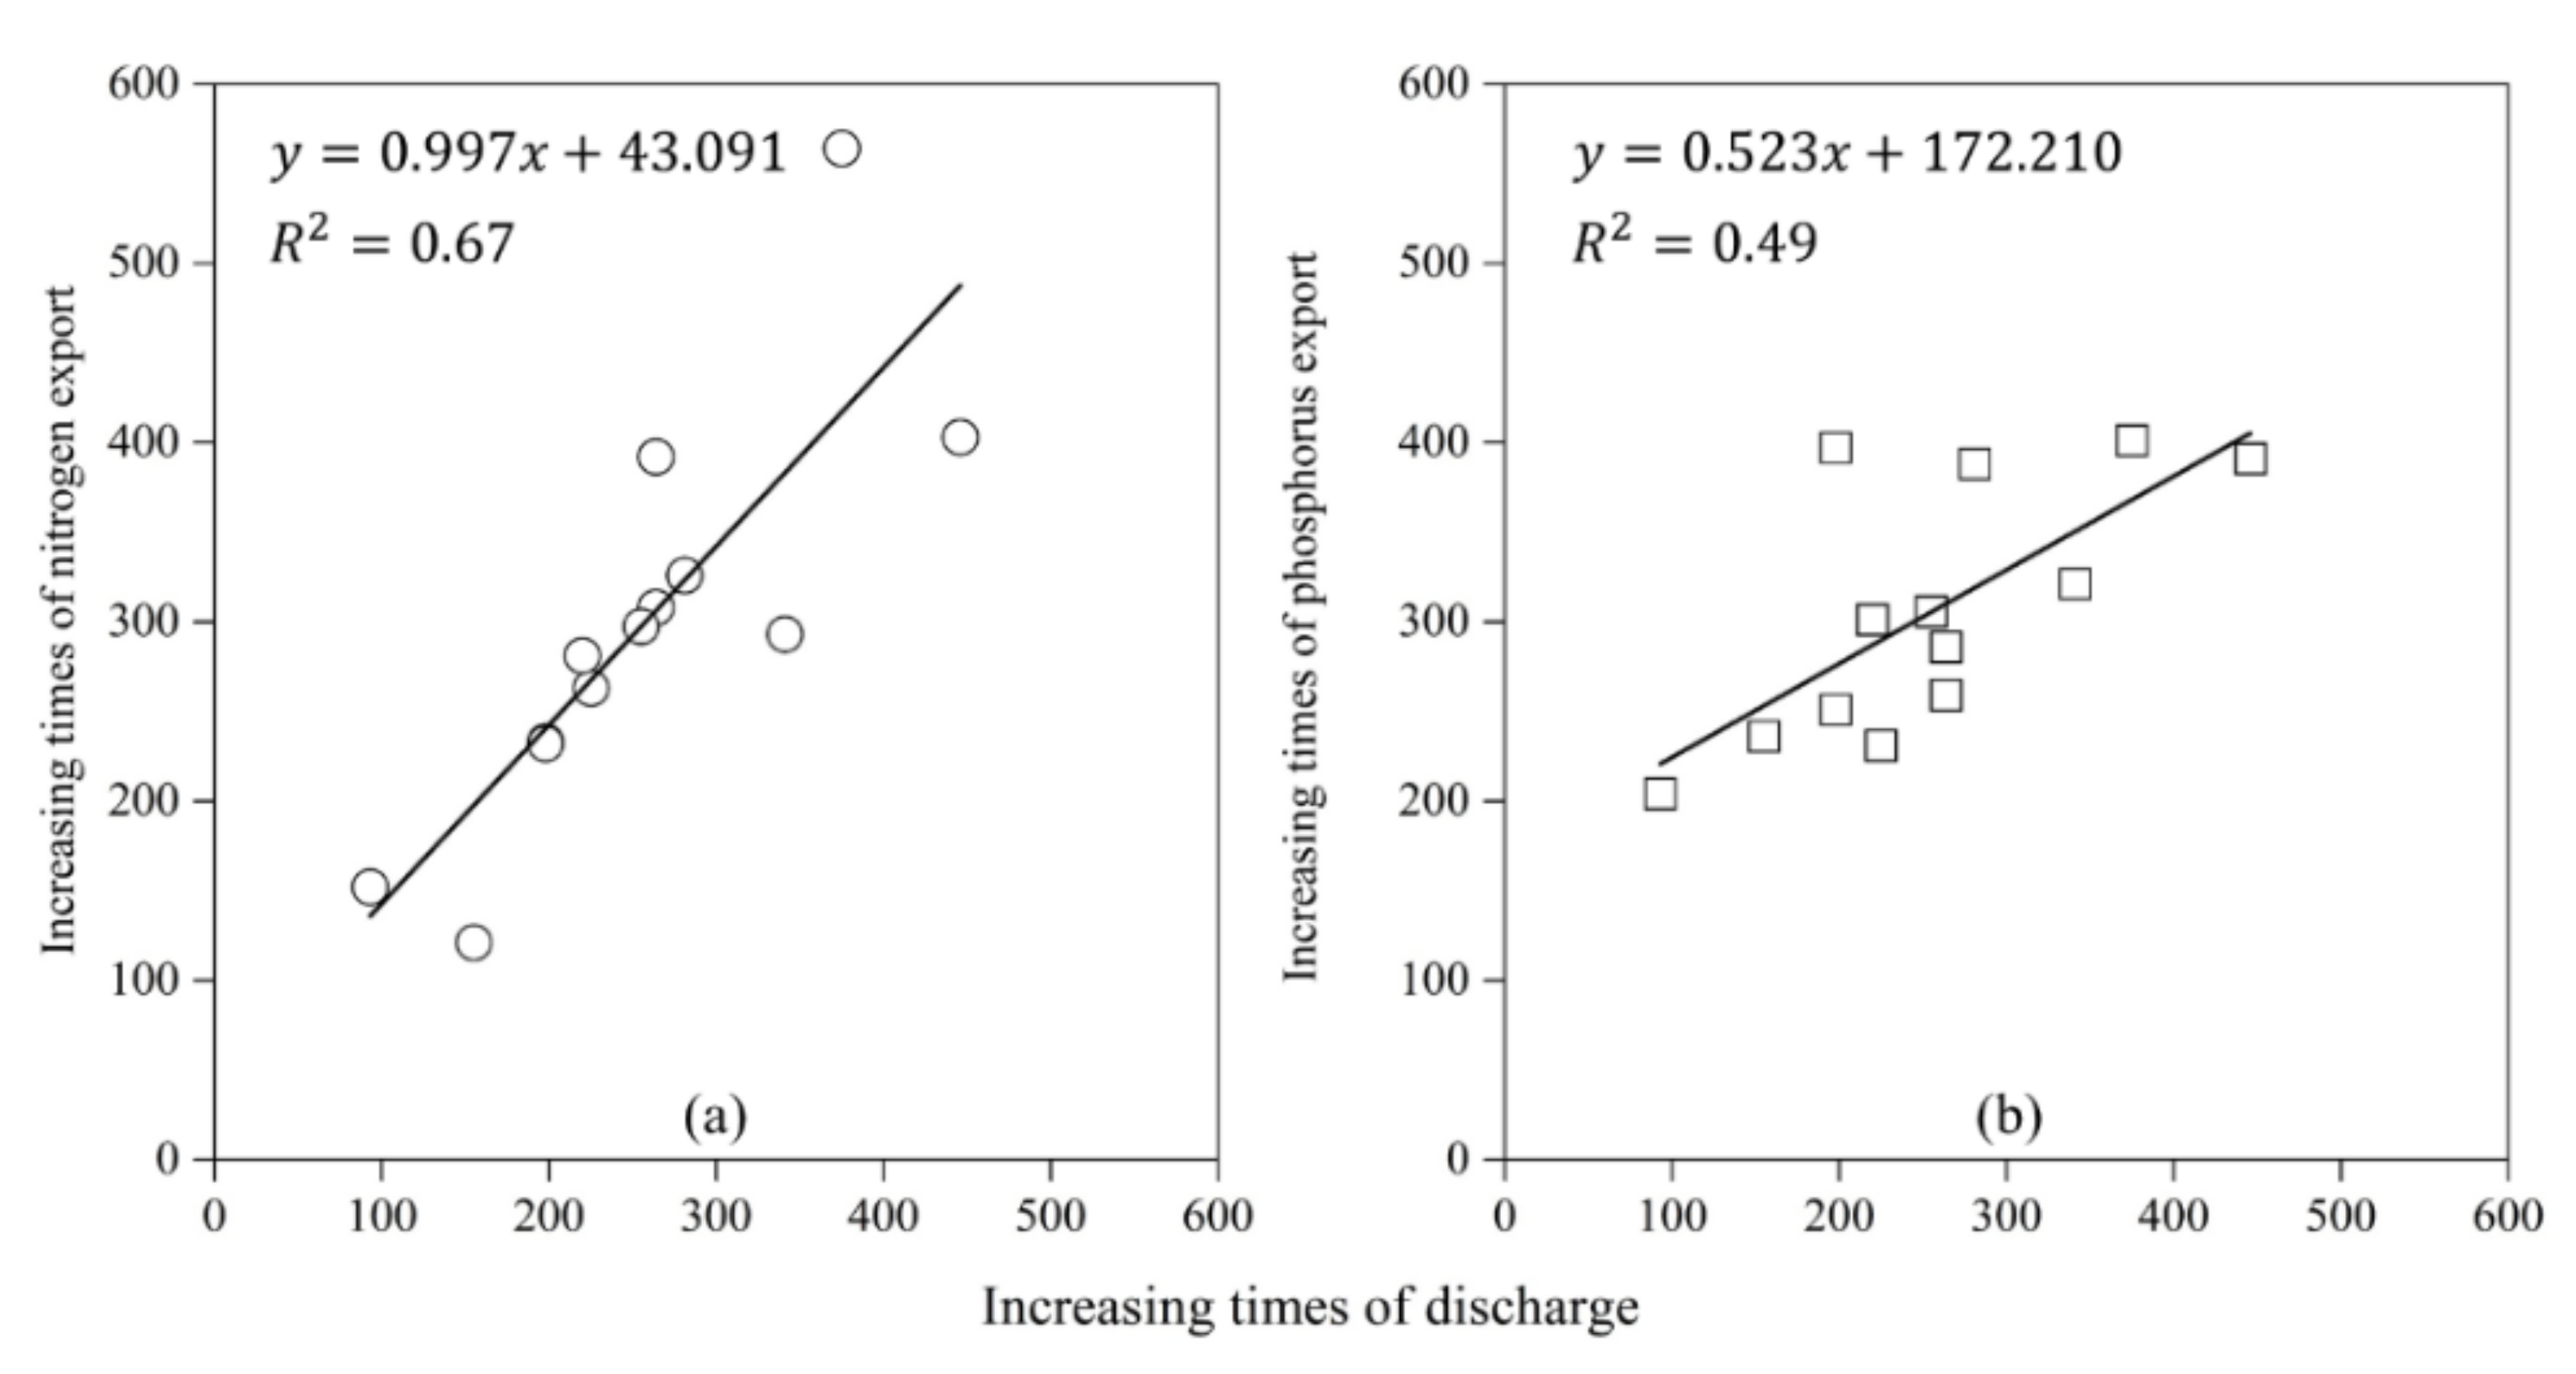
The results suggest that hurricanes can rapidly and significantly increase total riverine nitrogen and phosphorous exports as much as 297 ± 113 and 306 ± 70 times, respectively. This is because of the substantial surface runoff caused by the heavy precipitation, which directly moves a large amount of nitrogen and phosphorus from soils to inland waters, and finally delivers them out of the watershed [34]. In addition, there is a strong relationship between the increasing times of discharge (compared with the long-term average during the same period) and increasing times of nitrogen export (Figure 7a) as well as phosphorus export (Figure 7b). Chen, et al. [35] also suggested that the increase of total phosphorous export from a watershed is positively correlated with the discharge.

Figure 7.
The relationships between increasing times of discharge (compared with the long-term average during the same period) and increasing times of nitrogen export (a) as well as phosphorus export (b).
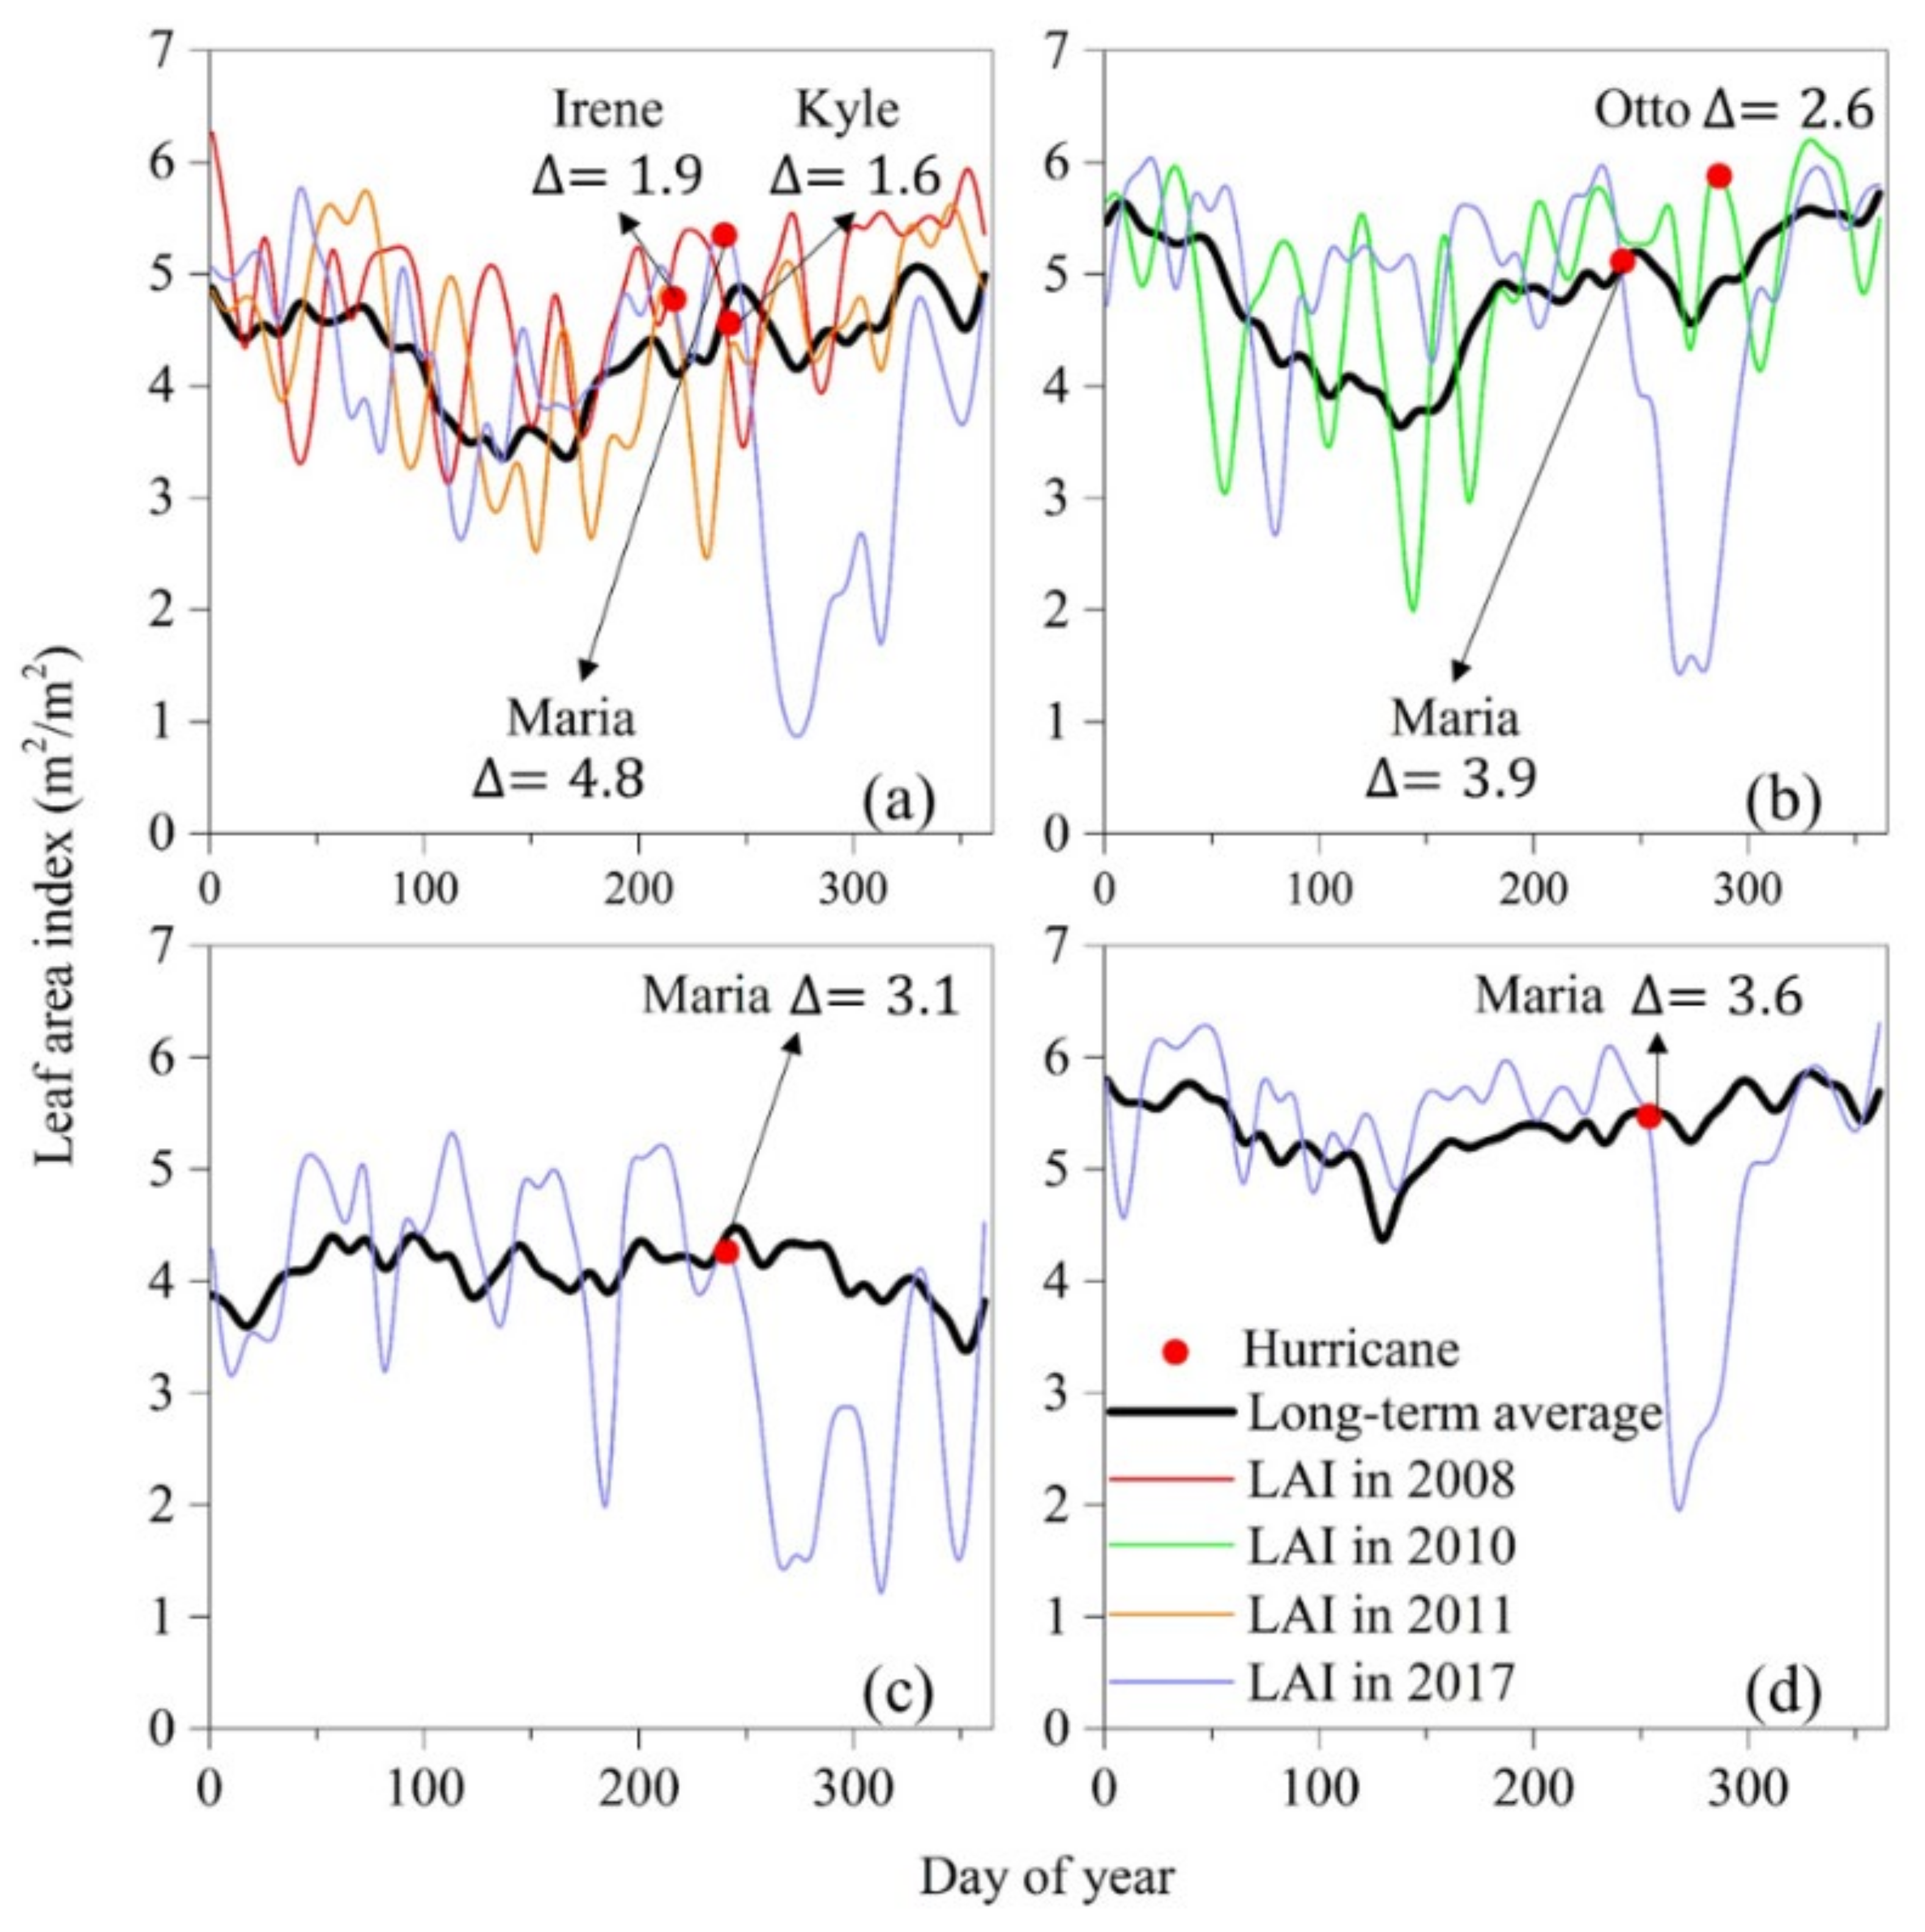
Our results suggest that the riverine nitrogen and phosphorous concentrations increase and persist over a period of 340 ± 79 and 369 ± 77 days, respectively. This is because hurricanes can significantly cause soil nitrogen and phosphorous loss. First, defoliation substantially increases the input of leaves and branches to the forest floor (Figure 8), which can rapidly release nitrogen and phosphorus during decomposition [36,37]. Second, the high mortality rate caused by hurricane disturbance can temporarily reduce the uptake of nutrients by trees as vegetation regrows [38]. Therefore, there are more nitrogen and phosphorous in the soil. With the reduction of readily leachable nitrogen and phosphorous as well as the increasing uptake of nutrients by vegetation, the reduction of soil nitrogen and phosphorus will result in decreasing of riverine nitrogen and phosphorous concentrations to pre-hurricane levels. McDowell, et al. [39] conclude that the nitrate concentration in a stream is elevated for about 18 months after the hurricane. McDowell and Liptzin [38] report that a large pulse of nitrate concentration in stream water can last approximately 18 months after the hurricane. Our results are shorter than their estimated period, which can be attributed to the intensity of hurricanes and land cover types [38,40]. During the recovery period, compared with the long-term average, our results suggest that the total nitrogen and phosphorous concentrations are increased 30 ± 6% and 28 ± 5%, respectively. Schaefer et al. [24] concluded that the nitrate concentration in the post-hurricane year was 34% higher than pre-hurricane, which is similar to our results.

Figure 8.
The pre-. during-, and post- hurricane leaf area index (LAI) of the four watersheds: Patillas (a), Ponce (b), Rio Grande (c), and Utuado (d) as well as the long-term average 8-day LAI and the decrease of post-hurricane LAI ().
Another important input of nitrogen and phosphorus to tropical forest ecosystems is atmospheric deposition [41], which potentially increases the soil nitrogen and phosphorus [42]. However, the long-term records of nitrogen and phosphorus depositions provided by National Atmospheric Deposition Program [43] suggest there is no obvious increase of nitrogen and phosphorus depositions across the period of 1985–2019 in Puerto Rico. Thus, the changes of riverine nitrogen and phosphorus concentrations are not the result of depositions. In inland waters within a watershed, a portion of the nitrogen and phosphorous can be buried as sediment, but the remaining will be delivered out of the watershed [44,45]. Because the extent of water bodies in these seven watersheds are less than 1% (Figure 1), the biogeochemical processes related to nitrogen and phosphorous transportation in aquatic systems can be ignored in this study. In addition, McDowell and Liptzin [38] suggested that forest canopy and forest floor processes greatly affect the response of the stream nitrogen and phosphorus concentrations to hurricanes rather than in-stream processes. Forest ecosystems are different in the ability of nitrogen fixation and densities of nitrogen and phosphorous, therefore forest ecosystems are different in their contents of nitrogen and phosphorous, which can affect the nitrogen and phosphorous exports. In this study, the tree species data is not available, which limits further analysis of the tree species influence.
5. Conclusions
Overall, hurricanes immediately accelerate the lateral nitrogen and phosphorus exports and increase their concentrations over a post-hurricane period. To better manage the forest and characterize the dynamics of soil nutrients in a tropical forested watershed, the hurricane effects on the lateral exports of nutrients should be considered. In addition, we estimate that the riverine nitrogen and phosphorus concentrations require approximately a year to recover to pre-hurricane levels.
Author Contributions
J.S. and X.W. contributed equally to this paper. Conceptualization, J.S. and X.W.; methodology, J.S., X.W. and Y.Z.; formal analysis, J.S. and X.W.; data curation, J.S. and X.W.; writing—original draft preparation, J.S. and X.W.; writing—review and editing, J.S., X.W., Y.Z., C.C. and J.D.; supervision, J.S.; project administration, J.S.; funding acquisition, J.S. All authors have read and agreed to the published version of the manuscript.
Funding
This research was funded by the National Natural Science Foundation of China (NO. 42007051).
Institutional Review Board Statement
Not applicable.
Informed Consent Statement
Not applicable.
Data Availability Statement
The WRTDS-hurricane model can be accessed in GitHub (https://github.com/xinyuanwylb19/WRTDS-Hurricane.git, accessed on 25 July 2021).
Acknowledgments
We thank the National Natural Science Foundation of China for helping with publication costs.
Conflicts of Interest
The authors declare no conflict of interest.
Appendix A

Figure A1.
The relationship between recorded discharges and nitrogen (a) or phosphorus (b) concentration in the watershed Anasco.
Figure A1.
The relationship between recorded discharges and nitrogen (a) or phosphorus (b) concentration in the watershed Anasco.
References
- Templer, P.H.; Silver, W.L.; Pett-Ridge, J.; DeAngelis, K.M.; Firestone, M.K. Plant and microbial controls on nitrogen retention and loss in a humid tropical forest. Ecology 2008, 89, 3030–3040. [Google Scholar] [CrossRef] [Green Version]
- Cusack, D.F.; Silver, W.; McDowell, W.H. Biological nitrogen fixation in two tropical forests: Ecosystem-level patterns and effects of nitrogen fertilization. Ecosystems 2009, 12, 1299–1315. [Google Scholar] [CrossRef] [Green Version]
- Cusack, D.F.; Silver, W.L.; Torn, M.S.; McDowell, W.H. Effects of nitrogen additions on above-and belowground carbon dynamics in two tropical forests. Biogeochemistry 2011, 104, 203–225. [Google Scholar] [CrossRef] [Green Version]
- Wardle, D.A.; Walker, L.R.; Bardgett, R.D. Ecosystem properties and forest decline in contrasting long-term chronosequences. Science 2004, 305, 509–513. [Google Scholar] [CrossRef] [Green Version]
- Pett-Ridge, J.C. Contributions of dust to phosphorus cycling in tropical forests of the Luquillo Mountains, Puerto Rico. Biogeochemistry 2009, 94, 63–80. [Google Scholar] [CrossRef]
- Kroeze, C.; Bouwman, L.; Seitzinger, S. Modeling global nutrient export from watersheds. Curr. Opin. Environ. Sustain. 2012, 4, 195–202. [Google Scholar] [CrossRef]
- Seitzinger, S.P.; Harrison, J.A.; Dumont, E.; Beusen, A.H.; Bouwman, A. Sources and delivery of carbon, nitrogen, and phosphorus to the coastal zone: An overview of Global Nutrient Export from Watersheds (NEWS) models and their application. Glob. Biogeochem. Cycles 2005, 19, GB4S01. [Google Scholar] [CrossRef]
- Nakayama, T. Development of an advanced eco-hydrologic and biogeochemical coupling model aimed at clarifying the missing role of inland water in the global biogeochemical cycle. J. Geophys. Res. Biogeosci. 2017, 122, 966–988. [Google Scholar] [CrossRef]
- Sigua, G.C.; Tweedale, W.A. Watershed scale assessment of nitrogen and phosphorus loadings in the Indian River Lagoon basin, Florida. J. Environ. Manag. 2003, 67, 363–372. [Google Scholar] [CrossRef]
- Lovett, G.M.; Weathers, K.C.; Arthur, M.A. Control of nitrogen loss from forested watersheds by soil carbon: Nitrogen ratio andtree species composition. Ecosystems 2002, 5, 0712–0718. [Google Scholar] [CrossRef]
- Heartsill Scalley, T.; Scatena, F.N.; Lugo, A.E.; Moya, S.; Estrada Ruiz, C.R. Changes in structure, composition, and nutrients during 15 yr of hurricane-induced succession in a subtropical wet forest in Puerto Rico. Biotropica 2010, 42, 455–463. [Google Scholar] [CrossRef]
- Scholl, M.A.; Bassiouni, M.; Torres-Sánchez, A.J. Drought stress and hurricane defoliation influence mountain clouds and moisture recycling in a tropical forest. Proc. Natl. Acad. Sci. USA 2021, 118, e2021646118. [Google Scholar] [CrossRef]
- Santos, R.; Fernandes, L.S.; Pereira, M.; Cortes, R.; Pacheco, F. A framework model for investigating the export of phosphorus to surface waters in forested watersheds: Implications to management. Sci. Total Environ. 2015, 536, 295–305. [Google Scholar] [CrossRef]
- Chen, S.; Lu, Y.; Dash, P.; Das, P.; Li, J.; Capps, K.; Majidzadeh, H.; Elliott, M. Hurricane pulses: Small watershed exports of dissolved nutrients and organic matter during large storms in the Southeastern USA. Sci. Total Environ. 2019, 689, 232–244. [Google Scholar] [CrossRef]
- Silver, W.L.; Scatena, F.N.; Johnson, A.H.; Siccama, T.G.; Watt, F. At what temporal scales does disturbance affect belowground nutrient pools? Biotropica 1996, 118, 441–457. [Google Scholar] [CrossRef]
- Jaramillo, V.J.; Martínez-Yrízar, A.; Maass, M.; Nava-Mendoza, M.; Castañeda-Gómez, L.; Ahedo-Hernández, R.; Araiza, S.; Verduzco, A. Hurricane impact on biogeochemical processes in a tropical dry forest in western Mexico. For. Ecol. Manag. 2018, 426, 72–80. [Google Scholar] [CrossRef]
- Powers, J.S.; Montgomery, R.A.; Adair, E.C.; Brearley, F.Q.; DeWalt, S.J.; Castanho, C.T.; Chave, J.; Deinert, E.; Ganzhorn, J.U.; Gilbert, M.E. Decomposition in tropical forests: A pan-tropical study of the effects of litter type, litter placement and mesofaunal exclusion across a precipitation gradient. J. Ecol. 2009, 97, 801–811. [Google Scholar] [CrossRef] [Green Version]
- Fellman, J.B.; Hood, E.; D’Amore, D.V.; Edwards, R.T. Streamflow variability controls N and P export and speciation from Alaskan coastal temperate rainforest watersheds. Biogeochemistry 2021, 152, 253–270. [Google Scholar] [CrossRef]
- García-Palacios, P.; Shaw, E.A.; Wall, D.H.; Hättenschwiler, S. Temporal dynamics of biotic and abiotic drivers of litter decomposition. Ecol. Lett. 2016, 19, 554–563. [Google Scholar] [CrossRef]
- de Wit, H.A.; Lepistö, A.; Marttila, H.; Wenng, H.; Bechmann, M.; Blicher-Mathiesen, G.; Eklöf, K.; Futter, M.; Kortelainen, P.; Kronvang, B. Land-use dominates climate controls on nitrogen and phosphorus export from managed and natural Nordic headwater catchments. Hydrol. Process. 2020, 34, 4831–4850. [Google Scholar] [CrossRef]
- Bonan, G.B. Forests and climate change: Forcings, feedbacks, and the climate benefits of forests. Science 2008, 320, 1444–1449. [Google Scholar] [CrossRef] [Green Version]
- Knutson, T.; Camargo, S.J.; Chan, J.C.; Emanuel, K.; Ho, C.-H.; Kossin, J.; Mohapatra, M.; Satoh, M.; Sugi, M.; Walsh, K. Tropical cyclones and climate change assessment: Part II: Projected response to anthropogenic warming. Bull. Am. Meteorol. Soc. 2020, 101, E303–E322. [Google Scholar] [CrossRef]
- Paerl, H.W.; Crosswell, J.R.; Van Dam, B.; Hall, N.S.; Rossignol, K.L.; Osburn, C.L.; Hounshell, A.G.; Sloup, R.S.; Harding, L.W. Two decades of tropical cyclone impacts on North Carolina’s estuarine carbon, nutrient and phytoplankton dynamics: Implications for biogeochemical cycling and water quality in a stormier world. Biogeochemistry 2018, 141, 307–332. [Google Scholar] [CrossRef]
- Schaefer, D.A.; McDowell, W.H.; Scatena, F.N.; Asbury, C.E. Effects of hurricane disturbance on stream water concentrations and fluxes in eight tropical forest watersheds of the Luquillo Experimental Forest, Puerto Rico. J. Trop. Ecol. 2000, 16, 189–207. [Google Scholar] [CrossRef] [Green Version]
- Yang, L.; Jin, S.; Danielson, P.; Homer, C.; Gass, L.; Bender, S.M.; Case, A.; Costello, C.; Dewitz, J.; Fry, J. A new generation of the United States National Land Cover Database: Requirements, research priorities, design, and implementation strategies. ISPRS J. Photogramm. Remote Sens. 2018, 146, 108–123. [Google Scholar] [CrossRef]
- Hirsch, R.M.; Moyer, D.L.; Archfield, S.A. Weighted regressions on time, discharge, and season (WRTDS), with an application to Chesapeake Bay river inputs 1. J. Am. Water Resour. Assoc. 2010, 46, 857–880. [Google Scholar] [CrossRef]
- Wei, X.; Hayes, D.J.; Fernandez, I.; Zhao, J.; Fraver, S.; Chan, C.; Diao, J. Identifying key environmental factors explaining temporal patterns of DOC export from watersheds in the conterminous United States. J. Geophys. Res. Biogeosci. 2021, 126, e2020JG005813. [Google Scholar] [CrossRef]
- Stets, E.G.; Sprague, L.A.; Oelsner, G.P.; Johnson, H.M.; Murphy, J.C.; Ryberg, K.; Vecchia, A.V.; Zuellig, R.E.; Falcone, J.A.; Riskin, M.L. Landscape drivers of dynamic change in water quality of US rivers. Environ. Sci. Technol. 2020, 54, 4336–4343. [Google Scholar] [CrossRef]
- Newcomer, M.E.; Bouskill, N.J.; Wainwright, H.; Maavara, T.; Arora, B.; Siirila-Woodburn, E.R.; Dwivedi, D.; Williams, K.H.; Steefel, C.; Hubbard, S.S. Hysteresis patterns of watershed nitrogen retention and loss over the past 50 years in United States hydrological basins. Glob. Biogeochem. Cycles 2021, 35, e2020GB006777. [Google Scholar] [CrossRef]
- Wei, X.; Hayes, D.J.; Fernandez, I.; Fraver, S.; Zhao, J.; Weiskittel, A. Climate and atmospheric deposition drive the inter-annual variability and long-term trend of dissolved organic carbon flux in the conterminous United States. Sci. Total Environ. 2021, 771, 145448. [Google Scholar] [CrossRef]
- Wei, X.; Larsen, C.P. Methods to Detect Edge Effected Reductions in Fire Frequency in Simulated Forest Landscapes. ISPRS Int. J. Geo-Inf. 2019, 8, 277. [Google Scholar] [CrossRef] [Green Version]
- Wei, X.; Hayes, D.J.; Fernandez, I. Fire reduces riverine DOC concentration draining a watershed and alters post-fire DOC recovery patterns. Environ. Res. Lett. 2021, 16, 024022. [Google Scholar] [CrossRef]
- Wei, X.; Larsen, C. Assessing the Minimum Number of Time Since Last Fire Sample-Points Required to Estimate the Fire Cycle: Influences of Fire Rotation Length and Study Area Scale. Forests 2018, 9, 708. [Google Scholar] [CrossRef] [Green Version]
- Lugo, A.E. Visible and invisible effects of hurricanes on forest ecosystems: An international review. Austral Ecol. 2008, 33, 368–398. [Google Scholar] [CrossRef]
- Chen, N.; Wu, Y.; Chen, Z.; Hong, H. Phosphorus export during storm events from a human perturbed watershed, southeast China: Implications for coastal ecology. Estuar. Coast. Shelf Sci. 2015, 166, 178–188. [Google Scholar] [CrossRef]
- Montano, N.M.; Sandoval-Pérez, A.L.; García-Oliva, F.; Larsen, J.; Gavito, M.E. Microbial activity in contrasting conditions of soil C and N availability in a tropical dry forest. J. Trop. Ecol. 2009, 25, 401–413. [Google Scholar] [CrossRef]
- Lodge, D.J.; Scatena, F.N.; Asbury, C.; Sanchez, M. Fine litterfall and related nutrient inputs resulting from Hurricane Hugo in subtropical wet and lower montane rain forests of Puerto Rico. Biotropica 1991, 23, 336–342. [Google Scholar] [CrossRef]
- McDowell, W.H.; Liptzin, D. Linking soils and streams: Response of soil solution chemistry to simulated hurricane disturbance mirrors stream chemistry following a severe hurricane. For. Ecol. Manag. 2014, 332, 56–63. [Google Scholar] [CrossRef]
- McDowell, W.H.; Brereton, R.L.; Scatena, F.N.; Shanley, J.B.; Brokaw, N.V.; Lugo, A.E. Interactions between lithology and biology drive the long-term response of stream chemistry to major hurricanes in a tropical landscape. Biogeochemistry 2013, 116, 175–186. [Google Scholar] [CrossRef]
- Dijkstra, F.A.; Carrillo, Y.; Aspinwall, M.J.; Maier, C.; Canarini, A.; Tahaei, H.; Choat, B.; Tissue, D.T. Water, nitrogen and phosphorus use efficiencies of four tree species in response to variable water and nutrient supply. Plant Soil 2016, 406, 187–199. [Google Scholar] [CrossRef]
- Wang, R.; Goll, D.; Balkanski, Y.; Hauglustaine, D.; Boucher, O.; Ciais, P.; Janssens, I.; Penuelas, J.; Guenet, B.; Sardans, J. Global forest carbon uptake due to nitrogen and phosphorus deposition from 1850 to 2100. Glob. Chang. Biol. 2017, 23, 4854–4872. [Google Scholar] [CrossRef]
- Soderberg, K.; Compton, J.S. Dust as a nutrient source for fynbos ecosystems, South Africa. Ecosystems 2007, 10, 550–561. [Google Scholar] [CrossRef]
- NADP Program Office. Wisconsin State Laboratory of Hygiene; 465 Henry Mall; NADP Program Office: Madison, WI, USA, 2019. [Google Scholar]
- Dalu, T.; Wasserman, R.J.; Magoro, M.L.; Froneman, P.W.; Weyl, O.L. River nutrient water and sediment measurements inform on nutrient retention, with implications for eutrophication. Sci. Total Environ. 2019, 684, 296–302. [Google Scholar] [CrossRef]
- Elsey-Quirk, T.; Graham, S.A.; Mendelssohn, I.A.; Snedden, G.; Day, J.W.; Twilley, R.; Shaffer, G.; Sharp, L.; Pahl, J.; Lane, R. Mississippi river sediment diversions and coastal wetland sustainability: Synthesis of responses to freshwater, sediment, and nutrient inputs. Estuar. Coast. Shelf Sci. 2019, 221, 170–183. [Google Scholar] [CrossRef]
Publisher’s Note: MDPI stays neutral with regard to jurisdictional claims in published maps and institutional affiliations. |
© 2022 by the authors. Licensee MDPI, Basel, Switzerland. This article is an open access article distributed under the terms and conditions of the Creative Commons Attribution (CC BY) license (https://creativecommons.org/licenses/by/4.0/).