
Species Richness Promotes Productivity through Tree Crown Spatial Complementarity in a Species-Rich Natural Forest

 ,
,  , and
, and
Abstract
:1. Introduction
2. Materials and Methods
2.1. Study Area
2.2. Tree Architecture and Soil Properties Measurement
2.3. Quantification of Crown Spatial Complementarity
2.4. Characterizations of Variation in Tree Height, Crown Size and Crown Shape
2.5. Calculation of Species Richness, Functional Diversity and Forest Productivity
2.6. Statistical Analysis
3. Results
4. Discussion and Conclusions
Supplementary Materials
Author Contributions
Funding
Data Availability Statement
Acknowledgments
Conflicts of Interest
References
- Loreau, M. Linking biodiversity and ecosystems: Towards a unifying ecological theory. Philos. Trans. R. Soc. B Biol. Sci. 2010, 365, 49–60. [Google Scholar] [CrossRef] [PubMed]
- Fichtner, A.; Härdtle, W.; Bruelheide, H.; Kunz, M.; Li, Y.; Von Oheimb, G. Neighbourhood interactions drive overyielding in mixed-species tree communities. Nat. Commun. 2018, 9, 1144. [Google Scholar] [CrossRef] [PubMed]
- Sapijanskas, J.; Paquette, A.; Potvin, C.; Kunert, N.; Loreau, M. Tropical tree diversity enhances light capture through crown plasticity and spatial and temporal niche differences. Ecology 2014, 95, 2479–2492. [Google Scholar] [CrossRef]
- Ammer, C. Diversity and forest productivity in a changing climate. New Phytol. 2019, 221, 50–66. [Google Scholar] [CrossRef] [PubMed]
- Chen, H.Y.; Klinka, K. Aboveground productivity of western hemlock and western redcedar mixed-species stands in southern coastal British Columbia. For. Ecol. Manag. 2003, 184, 55–64. [Google Scholar] [CrossRef]
- Jiang, L.; Wan, S.; Li, L. Species diversity and productivity: Why do results of diversity-manipulation experiments differ from natural patterns? J. Ecol. 2009, 97, 603–608. [Google Scholar] [CrossRef]
- Jacob, M.; Leuschner, C.; Thomas, F.M. Productivity of temperate broad-leaved forest stands differing in tree species diversity. Ann. For. Sci. 2010, 67, 503. [Google Scholar] [CrossRef]
- Zhang, Y.; Chen, H.Y.; Reich, P.B. Forest productivity increases with evenness, species richness and trait variation: A global meta-analysis. J. Ecol. 2012, 100, 742–749. [Google Scholar] [CrossRef]
- Sullivan, M.J.P.; Talbot, J.; Lewis, S.L.; Phillips, O.; Qie, L.; Begne, S.K.; Chave, J.; Cuni-Sanchez, A.; Hubau, W.; Lopez-Gonzalez, G.; et al. Diversity and carbon storage across the tropical forest biome. Sci. Rep. 2017, 7, 39102. [Google Scholar] [CrossRef]
- Cotta, H. Anweisung zum Waldbau; Arnoldische Buchhandlung: Dresden, Germany, 1828. [Google Scholar]
- Dănescu, A.; Albrecht, A.T.; Bauhus, J. Structural diversity promotes productivity of mixed, uneven-aged forests in southwestern Germany. Oecologia 2016, 182, 319–333. [Google Scholar] [CrossRef]
- Taubert, F.; Jahn, M.; Dobner, H.; Wiegand, T.; Huth, A. The structure of tropical forests and sphere packings. Proc. Natl. Acad. Sci. USA 2015, 112, 15125–15129. [Google Scholar] [CrossRef] [PubMed]
- Williams, L.J.; Paquette, A.; Cavenderbares, J.; Messier, C.; Reich, P.B. Spatial complementarity in tree crowns explains overyielding in species mixtures. Nat. Ecol. Evol. 2017, 1, 0063. [Google Scholar] [CrossRef] [PubMed]
- Zhang, Y.; Chen, H.Y. Individual size inequality links forest diversity and above-ground biomass. J. Ecol. 2015, 103, 1245–1252. [Google Scholar] [CrossRef]
- Fahey, R.T.; Fotis, A.T.; Woods, K.D. Quantifying canopy complexity and effects on productivity and resilience in late-successional hemlock-hardwood forests. Ecol. Appl. 2015, 25, 834–847. [Google Scholar] [CrossRef]
- Ali, A.; Lin, S.L.; He, J.K.; Kong, F.M.; Yu, J.H.; Jiang, H.S. Tree crown complementarity links positive functional diversity and aboveground biomass along large-scale ecological gradients in tropical forests. Sci. Total Environ. 2019, 656, 45–54. [Google Scholar] [CrossRef]
- Hardiman, B.S.; Bohrer, G.; Gough, C.M.; Vogel, C.S.; Curtis, P.S. The role of canopy structural complexity in wood net primary production of a maturing northern deciduous forest. Ecology 2011, 92, 1818–1827. [Google Scholar] [CrossRef]
- Jucker, T.; Bouriaud, O.; Coomes, D.A. Crown plasticity enables trees to optimize canopy packing in mixed-species forests. Funct. Ecol. 2015, 29, 1078–1086. [Google Scholar] [CrossRef]
- Seidel, D.; Leuschner, C.; Scherber, C.; Beyer, F.; Wommelsdorf, T.; Cashman, M.; Fehrmann, L. The relationship between tree species richness, canopy space exploration and productivity in a temperate broad-leaf mixed forest. For. Ecol. Manag. 2013, 310, 366–374. [Google Scholar] [CrossRef]
- Bohn, F.J.; Huth, A. The importance of forest structure to biodiversity-productivity relationships. R. Soc. Open Sci. 2017, 4, 160521. [Google Scholar] [CrossRef]
- Kunz, M.; Fichtner, A.; Härdtle, W.; Raumonen, P.; Bruelheide, H.; von Oheimb, G. Neighbour species richness and local structural variability modulate aboveground allocation patterns and crown morphology of individual trees. Ecol. Lett. 2019, 22, 2130–2140. [Google Scholar] [CrossRef] [Green Version]
- Zheng, L.; Chen, H.Y.; Yan, E. Tree species diversity promotes litterfall productivity through crown complementarity in subtropical forests. J. Ecol. 2019, 107, 1852–1861. [Google Scholar] [CrossRef]
- Poorter, L.; Bongers, L.; Bongers, F. Architecture of 54 moist-forest species: Traits, trade-off and functional groups. Ecology 2006, 87, 1289–1301. [Google Scholar] [CrossRef]
- Heineman, K.D.; Jensen, E.; Shapland, A.; Bogenrief, B.; Tan, S.; Rebarber, R.; Russo, S. The effects of belowground resources on aboveground allometric growth in Bornean tree species. For. Ecol. Manag. 2011, 261, 1820–1832. [Google Scholar] [CrossRef]
- Iida, Y.; Kohyama, T.; Kubo, T.; Kassim, A.R.; Poorter, L.; Sterck, F.J.; Potts, M.D. Tree architecture and life-history strategies across 200 co-occurring tropical tree species. Funct. Ecol. 2011, 25, 1260–1268. [Google Scholar] [CrossRef]
- Valladares, F.; Sanchez-Gomez, D.A.V.I.D.; Zavala, M.A. Quantitative estimation of phenotypic plasticity: Bridging the gap between the evolutionary concept and its ecological applications. J. Ecol. 2006, 94, 1103–1116. [Google Scholar] [CrossRef]
- Iida, Y.; Poorter, L.; Sterck, F.J.; Kassim, A.R.; Kubo, T.; Potts, M.D.; Kohyama, T.S. Wood density explains architectural differentiation across 145 co-occurring tropical tree species. Funct. Ecol. 2012, 26, 274–282. [Google Scholar] [CrossRef]
- Xu, Y.; Iida, Y.; Huang, H.; Shi, Z.; Franklin, S.B.; Luo, Y.; Bao, D.; Qiao, X.; Lu, Z.; Jiang, M. Linkages between tree architectural designs and life-history strategies in a subtropical montane moist forest. For. Ecol. Manag. 2019, 358, 1–9. [Google Scholar] [CrossRef]
- Chave, J.; Coomes, D.; Jansen, S.; Lewis, S.L.; Swenson, N.G.; Zanne, A.E. Towards a worldwide wood economicsspectrum. Ecol. Lett. 2009, 12, 351–366. [Google Scholar] [CrossRef]
- Van de Peer, T.; Verheyen, K.; Ponette, Q.; Setiawan, N.N.; Muys, B. Overyielding in young tree plantations is driven by local complementarity and selection effects related to shade tolerance. J. Ecol. 2018, 106, 1096–1105. [Google Scholar] [CrossRef]
- Liu, Y.; Ren, X.; Zhang, Q.; Li, Q.; Tao, J. Soil depth alters the effect of species diversity on productivity in an experimental karst herbaceous community. Plant Soil 2022, 471, 61–71. [Google Scholar] [CrossRef]
- Pretzsch, H. Canopy space filling and tree crown morphology in mixed-species stands compared with monocultures. For. Ecol. Manag. 2014, 327, 251–264. [Google Scholar] [CrossRef]
- Guillemot, J.; Kunz, M.; Schnabel, F.; Fichtner, A.; Madsen, C.P.; Gebauer, T.; Härdtle, W.; Von Oheimb, G.; Potvin, C. Neighbourhood-mediated shifts in tree biomass allocation drive overyielding in tropical species mixtures. New Phytol. 2020, 228, 1256–1268. [Google Scholar] [CrossRef] [PubMed]
- Xu, Y.; Zhang, J.; Franklin, S.B.; Liang, J.; Ding, P.; Luo, Y.; Lu, Z.; Bao, D.; Jiang, M. Improving allometry models to estimate the above-and belowground biomass of subtropical forest, China. Ecosphere 2015, 6, 1–15. [Google Scholar] [CrossRef]
- Condit, R. Tropical Forest Census Plots: Methods and Results from Barro Colorado Island, Panama and a Comparison with Other Plots; Springer Science and Business Media: Berlin, Germany, 1998; pp. 37–71. [Google Scholar]
- Li, Q.; Wang, X.; Jiang, M.; Wu, Y.; Yang, X.; Liao, C.; Liu, F. How environmental and vegetation factors affect spatial patterns of soil carbon and nitrogen in a subtropical mixed forest in Central China. J. Soils Sediments 2017, 17, 2296–2304. [Google Scholar] [CrossRef]
- Laliberté, E.; Legendre, P.; Shipley, B. FD: Measuring Functional Diversity from Multiple Traits, and Other Tools for Functional Ecology, R package version 1.0–12; R Core Team: Vienna, Austria, 2014. [Google Scholar]
- Ellenberg, H. Indicator values of vascular plants in central Europe. Scr. Geobot. 1979, 9, 97. [Google Scholar]
- Song, Y.; Yan, E.; Song, K. Synthetic comparison of 8 dynamics plots in the evergreen broad-leaved forests in China. Biodivers. Sci. 2015, 23, 139–148. (In Chinese) [Google Scholar] [CrossRef]
- Thomas, S.C. Asymptotic height as a predictor of growth and allometric characteristics in Malaysian rain forest trees. Am. J. Bot. 1996, 83, 556–566. [Google Scholar] [CrossRef]
- King, D.A.; Davies, S.J.; Noor, N.S.M. Growth and mortality are related to adult tree size in a Malaysian mixed dipterocarp forest. For. Ecol. Manag. 2006, 223, 152–158. [Google Scholar] [CrossRef]
- Zhang, S.B.; Slik, J.F.; Zhang, J.L.; Cao, K.F. Spatial patterns of wood traits in China are controlled by phylogeny and the environment. Glob. Ecol. Biogeogr. 2011, 20, 241–250. [Google Scholar] [CrossRef]
- Grace, J.B.; Anderson, T.M.; Seabloom, E.; Borer, E.; Adler, P.B.; Harpole, W.S.; Hautier, Y.; Hillebrand, H.; Lind, E.; Pärtel, M.; et al. Integrative modelling reveals mechanisms linking productivity and plant species richness. Nature 2016, 529, 390–393. [Google Scholar] [CrossRef]
- R Core Team. R: A Language and Environment for Statistical Computing; R Foundation for Statistical Computing: Vienna, Austria. Available online: https://www.R-project.org/ (accessed on 1 September 2021).
- Bates, D.; Mächler, M.; Bolker, B.; Walker, S. Fitting linear mixed-effects models using lme4. arXiv 2014, arXiv:1406.1:133-199, arXiv:1406.1:133-199. [Google Scholar]
- Lefcheck, J.S. piecewiseSEM: Piecewise structural equation modeling in R for ecology, evolution, and systematics. Methods Ecol. Evol. 2016, 7, 573–579. [Google Scholar] [CrossRef]
- Kelty, M.J. The role of species mixtures in plantation forestry. For. Ecol. Manag. 2006, 233, 195–204. [Google Scholar] [CrossRef]
- Binkley, D.; Campoe, O.; Gspaltl, M.; Forrester, D.I. Light absorption and use efficiency in forests: Why patterns differ for trees and stands. For. Ecol. Manag. 2013, 288, 5–13. [Google Scholar] [CrossRef]
- King, D.A.; Davies, S.J.; Nur Supardi, M.N.; Tan, S. Tree growth is related to light interception and wood density in two mixed dipterocarp forests of Malaysia. Funct. Ecol. 2005, 19, 445–453. [Google Scholar] [CrossRef]
- Laurans, M.; Hérault, B.; Vieilledent, G.; Vincent, G. Vertical stratification reduces competition for light in dense tropical forests. For. Ecol. Manag. 2014, 329, 79–88. [Google Scholar] [CrossRef]
- Aiba, M.; Nakashizuka, T. Architectural differences associated with adult stature and wood density in 30 temperate tree species. Funct. Ecol. 2009, 23, 265–273. [Google Scholar] [CrossRef]
- Iida, Y.; Swenson, N.G. Towards linking species traits to demography and assembly in diverse tree communities: Revisiting the importance of size and allocation. Ecol. Res. 2020, 35, 947–966. [Google Scholar] [CrossRef]


| Variables | Unit | Abbreviation | Values |
|---|---|---|---|
| Species richness | unitless | SR | 40.80 [28.00, 57.00] |
| Crown complementarity index | unitless | CCI | 0.82 [0.69, 0.90] |
| Annual forest productivity | Mg ha−1 yr−1 | ANNP | 5.24 [2.27, 9.49] |
| Basal area | m2 ha−1 | BA | 1.64 [0.70, 3.03] |
| Shape variation | unitless | Fdis_shape | 0.51 [0.41, 0.65] |
| Size variation | unitless | Fdis_size | 0.89 [0.60, 1.20] |
| CWM. wood density | unitless | CWM.WD | 0.56 [0.53, 0.60] |
| CWM. adult stature | unitless | CWM.d95k | 18.67 [13.83, 24.29] |
| CWM. shade tolerance | unitless | CWM.ST | 6.10 [5.89, 6.32] |
| Functional richness | unitless | FRic | 21.83 [10.22, 32.40] |
| Functional divergence | unitless | FDiv | 0.77 [0.66, 0.84] |
| Functional dispersion | unitless | FDis | 1.32 [1.04, 1.66] |
| Rao’s quadratic entropy | unitless | RaoQ | 2.23 [1.41, 3.40] |
| Soil organic carbon content | g Kg−1 | TOC | 8.25 [6.65, 9.98] |
| Soil nitrogen content | g Kg−1 | TN | 0.62 [0.45, 0.74] |
| Soil phosphorus content | g Kg−1 | TP | 5.05 [3.14, 6.55] |
| Bulk density | g cm−3 | BD | 0.53 [0.41, 0.73] |
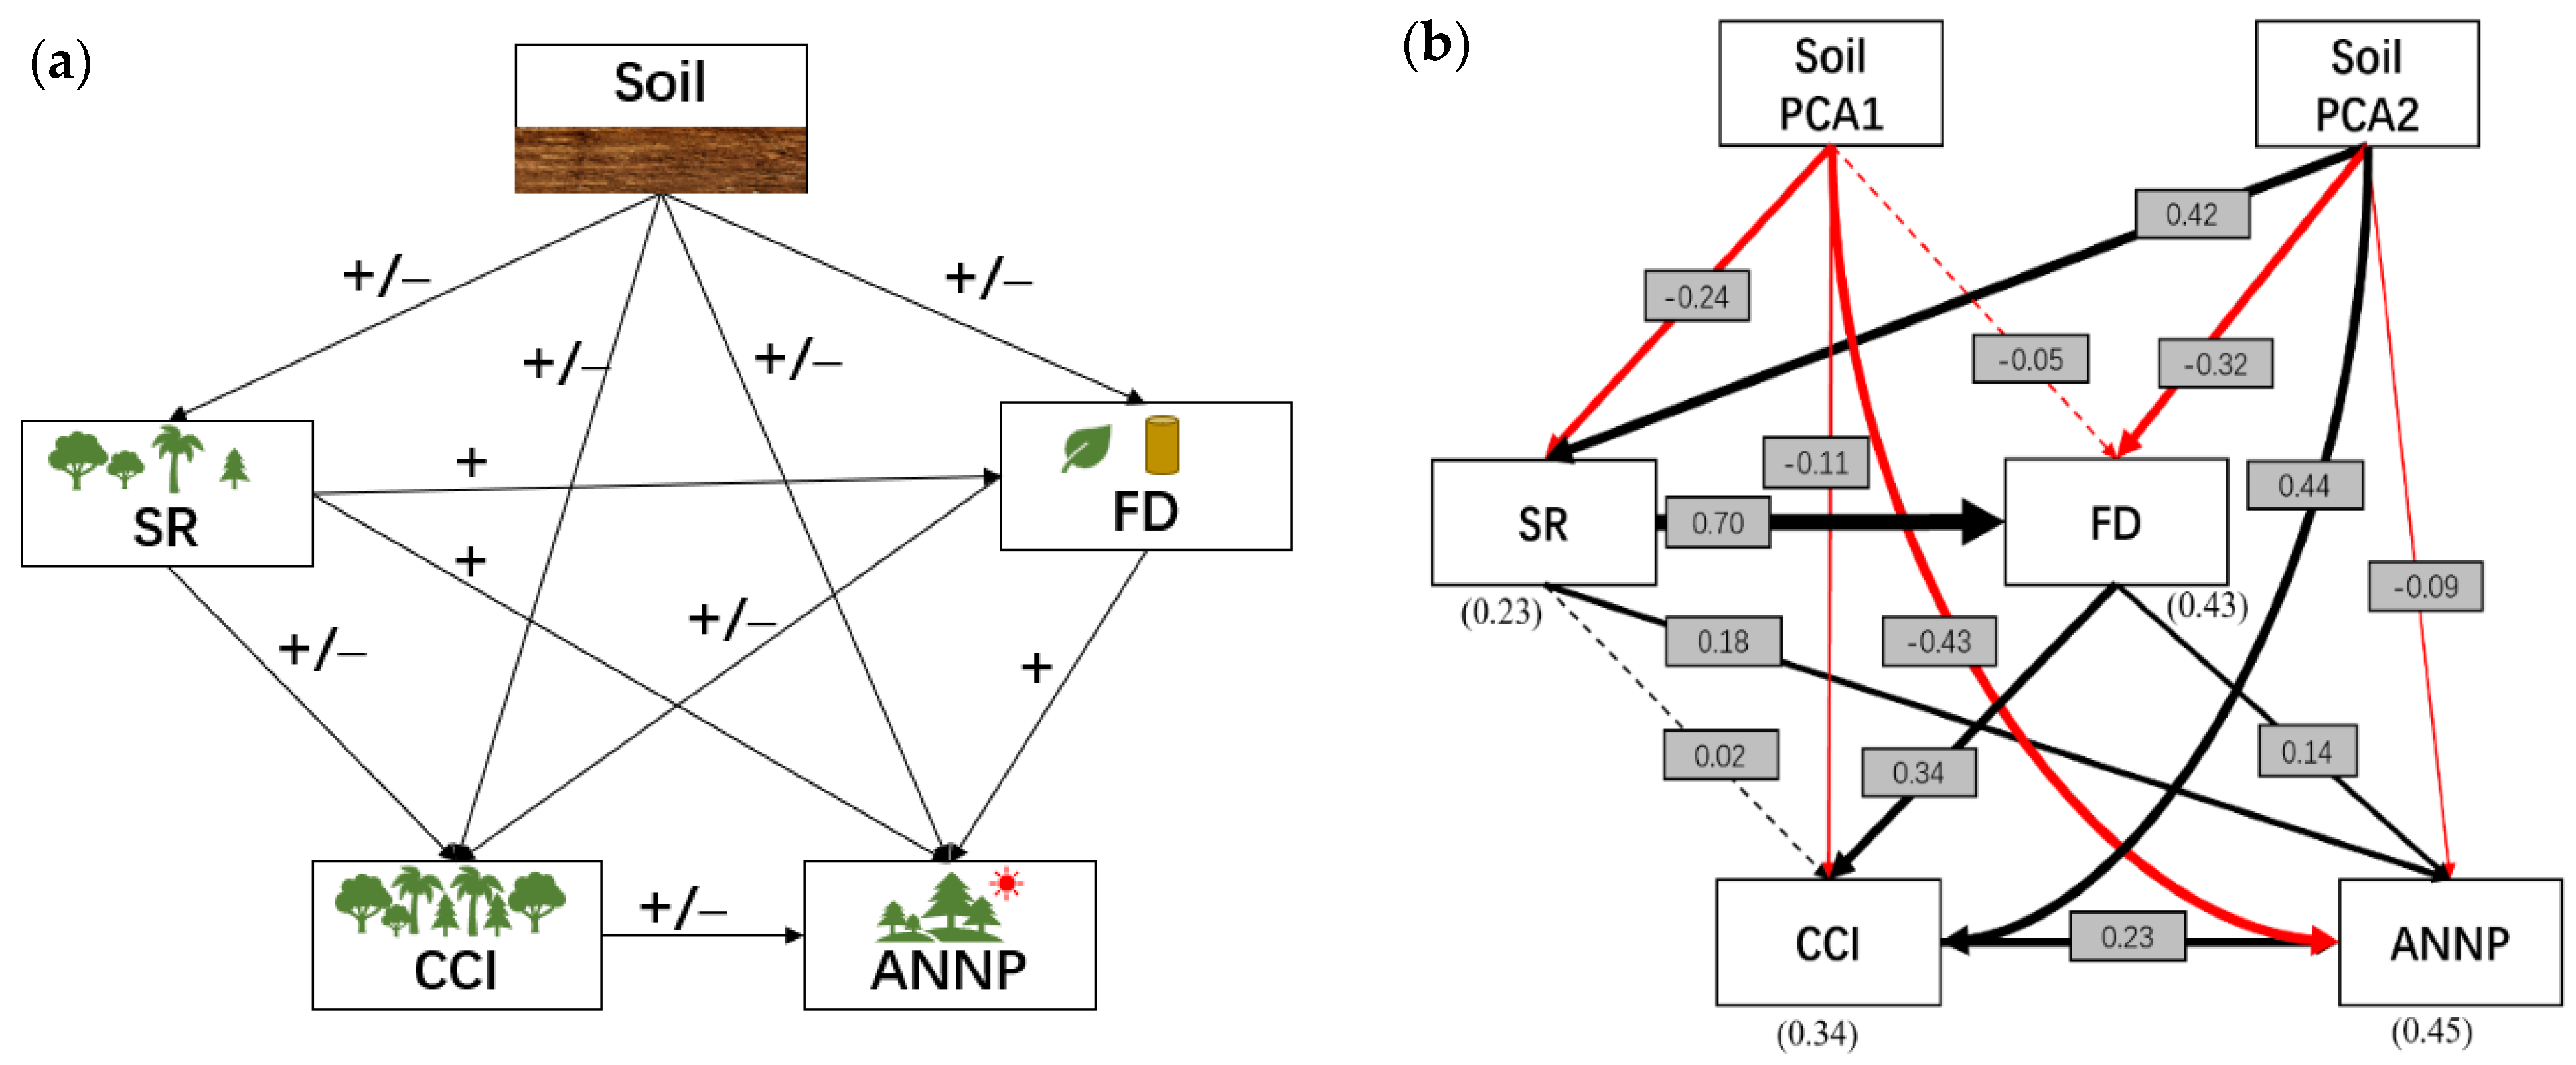
| Predictors | Pathway to ANPP | Effect | p-Value |
|---|---|---|---|
| Soil PCA1 | Direct | −0.43 | <0.001 |
| Through SR | −0.08 | <0.001 | |
| Through FD | −0.01 | - | |
| Through CCI | −0.03 | <0.001 | |
| Total effect | −0.55 | - | |
| Soil PCA2 | Direct | −0.09 | <0.001 |
| Through SR | 0.14 | <0.001 | |
| Through FD | −0.07 | <0.001 | |
| Through CCI | 0.1 | - | |
| Total effect | 0.08 | - | |
| SR | Direct | 0.18 | <0.001 |
| Through FD | 0.15 | <0.001 | |
| Through CCI | ~0.00 | <0.001 | |
| Total effect | 0.33 | - | |
| FD | Direct effect | 0.14 | <0.001 |
| Through CCI | 0.08 | <0.001 | |
| Total effect | 0.22 | - | |
| CCI | Direct effect | 0.23 | <0.001 |
Publisher’s Note: MDPI stays neutral with regard to jurisdictional claims in published maps and institutional affiliations. |
© 2022 by the authors. Licensee MDPI, Basel, Switzerland. This article is an open access article distributed under the terms and conditions of the Creative Commons Attribution (CC BY) license (https://creativecommons.org/licenses/by/4.0/).
Share and Cite
Xu, Y.; Chen, H.Y.H.; Xiao, Z.; Wan, D.; Liu, F.; Guo, Y.; Qiao, X.; Jiang, M. Species Richness Promotes Productivity through Tree Crown Spatial Complementarity in a Species-Rich Natural Forest. Forests 2022, 13, 1604. https://doi.org/10.3390/f13101604
Xu Y, Chen HYH, Xiao Z, Wan D, Liu F, Guo Y, Qiao X, Jiang M. Species Richness Promotes Productivity through Tree Crown Spatial Complementarity in a Species-Rich Natural Forest. Forests. 2022; 13(10):1604. https://doi.org/10.3390/f13101604
Chicago/Turabian StyleXu, Yaozhan, Han Y. H. Chen, Zhiqiang Xiao, Dan Wan, Feng Liu, Yili Guo, Xiujuan Qiao, and Mingxi Jiang. 2022. "Species Richness Promotes Productivity through Tree Crown Spatial Complementarity in a Species-Rich Natural Forest" Forests 13, no. 10: 1604. https://doi.org/10.3390/f13101604