Article

Landslide Susceptibility-Oriented Suitability Evaluation of Construction Land in Mountainous Areas

1
The Key Laboratory of GIS Application Research, School of Geography and Tourism, Chongqing Normal University, Chongqing 401331, China
2
Key Laboratory of New Technology for Construction of Cties in Mountainous Area, School of Civil Engineering, Chongqing University, Chongqing 400045, China
*
Author to whom correspondence should be addressed.
Forests 2022, 13(10), 1621; https://doi.org/10.3390/f13101621
Submission received: 24 August 2022 / Revised: 24 September 2022 / Accepted: 28 September 2022 / Published: 3 October 2022
(This article belongs to the Special Issue Landslides in Forests around the World: Causes and Mitigation)

Abstract

:
The aim of the present study was to assess the suitability of mountainous areas for construction land on the basis of landslide susceptibility, to obtain the spatial distribution pattern of said suitability and to improve the existing theories and methods used to ascertain said suitability. Taking Hechuan District in Chongqing as the research area and using data relating to 754 historical landslide sites from 2000 to 2016, we selected 22 factors that influence landslides. The factors were classified into five types, namely topography and geomorphology, geological structure, meteorology and hydrology, environmental conditions and human activities. A landslide susceptibility model was constructed using the random forest algorithm, and safety factors of construction land suitability were established according to the results of landslide susceptibility, with the suitability of land for construction in mountainous areas assessed by combining the key factors (natural, social and ecological factors). The weights of the factors were determined through the use of expert approaches to classify the suitability of land for construction in the research area into five levels: prohibited, unsuitable, basically suitable, more suitable and most suitable. The results of the study show that: (1) The average accuracy of the tenfold cross-validation training set data of landslides reached 0.978; the accuracy of the test set reached 0.913; the accuracy of the confusion matrix reached 97.2%; and the area under curve (AUC) values of the training set, test set and all samples were 0.999, 0.756 and 0.989, respectively. Historical landslide events were found to be mostly concentrated in highly susceptible areas, and the landslide risk level in Hechuan District was mostly low or very low (accounting for 76.26% of the study area), although there was also a small proportion with either a high or very high risk level (9.25%). The high landslide susceptibility areas are primarily concentrated in the southern and southeastern ridge, in the valley and near water systems, with landslides occurring less frequently in the gentle hilly basin. (2) The suitability of land for construction in mountainous areas was strongly influenced by landslide susceptibility, distance from roads and distance from built-up areas; among such parameters, rainfall, elevation and lithology significantly influenced landslides in the region. (3) The land suitable for construction in the study area was highly distributed, mainly in urban areas where the three rivers meet and around small towns, with a spatial distribution pattern of high in the middle and low on both sides. Furthermore, the suitability of land for construction in Hechuan District was found to be primarily at the most suitable and more suitable levels (accounting for 84.66% of the study area), although a small proportion qualified for either the prohibited or unsuitable level (accounting for 15.72%). The present study can be extended and applied to similar mountainous areas. The landslide susceptibility map and construction land suitability map can support the spatial planning of mountainous towns, and the assessment results can assist with the development direction of mountainous towns, the layout of construction land and the siting of major infrastructure.

1. Introduction

Due to the special topography, the exploitation of resources and economic development in mountainous areas have been limited by the fragile ecological environment [1]. The unreasonable exploitation of resources and the environment has led to an incompatibility between people and mountainous areas. As urban construction in China continues to expand, the state has increased efforts to protect cultivated land, resulting in difficulties in balancing development and protection [2]. There is a need to assess the suitability of mountainous areas to be used as construction land and to identify the spatial distribution of land suitable for construction and land which is not to allow for the expansion of urban development spaces and identification of high-quality cultivated land [3]. Through such means, a foundation can be laid for the spatial control of national land resources, the sustainable utilization of land resources and agricultural production. Evaluation indicators and research methods regarding the suitability of land for construction in mountainous areas are regarded as highly significant by relevant scholars. The assessment factors vary slightly depending on the research field and focus and can be divided into two main categories. The first category is assessment of the suitability of the land for construction based on key factors. For instance, Bagheri [4] combined ArcGIS and the D-AHP model to identify the risk zone of Kuala Terengganu, an eastern coastal city of Peninsular Malaysia, and constructed a land-use suitability map for disaster management. The other is the exploration of the suitability of land for construction based on selected factors, such as natural factors, ecological factors, social traffic, economic development and population density [5,6]. As an example, Ustaoglu [5] used ArcGIS and multicriteria assessment (MCA) to assess the suitability of land for urban construction in Pendik in eastern Istanbul, Turkey based on indicators such as geophysical features, accessibility, built-up areas and infrastructure, vegetation and other green and blue facilities. The focus of existing research has largely been on the evaluation of the suitability of land for construction in mountainous areas, with the aim of improving the evaluation method and enriching evaluation cases. However, the application value of suitability evaluation has not been fully explored. Therefore, continuous improvement of evaluation indicator systems and methods regarding the suitability of land for construction is worthy of additional attention, in addition to further expansion of the application field.
As one of the most common and threatening geological hazards, landslides primarily occur in mountainous areas due to the complex terrain, geological conditions and human engineering activities [7]. Landslides easily cause significant losses to towns because of the high susceptibility, frequency and speed thereof [7]. According to statistics, during the period from 2014 to 2018, landslides killed 4914 people, rendering 27,110 people homeless and resulting in asset losses totaling approximately USD 2.1 billion [
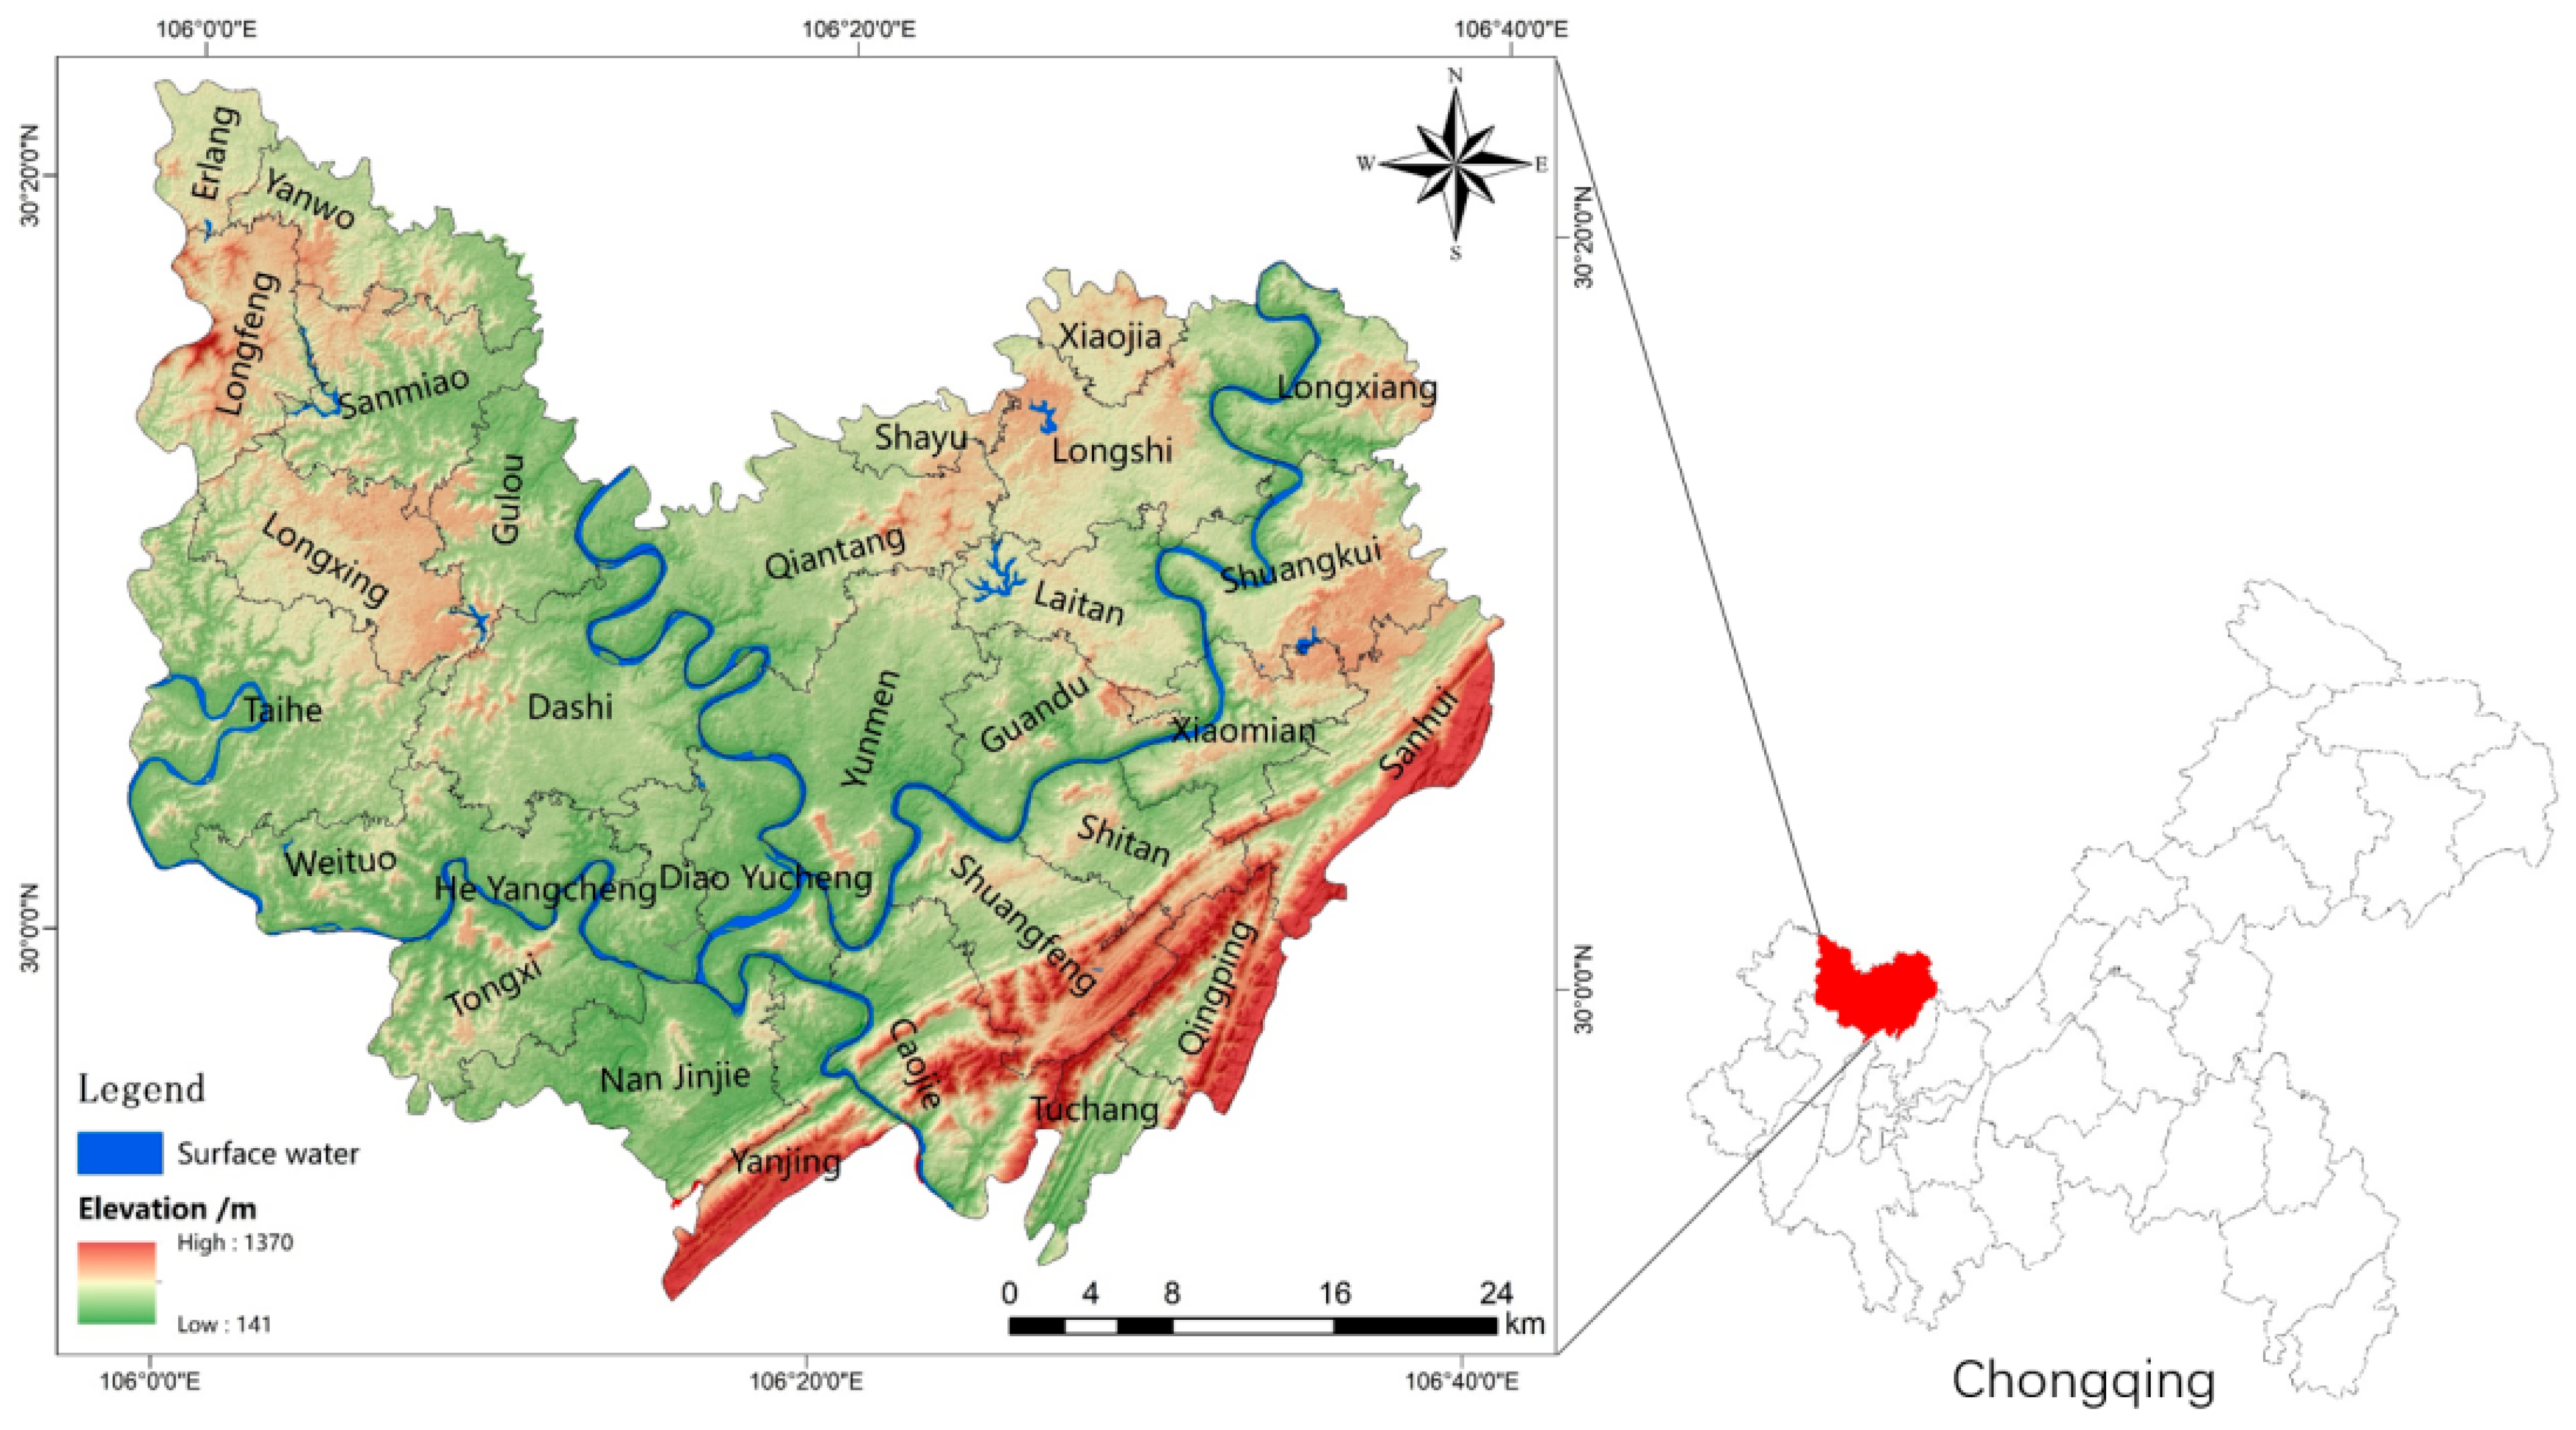
8]. As a typical area in the Three Gorges reservoir area, Hechuan District in Chongqing is characterized by a large number of mountains and hills, with frequent landslides as the main geological disaster [9]. A series of explorations of landslide prediction methods have been conducted by scholars in the Three Gorges reservoir area [10]. As reported by the Hechuan District Land Resources and Housing Administration, new landslide sites develop in the area every year, none of which is within the original key monitoring areas. Thus, the exploration of machine learning methods based on landslide susceptibility in fragile ecological and geological environments will facilitate accurate identification of disaster sites and highly disaster-prone areas and is of considerable significance for the safety of local residents, development of national land and ecological protection. Landslide susceptibility based on machine learning has been extensively adopted in research on disaster prevention and mitigation in urban areas and towns. Several examples include random forest (RF) [11], logistic regression (LR) [12] and artificial neural network (ANN) models [13,14]. Such methods possess significant advantages over conventional methods in terms of assessment, verification and prediction of landslide susceptibility [9]. Among the methods, random forest is highly accurate and efficient and can process high-dimensional data while maintaining a high level of data accuracy, even if features are missing or unbalanced [8]. Depending on the geographical location, climatic conditions and the amount of available data on the researched area, an appropriate model should be selected to obtain satisfactory evaluation results. The modelling of landslide susceptibility has been widely used due to the generalization ability thereof. Analytical hierarchy process (AHP) analysis, which is used to evaluate the suitability of land for construction, is also a common weight evaluation model and was found to be applicable to the present study [15].
In summary, scholars have conducted a series of studies on landslide susceptibility and the suitability of land for construction. However, there has been a scarcity of research on the suitability of land for construction in mountainous areas with frequent disasters based on the foregoing two aspects. Thus, empirical research with in-depth and extensive discussion is needed, with a particular focus on determining how to evaluate the suitability of land for construction in mountainous areas from the perspective of disasters, as well as key problems, such as the improvement of evaluation indicator systems, evaluation criteria and technical methods concerning the suitability of land for construction from the perspective of disasters in mountainous areas.
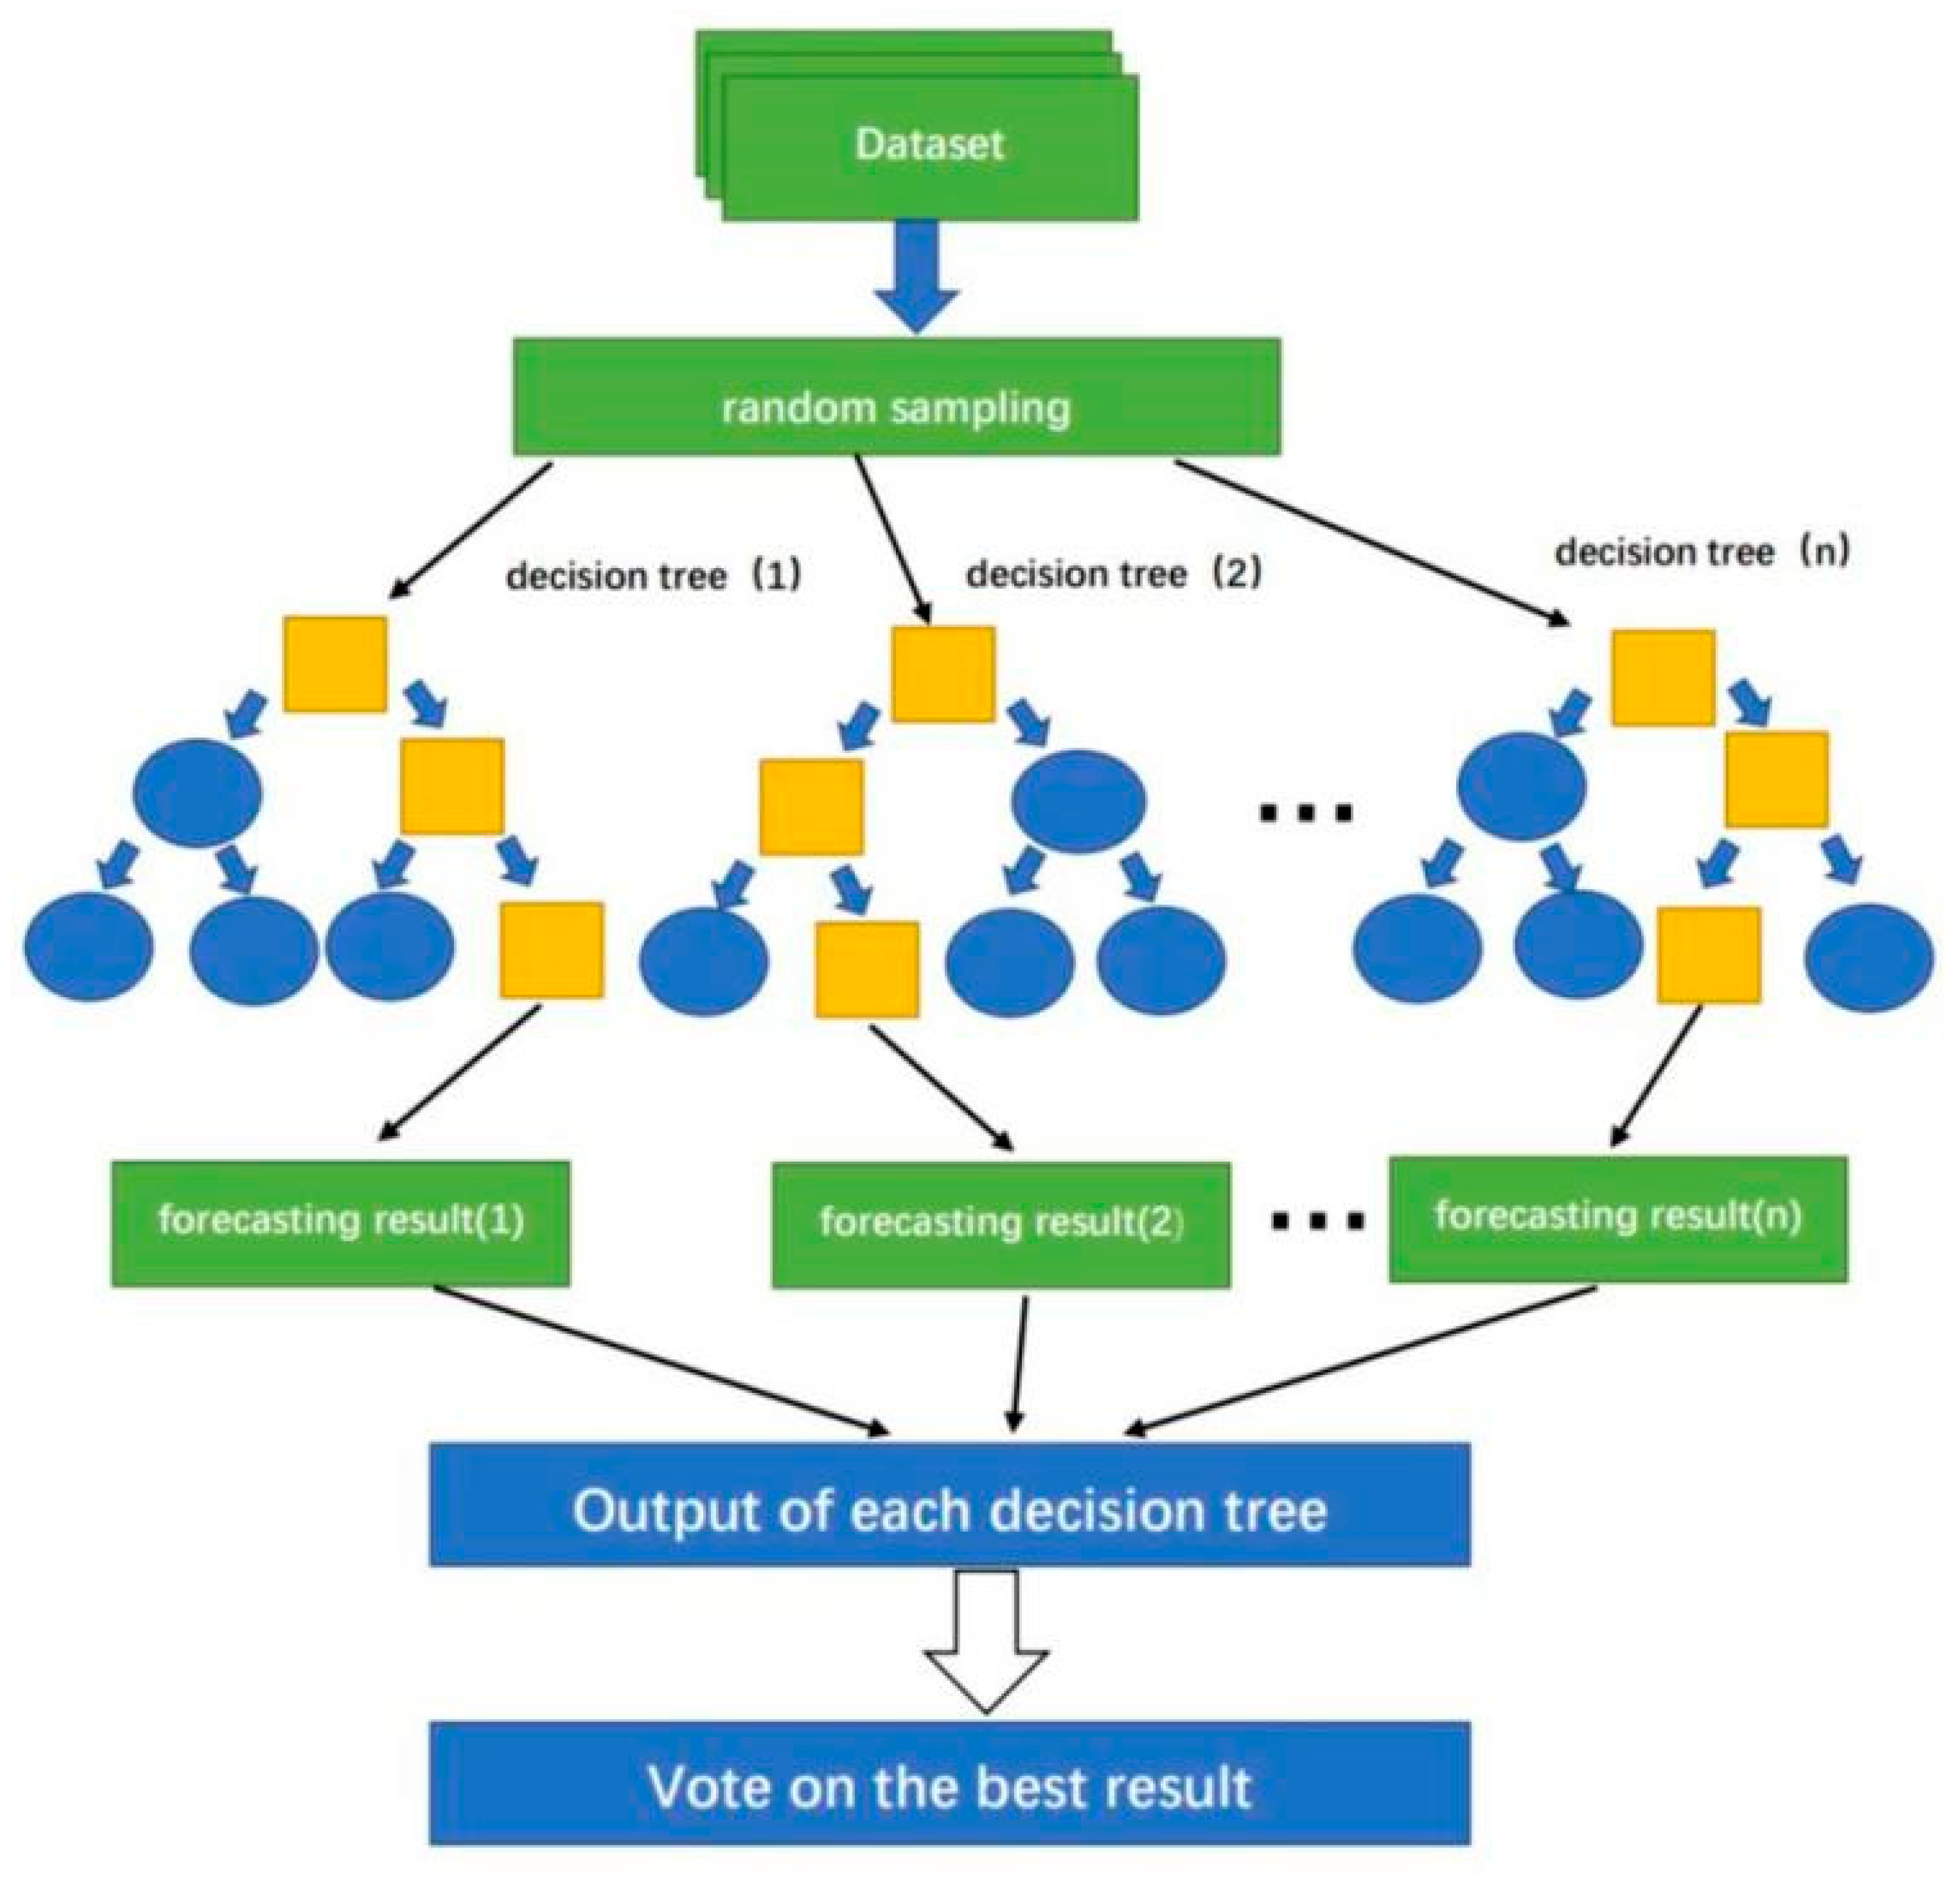
As such, the Hechuan District of Chongqing was investigated, and random forest and AHP were adopted to explore the suitability of land for construction in mountainous areas from the perspective of landslide susceptibility. First, 754 historical landslide sites were sampled in the Hechuan District according to the theoretical method of landslide susceptibility assessment, and a landslide susceptibility model was established based on the RF model of Hechuan District; then, on the basis of the disaster safety model, an evaluation model of the suitability of land for construction in mountainous areas was established, considering social, ecological and economic factors.
Finally, the suitability for construction of different areas was rated, and the spatial distribution of land suitable for construction was revealed, providing a scientific basis for the evaluation of the suitability of land for construction in Hechuan District and constructing an accurate, operatable and generalizable evaluation model. By constructing an accurate, operatable and generalizable evaluation indicator system and research method, the present study provides a scientific basis for evaluation of the suitability of land for construction in Hechuan District, offering a reference for planning and construction of other mountainous areas with frequent disasters.

2. Area of Research and Data Source

2.1. Study Area

Located at 105°58′37″–106°40′37″ east and 29°51′02″–30°22′24″ north, Hechuan District measures 69 km in length east to west and 58 km in width north to south and is situated northwest of Chongqing [16]. The area includes 23 towns and seven subdistrict offices. In 2019, the urban population in Hechuan District was 1.43 million. The area covers a total of 2375.61 km2, and the construction land area is 232.55 km2, accounting for 9.92% of the total area, with approximately 7% forest land coverage.
Hechuan District is situated at a junction of hills between the hilly Sichuan Basin and the valley province of Chuandong; therefore, the terrain is roughly divided into parallel ridges and gentle hills. Situated in a transition zone between gentle hills and mountains in the basin, there are numerous slopes and deposits in the piedmont belt in the southeast (see Figure 1). The area marks the convergence of the Jialing River, the Fujiang River and the Qujiang River in the territory. The Jialing River is the largest river in the area, with well-developed water systems, abundant water resources and ample rainfall [17]. The strata in Hechuan District mainly include Paleozoic Permian (P), Mesozoic Triassic (T), Jurassic (J) and Cenozoic Quaternary (Q). At the axes of the local anticline mountains are several active Quaternary or Cenozoic faults, largely distributed in the Yunwushan area of a branch of Huaying Mountain (Line 1 of Shuangfeng-Yanjing and Sanhui-Qingping-eastern Tuchang) (Figure 1).

2.2. Data Sources

The data used in this research were derived from 754 historical landslides in Hechuan District (2000–2016), including: DEM raster data with a 30 m spatial resolution; geological raster data with an accuracy of 1:200,000; land-use and administrative division vector data with an accuracy of 1:100,000; satellite imagery raster data with a 30 m resolution on a geospatial data cloud platform; 1:100,000 vector data via river network 1 from the Chongqing Water Resources Bureau; a multiyear rainfall data table with an accuracy of 30 m; 1:100,000 road data from the Chongqing Municipal Transportation Commission; Chongqing POI data obtained by web crawlers; data on rural residential areas, urban built-up areas, nature reserves, ecological red lines, etc.; rural settlement data from the Land Change Investigation Database; raster data with a 30 m resolution from urban built-up areas, which were extracted from a geographical information database; and ecological red line (natural reserves and water conservation areas) statistics from Chongqing’s Ministry of Natural Resources. The raster data were converted to a raster corresponding to a DEM resolution of 30 m, owing to the varied spacings and scales of the elements. Due to the restricted land conditions in Chongqing, the standard setting of urban and rural construction land areas could be adopted according to its own situation with floating coefficients. Based on the delineation standard of the resolution of districts and counties in Chongqing and in prior research [18,19], a spatial resolution of 30 m was determined in this research, which allowed for the spatial characteristics of landslides and construction land to be captured while reducing the complexity of the calculation. Additionally, continuous factors were classified for further classification and assignment of values (Table 1). Based on field surveys, expert experience and the relevant literature, the natural breakpoint method was used to determine the threshold values for each factor and subsequently adjusted to regional conditions to meet the requirements of the actual situation.

3. Development of Indicator System and Research Methodology

3.1. Indicator System for Landslide Susceptibility Assessment

Landslides are closely associated with the stratigraphy and geomorphology of mountains [20], representing one of the main geological hazards in Hechuan with respect to the safety of the area. Therefore, landslide hazards were selected in this research for the construction of a safety index system for Hechuan District. In Reichenbach’s [21] study, landslide factors were classified into five major categories: geology, hydrology, land cover, landform and others. In this research, human activities were incorporated into the assessment factors through field investigations and by synthesizing the realities of the densely populated and mountainous land limitations of Hechuan District. The safety assessment factors of landslide susceptibility in Hechuan District were established as follows: topography and geomorphology (elevation, slope, degree of relief, aspect, slope position, micro-landform, synthetic curvature, profile curvature, plan curvature, terrain roughness index (TRI) and topographic wetness index (TWI)); geological conditions (slope type, distance from fault and lithology); environmental conditions (distance from rivers, rainfall, land cover and NDVI); meteorological and hydrological conditions (sediment transport index (STI) and stream power index (SPI)); and human activities (distance from roads and POI kernel density). Furthermore, to provide a basis to evaluate the suitability of land for construction in mountainous areas, a geospatial database was created and combined with historical landslide data, a random forest algorithm was used to delineate landslide susceptibility zones and a safety zone model based on RF was constructed (Table 2).
The raw data were further processed in ENVI and ArcGIS 10.6 to obtain the factor data, and the 22 processed impact factors were reclassified according to the classification thresholds presented in Table 2.

3.2. Indicator System and Data on the Suitability of Land for Construction

The assessment of the suitably of land for construction is affected by a variety of factors. In this research, we referred to relevant studies, Hechuan District in Chongqing was taken as the study area and factors were selected at four levels, namely natural, social, ecological and safety, so as to construct an index system for the assessment of the suitability of mountainous areas for construction. Hechuan District is located at the confluence of three rivers in a mountainous area. Safety has emerged as a significant influencing factor on construction land, owing to the complexity and variability of the environment. The safety factor consists of the results of the landslide susceptibility assessment. The differing climatic environments and production conditions in the region have influenced the living habits and residential choices of residents. Eight indicators (elevation, slope, degree of relief, aspect, land cover, NDVI, distance from rivers and distance to roads) were selected to build a natural factor index system that supports scientific criteria for the applicability of construction land. Location conditions affect socioeconomic development, access to information and the convenience of residents. The central city is the main supplier of major public services, whereas rural settlements are built-up areas. In this research, social factors were characterized in terms of distance from built-up areas and distance from rural settlements. The ecological red line is a spatial boundary of the national territory that is specially protected to maintain ecological Safety and ecosystem integrity [22], representing an area where development and construction are strictly prohibited. The ecological factors (nature reserves and important water-conservation areas) were restricted and designated as non-construction zones (Table 3).
Considering the specific characteristics of Hechuan District, an expert scoring method was adopted to comprehensively determine the grading standard value of each factor. The indicators were classified into five levels according to accepted standards established in previous studies [25]. The evaluation factors were classified as: the most suitable level, with an optimal value of “1”; medium suitability, with a value of “2”; basic suitability, with a value of “3”; unsuitable, with a value of “4”; and prohibited construction, with a value of “5”. Additionally, the Mi weight values of indices at different levels were calculated; the specific grading criteria are shown in Table 3.

3.3. Research Methodology

3.3.1. Research Steps

The present research was conducted in seven steps: (1) preparation of a data inventory for the landslide and construction land suitability assessment and generation of a geospatial database in ArcGIS 10.6 software; (2) construction of an indicator system for landslide susceptibility and calculation of the weights of landslide hazard impact factors using the average Gini coefficient; (3) assessment and ranking of landslide susceptibility; (4) receiver operating characteristic (ROC) curve analysis for accuracy and model validation to verify the performance of the susceptibility assessment; (5) construction of an index system for construction site suitability assessment using the results of the landslide susceptibility assessment and the natural, social and ecological factors; (6) construction of a judgement matrix for the development of site suitability and calculation of the rankings of the variables using the AHP method; (7) and assignment of construction site suitability ratings according to the weights (Figure 2).

3.3.2. Random Forest

In 2001, Breiman [26] developed the random forest model as a modern classification and regression technique to collect data for learning and processing. Multiple samples were obtained from the original samples after resampling by bootstrapping. RF randomly samples the samples and features, thereby providing improved stability and accuracy relative to traditional landslide prediction methods [22]. The output of RF is based on multiple decision trees voting on the judgement results. The samples are trained to obtain each classification model (u1(X), u2(X), …, uk(X)1–2) and by n independent decisions (u(X,θk; K = 1,2,…N)) to form the RF model [22,27]. RF is tolerant of outliers and noise, does not overfit and achieves high prediction accuracy and stability. The categorization models are then used to build the RF model. Such an approach has been adopted in a variety of fields, such as clustering, regression, discrimination and survival analysis, in which variable evaluation is viral [22]. The RF in this research was composed of two trees (positive and negative cells), each with 22 random characteristics (22 landslide condition factors). See Equation (1) for details:
H ( x ) = a r g   m a x y i = 1 k I ( h i ( x ) ) = Y
where H(x) is the output classification result, hi refers to a classifier of a single decision-making tree, Y represents the output variable and I ( h i ( x ) ) denotes the indicator function.
The random forest model was constructed using the R language package “randomForest”, and ROC curves were plotted using the R package “pROC”. The landslide susceptibility results constructed by the RF model were assessed using ROC curve analysis. The area under the ROC curve can be used to quantify the accuracy of the model prediction; the closer the ROC curve to the top left, the higher the accuracy of the model. The area under the curve (the AUC value) refers to the area covered by the ROC curve, which can be used to quantify the accuracy of the model. The AUC value is in the range of [0, 1], with a higher value indicating higher model accuracy. See Equation (2).
AUC = i = 1 n 0 r i n 0 × ( n 0 + 1 ) / 2 n 0 × n 1
where the n0 and n1 distributions represent the number of counter and positive cases, respectively, and the ri distribution is the ranking of the i th counter case in the overall test sample.
The construction of the random forest model consists of the following main steps (Figure 3).
A random forest model is constructed on the basis of N decision trees, and a decision tree is constructed using each subset combination. Within the constructed decision trees, node partitioning is performed using the CART algorithm. CART is based on the principle of minimizing the Gini coefficient and randomly selecting objects to be assigned to class I at node t based on the probability (p(i|t)). The estimated probability that an object actually belongs to class j is p(j|t). See Equation (3) for details:
Gini = i i J ( p ( i | t ) p ( j | t ) )  
The random forest package within R was use to implement the random forest technique. The 754 historical landslide points were used as positive samples, the 500 m buffer zone of the landslide points and the river area were removed as non-landslide areas and 7540 non-landslide points were randomly selected as negative samples in a ratio of 1:10 to form the entire dataset. The training and test sets were divided into a ratio of 7:3, and for historical slippage points, there were 5806 training sets and 2488 test sets. To determine the accuracy of the ROC curve analysis, the RF model was trained and validated using the tenfold cross-validation method.
The confusion matrix is the basis for ROC curves; it is represented in a standard format for accuracy evaluation. This means of number of observations in the wrong class and the wrong class of the classification model are counted separately, and the results are presented in a table, which is shown below (Table 4 and Table 5).

3.3.3. AHP Research Method

As proposed by Professor Saaty [28] (1980), the analytical hierarchy process (AHP) method, in which multiple criteria are selected to make decisions, is a simple, adaptable and practical approach to quantitatively analyze qualitative issues. The method can split a complex problem into a number of levels and factors, thereby allowing for a comparison between two indicators to be made to determine the degree of importance and to establish a judgement matrix. In the AHP method, a hierarchical relationship is established between all the elements, and the evaluation procedure is simple and easy to operate [21]. The AHP method is used to determine the weight values of the indicators, judge the importance of each factor, conduct comparative analysis and construct a judgement matrix. The expert scoring approach determines the relative significance of the evaluation indicators, and a two-by-two judgement matrix is created to compare indicators between the layers, with the consistency of the judgement matrix then checked to ensure that there is no bias in the two-by-two comparison process. Considering that the ecological factor is incorporated into the no-construction zone, only a hierarchical structure model of safety, nature and society was constructed. In the model, each evaluation factor was normalized, the relative significance of each variable was assessed, the weight values of the three categories of factors were identified using the AHP method and further judgements on the weights of various factors within the two categories of nature and society were made, whereas the weight of the safety factor was determined through the average Gini coefficient of RF. The weight values of the indicator layer for the criterion and target layers were calculated using YAAHP software [28,29]. By overlaying the weight maps of the influencing factors obtained using ArcGIS10.6 with the AHP method, a geospatial data-based model of the suitability of land for construction in mountainous areas affected by landslides is constructed. See Equation (4).
T = i = 1 n M i × R i
where T is the comprehensive assessment value of the suitability of the assessment unit for construction land, Mi represents the weight value of factor i, derived via the hierarchical analysis method, Ri denotes the i-th single factor score corresponding to the assessment unit and n refers to the total number of factors.

4. Results

4.1. Safety Level

The q-value of the mean Gini coefficient in the random forest explains the contribution of the factor, that is, the degree of influence of the degree factor on the landslide. The results show that the three factors of average multiyear rainfall, elevation and lithology had the greatest influence on landslides (Figure 8).
Landslides are a typical dichotomous problem, and the confusion matrix can be used to analyze the accuracy of the model. Table 6 shows the confusion matrix of the entire data set of the random forest model. According to the confusion matrix, the constructed random forest model exhibited a high degree of accuracy and high predictive value (Table 6).
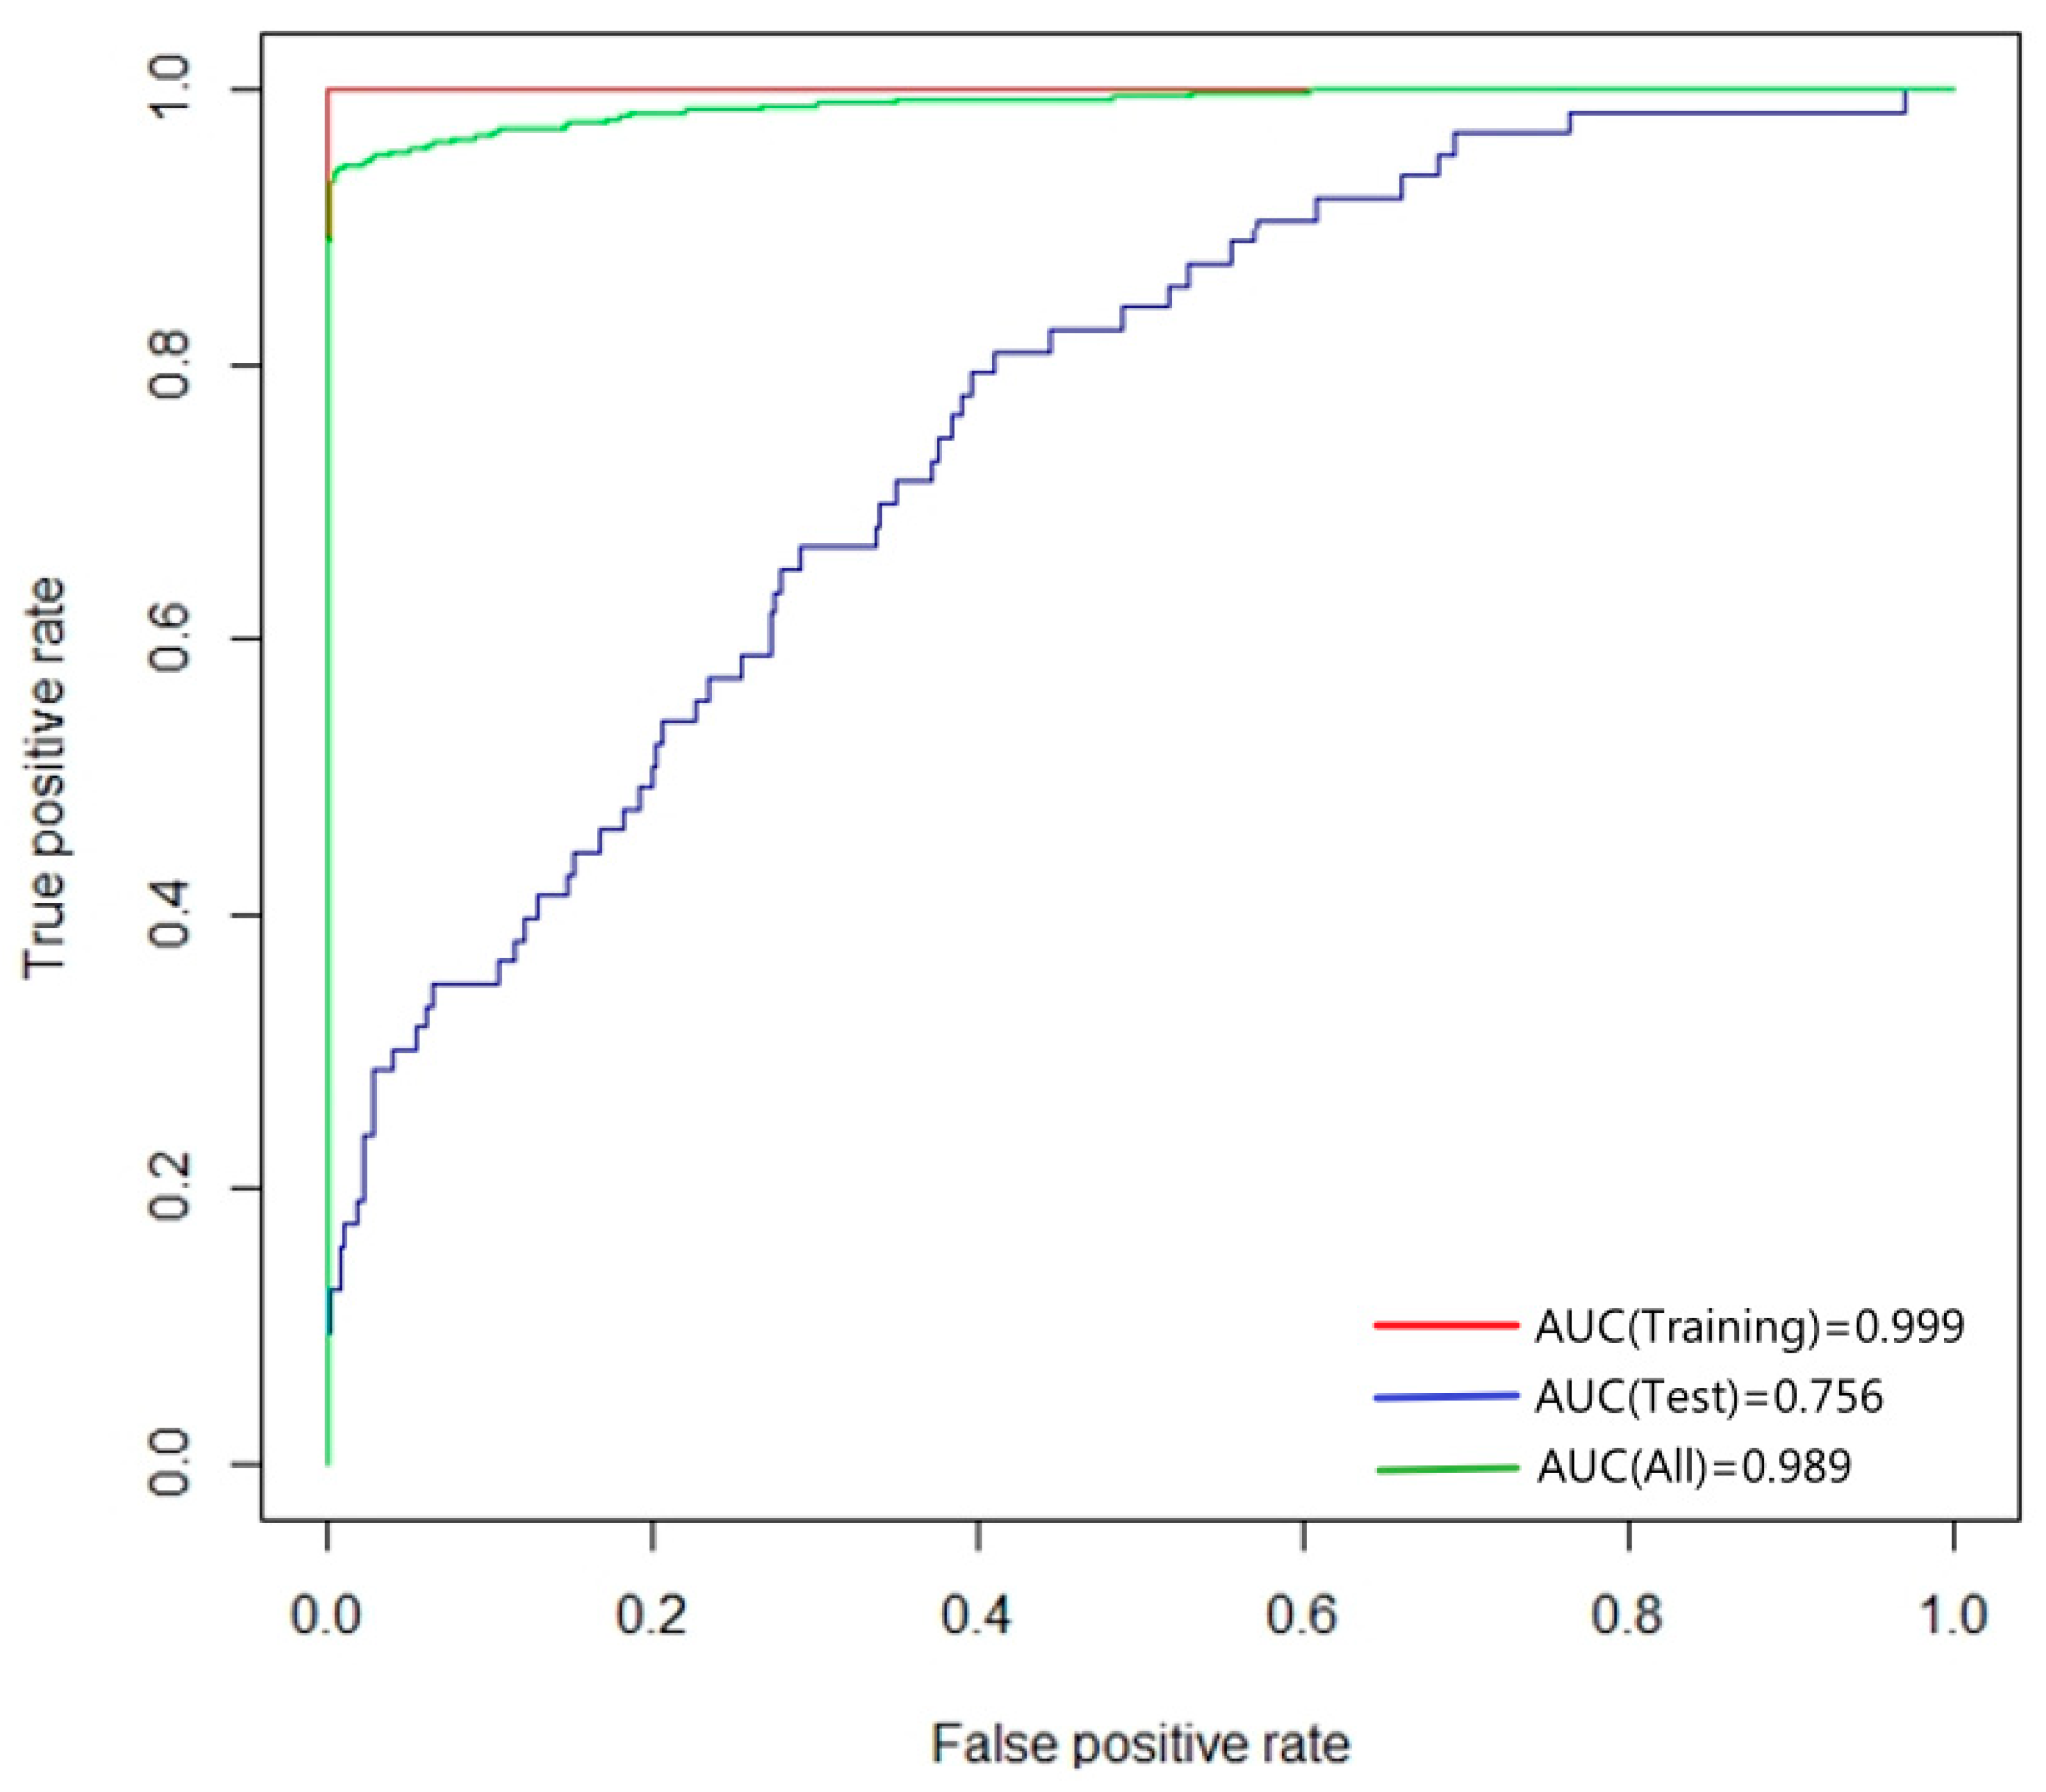
In addition, the landslide susceptibility results constructed by the RF model were assessed by means of ROC analysis. In this research, ROC curve analysis was performed in R Studio software using the R language. The AUC values for the training, test and all samples were 0.999, 0.756 and 0.989, respectively (Figure 4). The test AUC values were greater than 0.7, indicating that the model prediction accuracy was high and stable.
To evaluate the likelihood of landslides in the study area, a random forest model was applied to each grid in the area. The results of the random forest model were imported into ArcGIS 10.6, classified using the natural breakpoint method and adjusted according to the procedures described in prior research [8,22]. Landslide susceptibility was classified into the following five levels: extremely low, low, medium, high and extremely high susceptibility areas (Figure 5 and Table 7).
The majority of the regions in Hechuan District were found to have an extremely low or low landslide risk level. High-susceptibility zones are primarily situated in the northeast and near water systems. Landslides are rare in hilly basins with gentle terrain, and historical landslide areas correlate with the landslide susceptibility zones. With an enhancement in landslide susceptibility, the proportion of areas at each level, except the extremely high level, decreased. The number of landslides increased gradually, with the density strengthened, and there were a total of 753 landslide spots. The combined region of low and very low susceptibility accounts for 76.58% of Hechuan District’s land area. The total landslides occurred in 15.25% of the total area. Landslides were possible in 74.14% of the land area, but regions of high and extremely high susceptibility accounted for only 9.01% of the land area.
As a crucial measure, extremely high-susceptibility areas should be largely concentrated along river valleys and mountains, which, to a considerable extent, affect urban development. The area of high or extremely high susceptibility spans 208.47 km2, accounting for 9.01% of the total area, mainly distributed along the Qujiang and Jialing Rivers, including Xianglong Town, Shuanghuai Town, Xiaomian Town, Shitan Town, Guandu Town, Yunmen Subdistrict, Shuangfeng Town, Tongxi Town, Yanjing Street and Laitan Town. Such areas are strongly affected by surface water and rainfall. The rise and fall of river levels can result in landslide disasters during heavy rain. Landslide disasters in such areas induce changes in the courses of rivers; endanger infrastructure, residential areas and arable land; and have significant social impacts. The area of medium susceptibility spanned 333.62 km2, accounting for 14.41% of the total area. Here, landslide disasters endanger infrastructure, residential areas and arable land, in addition to producing significant social impacts. The low-susceptibility area occupies 709.95 km2, accounting for 30.67% of the total area, whereas the extremely low-susceptibility area spans 1062.88 km2, accounting for 45.91% of the total area. Landslide disasters in such areas mainly threaten general facilities, residential areas and cultivated land, with a low level of risk. Differing from high- and extremely high =0susceptibility areas, low- and extremely low-susceptibility zones are extensively spread at lower altitudes in riverbank basins and around central metropolitan areas.

4.2. Suitability Evaluation of Construction Lands

4.2.1. Analysis of Evaluation Results

Given the complexity of mountainous areas, there are difficulties associated with determining the weights of evaluation factors using a quantitative assignment method. Although the judgement of expert experience has a certain degree of flexibility, the subjective assignment method can effectively adjust the weights for the land conditions of different regions, making the regional evaluation results more relevant and reliable. The safety factor in this research had a considerable impact in mountainous areas and was delineated as 33.377%. The natural factor, as the resource endowment of mountainous towns, involved more factors and had the highest weight. The social factor gradually emerged as a significant factor for evaluation. A veto system was adopted for the influence range indicator of the ecological factor, and the area to which it belongs was directly classified as a non-construction zone. Therefore, only the weight was calculated with the indicators using the hierarchical analysis method. The weighting values for the indicators of suitability of land for construction in mountainous areas were obtained with reference to previous studies
There are two types of indices for a judgement matrix: an index of consistency (CI) and a random consistency index (RI). The value ratios of the suitability, nature and society factors of construction land with respect to the consistency of the matrix were calculated to be 0.052, 0.097 and 0.000, respectively. All of the values were less than 0.1, thereby passing the consistency test and demonstrating that the results of the evaluation index weighting were reasonable (Table 8, Table 9, Table 10 and Table 11).
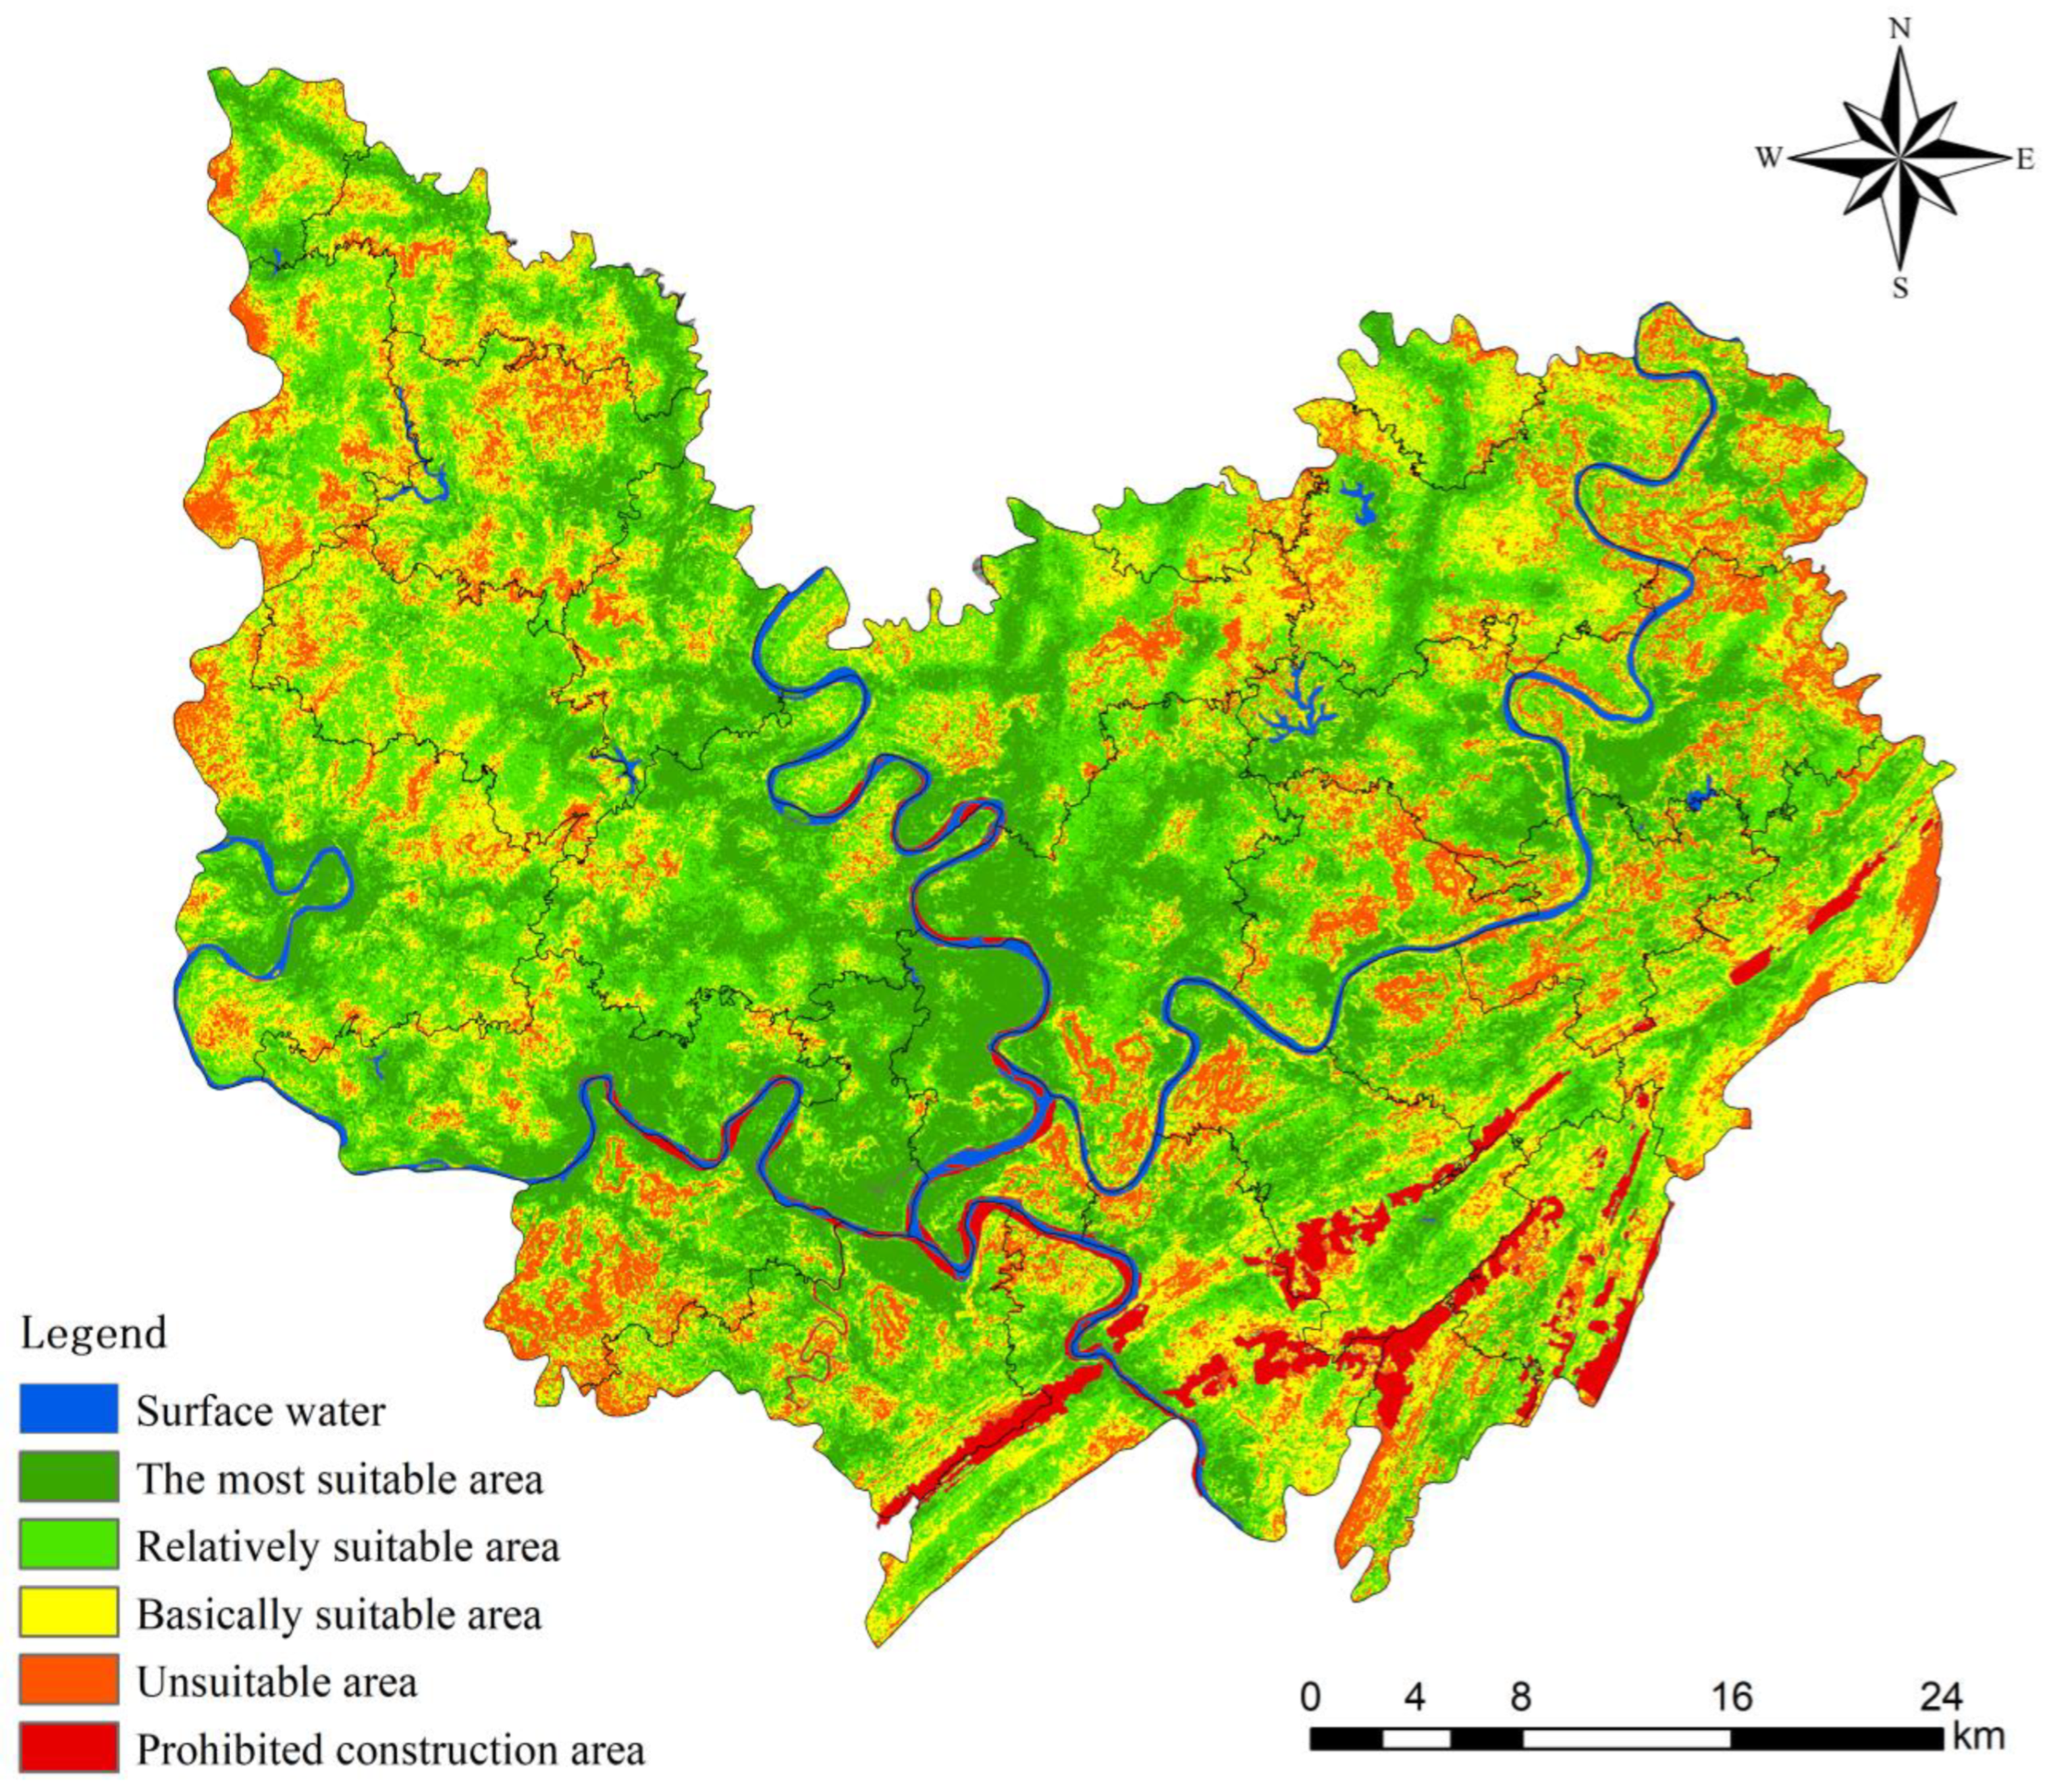
According to the calculated weight results, as well as the classification and assignment of each index, ArcGIS was applied to superimpose a raster layer of each factor and to remove ecological red line space, thereby allowing for five levels of suitability for construction land in Hechuan District to be obtained: the most suitable area (1), more suitable area (2), basically suitable area (3), unsuitable area (4) and prohibited construction area (5) (Figure 6).

4.2.2. Suitability Zoning of Construction Lands

Using the ArcGIS10.6 platform, the aforementioned landslide susceptibility results and natural, social and ecological factors were superimposed and calculated according to Equation (3), with the results divided into the following zones according to the natural breakpoint method: prohibited construction, unsuitable, basically suitable, more suitable and the most suitable [2,30]. The ecological red line space was superimposed and divided into prohibited construction zones, and the final results of the suitability assessment of construction land in Hechuan District were obtained.
The suitability for construction was found to be good in Hechuan District. The suitable area spanned 2002.07 km2, accounting for 84.28% of the total area, and the most suitable land was distributed in urban areas, where the three rivers meet or around small towns. The most suitable area spanned 637.18 km2, accounting for 26.82% of the total area, and was mainly distributed in valley areas along the Jialing and Fujiang Rivers. Located at the confluence of many rivers, Yunmen Subdistrict has a low elevation and flat terrain, with sufficient water sources and convenient transportation. The more suitable area spanned 812.25 km2, representing 34.19% of the total area. Such areas were divided into tracts in Zhongyunmen Subdistrict, Qiantang Town, Dashi Subdistrict, Heyangcheng Subdistrict and wide, hilly areas in Nanjin Town and Caojie Subdistrict. Most of the areas that cover such land are 220 m–350 m above sea level. The urban construction lands with basic suitability occupied 552.64 km2, accounting for 23.26% of the total area, and were primarily found in the hilly regions outside the Huaying and Longduo Mountains. The less suitable areas spanned 241.90 km2, accounting for 10.18% of the total area, scattered in the mountains with high elevations and were evenly distributed between Sanmiao Town, Yanwo Town, Sanlang Town, Longfeng Town, Taihe Town, Shayu Town, Guandu Town, Xianglong Town and Shuanghuai Town. The prohibited construction land covered an area of 131.65 km2, accounting for 5.54% of the total area, and mainly distributed in the southeast area, the Huaying mountainous area and in regions in the ecological red line area, where there is the highest forest coverage.

5. Discussion and Conclusions

5.1. Discussion

5.1.1. Assessment of Significant Factors under Regional Characteristics

An assessment of the suitability of land for construction in mountainous areas is particularly significant for the development of towns and cities. Ying [31], Yi [32] and Peng [19] considered the impact of geological hazards on construction land and the safety of human life in the assessment of construction suitability in mountainous areas. Figure 7 shows the ranking of the importance of the factors in the suitability assessment of building sites (Figure 7).The top three factors for construction land suitability in this research area were identified using the AHP method, namely landslide susceptibility, distance from roads and distance from built-up areas (Figure 7). Among such factors, landslide susceptibility, as a geological hazard, is a significant indicator for assessment of the suitability of construction land and for the assessment of fragile ecological and geological environments, which is of considerable significance for the safety of regional residents, economic development and ecological protection. In this research, landslide susceptibility was incorporated into the construction land suitability assessment system from the perspective of hazards. Using the average Gini index module of the “randomForest” package, an importance ranking of the 22 factors of landslide susceptibility was achieved (Figure 8). According to the observation results, the three factors of multiyear average rainfall, elevation and lithology had the greatest influence on landslides (Figure 8). Landslides occur more often when rainfall is in the range of 1160 mm to 1266 mm. Several studies have shown [30,31,33] that the influence of rainfall on landslides depends largely on the amount of rainfall, in addition to the length of rainfall, and that landslides are more likely to occur in areas of prolonged heavy rainfall. Such parameters were all higher in the study area and were basically consistent. Landslides are also more likely to occur when the elevation is between 241 m and 461 m, which can be attributed to such an elevation range being conducive to human survival and a large number of human activities leading to changes in the geological environment, thereby increasing the probability of landslides [33]. The influence of the lithology of the strata on landslides mainly depends on the hardness, weathering and permeability of the rocks therein. The distance from the road and the distance from built-up areas show the significant role of geographical location with respect to the suitability of land for construction. Hechuan District is situated in a typical mountainous region with hillsides and limited land resources; thus, the convenience of road access becomes a significant factor that affects the development of mountainous areas. The distance from the road indicates road accessibility, with a greater road accessibility indicating a higher grade of construction land suitability. Built-up areas, such as mature town development areas, have relatively complete public service facilities and infrastructure, the economic benefits of which radiate to the surrounding areas; thus. the distance from built-up areas is a significant indicator in assessing the land value of construction land. As such, the importance of such factors can serve as the foundation for the development and construction of mountainous areas. However, at present, the safety level delineated by the random forest model is still subject to limitations in terms of data, and the misjudgments caused by the over-representation of non-landslides cannot yet be excluded [34]. As the survey research becomes more in-depth and the quality of data improves, a spatial database of multiple hazards, such as landslides, debris flows and floods, can be constructed. Furthermore, the zoning of such hazards should be refined in the future to clarify the inter-relationships between them to obtain more comprehensive safety zone assessment results and to improve the accuracy of the assessment of the suitability of land for construction in mountainous areas.

5.1.2. Optimization of Disaster Prediction Models

Previous studies on the suitability of land for construction have mostly included statistical listings of existing disaster prevention results, whereas the integration of planning with geological hazard prevention and control has been neglected, thereby diminishing the guiding value of such studies in practice. Due to management problems and a lack of data, there is a scarcity of disaster prevention and control research. The results of previous studies mainly apply to geological hazard prevention and control, land-use planning and disaster prevention and mitigation. In this study, the random forest model was applied to the case study area. Moreover, the results demonstrate that the AUC value of the ROC curve in the training dataset was the highest, followed by the regional simulation and the validation dataset, at 0.999, 0.756 and 0.989, respectively. The RF model exhibited high reliability and stability. By selecting the optimal samples through 10-fold cross-validation and screening analysis of dominant condition factors, a more efficient and accurate random forest landslide susceptibility assessment model could be built with fewer dominant condition factors. The construction of a landslide susceptibility prediction model through the random forest model was the focus of the present study. The results show that the introduction of the RF model could improve the accuracy and precision of hazard prediction and that the RF model could be used in regions or countries with the same topography and geological conditions. Furthermore, the RF model could contribute to the hazard assessment of construction sites in mountainous areas, thereby reducing the workload and improving efficiency in practice.

5.1.3. Suitability of Construction Land vs. Non-Construction Land

Construction land and non-construction land, as two types of land, have a significant influence on the development of towns and cities. A suitability assessment of construction land is used to classify and secure land requirements for urban development and to balance the development costs. A random forest model was utilized in this research to construct five levels of landslide susceptibility, to determine the safety class of the study area and to explore the suitability of construction land on the basis of hazard assessment. The high- and very high-susceptibility areas for landslide prediction were found to be significant components of non-construction land, primarily belonging to the production and mostly ecological areas. To maintain the overall ecological safety of the area, the regional scope of the non-construction land that needs to be protected is clarified from a “counter-planning” perspective [35]. By analyzing and investigating ecological processes, Yu [36] used an ecological safety pattern approach to calculate the spatial extent of non-construction land in order to delineate the ecological safety pattern level of the study area. The prohibited areas and the unsuitable areas in the suitability assessment of construction land in this research were mostly non-construction areas, whereas the basically suitable areas could be incorporated into construction land or non-construction land, which needs to be comprehensively delineated according to geological conditions. The more suitable areas and the most suitable areas were found to be the main components of construction land. The basic starting points for determining the suitability of construction land and non-construction land are considerably different. The suitability of non-construction land is assessed from the perspectives of ecological safety and economy, whereas the suitability of construction land is assessed from the viewpoints of urban development, the impact of natural disasters and social and economic influences on the land.

6. Conclusions

In this research, the suitability of land for construction in mountainous areas was evaluated based on landslide susceptibility, and an indicator system was constructed that considers the four dimensions of safety, nature, society and ecology. In response to the drawbacks of existing methods, an attempt was made to identity the factors of landslide susceptibility using machine algorithms based on the number and spatial location of each indicator. Through such means, the rating of suitability of land for construction in mountainous areas was explored. The case study of the foregoing evaluation framework and method was conducted in the Hechuan District of Chongqing. The research results were as follows:
(1)
The average accuracy of the tenfold cross-validation training set landslide data reached 0.978; the accuracy of the test set reached 0.913; the accuracy of the confusion matrix reached 97.2%; and the AUC values of the training test and all samples were 0.999, 0.756 and 0.989 respectively. The historical landslide sites in Hechuan District were mostly concentrated in highly susceptible areas, where the spatial areas of land with high landslide susceptibility and very high landslide susceptibility were 1.98 km2 and 2.22 km2, respectively, accounting for 2.47‰ and 6.53‰ of the study area. The areas with high landslide susceptibility were mainly concentrated in the south and southeast valleys and near the water system, whereas landslides were less frequent in the gentle hilly basin.
(2)
The suitability of land for construction in mountainous areas was found to be most influenced by landslide susceptibility, the distance from roads and the distance from built-up areas. Furthermore, the annual average rainfall, elevation and lithological factors were significant factors influencing landslides in such areas. The suitability of land for construction in mountainous areas near the main city was promoted by locational advantages and restricted by disasters.
(3)
Under the constraints of landslide susceptibility, the Hechuan District has considerable potential land reserves for construction in terms of more suitable areas and the most suitable areas (accounting for 61.01% of the study area) for construction. In terms of space, the more suitable and most suitable areas for construction were mainly distributed in the urban area, where the three rivers converge and the surrounding areas of small towns, showing a spatial distribution pattern characterized by a high central part and two low sides. The basically suitable areas for construction were mainly distributed at the buffer space on the periphery of the more suitable areas for construction.
Compared with existing research, the proposed evaluation indicator system and method with respect to the suitability of land for construction represent clear academic concepts, reflecting the essence and practical value of the suitability of land for construction in mountainous areas. The indicator system is simple and clearly structured with complete coverage, providing a basis for research and practice concerning the suitability of land for construction in other mountainous areas. The evaluation method is precise, easy, flexible and practical. In exploring a more accurate and convenient evaluation framework and method and extending the application scope of suitability evaluation in mountainous areas, the present study overcomes the issues encountered in previous research related to the suitability of land for construction in mountainous areas based on the perspective of disasters. However, the presented indicator system and evaluation method are only applicable to towns in mountainous areas with frequent disasters, and the validity thereof in other types of land and areas should be further verified.

Author Contributions

Conceptualization: J.Z.; Data curation: L.L. and X.C.; Formal analysis: R.L.; Funding acquisition: L.L. and D.S.; Investigation: L.L.; Methodology: J.Z.; Resources: L.L. Software: R.L.; Validation: D.S.; Visualization: X.C.; Writing—original draft: L.L. and X.C.; Writing—review and editing: J.Z. All authors have read and agreed to the published version of the manuscript.

Funding

This study was supported by the Science and Technology Research Program of Chongqing Municipal Education Commission (Grant No. KJQN202000525); Chongqing Graduate Research Innovation Project, Project Approval Number (Grant No. CYB22264); Natural Science Foundation of Chongqing (Grant No. CSTB2022NSCQ-MSX0594); Chongqing Natural Science Foundation (Grant No.cstc2020jcyj-msxmX0841).

Data Availability Statement

Not applicable.

Conflicts of Interest

The authors declare no conflict of interest.

References

  1. Pu, J.; Zhao, X.-Q.; Miao, P.-P.; Li, S.-N.; Tan, K.; Wang, Q.; Tang, W. Integrating multisource RS data and GIS techniques to assist the evaluation of resource-environment carrying capacity in karst mountainous area. J. Mt. Sci. 2020, 17, 2528–2547. [Google Scholar] [CrossRef]
  2. Cui, X.; Zhou, T.; Xiong, X.; Xiong, J.; Zhang, J.; Jiang, Y. Farmland Suitability Evaluation Oriented by Non-Agriculturalization Sensitivity: A Case Study of Hubei Province, China. Land 2022, 11, 488. [Google Scholar] [CrossRef]
  3. Tan, M.; Li, X.; Xie, H.; Lu, C. Urban land expansion and arable land loss in China—A case study of Beijing–Tianjin–Hebei region. Land Use Policy 2005, 22, 187–196. [Google Scholar] [CrossRef]
  4. Bagheri, M.; Zaiton Ibrahim, Z.; Mansor, S.; Manaf, L.A.; Akhir, M.F.; Talaat, W.I.A.W.; Beiranvand Pour, A. Land-Use Suitability Assessment Using Delphi and Analytical Hierarchy Process (D-AHP) Hybrid Model for Coastal City Management: Kuala Terengganu, Peninsular Malaysia. ISPRS Int. J. Geo-Inf. 2021, 10, 621. [Google Scholar] [CrossRef]
  5. Ustaoglu, E.; Aydınoglu, A.C. Suitability evaluation of urban construction land in Pendik district of Istanbul, Turkey. Land Use Policy 2020, 99, 104783. [Google Scholar] [CrossRef]
  6. Zhang, Y.; Chen, X. A Study on the Choices of Construction Land Suitability Evaluation of Ecological Index. Procedia Comput. Sci. 2016, 91, 180–183. [Google Scholar]
  7. Zhang, Y.; Wen, H.; Xie, P.; Hu, D.; Zhang, J.; Zhang, W. Hybrid-optimized logistic regression model of landslide susceptibility along mountain highway. Bull. Eng. Geol. Environ. 2021, 80, 7385–7401. [Google Scholar] [CrossRef]
  8. Sun, D.; Xu, J.; Wen, H.; Wang, Y. An Optimized Random Forest Model and Its Generalization Ability in Landslide Susceptibility Mapping: Application in Two Areas of Three Gorges Reservoir, China. J. Earth Sci. 2020, 31, 1068–1086. [Google Scholar] [CrossRef]
  9. Miao, F.; Zhao, F.; Wu, Y.; Li, L.; Xue, Y.; Meng, J. A novel seepage device and ring-shear test on slip zone soils of landslide in the Three Gorges Reservoir area. Eng. Geol. 2022, 307, 106779. [Google Scholar] [CrossRef]
  10. Miao, F.; Wu, Y.; Xie, Y.; Li, Y. Prediction of landslide displacement with step-like behavior based on multialgorithm optimization and a support vector regression model. Landslides 2017, 15, 475–488. [Google Scholar] [CrossRef]
  11. Taalab, K.; Cheng, T.; Zhang, Y. Mapping landslide susceptibility and types using Random Forest. Big Earth Data 2018, 2, 159–178. [Google Scholar] [CrossRef]
  12. Xie, P.; Wen, H.; Ma, C.; Baise, L.G.; Zhang, J. Application and comparison of logistic regression model and neural network model in earthquake-induced landslides susceptibility mapping at mountainous region, China. Geomat. Nat. Hazards Risk 2018, 9, 501–523. [Google Scholar] [CrossRef]
  13. Xu, K.; Kong, C.; Li, J.; Zhang, L.; Wu, C. Suitability evaluation of urban construction land based on geo-environmental factors of Hangzhou, China. Comput. Geosci. 2011, 37, 992–1002. [Google Scholar] [CrossRef]
  14. Sun, D.; Wen, H.; Xu, J.; Zhang, Y.; Wang, D.; Zhang, J. Improving Geospatial Agreement by Hybrid Optimization in Logistic Regression-Based Landslide Susceptibility Modelling. Front. Earth Sci. 2021, 9, 686. [Google Scholar] [CrossRef]
  15. Wang, Y.; Wen, H.; Sun, D.; Li, Y. Quantitative Assessment of Landslide Risk Based on Susceptibility Mapping Using Random Forest and GeoDetector. Remote Sens. 2021, 13, 2625. [Google Scholar] [CrossRef]
  16. Li, C.X.; Hong, Z.; Deliang, S.; Haijia, W.; Shuang, C. Evaluation of the suitability of rural settlement sites based on random forest algorithm: The case of Hechuan District, Chongqing. J. Chongqing Norm. Univ. 2022, 39, 93–104. [Google Scholar]
  17. Chongqing Hechuan District Bureau of Statistics. Hechuan District Statistical Yearbook; China Yinshi Press: Beijing, China, 2020; pp. 1–364.
  18. Liu, X.; Wang, Y.; Li, M. How to Identify Future Priority Areas for Urban Development: An Approach of Urban Construction Land Suitability in Ecological Sensitive Areas. Int. J. Environ. Res. Public Health 2021, 18, 4252. [Google Scholar] [CrossRef]
  19. Peng, J.; Ma, J.; Du, Y.; Zhang, L.; Hu, X. Ecological suitability evaluation for mountainous area development based on conceptual model of landscape structure, function, and dynamics. Ecol. Indic. 2016, 61, 500–511. [Google Scholar] [CrossRef]
  20. Huang, Y.; Zhao, L. Review on landslide susceptibility mapping using support vector machines. Catena 2018, 165, 520–529. [Google Scholar] [CrossRef]
  21. Reichenbach, P.; Rossi, M.; Malamud, B.D.; Mihir, M.; Guzzetti, F.J.E. A review of statistically-based landslide susceptibility models. Earth-Sci. Rev. 2018, 180, 60–91. [Google Scholar] [CrossRef]
  22. Chen, D.; Pan, Y.; Jin, X.; Du, H.; Li, M.; Jiang, P.J. The delineation of ecological redline area for catchment sustainable management from the perspective of ecosystem services and social needs: A case study of the Xiangjiang watershed, China. Ecol. Indic. 2021, 121, 107130. [Google Scholar] [CrossRef]
  23. Sun, D.; Wen, H.; Wang, D.; Xu, J. A random forest model of landslide susceptibility mapping based on hyperparameter optimization using Bayes algorithm. Geomorphology 2020, 362, 107201. [Google Scholar] [CrossRef]
  24. Xu, W.; Yu, W.; Jing, S.; Zhang, G.; Huang, J. Debris flow susceptibility assessment by GIS and information value model in a large-scale region, Sichuan Province (China). Nat. Hazards 2013, 65, 1379–1392. [Google Scholar] [CrossRef]
  25. Zhang, X.; Fang, C.; Wang, Z.; Ma, H. Urban construction land suitability evaluation based on improved multi-criteria evaluation based on GIS (MCE-GIS): Case of New Hefei City, China. Chin. Geogr. Sci. 2013, 23, 740–753. [Google Scholar] [CrossRef]
  26. Schapire, R.E. Random forests. Mach. Learn. 2001, 45, 5–32. [Google Scholar]
  27. Sun, D.; Xu, J.; Wen, H.; Wang, D. Assessment of landslide susceptibility mapping based on Bayesian hyperparameter optimization: A comparison between logistic regression and random forest. Eng. Geol. 2021, 281, 105972. [Google Scholar] [CrossRef]
  28. Saaty, T.L. Decision making with the analytic hierarchy process. Int. J. Serv. Sci. 2008, 1, 83–98. [Google Scholar] [CrossRef]
  29. Saaty, T.L. What is the analytic hierarchy process? In Mathematical Models for Decision Support; Springer: Berlin/Heidelberg, Germany, 1988; pp. 109–121. [Google Scholar]
  30. Yan, Y.; Zhang, Y.; Sharma, A.; Al-Amri, J.F. Evaluation of suitability of urban land using GIS technology. Sustainability 2021, 13, 10521. [Google Scholar] [CrossRef]
  31. Liu, Y.; Deng, W.; Peng, L. The coupling mechanism between the suitable space and rural settlements considering the effect of mountain hazards in the upper Minjiang River basin. J. Mt. Sci. 2020, 17, 2774–2783. [Google Scholar] [CrossRef]
  32. Wang, Y.; Jin, C.; Lu, M.; Lu, Y. Assessing the suitability of regional human settlements environment from a different preferences perspective: A case study of Zhejiang Province, China. Habitat Int. 2017, 70, 1–12. [Google Scholar] [CrossRef]
  33. Zhou, X.; Wen, H.; Li, Z.; Zhang, H.; Zhang, W. An interpretable model for the susceptibility of rainfall-induced shallow landslides based on SHAP and XGBoost. Geocarto Int. 2022; 1–27, (just-accepted). [Google Scholar]
  34. Zhou, X.; Wen, H.; Zhang, Y.; Xu, J.; Zhang, W. Landslide susceptibility mapping using hybrid random forest with GeoDetector and RFE for factor optimization. Geosci. Front. 2021, 12, 101211. [Google Scholar] [CrossRef]
  35. Zhang, R.; Wang, D.; Ai, D.; Sun, W.; Hou, Z. Suitability evaluation of urban land development based on niche and anti-planning. Trans. Chin. Soc. Agric. Eng. 2018, 34, 258–264. [Google Scholar]
  36. Yu, K.; Li, D.; Li, C. Ecological Security Patterns and Urban Growth Scenarios in Beijing. Acta Ecol. Sin. 2009, 29, 1189–1204. [Google Scholar]
Figure 1. Topographic map of Hechuan District.
Forests 13 01621 g001
Figure 2. Flow chart of the study.
Forests 13 01621 g002
Figure 3. Schematic diagram of the RF algorithm.
Forests 13 01621 g003
Figure 4. ROC curves and AUC values.
Forests 13 01621 g004
Figure 5. Landslide susceptibility zoning in Hechuan District.
Forests 13 01621 g005
Figure 6. Suitability evaluation map of construction land in Hechuan District.
Forests 13 01621 g006
Figure 7. Ranking the importance of factors influencing the suitability of construction.
Forests 13 01621 g007
Figure 8. Ranking the importance of factors influencing landslide susceptibility.
Forests 13 01621 g008
Table 1. Data and data sources for landslide susceptibility zoning.
DataSourceTypeAccuracy
Historical landslideChongqing Geological Monitoring StationData table
DEMAster satelliteRaster data30 m
GeologicalNational Geological Archives Data CenterRaster data1:200,000
Land useGeographical Information Monitoring Cloud PlatformVector1:100,000
AdministrativeGeographical Information Monitoring Cloud PlatformVector1:100,000
River networkChongqing Water Resources BureauVector1:100,000
Yearly average rainfallGeographical Information Monitoring Cloud PlatformRaster data30 m
RoadResource and Environment Science and Data Center Vector1:100,000
Satellite imageGeospatial Data Cloud PlatformRaster data30 m
POIWeb crawlersData table
Rural settlementsLand Change Investigation DatabaseRaster data30 m
Urban built-up areaGeographical Information DatabaseRaster data30 m
Ecological red line areaChongqing Ministry of Natural ResourcesRaster data30 m
Table 2. Classification of factors influencing landslide susceptibility.
TypeImpact FactorNumber of ClassificationsClassification Thresholds or Criteria
Terrain topographyElevation (m)101. <241; 2. 241~279; 3. 279~316; 4. 316~355; 5. 355~398; 6. 398~461; 7. 461~545; 8. 545~679; 9. 679~902; 10. >902
Slope (°)91. <5; 2. 5~10; 3. 10~15; 4. 15~20; 5. 20~25; 6. 25~30; 7. 30~35; 8. 35~40; 9. >40
Degree of relief (m)71. <20; 2. 20~30; 3. 30~40; 4. 40~50; 5. 50~80; 6. 80~120; 7. >120
Aspect91. south; 2 southwest; southeast; 3. east; west; northwest; northeast; 4. north; 5. none
Slope position61. ridge; 2. upper slope/cliff edge; 3. mid-slope; 4. flats slope; 5. down slope/cliff base; 6. valley floor
Micro landform101. canyons, deeply incised streams; 2. mid-slope drainages, shallow valleys; 3. upland drainages, headwaters; 4. U-shaped valleys; 5. plains; 6. open slopes; 7. upper slopes, mesas; 8. local ridges, hills in valleys; 9. mid-slope ridges, small hills in plains; 10. mountain tops, high narrow ridges
Synthetic curvature61. <−1; 2. −1~−0.5; 3. −0.5~0; 4. 0~0.5; 5. 0.5~1; 6. >1
Profile curvature61. <−1; 2. −1~−0.5; 3. −0.5~0; 4. 0~0.5; 5. 0.5~1; 6. >1
Plan curvature61. <−1; 2. −1~−0.5; 3. −0.5~0; 4. 0~0.5; 5. 0.5~1; 6. >1
TRI51. <1.05; 2. 1.05~1.1; 3. 1.1~1.15; 4. 1.15~1.2; 5. >1.2
TWI51. <4; 2. 4~6; 3. 6~8; 4. 8~10; 5. >10
Geological conditionsSlope type71. type I antegrade/inclined slope; 2. oblique slope; 3. oblique slopes; 4. cross slopes; 5. reverse slope; 6. type II forward/outward slopes; 7. flat slopes
Distance from fault (m)71. <500; 2. 500~1000; 3. 1000~1500; 4. 1500~2000; 5. 2000~2500; 6. 2500~3000; 7. >3000
Lithology81. Tlf-j; 2. P; 3. T21; 4. T3xj; 5. Jlz-2x; 6. J3sn; 7. Qp; 8. J2s
Environmental conditionsDistance from rivers (m)71. <100; 2. 100~200; 3. 200~300; 4. 300~400; 5. 400~500; 6. 500~600; 7. >600
Rainfall (mm)81. <1131; 2. 1131~1160; 3. 1160~1186; 4. 1186~1210; 5. 1210~1233; 6. 1233~1266; 7. 1266~1316; 8. >1316
Land cover91. woodland; 2. cultivated land; 3. water area and water conservancy facilities land; 4. woodland; 5. industrial and mining storage land; 6. garden plot; 7. other land; 8. land used for construction; 9. transportation land use
NDVI61. <0.10; 2. 0.10~0.15; 3. 0.15~0.20; 4. 0.20~0.25; 5. 0.25~0.30; 6. >0.30
Meteorological hydrologySTI61. <20; 2. 20~40; 3. 40~70; 4. 70~100; 5. 100~200; 6. >200
SPI71. <15; 2. 15~30; 3. 30~45; 4. 45~60; 5. 60~100; 6. 100~1000; 7. >1000
Human activityDistance from roads (m)71. <100; 2. 100~200; 3. 200~300; 4. 300~400; 5. 400~500; 6. 500~600; 7. >600
POI kernel density71. <1; 2. 1~2; 3. 2~3; 4. 3~4; 5. 4~5; 6. 5~10; 7. >10
Table 3. Classification of contributing elements for construction land suitability evaluation.
FactorImpact Number of LevelsClassification Threshold or CriteriaReasons for ClassificationRemarks
SafetyLandslide susceptibility51. very low; 2. low; 3. medium; 4. high; 5. very highExpert experience (A)The results of the landslide susceptibility assessment were combined with five levels of classification with reference to previous studies [23].
NatureElevation (m)51. <270; 2. 270~335; 3. 335~447; 4. 447~709; 5. 709~1370Natural breakpoints (B)The natural breakpoint method maximises the difference between classes, and the breakpoint itself is a suitable boundary for grading [24].
Slope (°)51. <3; 2. 3~8; 3. 8~15; 4. 15~25; 5. >25Expert experience (A)Slope classification with reference to Principles of Urban Planning (3rd edition) and previous studies [5].
Degree of relief (m)51. 11; 2. 11~20; 3. 20~31; 4. 31~46; 5. 46~125Natural breakpoints (B)Ibid.
Aspect (°)51. south; 2. southwest, southeast; 3. east, west, northwest, northeast; 4. north; 5. noneProprietary classification (C)None
Distance from rivers (m)51. <300; 2. 300~500; 3. 500~1000; 4. 1000~1500; 5. >1500Expert experience (A)Classification based on expert experience and relevant research [25].
Land cover 51. lands for construction; 2. grassland and unused lands; 3. shrub; 4. forest land and cultivated land; 5. waters, beaches, and basic farmlandProprietary classification (C)None
Distance from roads (m)51. <200; 2. 200~400; 3. 400~500; 4. 500~600; 5. >600Natural breakpoints (B)The distance of the road from the built-up area was taken into account on the basis of natural breakpoints.
NDVI51. <0.10; 2. 0.10~0.15; 3. 0.15~0.20; 4.0.20~0.30; 5. >0.30 Natural breakpoints (B)As aboved,
NDVI = 0 indicates rocky or bare soil that is not suitable for building. NDVI is graded less than 0.1 for bare land, NDVI less than 0.3 for low vegetation cover and suitable for building, and between 0.1 and 0.3 according to the percentage of area in each zone.
SocietyDistance from rural settlements (m)51. <500; 2. 500~1000; 3. 1000~2000; 4. 2000~3000; 5. >3000Natural breakpoints (B)The classification is based on the spatial distribution of the percentage of patches in rural settlements combined with natural breakpoints.
Distance from built-up areas (m)51. <500; 2. 500~1000; 3. 1000~2000; 4. 2000~3000; 5. >3000Natural breakpoints (B)On the basis of known patch sizes of built-up land, combined with natural breakpoints for delineation.
EcologyEcological red line area (nature reserve/important water-conservation sites)1constructive expansion prohibited zoneProprietary classification (C)Designated as a no-build zone.
Table 4. Table of confusion matrices.
ModelsTrue ValueAccuracy
Landslide (1)Non-Landslide (0)
Predicted valueLandslide (1)TPFPAccuracy
Non-landslide (2)TNFNAccuracy
Recall rateRecall rateTotal accuracy
Table 5. Formulae.
Table 5. Formulae.
FormulaSignificance
Accuracy ACC Accuracy = T P + T N T P + T N + F P + F N Share of all correctly judged results of the classification model among the total number of observations
Accuracy PPV Precision = T P T P + F P Of all the results for which the model prediction is positive, the proportion of model predictions that are correct
Sensitivity TPR Sensitivity = Rec = T P T P + F N Weight of model prediction pairs among all results for which the true value is positive
Specificity TNR Specificity = T N T N + F P The proportion of model predictions that are correct among all results for which the true value is negative
Table 6. Confusion matrix of RF.
RF Predicted ValueTrue ValueAccuracy
LandslidesNon-Landslide
Landslides5280Accuracy: 1
Non-landslide2267507Accuracy: 0.971
Recall rate: 0.700Recall rate: 1Accuracy: 0.972
Table 7. Statistical table of landslide susceptibility classification.
Probability
of Landslide
Susceptibility LevelGridsArea Ratio
%
LandslidesLandslide Ratio
%
Landslide
Density/(Pcs/km2)
<0.06Extremely low1,175,38945.91415.440.039
0.06~0.14Low791,08330.67749.810.104
0.14~0.24Medium373,73614.418010.610.238
0.24~0.38High174,7186.539112.070.579
>0.38Extremely high63,6342.4746862.078.172
Table 8. Construction land suitability index factor weights.
IndexWeight
Landslide0.33377
Distance to built-up areas0.09437
Distance to rural settlements0.04719
Slope0.09307
Distance from rivers0.09232
Distance to roads0.12069
NDVI0.08149
Land cover0.06794
Relief degree0.02743
Aspect0.02493
Elevation0.01682
Table 9. Results of hierarchy analysis of suitability of construction land.
ItemEigenvectorWeight ValueMaximum EigenvalueCI Value
Safety1.00133.377%3.0540.027
Nature1.57452.468%
Society0.42514.156%
Table 10. AHP results for social factors.
ItemEigenvectorWeight ValueMaximum EigenvalueCI Value
Elevation0.2573.206%8.9590.137
Relief degree0.4185.227%
Aspect0.384.751%
Distance from rivers1.40817.596%
Land cover1.03612.949%
NDVI1.24215.531%
Distance to roads1.8423.002%
Slope1.41917.738%
Table 11. AHP results for natural factors.
ItemsEigenvectorWeight ValueMaximum EigenvalueCI Value
Distance to rural settlements0.66733.333%20
Distance to built-up areas1.33366.667%
Publisher’s Note: MDPI stays neutral with regard to jurisdictional claims in published maps and institutional affiliations.

