Article

Influence of Water Limitation and Provenance on Reproductive Traits in a Common Garden of Frangula alnus Mill.

by
Kristine Vander Mijnsbrugge
*,
Marc Schouppe
,
Stefaan Moreels
,
Yorrick Aguas Guerreiro
,
Laura Decorte
and
Marie Stessens
Department of Forest Ecology and Management, Research Institute for Nature and Forest, 9500 Geraardsbergen, Belgium
*
Author to whom correspondence should be addressed.
Forests 2022, 13(11), 1744; https://doi.org/10.3390/f13111744
Submission received: 23 September 2022 / Revised: 14 October 2022 / Accepted: 19 October 2022 / Published: 22 October 2022
(This article belongs to the Section Forest Ecology and Management)

Abstract

:
Drought periods during the growing season will increase and intensify in Western Europe due to climate change. To better understand the consequences for woody perennials, we restricted watering of potted cuttings of Frangula alnus Mill. in a common garden setting in Belgium during the growing season of 2020. We focused on the responses of three provenances (Belgian, Italian and Swedish) for several reproductive traits in the year of the water limitation. F. alnus, as a shrub species, bears fruits fast. It can blossom on current season’s growth and can therefore produce ripened berries continuously during several months. The total berry count across the whole growing season was much lower in the water-limited plants, independent of the provenance. The local Belgian provenance produced more ripened berries in total than the Italian and Swedish provenances, both in the water-limited plants as in the control plants. Maximal berry production occurred in July. The control plants from the Belgian and Italian provenances displayed a second lower maximum in August. Mainly the Swedish provenance displayed a clear advancement of the maximum berry production among the water-limited plants in comparison to the control plants. Slight differences were detected in the average stone count per berry and in the average stone weight, with both traits displaying a single maximum through time. The Swedish provenance displayed the highest average stone count per berry and the Belgian provenance had the lightest average stone weight, both likely attributable to local adaptation. Remarkably, both stone traits were not affected by the water limitation. Results are discussed in the context of several drought response mechanisms including drought escape, drought avoidance, compensation growth, growth/reproduction trade-off and seed size/number trade-off.

1. Introduction

Warming of the climate increases evapotranspiration and leads to more intense extreme climatic events such as droughts [1]. Due to climate change, drought stress is predicted to become more challenging for the fitness and survival of plant populations and ecosystems in general, and thus for the primary productivity and biodiversity worldwide [2,3,4]. Chronic water deficiency due to drought is life threatening to plants, and increased drought intensity and duration have already led to mortality in forests [5,6]. A decreasing availability of water leads to drought stress and reduces the fitness of trees [7], in turn augmenting the susceptibility to other (a)biotic disturbances [8,9]. Studying plant responses to drought stress may help in predicting the resulting changes in natural ecosystems. The speed in which the current climate change occurs is unprecedented [10]. Therefore, a better understanding of the adaptive capacity of tree and shrub species is necessary [11].
Although information on interspecific variability in functional traits that play a role in heat and drought tolerance in trees may help in predicting putative future shifts in species composition of forest ecosystems, these traits also vary within species [12,13]. Forest tree species generally have large natural ranges, and local populations are assumed to have adapted to a part of the climatic niche of the species [14]. Common garden experiments are suitable for the study of adaptive genetic variation among tree populations originating from different home-sites within the natural range of the species [15,16]. In these types of experiments, different populations from the diverse origins are grown together in the same environment so that observed population differentiation in traits have a genetic basis.
Provenances originating from xeric growth sites may be better adapted to higher temperatures and a drier environment than those from more humid sites. In a provenance trial of Quercus petraea (Matt.) Liebl., the provenance with a more xeric origin displayed less plasticity in shoot, root and leaf traits during water-limited growth conditions, and this was suggested to be a stronger adaptation to drought [17]. In a common garden of Fagus sylvatica L., a better drought adaptation was suggested for the marginal provenances [18]. On the other hand, climate at the home-sites could not be correlated to the drought response in different provenances of three European oak species [19]. Additionally, in conifers some results can be mentioned. In a common garden of Picea glauca (Moench) Voss., provenances from drier origins grew faster and also displayed a better resilience (capacity for post-drought recovery) to extreme droughts when compared with provenances originating from more humid environments [20]. Tree ring analysis in Pinus pinaster Ait. showed that populations growing in a drier environment displayed not only a stronger growth reduction during water shortage, but also a faster recovery after the water limitation [21]. Little information is available for shrub species. However, counter to expectation, a southern European provenance of Frangula alnus Mill. (warmer climate) suffered more from drought stress in a common garden experiment than two provenances from more northerly located origins [22].
Drought stress causes physiological disorders such as a decrease in carbon and nutrient assimilation and at a certain point also a breakdown of the photosynthetic tissues [8]. In the conducting tissues severe drought leads to embolism, when air bubbles disrupt the sap flow. Damaged tissues and embolized conduits have to be repaired, consuming stored carbohydrates, which may delay the post-drought growth recovery [8]. Already in 1929, it was known that short summer droughts in Germany reduced the height growth of P. abies (L.) Karst. and other tree species, and that repeated summer droughts resulted in diminished stem growth during several years, with significant losses of increment [23]. In general, drought experiments in common gardens of woody species focus on responses of vegetative traits such as survival, growth and phenology and less on reproductive traits, as trees only start flowering and fruiting after several years. Nevertheless, reproduction is a key component of the resilience in forest ecosystems. Recruitment leads to the next generation of trees and therefore regulates the structure and composition of future forest ecosystems [24]. Studying the influence of drought stress on fruit and seed development in woody species will help understanding how forests can recover. Recent studies demonstrate a lack of consistency in long term response of seed production to drought [24]. Many tree species are characterized by mast seeding, which is a synchronous high inter-annual variation in seed production among individuals and populations [25]. Masting in Q. ilex L. was shown not only to be regulated by endogenous rhythms but mainly by physiological responses to variable environments [26,27]. Limited resources may trigger trade-offs between reproduction and growth in plants, and these allocation patterns can be adapted in response to stress [28]. In F. sylvatica L., a trade-off between growth and reproduction was found to be dependent on summer droughts, with a stronger trade-off in years with more stressful drought conditions [29]. A higher seed production in Q. ilex and Arbutus unedo L. concurred with a stronger decrease in growth in rainfall-reduction plots compared with control plots, suggesting that these species were able to maintain their fecundity in water limiting conditions by shifting their allocation of resources away from growth [30].
Here, we present a common garden experiment of the woody perennial F. alnus (glossy buckthorn) that was exposed to water limitation in 2020, and we focused on plant responses in reproductive traits. F. alnus is a common insect-pollinated and bird-dispersed shrub species (height up to 5 m) without any economic usage [31]. It has a wide distribution range throughout Europe. Shrubs reach fruit bearing age quickly and are characterized by a long flowering time as flowers can blossom on current season’s growth. In Belgium, the berries of F. alnus ripen at the end of June until September. Berries have two to three stones with each stone containing one seed. Fruit production is abundant each year. We hypothesized that (i) the berry and stone traits in the common garden differ between the three provenances and that these differences reflect adaptation to the home-site conditions of the respective provenances, and that (ii) water limiting conditions influence the berry and stone traits in a provenance dependent way.

2. Materials and Methods

2.1. Plant Material and Application of Water Limitation

The origin of the three provenances in the common garden of F. alnus has been described before [32]. In short, berries were collected in 2011 from different mother shrubs in three natural populations: in Famelunga, Italy (lat.:43.12181, lon.: 11.17654), in Heist-op-den-Berg, Belgium (lat.: 51.08424, lon.: 4.793124) and in Ottsjön, Sweden (lat.: 62.44210, lon.: 17.23451) (Figure 1). The Italian, Belgian and Swedish home-sites are characterized by an annual mean temperature of 13.7 °C, 10.1 °C and 2.9 °C, an annual precipitation of 706 mm, 785 mm and 682 mm, a maximum temperature of the warmest month of 28.4 °C, 22.3 °C and 19.9 °C and a minimum temperature of the coldest month of 2.7 °C, −0.3 °C and −13.3 °C, respectively (data from WorldClim [33]). The Italian home-site has a comparably lower precipitation during the growing season (precipitation of the warmest quarter: 150 mm, 202 mm and 202 mm for the Italian, Belgian and Swedish provenances, respectively).
Seeds germinated and potted plants were grown in the nursery of the Research Institute of Nature and Forest in Geraardsbergen, Belgium, following standard nursery techniques and using standard nursery materials. Plants (8 from Italy, 9 from Belgium and 12 from Sweden, all from different mother shrubs) were planted in a field trial in Gijzenzele, Belgium, with the plants individually intermingled at random (single tree plot design) in 2014. From these shrubs, 4 cuttings per plant (ramets) were taken in May 2016. The cuttings rooted in trays under transparent plastic. These cuttings were different from the cuttings described in Vander Mijnsbrugge et al. [22], so the plants were not used in any experiment yet. Each cutting was transferred to a 1 L pot (12 × 11 × 11 cm) using standard potting soil (organic matter 20%, pH 5.0–6.5, Electrical Conductivity (EC): 450 µS/cm, dry matter 25%, fertilization: 1.5 kg/m3 powdered compound fertilizer NPK 12 + 14 + 24) in the spring of 2017 and was further grown without additional fertilization on an outdoor container field (designed for growing plants in pots) with automatic sprinklers. A total of 116 plants (32 from Italy, 36 from Belgium and 48 from Sweden) were individually intermingled at random on the container field (single tree plot design). In May 2018, all plants were pruned at 10 cm above soil level. In the winter of 2018, all plants were transferred to 4 L pots using the same standard nursery potting soil, intermingled at random and placed again on a container field at the Research Institute for Agriculture and Fisheries, Melle, Belgium. At the end of the growing season of 2019, all the plants were again pruned at 10 cm above soil level.
On the 14th of May 2020, the pots on the container field were divided in two groups with each one containing 2 ramets per genotype. In each group, all plants were individually mingled at random. The control group was watered manually by experienced technicians according to the visually assessed needs, whereas the treatment group was not. On the 3rd of June 2020 several plants in the treatment group displayed drought symptoms (wilting leaves) and it was decided to water the treatment group once to avoid plant losses. This rescue watering was not necessary anymore later on in the growing season. The drought symptoms were visually scored on this day with score 0 being a healthy plant, score 1 a plant with wilting leaves and score 2 a plant with severe wilting leaves.
Daily minimum and maximum temperatures and daily precipitation in Melle are shown in Figure S1a,b.

2.2. Measurements, Counts and Phenological Observations

All pots were weighted on the 14th of May 2020 at the start of the experiment. Subsequently, pots were weighted on a regular basis till the end of August 2020 (20th and 28th of May, 3rd, 12th, 17th and 26th of June, 2nd, 9th, 20th and 30th of July, 6th and 21st of August). Weighting of the pots was performed as a proxy for the water loss.
Three vegetative traits were recorded: height growth in 2020 and the timing of bud burst and leaf senescence in this year. As the plants were pruned at the end of the growing season of 2019, the height of the plants at the end of 2020 indicated the increment growth of 2020. The progress of bud burst was recorded using a 5-level scoring protocol with 1: buds in winter rest, 2: swollen buds, 3: first green leaves emerging from the buds, but not yet unfolding, 4: up to 50% unfolded leaves; 5: 50%–100% of the leaves unfolded. Plants were scored on the 14th and the 27th of April 2020. Leaf senescence was recorded following a 5-level scoring protocol with 1: leaves green, 2: leaves light green, 3: leaves turning to yellow, 4: leaves fully yellow, 5: leaves falling off. Plants were scored on the 21st of September and on the 12th and 26th of October 2020.
To study the generative traits, ripened berries were picked as soon as some plants were producing them. Fully ripened berries of F. alnus have a purple-black color. Berries ripened continuously during the growing season. The first collection date was on the 26th of June. After that, all ripened berries were picked on a regular basis (29th of June, 3rd, 9th, 16th, 23rd and 29th of July, 6th, 21st and 27th of August) until the last berry. Berries were counted and kept separate for every shrub and for every collection day. Collected berries (per shrub and per collection day) were squashed onto a sheet of kitchen towel and the skin and flesh were cleaned away to expose the bare stones. Mature and visually healthy stones (per shrub and per collection day) were air dried for a few days, counted and weighted. The average number of stones in a single berry was calculated by dividing the number of stones per shrub and per collection day by the number of berries per shrub and per collection day. The average stone weight was calculated by dividing the weight of the stones per shrub and per collection day by the count of stones per shrub and per collection day.

2.3. Statistical Analysis

All statistical analyses were performed in the open-source software R (version 3.6.1, Vienna, Austria) [35].
Mixed models were applied to the data. In the fixed part of the models, the variable D indicated the day on which the mother shrubs were scored (phenological observations) or the berries were collected, the variable P indicated the provenance of the mother shrubs (categorical variable with the levels “Be” for Belgian, “It” for Italian and “Sw” for Swedish) and T indicated the water withholding treatment in the growing season of 2020 (categorical variable with the levels “control” and “drought”).
The height of the mother shrubs, the average number of stones in a berry and the average stone weight were the response variables that were modeled with linear mixed models using the package lme4 [36].
The total number of berries for every shrub summed over the whole growing season, and the number of berries for every shrub on the different collection days, were two count variables. Therefore, Poisson models were fit using the package nlme [37].
The phenological scores for bud burst and leaf senescence belonged to an ordinal data type, having ordered levels. The data were modeled with cumulative logistic regression in the R package ordinal [38]. The cumulative probability (p) is the chance to have reached a given score of the phenological variable or a score below this given score, which is the chance to have maximally reached this given score. The bud burst scores were ordered in a reversed way, from the end of the developmental phase to the beginning, which was from fully unfolded leaves up to buds in winter rest (from 5 to 1). The leaf senescence scores were ordered in a normal chronological way, from green leaves to yellow leaves that were falling off (from 1 to 5). The reversed order of the bud burst scores allowed an easier understanding and interpretation of the modeled probabilities. A probability of having reached maximally a bud burst score of, e.g., 3 when the scores are ordered from 5 to 1 is the probability of having reached a score of 5, 4, or 3. Plants with an early bud burst timing have a higher score at a given time and therefore also have a higher modeled probability of having reached a score of 5, 4, or 3.
A unique identity code for every genotype, and a unique identity code for every ramet within a genotype, were present in the random part of the models.
Bud burst was modeled:
log(p1/(1-p1)) = αTrp1–βPp1P–βDp1D
Leaf senescence was modeled:
log(p2/(1-p2)) = αTrp2–βPp2P–βDp2D–βTp2T
In both above formulae, αTr is the estimated threshold value for passing on from one score of the bud burst or leaf senescence variable to the next. As the bud burst occurred before the water limiting treatment, the covariate treatment (T) is not present in this model.
Plant height was modeled:
H = αH + βPHP + βTHT
The total number of berries per shrub summed over the whole growing season was modeled:
log(Bgs) = αBgs + βPBgsP + βTBgsT + βPTBgsPT
A significant interaction term between provenance (P) and treatment (T) indicated that the relative difference in berry count between the provenances depended on the water withholding treatment.
The number of berries for every shrub on the different collection days was modeled for every provenance separately, to reduce complexity of the models (3 models):
log(B) = αB + βDBD + βD2BD2 + βD3BD3 + βD4BD4 + βTBT + βDTBDT + βDT2BD2T + βDT3BD3T + βDT4BD4T
A polynomial to the 4th degree was necessary for the covariate day of berry collection (D) in the model, as the raw data indicated the presence of two peaks over time (bimodal). A significant interaction term between day of berry collection and treatment indicated that the effect of the treatment on the berry count varied over time.
The average number of mature stones in a berry was modeled:
Sn = αSn + βPSnP + βTSnT + βDSnD + βD2SnD2
The average weight of a mature stone was modeled:
Sw = αSw + βPSwP + βTSwT + βDSwD + βD2SwD2
A polynomial to the 2nd degree was necessary for the covariate day of berry collection (D) in the models of the stone traits, as the raw data indicated the presence of a peak over time.

3. Results

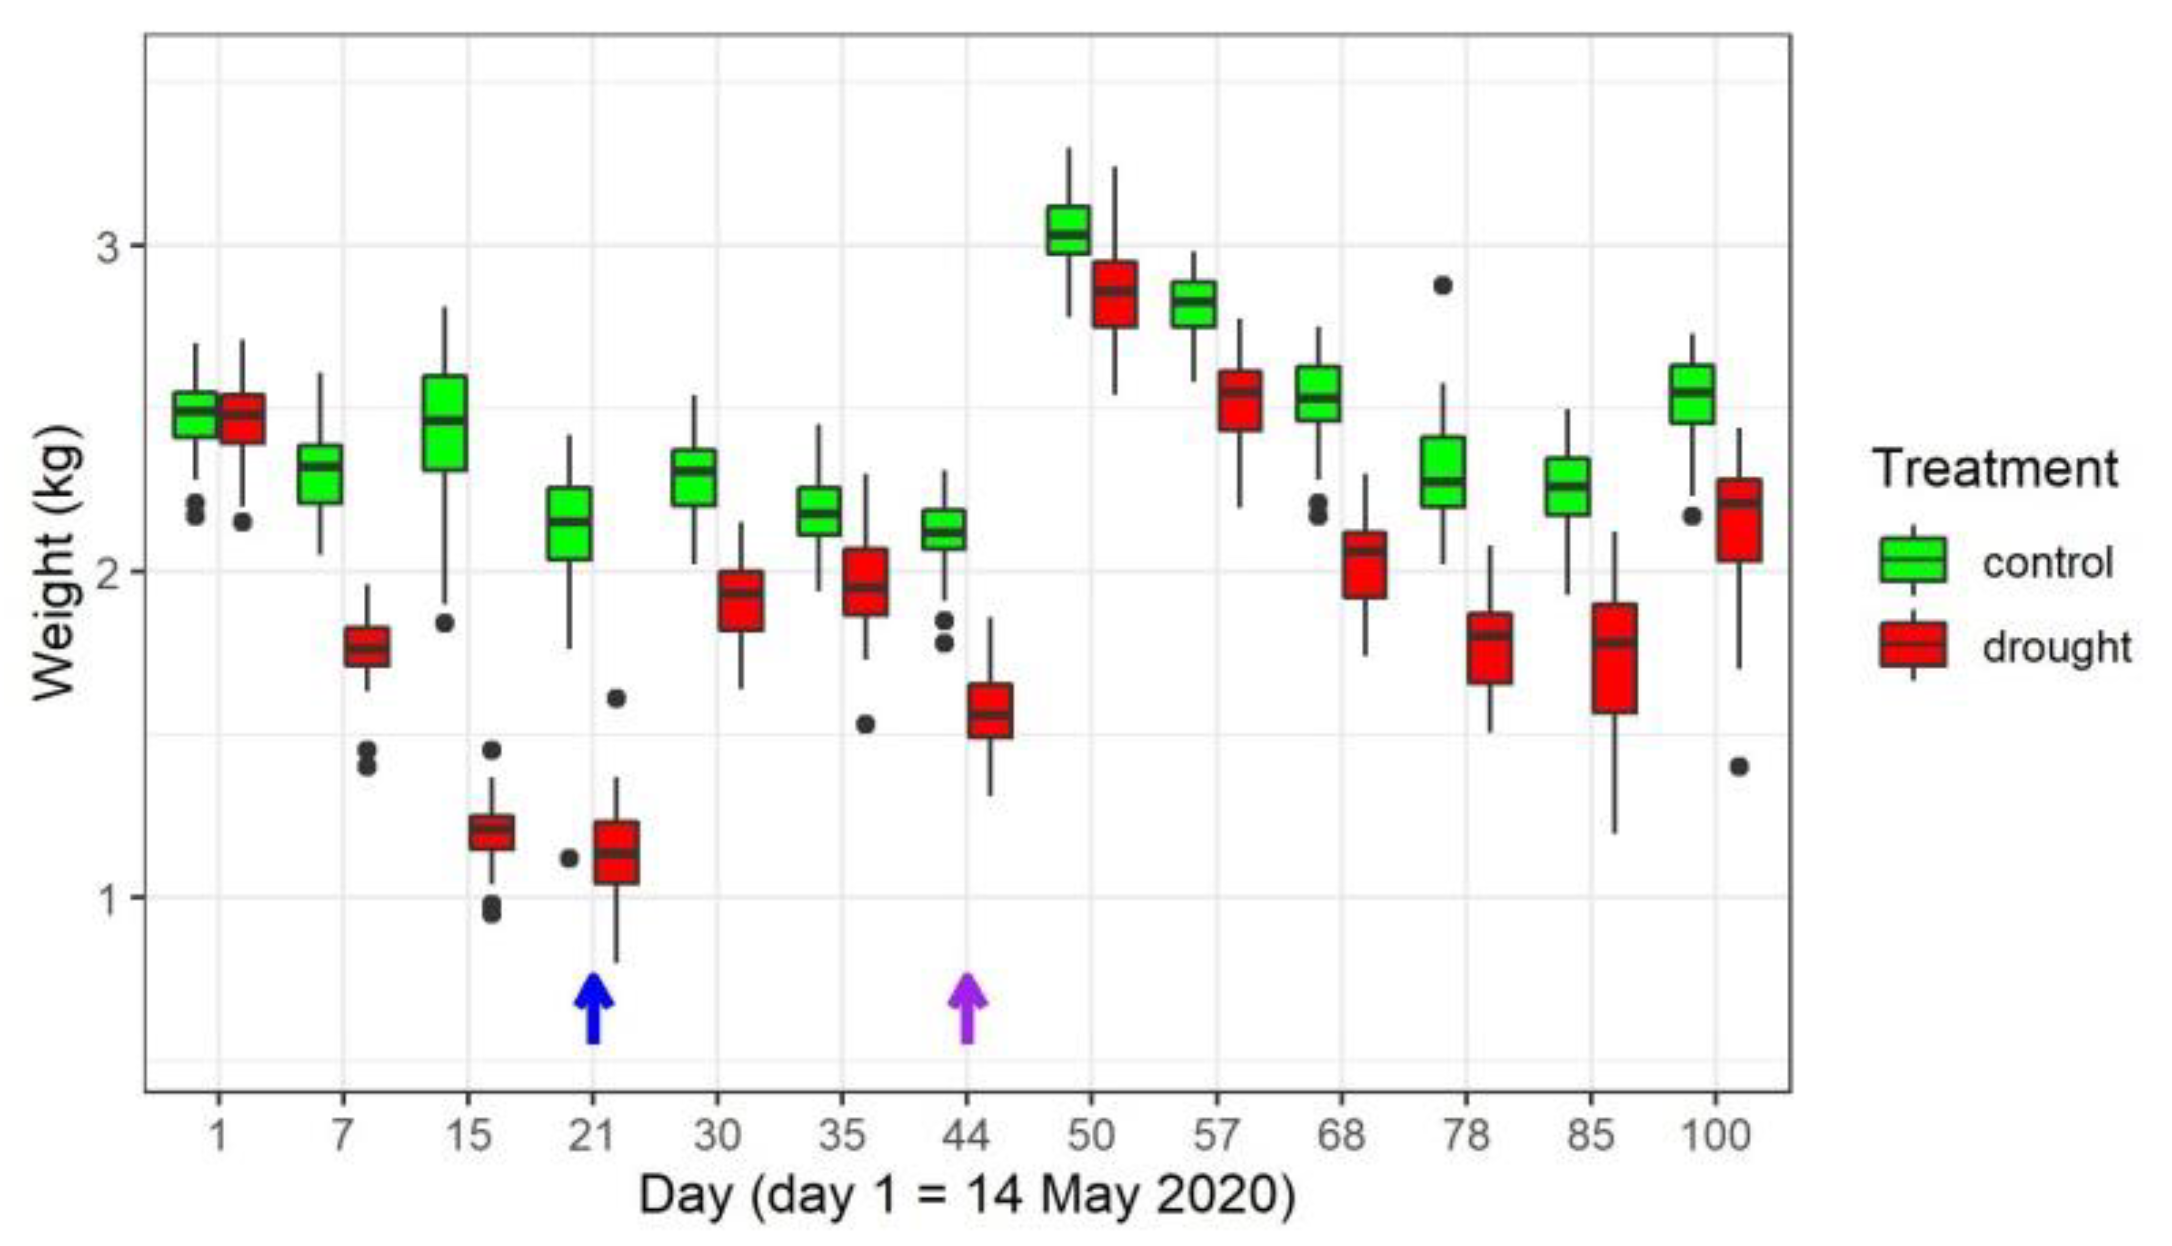
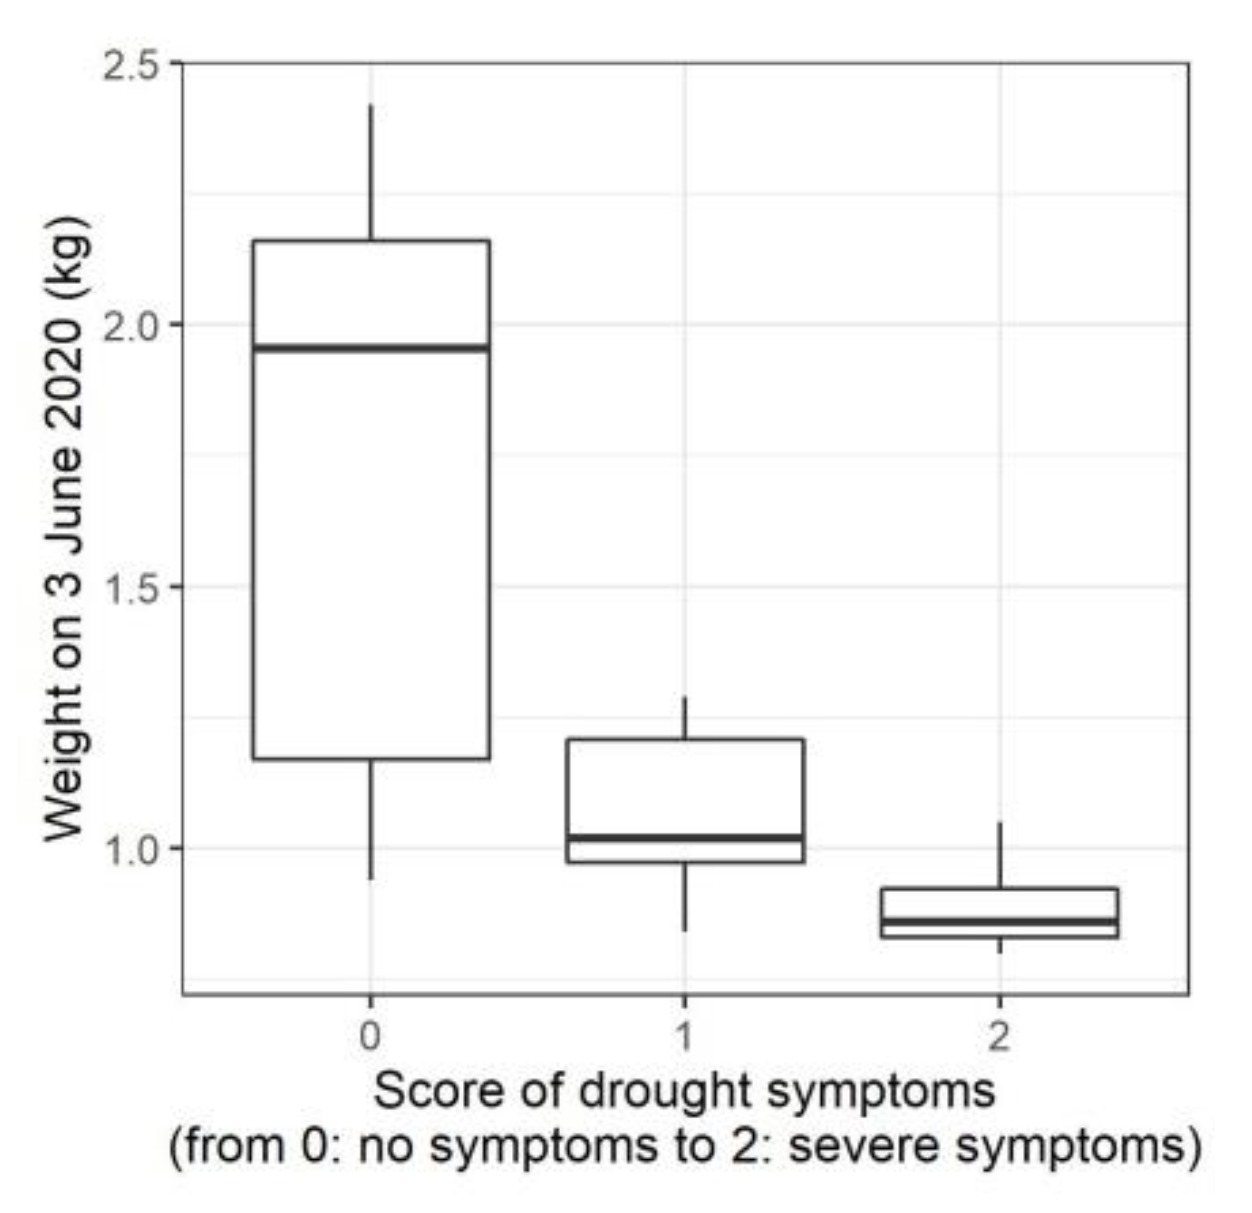
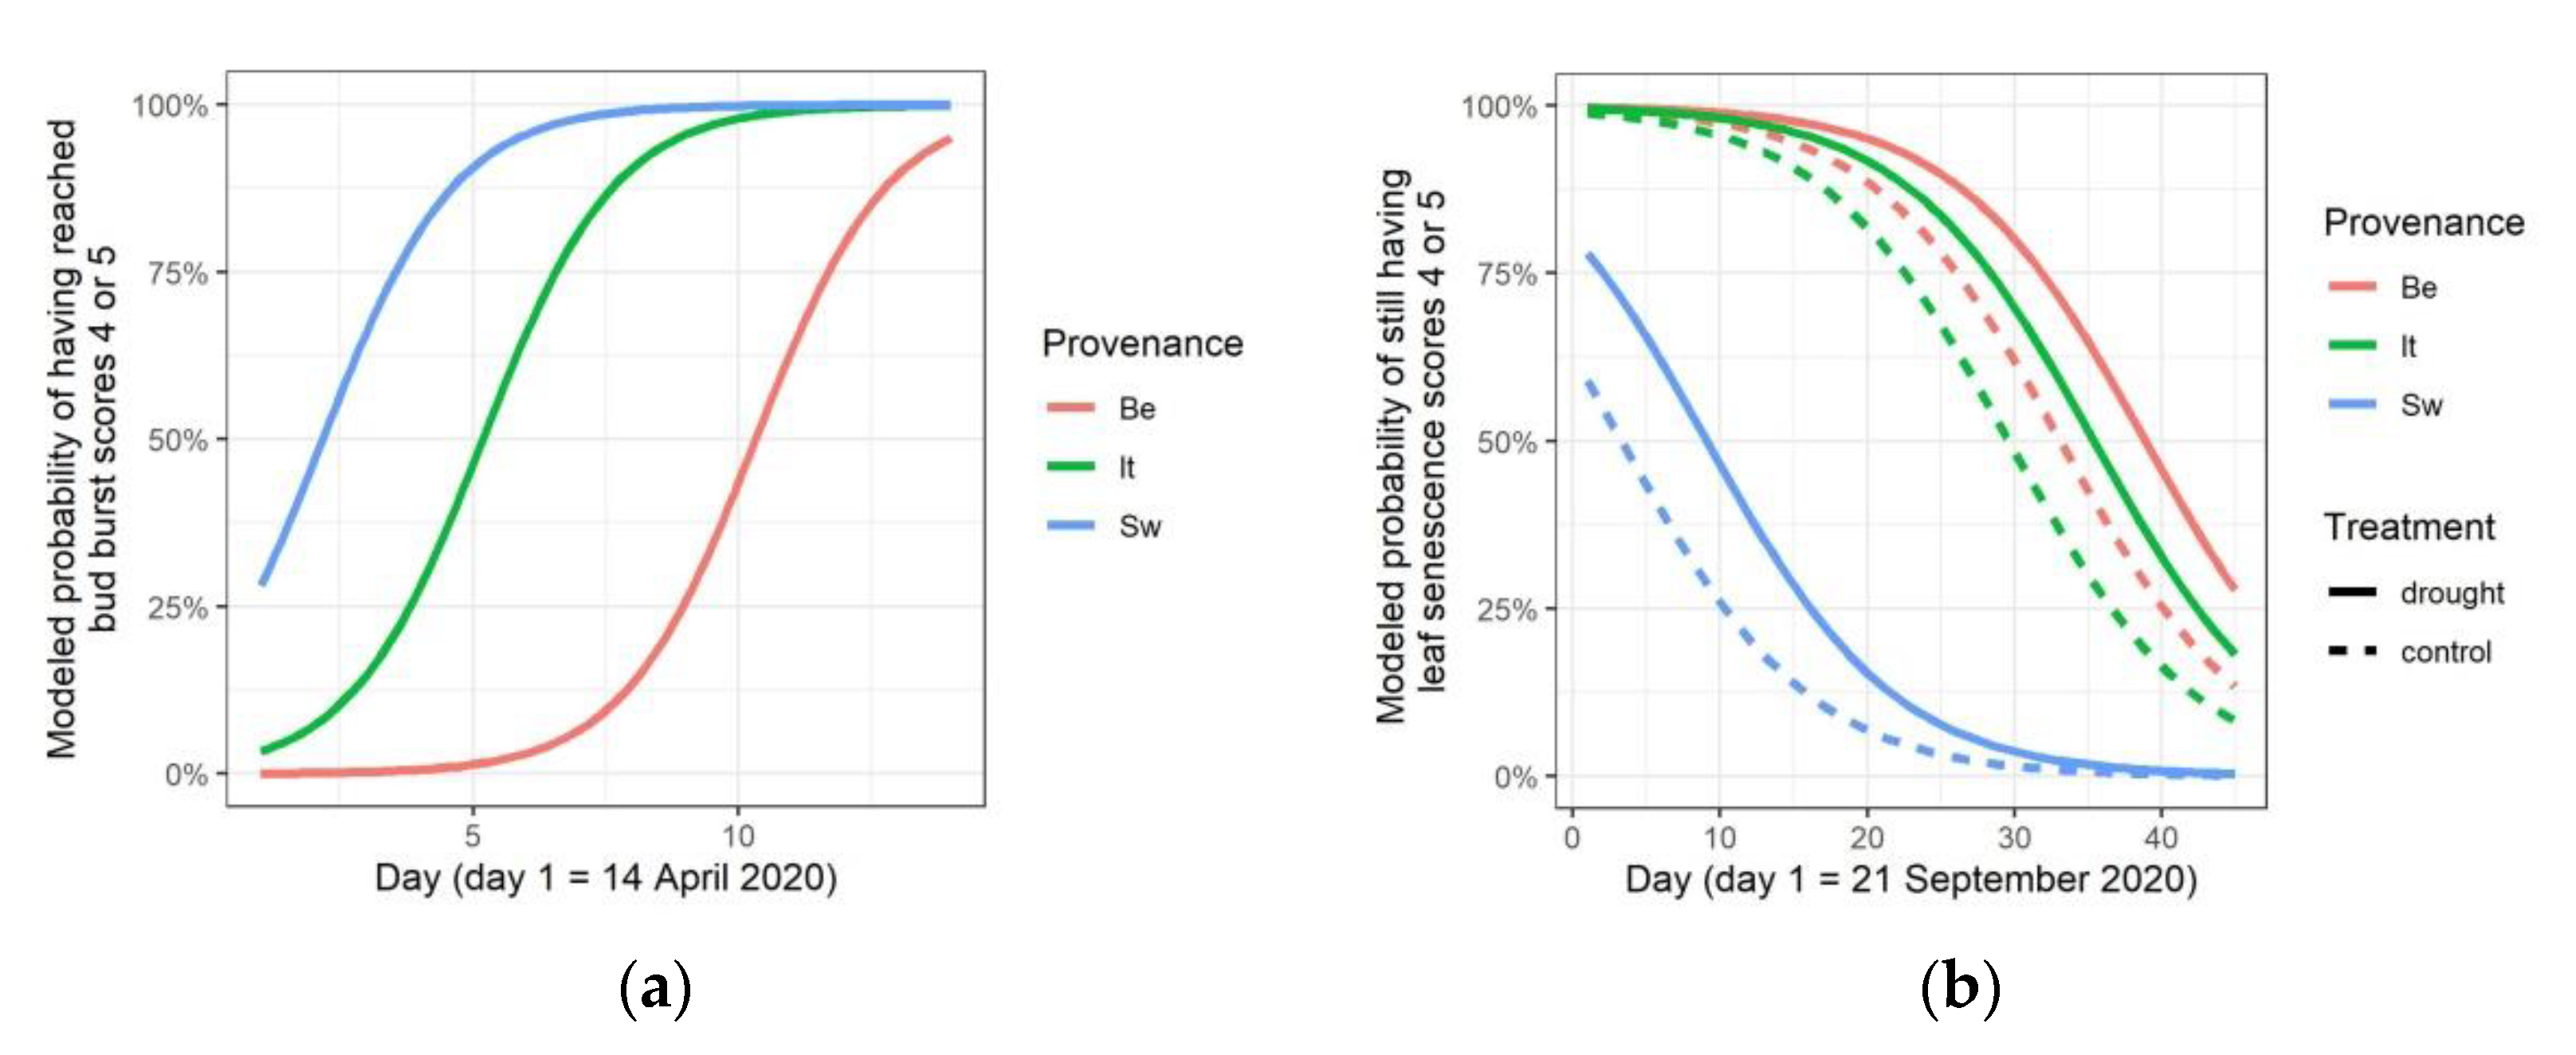
3.1. Water Limiting Treatment and Stress Symptoms

On the 14th of May 2020 the water withholding experiment started (Figure 2). As the second part of May 2020 was dry (Figure S1), the non-watered plants on the container field lost weight fairly quickly (Figure 2), with plants starting to show stress symptoms already after three weeks. Quite evidently, the stronger the weight loss, the higher the chance to show stress symptoms (symptoms scored on the 3rd of June, Figure 3). After one watering of the water-limited group of plants on the 3rd of June, to omit plant losses, natural precipitation kept plants relatively well watered during the rest of the growing season (Figure 2), albeit with the water-limited group of plants displaying a persistent lower weight compared to the control group.

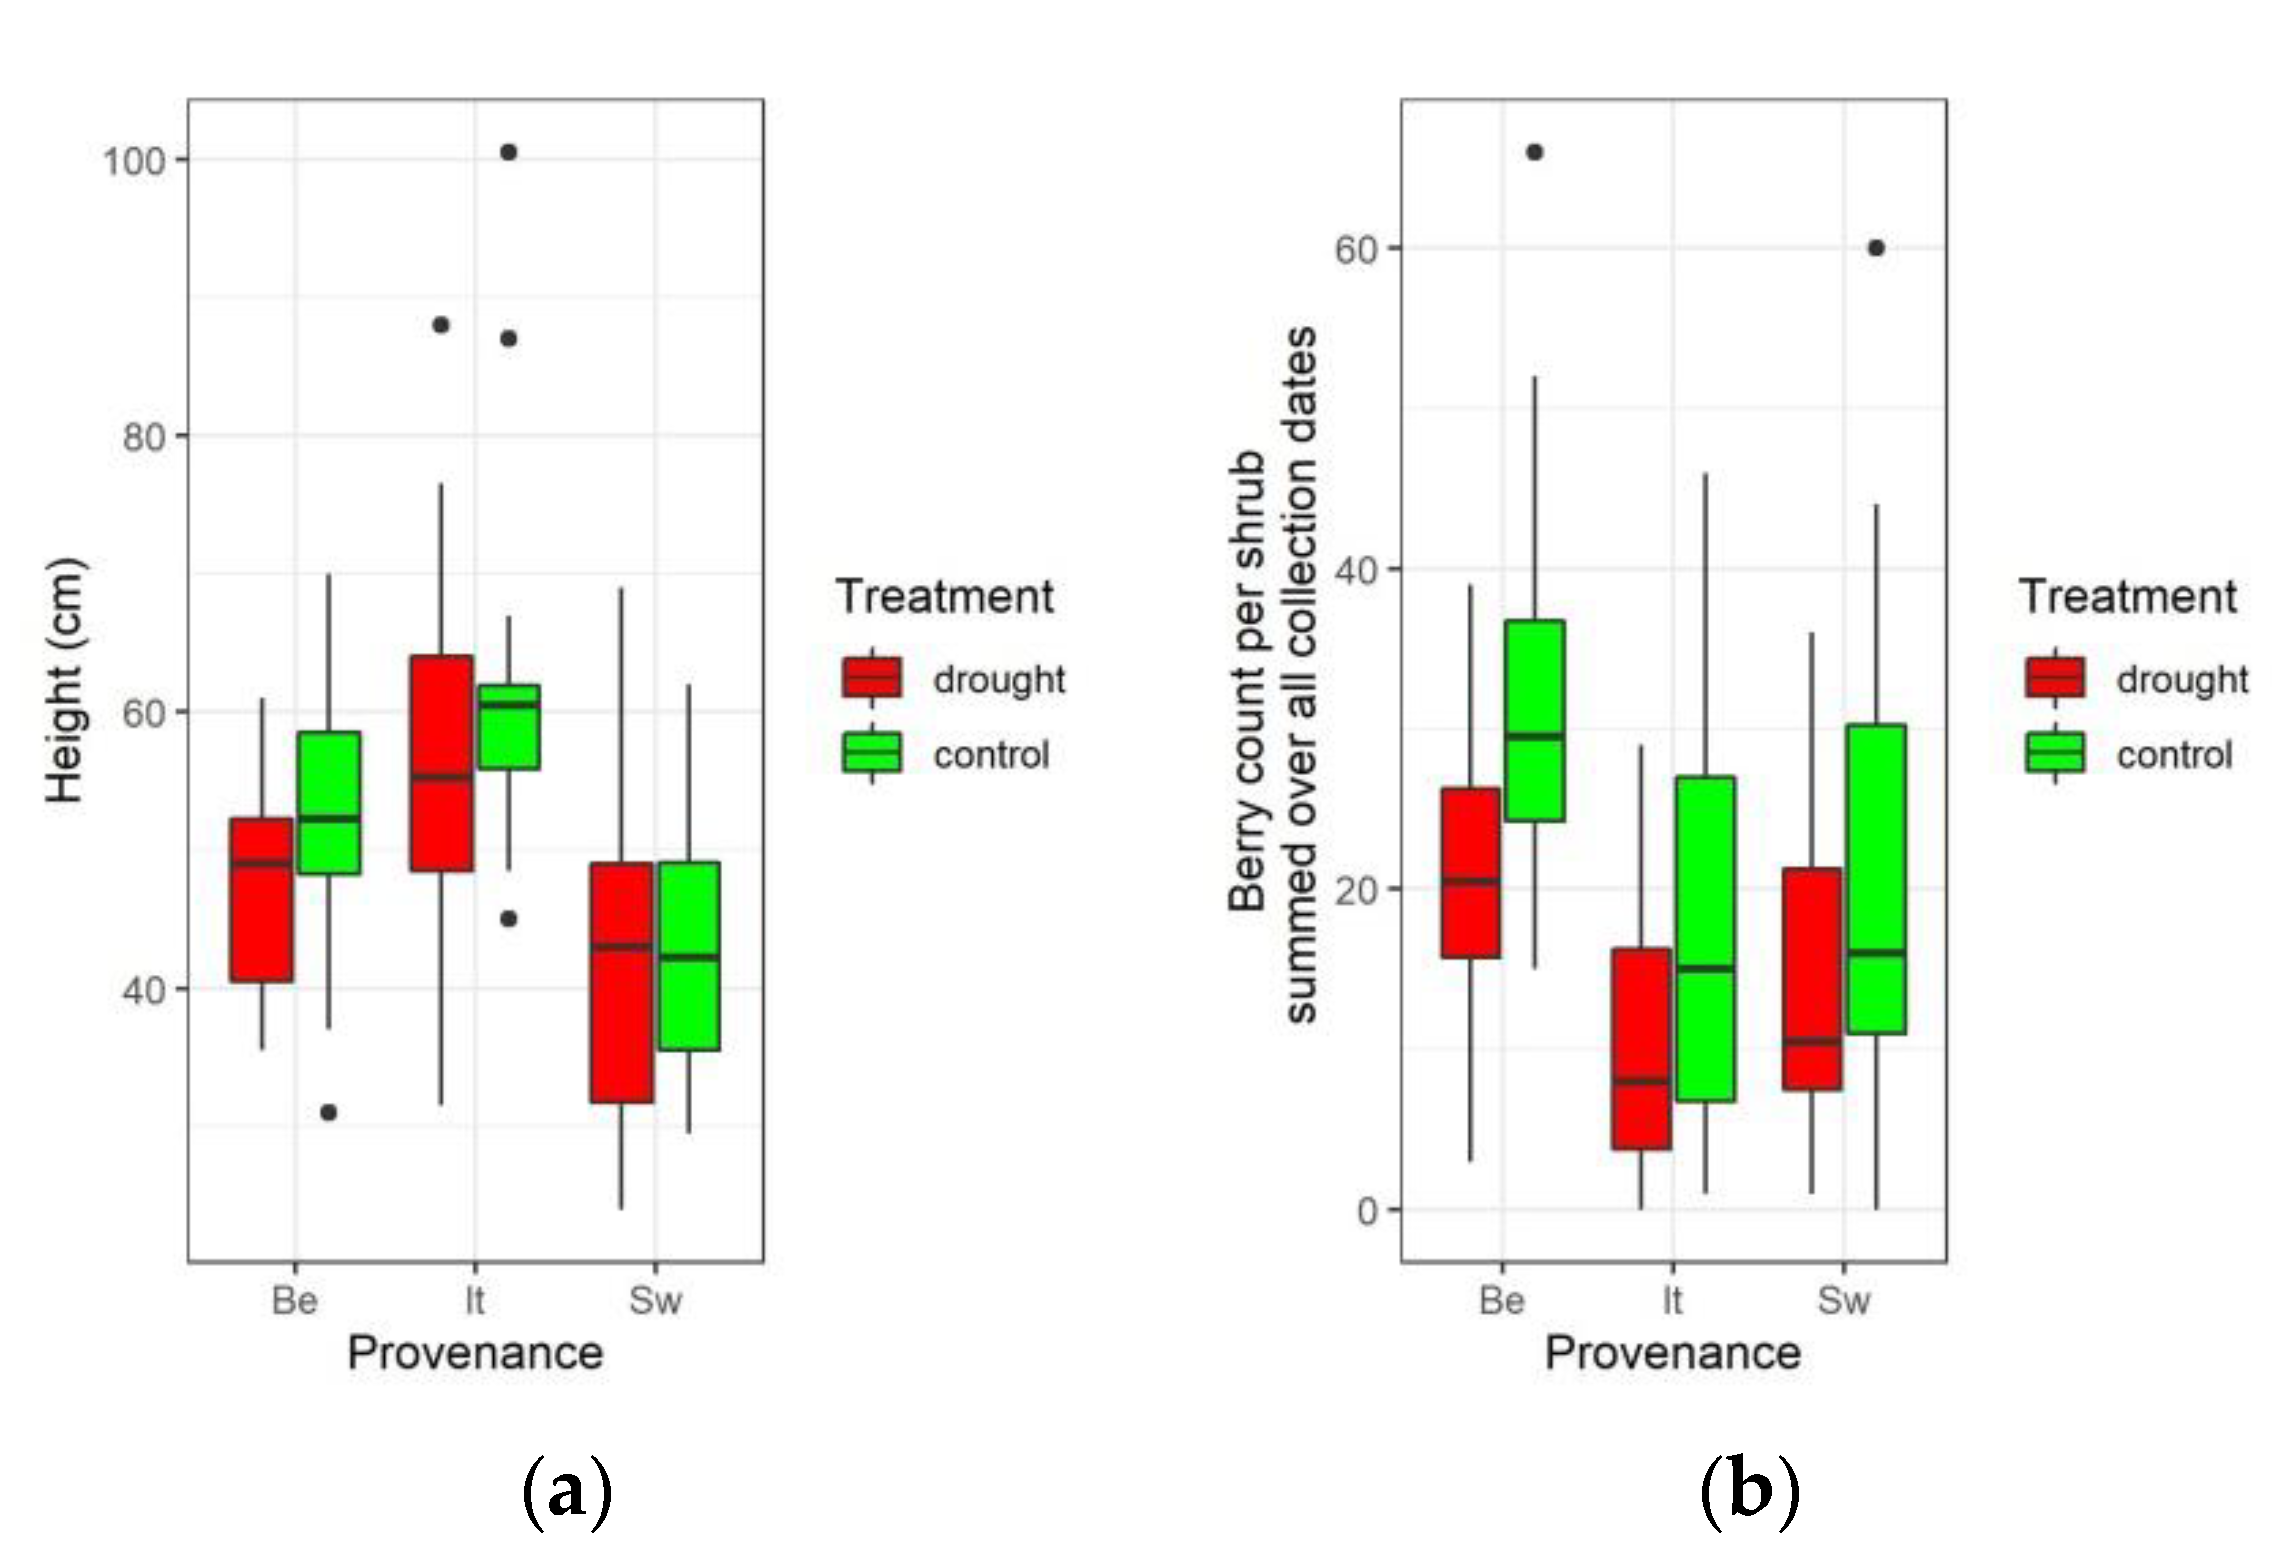
3.2. Influence of Water Limitation on Vegetative Traits

Results described by Vander Mijnsbrugge et al. [22] were corroborated in the experiment presented here. The Italian and the Swedish provenances burst their buds earlier than the Belgian provenance (p-value = 0.017 and p-value < 0.001 for the Italian and Swedish provenances, respectively, in Table 1, Figure 4a) at the beginning of the growing season in 2020. At the end of the growing season, and thus after the water limiting treatment, leaf senescence was delayed in the treated group of plants (p-value < 0.001 for treatment in Table 1, Figure 4b). The Swedish provenance was earlier in leaf senescence compared to the other two provenances (p-value < 0.001 for the Swedish provenance in Table 1, Figure 4b).
Height growth in 2020 was reduced in the water-limited plants (p-value = 0.039 for treatment in Table 2, Figure 5a). In addition, the Italian provenance displayed a stronger height growth compared to the Belgian provenance (p-value = 0.03 for the Italian provenance in Table 2).

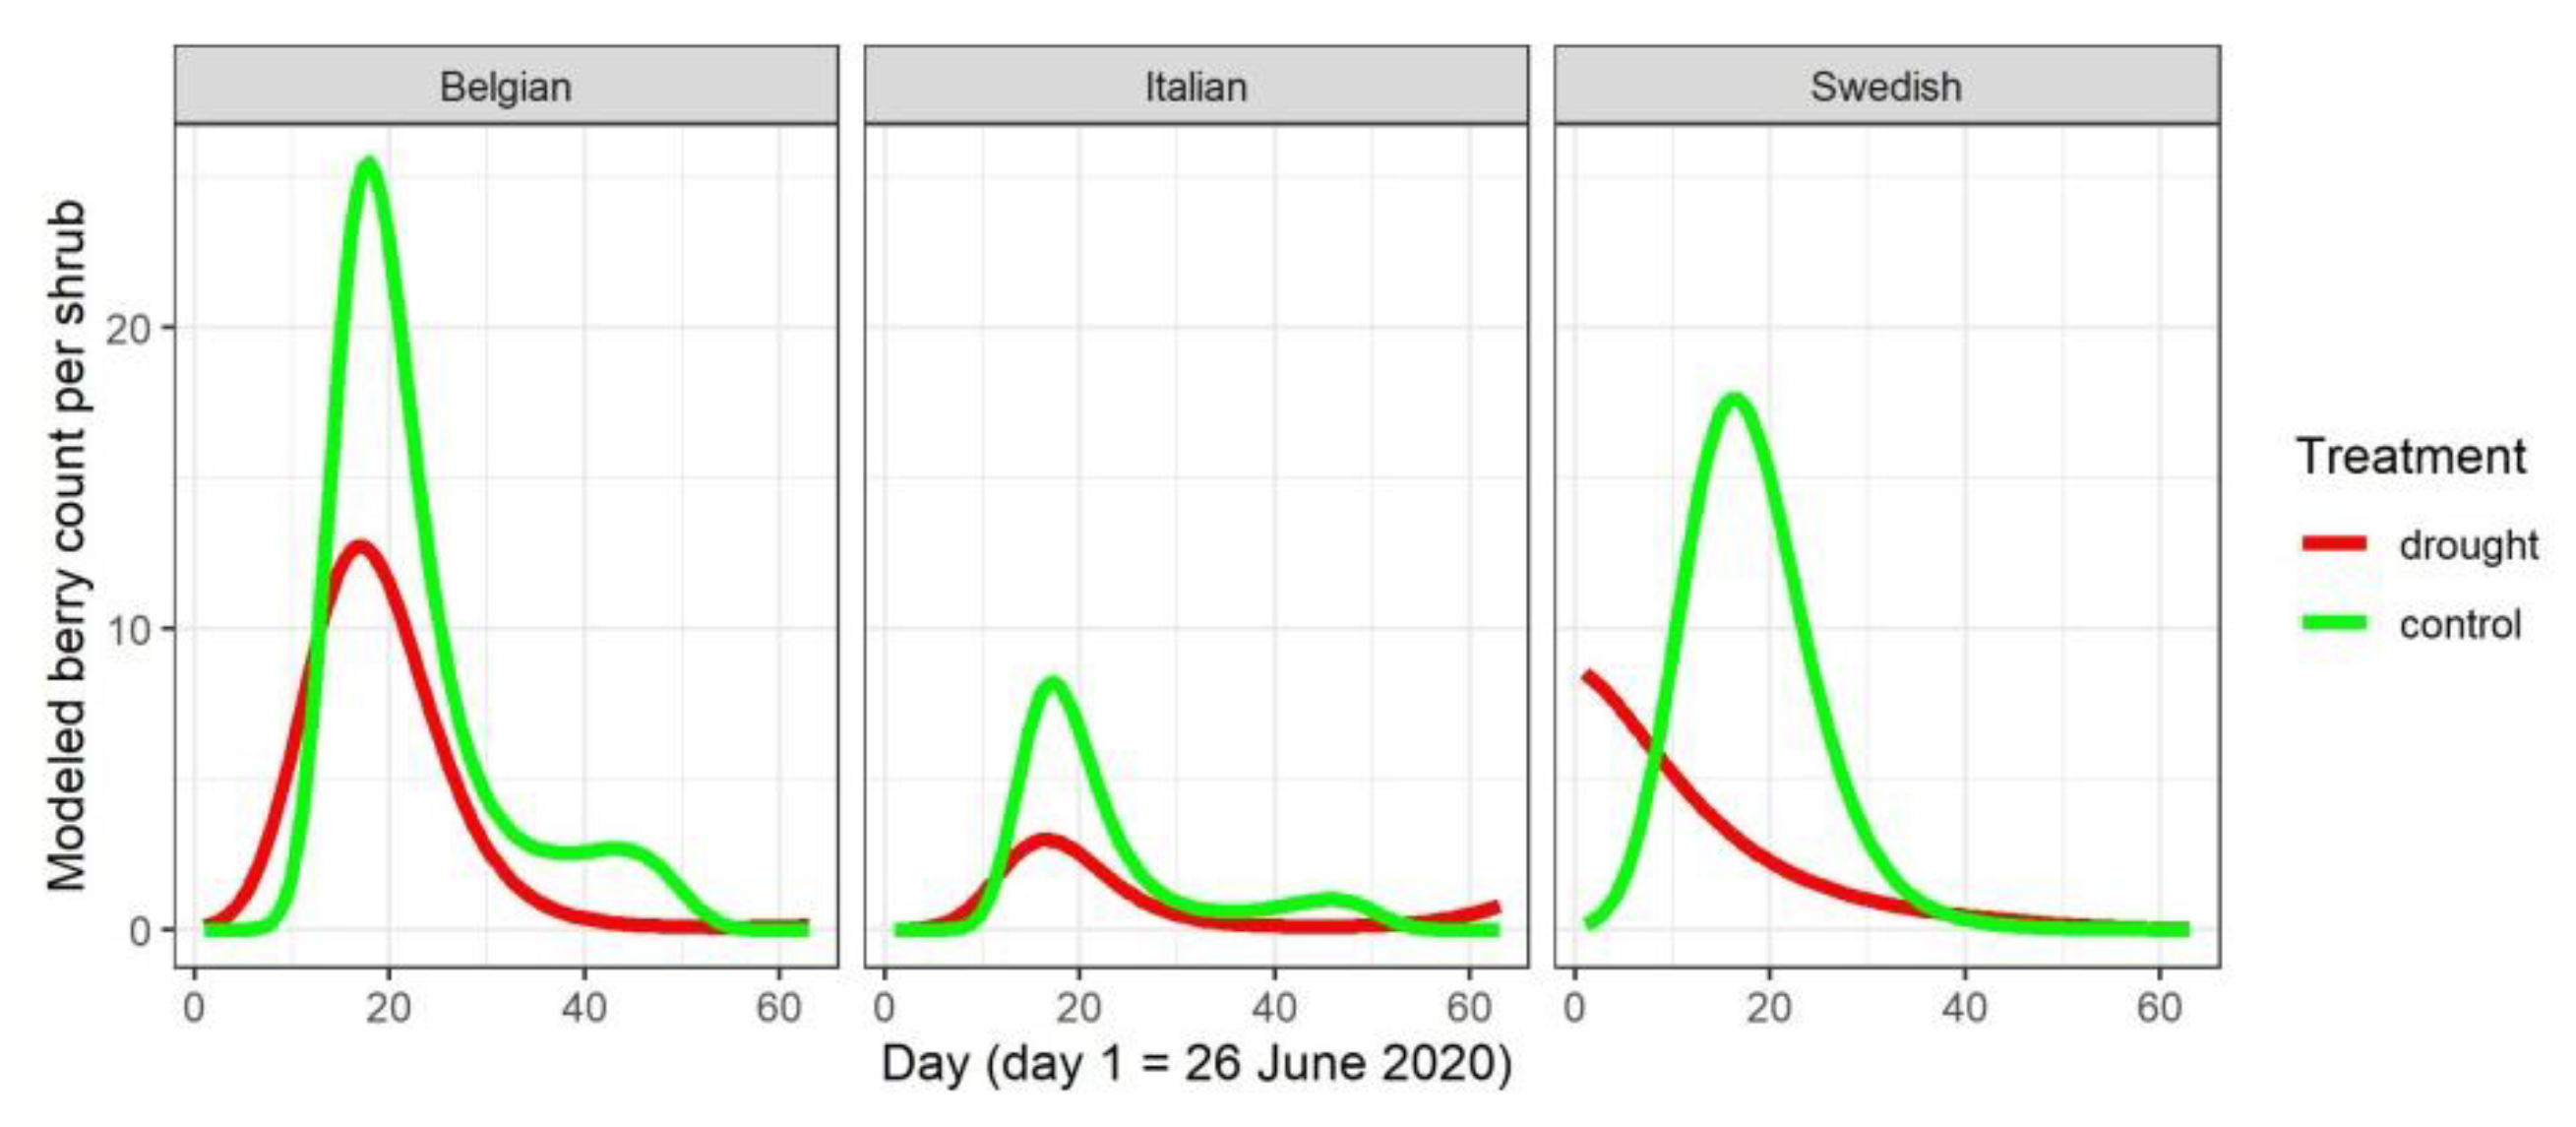
3.3. Influence of Water Limitation on Mature Berry Counts

The total number of matured berries for each shrub over the whole growing season of 2020 was higher in the control group than in the water-limited plants (p-value = 0.003 for treatment in Table 2, Figure 5b). The Belgian provenance produced significantly more mature berries compared to the other two provenances (p-value = 0.006 and p-value = 0.049 for the Italian and Swedish provenances, respectively, in Table 2, Figure 5b), independent of the water limiting treatment (no significant interaction terms between the provenances and treatment in Table 2, Figure 5b).
The variation of mature berry counts on the collection days in 2020 differed significantly between the treated group and the control group, for each provenance (Figure S2, Figure 6, significant interaction terms between at least two of the four polynomials of day and treatment, for the three provenances, in Table 3). Two peaks through time in the control plants of the Belgian and Italian provenances were present (Figure 6). Taking day 1 as the first day of the mature berry collection, the two peaks appeared on day 17 and day 43 for the Belgian provenance, and on day 17 and day 45 for the Italian provenance. The water-limited plants of these two provenances, and the control plants of the Swedish provenance only showed one peak in the modeled berry counts (Figure 6). For the water-limited plants in the Belgian and Italian provenances, the modeled berry peak appeared on (nearly) the same day as the first peak of the control plants (day 17 and 16, respectively). For the control plants of the Swedish provenance, the modeled berry count peak occurred on a similar day as for the control plants of the other two provenances (day 16), whereas for the water-limited plants in the Swedish provenance, the modeled peak was already passed by at the start of the counts on day 1 (Figure 6).
The modeled berry counts in the water-limited plants displayed a tendency to an earlier start of the berry production, with, e.g., in the Belgian provenance a modeled count of 2 berries appearing on day 6 for the water-limited plants and on day 9 for the control plants. This was more evident in the Swedish provenance with a modeled count of only 0.2 berries on day 1 for the control plants, whereas the water-limited plants already had a modeled count of 8.5 berries on this day.

3.4. Influence of Water Limitation on Stone Traits

The average number of ripened stones in a berry evolved slightly during the growing season with a single maximum on day 40 (Figure 7a) but was not influenced by the water withholding treatment (no significant p-value for T in Table 4). The Swedish provenance had a higher number of stones in a berry (p-value = 0.003 for the Swedish provenance in Table 4, Figure 7a). For the control group of plants, the Swedish provenance had 2.27 modeled average stones in a berry on day 40, whereas this was 2.12 for the Belgian provenance (Figure 7a).
The average ripened stone weight also evolved slightly during the growing season with a single maximum on day 30 (Figure 7b) and was also not influenced by the water withholding treatment (no significant p-value for treatment in Table 4). Here, the Italian and the Swedish provenances had a higher average stone weight compared to the Belgian provenance (p-value = 0.003 and p-value = 0.02 for the Italian and the Swedish provenances in Table 4, Figure 7b). On day 30, the average stone of the Belgian provenance had a modeled weight of 0.019 g whereas the Italian provenance had a modeled weight of 0.022 g.

4. Discussion

Water limitation in the common garden experiment influenced the berry production, both in quantities and in timing, but not the studied stone traits. The three provenances in the common garden differed in the analyzed berry and stone traits.

4.1. Drought Escape and Compensation Growth

We observed an advanced berry maturation in the water-limited shrubs, which was most evident in the Swedish provenance. This reaction can be related to the known mechanism described as ‘drought escape’, which enables plants to complete their life cycle quickly during a short period of favorable conditions [39,40]. Drought escape involves a period of high metabolic rate, resulting in accelerated cell expansion and division, higher levels of photosynthesis and very rapid plant development [39]. In general, water shortage is often the trigger for drought escape [40] and is associated with earlier flowering and earlier maturing of the fruit [39]. The drought preceding the 3rd of June in our experiment, followed by the watering of the plants on this day, seems to have activated a similar mechanism resulting in earlier berry maturation. When comparing the timing of the (first) modeled maximum of berry counts between control and water-limited plants, the Swedish provenance displays a strong advancement of the modeled peak. Possibly, the shorter growing season to which this provenance is adapted, and which is expressed in an obvious earlier leaf senescence, may have acted as the trigger to accelerate the completion of the reproductive process more than in the other provenances.
An earlier berry maturation of the water-limited plants in our experiment seems contradictory to the later autumnal leaf senescence of this same group of plants when compared with the control plants (for the three provenances) as, amongst others, drought is known to induce/advance leaf senescence [41]. Most probably, the delayed leaf senescence that we observed is a post-drought mechanism, already observed in a common garden of F. alnus [22]. After a post-drought re-watering, the treated plants of the Italian provenance entered the autumnal leaf senescence later than the control plants, and this was suggested to be a compensation mechanism for the lost growing time [22]. A similar mechanism has been described for the tree species Q. petraea (Matt.) Liebl. [42] and F. sylvatica [43], and was suggested to generate recovery time for the plants before entering the autumnal leaf senescence phase [42].

4.2. Drought Avoidance and Trade-Off between Growth and Reproduction

Water-limited plants in all three provenances produced fewer mature berries than the control plants. This can be attributed to another general strategy in which plants react to water shortage, named drought avoidance [39,40]. It is a mechanism of slow plant growth, with reduced photosynthesis as well as low cell metabolism in general. The lowered berry production during the growing season on the one hand, and the prolonged autumnal leaf senescence on the other hand, in the water-limited plants of the three provenances, may indicate that, confronted with limited resource availability, growth is favored at the expense of reproduction. This has already been observed in several tree species, both broadleaves [29] and conifers [28].
The Belgian provenance, which is the local one, produced more ripened berries in total, both in the water-limited as in the control plants, when compared with the other two provenances, suggesting a home-site advantage. Local adaptation is well-known to occur among woody perennials [11], but because trees fructify only many years after germination and because many tree species do not produce seeds on a yearly basis, reproduction is often lacking in experiments that quantify local adaptation in tree species. Nonetheless, results in herbaceous species point to local adaptation in reproductive traits. For instance, in a transplant experiment of two bunchgrass species local adaptation was most strongly expressed in traits associated with reproduction and the viability of seeds [44]. Allocation of resources towards reproduction versus vegetative growth was found to be dependent on altitude (suggesting local adaptation) in the alpine grass species Poa alpine L. [45]. In our experiment, berry production in the Italian provenance was lower than the Belgian provenance, despite the biggest plant height. This could indicate that a putative trade-off between growth and reproduction is provenance dependent. In an earlier study we already demonstrated that the Italian provenance was quicker prone to drought stress symptoms in water-limited conditions, likely due to a higher plant growth and larger leaves with denser stomata [22].

4.3. Stone Traits Independent of Water Limitation and Size/Number Trade-Off

The average stone weight was found to be independent of the water limitation. The drought reduced the number of mature berries but not the average stone weight: when resources are limited, a reduced amount of normal viable seed may be more successful for recruitment than a larger number of lighter and therefore putatively less viable seed. This can be considered as a variant of the generally assumed trade-off between seed size and seed number, which is based on resource allocation principles (the resources that plants can invest in reproduction being limited) [46,47]. Although the differences were small in absolute terms, the Belgian provenance displayed a significant lower average stone weight. This result can be related to the seed weight of beech provenances from the central part of the natural range in Europe, being lighter than those from more marginal populations [18]. It was argued that the disadvantage of weighing less was compensated by a higher subsequent growth rate of the seedlings [18]. Additionally, in our experiment, the Belgian home-site is located more in the center of the natural range of F. alnus compared to the Swedish (north of Europe) and Italian (south of Europe) origins. As our experiment is a common garden, the average stone weight differentiation among the provenances has a genetic basis. It can be hypothesized that heavier seeds have more resources available for the germinating seedling that would be beneficial in—for F. alnus—harsher growth conditions (more to the edges of the natural range) and thus that local adaptation results in seed weight differentiation among populations between the margins and the center of its natural range.
Similar as the average stone weight, the average stone count per berry was not affected by the drought, suggesting the importance of these stone traits over berry counts per plant in drought affected growing conditions. As this is a difficult research topic in woody perennials, literature is scarce. Still, an analogous result was found for Cercidium microphyllum Rose & I.M. Johnst., a perennial legume. In a drought year, C. microphyllum plants at a wetter site showed a greater reproductive output but did not produce more seeds per pod compared to plants at a dry site with lower reproductive output [48]. Although drought did not influence the number of stones per berry, we observed population differentiation for this trait in the common garden. The Swedish provenance displayed a slight but significant higher average seed count per berry. This is likely an adaptation to the colder climate at the origin of this provenance in the north of Europe. In these harsher growing conditions, plants may have adapted not only to slightly heavier stones, but also to a slightly higher amount of stones per berry.

5. Conclusions

We looked at several traits involved in reproduction of F. alnus in a common garden setting. We found that stress caused by water limitation was expressed in a reduced berry count in all three provenances, but not in the average stone weight nor in the average stone count per berry. Results indicated both drought avoidance and drought escape responses in the berry counts upon water limitation. In addition, all reproductive traits displayed population differentiation in the common garden, likely caused by local adaptation. The higher reproductive output of the local provenance, both in the control and in the water-limited conditions argues for caution in translocating non-local provenances as an anticipation to the climate change.

Supplementary Materials

The following supporting information can be downloaded at: https://www.mdpi.com/article/10.3390/f13111744/s1, Figure S1: Daily minimum (blue line) and maximum (red line) temperatures (a) and daily precipitation (b) during the months April until August 2020 in Melle, Belgium; Figure S2: Berry count per shrub on the different collection days, according to the provenance and to the treatment in 2020; Figure S3: Average seed weight per plant on the different collection days, according to the provenance and to the treatment in 2020.

Author Contributions

The experiment was conceptualized by K.V.M. and S.M. The methodology was defined by K.V.M. and S.M. Plants for the experiment were grown by M.S. (Marc Schouppe) and S.M. Data collection and formal analysis were performed by M.S. (Marc Schouppe), S.M., Y.A.G., L.D. and M.S. (Marie Stessens). Data processing was performed by K.V.M., L.D. and M.S. (Marie Stessens). The manuscript was prepared by K.V.M. Review and editing of the manuscript was performed by K.V.M., L.D. and M.S. (Marie Stessens). All authors have read and agreed to the published version of the manuscript.

Funding

This research received no external funding.

Data Availability Statement

Data are available at 10.5281/zenodo.6989425.

Acknowledgments

We are most grateful to Hanne De Kort for helping us with the initial seed collection. We also thank Lisa Carnal, Amy Lauwers, Cédric Van Dun and Matthieu Gallin for contributing to the data acquisition. Nico De Regge helped in taking care of the plants.

Conflicts of Interest

The authors declare no conflict of interest.

References

  1. Trenberth, K.E. Changes in precipitation with climate change. Clim. Res. 2011, 47, 123–138. [Google Scholar] [CrossRef] [Green Version]
  2. Zhao, M.S.; Running, S.W. Drought-Induced Reduction in Global Terrestrial Net Primary Production from 2000 Through 2009. Science 2010, 329, 940–943. [Google Scholar] [CrossRef] [PubMed] [Green Version]
  3. Clark, J.S.; Iverson, L.; Woodall, C.W.; Allen, C.D.; Bell, D.M.; Bragg, D.C.; D’Amato, A.W.; Davis, F.W.; Hersh, M.H.; Ibanez, I.; et al. The impacts of increasing drought on forest dynamics, structure, and biodiversity in the United States. Glob. Chang. Biol. 2016, 22, 2329–2352. [Google Scholar] [CrossRef] [PubMed] [Green Version]
  4. Hampe, A.; Petit, R.J. Conserving biodiversity under climate change: The rear edge matters. Ecol. Lett. 2005, 8, 461–467. [Google Scholar] [CrossRef] [PubMed] [Green Version]
  5. Allen, C.D.; Macalady, A.K.; Chenchouni, H.; Bachelet, D.; McDowell, N.; Vennetier, M.; Kitzberger, T.; Rigling, A.; Breshears, D.D.; Hogg, E.H.; et al. A global overview of drought and heat-induced tree mortality reveals emerging climate change risks for forests. For. Ecol. Manag. 2010, 259, 660–684. [Google Scholar] [CrossRef] [Green Version]
  6. Choat, B.; Jansen, S.; Brodribb, T.J.; Cochard, H.; Delzon, S.; Bhaskar, R.; Bucci, S.J.; Feild, T.S.; Gleason, S.M.; Hacke, U.G.; et al. Global convergence in the vulnerability of forests to drought. Nature 2012, 491, 752–755. [Google Scholar] [CrossRef] [PubMed] [Green Version]
  7. D’Orangeville, L.; Maxwell, J.; Kneeshaw, D.; Pederson, N.; Duchesne, L.; Logan, T.; Houle, D.; Arseneault, D.; Beier, C.M.; Bishop, D.A.; et al. Drought timing and local climate determine the sensitivity of eastern temperate forests to drought. Glob. Chang. Biol. 2018, 24, 2339–2351. [Google Scholar] [CrossRef] [PubMed]
  8. Breda, N.; Huc, R.; Granier, A.; Dreyer, E. Temperate forest trees and stands under severe drought: A review of ecophysiological responses, adaptation processes and long-term consequences. Ann. For. Sci. 2006, 63, 625–644. [Google Scholar] [CrossRef] [Green Version]
  9. Lindner, M.; Maroschek, M.; Netherer, S.; Kremer, A.; Barbati, A.; Garcia-Gonzalo, J.; Seidl, R.; Delzon, S.; Corona, P.; Kolstrom, M.; et al. Climate change impacts, adaptive capacity, and vulnerability of European forest ecosystems. For. Ecol. Manag. 2010, 259, 698–709. [Google Scholar] [CrossRef]
  10. Loarie, S.R.; Duffy, P.B.; Hamilton, H.; Asner, G.P.; Field, C.B.; Ackerly, D.D. The velocity of climate change. Nature 2009, 462, 1052–1055. [Google Scholar] [CrossRef] [PubMed]
  11. Aitken, S.N.; Yeaman, S.; Holliday, J.A.; Wang, T.L.; Curtis-McLane, S. Adaptation, migration or extirpation: Climate change outcomes for tree populations. Evol. Appl. 2008, 1, 95–111. [Google Scholar] [CrossRef] [PubMed]
  12. Moran, E.; Lauder, J.; Musser, C.; Stathos, A.; Shu, M. The genetics of drought tolerance in conifers. New Phytol. 2017, 216, 1034–1048. [Google Scholar] [CrossRef] [PubMed] [Green Version]
  13. Alberto, F.; Bouffier, L.; Louvet, J.M.; Lamy, J.B.; Delzon, S.; Kremer, A. Adaptive responses for seed and leaf phenology in natural populations of sessile oak along an altitudinal gradient. J. Evol. Biol. 2011, 24, 1442–1454. [Google Scholar] [CrossRef] [PubMed]
  14. Sáenz-Romero, C.; Lamy, J.-B.; Ducousso, A.; Musch, B.; Ehrenmann, F.; Delzon, S.; Cavers, S.; Chałupka, W.; Dağdaş, S.; Hansen, J.K.; et al. Adaptive and plastic responses of Quercus petraea populations to climate across Europe. Glob. Chang. Biol. 2017, 23, 2831–2847. [Google Scholar] [CrossRef] [PubMed] [Green Version]
  15. Alberto, F.J.; Aitken, S.N.; Alia, R.; Gonzalez-Martinez, S.C.; Hanninen, H.; Kremer, A.; Lefevre, F.; Lenormand, T.; Yeaman, S.; Whetten, R.; et al. Potential for evolutionary responses to climate change—evidence from tree populations. Glob. Chang. Biol. 2013, 19, 1645–1661. [Google Scholar] [CrossRef] [Green Version]
  16. Zas, R.; Sampedro, L.; Solla, A.; Vivas, M.; Lombardero, M.J.; Alía, R.; Rozas, V. Dendroecology in common gardens: Population differentiation and plasticity in resistance, recovery and resilience to extreme drought events in Pinus pinaster. Agric. For. Meteorol. 2020, 291, 108060. [Google Scholar] [CrossRef]
  17. Bruschi, P. Geographical variation in morphology of Quercus petraea (Matt.) Liebl. as related to drought stress. Plant Biosyst.—Int. J. Deal. All Asp. Plant Biol. 2010, 144, 298–307. [Google Scholar] [CrossRef]
  18. Rose, L.; Leuschner, C.; Köckemann, B.; Buschmann, H. Are marginal beech (Fagus sylvatica L.) provenances a source for drought tolerant ecotypes? Eur. J. For. Res. 2009, 128, 335–343. [Google Scholar] [CrossRef] [Green Version]
  19. Arend, M.; Kuster, T.; Gunthardt-Goerg, M.S.; Dobbertin, M. Provenance-specific growth responses to drought and air warming in three European oak species (Quercus robur, Q. petraea and Q. pubescens). Tree Physiol. 2011, 31, 287–297. [Google Scholar] [CrossRef] [PubMed] [Green Version]
  20. Depardieu, C.; Girardin, M.P.; Nadeau, S.; Lenz, P.; Bousquet, J.; Isabel, N. Adaptive genetic variation to drought in a widely distributed conifer suggests a potential for increasing forest resilience in a drying climate. New Phytol. 2020, 227, 427–439. [Google Scholar] [CrossRef]
  21. Sánchez-Salguero, R.; Camarero, J.J.; Rozas, V.; Génova, M.; Olano, J.M.; Arzac, A.; Gazol, A.; Caminero, L.; Tejedor, E.; de Luis, M.; et al. Resist, recover or both? Growth plasticity in response to drought is geographically structured and linked to intraspecific variability in Pinus pinaster. J. Biogeogr. 2018, 45, 1126–1139. [Google Scholar] [CrossRef]
  22. Vander Mijnsbrugge, K.; De Clerck, L.; Van der Schueren, N.; Moreels, S.; Lauwers, A.; Steppe, K.; De Ligne, L.; Campioli, M.; Van den Bulcke, J. Counter-Intuitive Response to Water Limitation in a Southern European Provenance of Frangula alnus Mill. in a Common Garden Experiment. Forests 2020, 11, 1186. [Google Scholar] [CrossRef]
  23. Büsgen, M.; Münch, E.; Thomson, T. The structure and life of forest trees; Chapman and Hall: London, UK, 1929. [Google Scholar]
  24. Hacket-Pain, A.; Bogdziewicz, M. Climate change and plant reproduction: Trends and drivers of mast seeding change. Philos. Trans. R. Soc. B Biol. Sci. 2021, 376, 20200379. [Google Scholar] [CrossRef] [PubMed]
  25. Pearse, I.S.; Koenig, W.D.; Kelly, D. Mechanisms of mast seeding: Resources, weather, cues, and selection. New Phytol. 2016, 212, 546–562. [Google Scholar] [CrossRef] [PubMed]
  26. Pérez-Ramos, I.M.; Ourcival, J.M.; Limousin, J.M.; Rambal, S. Mast seeding under increasing drought: Results from a long-term data set and from a rainfall exclusion experiment. Ecology 2010, 91, 3057–3068. [Google Scholar] [CrossRef] [Green Version]
  27. Bogdziewicz, M.; Fernández-Martínez, M.; Bonal, R.; Belmonte, J.; Espelta, J.M. The Moran effect and environmental vetoes: Phenological synchrony and drought drive seed production in a Mediterranean oak. Proc. R. Soc. B Biol. Sci. 2017, 284, 20171784. [Google Scholar] [CrossRef] [PubMed] [Green Version]
  28. Lauder, J.D.; Moran, E.V.; Hart, S.C. Fight or flight? Potential tradeoffs between drought defense and reproduction in conifers. Tree Physiol. 2019, 39, 1071–1085. [Google Scholar] [CrossRef]
  29. Hacket-Pain, A.J.; Lageard, J.G.A.; Thomas, P.A. Drought and reproductive effort interact to control growth of a temperate broadleaved tree species (Fagus sylvatica). Tree Physiol. 2017, 37, 744–754. [Google Scholar] [CrossRef]
  30. Bogdziewicz, M.; Fernández-Martínez, M.; Espelta, J.M.; Ogaya, R.; Penuelas, J. Is forest fecundity resistant to drought? Results from an 18-yr rainfall-reduction experiment. New Phytol. 2020, 227, 1073–1080. [Google Scholar] [CrossRef] [PubMed]
  31. Zecchin, B.; Caudullo, G.; de Rigo, D. Frangula alnus in Europe: Distribution, habitat, usage and threats. In European Atlas of Forest Tree Species; Publication Office of the European Union: Luxembourg, 2016. [Google Scholar]
  32. Vander Mijnsbrugge, K.; Turcsán, A.; Michiels, B. Population differentiation and phenotypic plasticity in temperature response of bud burst in Frangula alnus provenances of different latitude. Plant Syst. Evol. 2016, 302, 257–264. [Google Scholar] [CrossRef]
  33. Fick, S.E.; Hijmans, R.J. WorldClim 2: New 1-km spatial resolution climate surfaces for global land areas. Int. J. Climatol. 2017, 37, 4302–4315. [Google Scholar] [CrossRef]
  34. Caudullo, G.; Welk, E.; San-Miguel-Ayanz, J. Chorological data for the main European woody species. Mendeley Data V14 2021. [Google Scholar] [CrossRef]
  35. R_Core_Team. R: A Language and Environment for Statistical Computing; R Foundation for Statistical Computing: Vienna, Austria, 2019. [Google Scholar]
  36. Bates, D.; Machler, M.; Bolker, B.M.; Walker, S.C. Fitting Linear Mixed-Effects Models Using lme4. J. Stat. Softw. 2015, 67, 1–48. [Google Scholar] [CrossRef]
  37. Pinheiro, J.; Bates, D.; DebRoy, S.; Sarkar, D. nlme: Linear and Nonlinear Mixed Effects Models, R package version 3.1-113; R Development Core Team: Vienna, Austria, 2013. [Google Scholar]
  38. Christensen, R.H.B. Ordinal: Regression Models for Ordinal Data. R package version 2015.6-28. 2015. Available online: http://www.cran.r-project.org/package=ordinal/ (accessed on 25 September 2019).
  39. Shavrukov, Y.; Kurishbayev, A.; Jatayev, S.; Shvidchenko, V.; Zotova, L.; Koekemoer, F.; de Groot, S.; Soole, K.; Langridge, P. Early Flowering as a Drought Escape Mechanism in Plants: How Can It Aid Wheat Production? Front. Plant Sci. 2017, 8, 1950. [Google Scholar] [CrossRef] [PubMed]
  40. Kooyers, N.J. The evolution of drought escape and avoidance in natural herbaceous populations. Plant Sci. 2015, 234, 155–162. [Google Scholar] [CrossRef]
  41. Marchin, R.; Zeng, H.; Hoffmann, W. Drought-deciduous behavior reduces nutrient losses from temperate deciduous trees under severe drought. Oecologia 2010, 163, 845–854. [Google Scholar] [CrossRef]
  42. Vander Mijnsbrugge, K.; Turcsan, A.; Maes, J.; Duchene, N.; Meeus, S.; Steppe, K.; Steenackers, M. Repeated Summer Drought and Re-watering during the First Growing Year of Oak (Quercus petraea) Delay Autumn Senescence and Bud Burst in the Following Spring. Front. Plant Sci. 2016, 7, 419. [Google Scholar] [CrossRef] [PubMed]
  43. Pflug, E.E.; Buchmann, N.; Siegwolf, R.T.W.; Schaub, M.; Rigling, A.; Arend, M. Resilient Leaf Physiological Response of European Beech (Fagus sylvatica L.) to Summer Drought and Drought Release. Front. Plant Sci. 2018, 9, 187. [Google Scholar] [CrossRef] [Green Version]
  44. Rice, K.J.; Knapp, E.E. Effects of Competition and Life History Stage on the Expression of Local Adaptation in Two Native Bunchgrasses. Restor. Ecol. 2008, 16, 12–23. [Google Scholar] [CrossRef]
  45. Stöcklin, J.; Kuss, P.; Pluess, A.R. Genetic diversity, phenotypic variation and local adaptation in the alpine landscape: Case studies with alpine plant species. Bot. Helv. 2009, 119, 125–133. [Google Scholar] [CrossRef]
  46. Lázaro, A.; Larrinaga, A.R. A multi-level test of the seed number/size trade-off in two Scandinavian communities. PLoS ONE 2018, 13, e0201175. [Google Scholar] [CrossRef] [PubMed] [Green Version]
  47. Shipley, B.; Dion, J. The Allometry of Seed Production in Herbaceous Angiosperms. Am. Nat. 1992, 139, 467–483. [Google Scholar] [CrossRef]
  48. Siemens, D.H.; Johnson, C.D. Number of Seeds per Pod in Three Species of Perennial Legumes: A Compromise between Ecological and Physiological Constraints? Am. Midl. Nat. 1995, 133, 197–205. [Google Scholar] [CrossRef]
Figure 1. Distribution map of Frangula alnus in Europe, adapted from Caudullo et al. 2021 [34] freely available at euforgen.org (accessed on 12 October 2022), with indication of the sampling sites (asterix).
Forests 13 01744 g001
Figure 2. Boxplot of the weight of the plant pots during the growing season of 2020, according to the water withholding treatment. Blue arrow: single water supply to the water-limited group of plants (3rd of July), purple arrow: first day of ripened berry collection (26th of June).
Forests 13 01744 g002
Figure 3. Boxplot of the weight of the plant pots on the 3rd of June 2020, according to the visual stress symptoms.
Forests 13 01744 g003
Figure 4. Modeled probabilities of having reached bud burst scores 4 or 5, depending on the provenance (a) and of still having leaf senescence scores 4 or 5, depending on the provenance and on the treatment (b). Be: Belgian, It: Italian, Sw: Swedish.
Forests 13 01744 g004
Figure 5. Boxplots of height measurements in 2020 (a) and berry count per shrub summed over all collection days in 2020 (b), according to the provenance and to the treatment. Be: Belgian, It: Italian, Sw: Swedish.
Forests 13 01744 g005
Figure 6. Modeled berry count per shrub during the growing season, according to the provenance and to the treatment in 2020.
Forests 13 01744 g006
Figure 7. Modeled average number of ripened stones in a berry (a) and modeled average ripened stone weight (b) during the growing season of 2020, according to the provenance. Modeled traits are shown for the control plants. Be: Belgian, It: Italian, Sw: Swedish.
Forests 13 01744 g007
Table 1. Estimates and p-values for the modeled bud burst and leaf senescence in 2020. The Belgian provenance is the standard to which the Italian (It) and Swedish (Sw) provenances are compared. D is day of observation; T is the treatment with the water-limited group of plants being the standard to which the control group is compared.
Bud BurstLeaf Senescence
VariableEstimatep-ValueEstimatep-Value
It−4.120.017 *0.550.308
Sw−6.54<0.001 ***4.66<0.001 ***
D−0.80<0.001 ***0.16<0.001 ***
T 0.91<0.001 ***
*** p < 0.001; * p < 0.05.
Table 2. Estimates and p-values for the modeled height growth in 2020 and for the modeled mature berry count on a shrub, summed over all collection days. The Belgian provenance is the standard to which the Italian (It) and Swedish (Sw) provenances are compared. T is the treatment with the water-limited group of plants being the standard to which the control group is compared.
Height GrowthBerry Count
Estimatep-ValueEstimatep-Value
(Intercept)48.34<0.001 ***3.42<0.001 ***
It9.160.030 *−0.970.006 **
Sw−7.300.055−0.620.049 *
T3.570.039.*−0.510.001 **
It:T −0.080.733
Sw:T 0.150.482
*** p < 0.001; ** p < 0.01; * p < 0.05.
Table 3. Estimates and p-values for the modeled berry counts on a shrub during the growing season of 2020, for each provenance. D is day of berry collection; T is the treatment with the water-limited group of plants being the standard to which the control group is compared.
Belgian ProvenanceItalian ProvenanceSwedish Provenance
VariableEstimatep-ValueEstimatep-ValueEstimatep-Value
(Intercept)−0.110.473−0.320.139−1.000.016 *
D1−19.38<0.001 ***−23.76<0.001 ***−2.830.237
D2−10.62<0.001 ***−3.330.177−5.540.007 **
D313.96<0.001 ***−1.850.36117.68<0.001 ***
D4−1.800.333−1.230.477−5.970.004 **
T−0.740.003 **−0.060.795−1.14<0.001 ***
D1:T9.190.060−6.240.245−5.240.331
D2:T−43.99<0.001 ***−13.020.003 **−50.63<0.001 ***
D3:T−6.720.013 *12.90<0.001 ***−10.550.001 **
D4:T−26.38<0.001 ***−1.770.493−27.19<0.001 ***
*** p < 0.001; ** p < 0.01; * p < 0.05.
Table 4. Estimates and p-values for the modeled average number of stones in a berry and modeled average stone weight. The Belgian provenance is the standard to which the Italian (It) and Swedish (Sw) provenances are compared. D is the day of berry collection; T is the treatment with the water-limited group of plants being the standard to which the control group is compared.
Stone Count Per BerryStone Weight
VariableEstimatep-ValueEstimatep-Value
(Intercept)2.10<0.001 ***0.0175<0.001 ***
It0.060.26070.00330.003 **
Sw0.150.003 **0.00220.020 *
T−0.040.21290.00020.628
D11.04<0.001 ***−0.00780.038 *
D2−0.970.001 **−0.0243<0.001 ***
*** p < 0.001; ** p < 0.01; * p < 0.05.
Publisher’s Note: MDPI stays neutral with regard to jurisdictional claims in published maps and institutional affiliations.

