Article

Forestry Canopy Image Segmentation Based on Improved Tuna Swarm Optimization

1
College of Mechanical and Electrical Engineering, Northeast Forestry University, Harbin 150040, China
2
School of Artificial Intelligence and Automation, Huazhong University of Science and Technology, Wuhan 430074, China
*
Author to whom correspondence should be addressed.
Forests 2022, 13(11), 1746; https://doi.org/10.3390/f13111746
Submission received: 22 August 2022 / Revised: 15 October 2022 / Accepted: 18 October 2022 / Published: 22 October 2022
(This article belongs to the Section Forest Ecology and Management)

Abstract

:
Forests play a vital role in increasing carbon sequestration in the biosphere. In recent years, segmenting forest canopy images in order to obtain various plant population parameters has become an essential means to assess the ecosystem. The objective of forest canopy image segmentation is to separate and extract sky regions from the background. This study proposes a hybrid method based on improved tuna swarm optimization (ITSO) for forestry canopy image segmentation. The symmetric cross-entropy is introduced to perform forestry canopy image thresholding by modeling the classes of an image as membership functions. In order to achieve the optimal thresholds of the forest canopy image, the entropy-solving procedure is arduous and time-consuming. In order to resolve this issue, the ITSO method was adopted to search for the most significant threshold. Meanwhile, the Tent chaotic map is used to initialize the tuna population according to the chaotic factor. The experiment is carried out on four different types of forest canopy images, with four indices (MAE, RVD, IoU, and ASD) used for quantitative analysis. The experiment’s results show that the ITSO-based segmentation method outperforms others, making it a better way to segment images of forest canopies.

1. Introduction

Forest is the vegetation type with the largest biomass on the Earth’s surface [1], which plays a critical role in global climate change [2]. With the growing severity of the global warming problem, boosting biosphere carbon sequestration through forests has become a crucial strategy for tackling it [3]. One of the most important issues in forestry development is information construction [4]. Traditional methods of measuring forest structure parameters primarily rely on field investigation with a high workload and low efficiency, which makes it difficult to popularize on a large scale.
With the advancement of computer technology in recent years, using computer vision to identify forest information (such as leaf area index measurement, biomass measurement, forest environmental monitoring, etc.) has become a development trend [5]. To identify deforested land, Perumal et al. proposed an unsupervised kernel-based FCM algorithm with pixel intensity and local information (UILKFCM) for Synthetic Aperture Radar (SAR) image segmentation [6]. Gennaro et al. validated the reliability of remote sensing techniques for estimating pruning biomass based on differences in the canopy trees’ volumes [7]. Moorthy et al. proposed a leaf–wood classification method that accurately classifies 3D point clouds into woody and leafy components by incorporating geometrical parameters defined by radially bounded nearest neighbors at several spatial scales in a machine learning model [8]. Using light detection and ranging data, Ni et al. mapped three-dimensional forest canopy structures [9]. With the goal of improving the accuracy and efficiency of computed tomography images, Yang and Yan established a system to detect forests using the Support Vector Machine (SVM) and the Short Time Fourier Transform (STFT) algorithm [10]. Morales et al. performed the segmentation of Mauritia flexuosa using deeplab V3+ [11]. To model the forest canopy and determine the radiant fluxes of three forest plots, Xue et al. developed a synergistic method based on airborne LiDAR data and computer graphics [12]. These researchers’ efforts make forest information accessible via computer vision.
The forest canopy consists of an extremely dense upper layer of trees and their branches. Forest canopy images can be used to estimate canopy cover and openness (sky). These are the only forest metrics that can be derived from non-uniformly scaled images. Canopy cover is defined as the percentage of forest area occupied by the vertical projection of the canopy, which is assumed to be the actual value of stratified cover by Bonnor [13]. Canopy cover is a significant parameter for forest resource assessment, forest sustainability management [14], urban forestry plans, and the construction of wildlife habitat models. It is capable of predicting woody plant composition, leaf area index (LAI), and vegetation area. LAI is a comprehensive index reflecting the light energy utilization status and canopy structure status of vegetation, which is of great value in detecting the growth status of vegetation. For example, LAI can be used to determine the density structure of vegetation as monocotyledonous or dicotyledonous, as well as for analyzing the biological characteristics of trees in terms of branching angle, leaf-bearing angle, shade tolerance, etc. It can also be used to reflect environmental conditions such as light, water, and soil nutrient status. The precision of LAI has an effect on the precision of forest carbon sink simulation. To acquire an accurate LAI, it is necessary to segment the forest canopy images as precisely as feasible. Therefore, for the study of the carbon cycle in forest ecosystems, a reliable and objective estimation of LAI by segmenting forest canopy images is important.
Consequently, automatic forest canopy image segmentation algorithms have become a prominent and active field of forest research. At present, there is no general segmentation algorithm suitable for all images. In our previous research, we attempted to segment the forest canopy images using the RGB model [15], the thresholding method [16], and deep learning techniques [17]. Among these segmentation methods, the entropy-based thresholding method shows excellent advantages due to its simplicity and effectiveness [18]. Beginning in the 1980s, the concept of information entropy was used to determine image segmentation thresholds [19]. Then, Pun et al. developed the one-dimensional maximum Shannon entropy threshold approach [20], and Abutaleb et al. proposed the two-dimensional entropy threshold method [21]. Due to the additivity (i.e., wide ductility) of Shannon entropy’s, sometimes these threshold methods disregard the interaction between the two subsystems [22]. To utilize the spatial information of the image, symmetric cross-entropy is applied to the forest canopy image segmentation in this study.
The selection of the optimal threshold is the most critical part of the threshold-based image segmentation method. The meta-heuristic algorithm proposed in the 1960s is widely utilized to solve this problem [23]. It is capable of striking a balance between solution quality and computational cost. More and more researchers apply it to the image threshold segmentation for optimal threshold optimization.
The meta-heuristic optimization algorithms can be divided into four categories:
  • Evolutionary algorithms [24];
  • Human-based algorithms;
  • Algorithms based on physical and chemical information;
  • Algorithms based on swarm intelligence.
The evolutionary algorithm primarily simulates the evolution law of the survival of the fittest (Darwin’s law), assesses the overall progress of the population, and concludes with the optimal solution. Genetic algorithm (GA) [25] and differential evolution (DE) [26] are the prominent representatives. Khan et al. used GA to optimize the characteristics of apple disease points, enabling automatic disease detection in apples [27]. However, this algorithm may translate into a lot of time costs due to its low convergence rate. Liu et al. proposed a modified DE for selecting breast cancer imaging features and subsequently segmenting the image [28]. The hybrid approach produced better threshold values and greater stability than the original method, but its complexity inevitably increased due to the excessive mutation mechanism. Human-based algorithms are mainly inspired by human behavior, such as human teaching behavior, social behavior, learning behavior, emotional behavior, management behavior, and so on. Tabu Search [29] and Harmony Search (HS) [30] are representative of this. Srikanth and Bikshalu optimized the gray level using HS and Otsu’s approach and then segmented the image [31]. However, this approach only evaluated low-dimensional optimization problems and was limited to grayscale images. Algorithms based on physics and chemistry mainly come from physical rules and chemical reflection in the universe, of which the representative ones are the simulated annealing (SA) algorithm [32] and the gravitational search algorithm (GSA) [33]. The SA algorithm is derived from the simulation of thermodynamic processes. The GSA is based on the law of gravity and mass interactions. However, these algorithms’ underlying principles necessitate the cooperation of a considerable number of optimization individuals, leading to intensive computation and a difficult design. The swarm intelligence optimization algorithm obtains the optimal global solution by simulating the group’s wisdom. In this algorithm, each population is a biological population. Through cooperative behavior, we can accomplish objectives that individuals cannot accomplish alone. The particle swarm optimization (PSO) algorithm [34] is one of the traditional swarm intelligence optimization algorithms. Farshi et al. used PSO to automatically identify the number of clusters required for picture segmentation [35]. In brief,, these studies have successfully implemented meta-heuristic algorithms for the problem of image segmentation.
In our previous research, we attempted to apply optimization algorithms to forest canopy image segmentation issues. We used the PSO algorithm to optimize the two-dimensional Otsu solving thresholding process, thus improving the segmentation accuracy of forest canopy images [16]. A combination of two optimization algorithms was also attempted to obtain more accurate segmentation thresholds and to obtain a more precise segmentation accuracy [36]. These algorithms have improved the accuracy of segmentation, but at the same time they have greatly increased their complexity.
Based on the above discussions, this paper proposes a threshold segmentation of forestry canopy images based on the improved tuna swarm optimization (ITSO) algorithm [37]. TSO has few adjustable parameters and can be implemented easily [37]. More specifically, the contributions of this paper are as follows:
  • A new meta-heuristic optimization algorithm based on ITSO is proposed. Tent chaotic map is introduced to increase the performance of the global search;
  • An ITSO-based forest canopy image segmentation algorithm is acquired by combining ITSO with the symmetric cross-entropy algorithm. The proposed ITSO-based segmentation algorithm searches for a more precise threshold, thereby facilitating a better components partition of the forest canopy image;
  • The performance of the ITSO-based forest canopy image segmentation algorithm is investigated in detail. The experimental results demonstrate that the proposed algorithm has better performance than GA, PSO, and GOA.

2. Materials and Methods

2.1. Materials

The primary location for collecting the data in this study is the Liangshui Experimental Forest Farm (Longitude: 128.5719, Latitude: 47.1610) in Heilongjiang Province, China. In Liangshui Experimental Forest Farm, there are cold temperate coniferous forests, temperate coniferous and broad-leaved mixed forests, deciduous broad-leaved forests, and other vegetation types. The dataset is composed of hemispherical photographs (visible spectrum 400–700 nm). The assembled instrument is a Panasonic DMC-LX5 camera with a fisheye lens (F2, focal length: 3.9 mm, light sensitivity degree: 160, speed: 1/60 s). The shooting was performed in the morning, noon, and afternoon from July to October. Finally, one thousand forest canopy images with a resolution of 2736 * 2736 were collected. The 1000 images were divided into four categories: coniferous forest under ideal conditions, broadleaf forest under ideal conditions, complex canopy images, and canopy images under tough light conditions.

2.2. Improved Tuna Swarm Optimization Algorithm

2.2.1. The Principle of TSO

In 2021, the tuna school optimization algorithm was developed as a novel meta-heuristic optimization technique. In order to build the location update method that makes a process-optimized search possible, it models the foraging behavior of tuna schools. With this method, the tuna schools can pinpoint the whereabouts of the food which relates to the global optimal solution to the problem. Supposing there are N individuals in the tuna school, the mathematical model used to replicate the foraging behavior of a school of tuna is as follows:
X i t + 1 = { ω 1 ( X r a n d t + β | X r a n d t X i t | ) + ω 2 X i t , i = 1 , r a n d < t t max ω 1 ( X r a n d t + β | X r a n d t X i t | ) + ω 2 X i 1 t , i = 2 , 3 , , N , r a n d < t t max ω 1 ( X b e s t t + β | X b e s t t X i t | ) + ω 2 X i t , i = 1 , r a n d t t max ω 1 ( X b e s t t + β | X b e s t t X i t | ) + ω 2 X i 1 t , i = 2 , 3 , , N , r a n d t t max ,
ω 1 = a + ( 1 a ) t t max ,
ω 2 = ( 1 a ) ( 1 a ) t t max ,
β = e b l cos ( 2 π b ) ,
l = e 3 cos ( ( ( t max + 1 t ) 1 ) π ) ,
where X i t + 1 represents the position of i t h individual at the t + 1 iteration, t indicates the current iteration count, ω 1 and ω 2 are weight parameters that can lead the individual to move towards the positions of the optimal individual and the prior individual, X r a n d t denotes the position of randomly sampled individuals from the population, r a n d is a random vector with 0–1 values, X b e s t t is the position of the optimal individual (food) at the t iteration, t max is the maximum number of iterations, a is a constant that influences how closely the individual follows the best individual and the prior individual in the initial stage, and b is a uniformly distributed random number between 0 and 1.
In addition to the spiral-shaped position update mechanism, the tuna also does a parabolic-type position update utilizing the food as the reference point to improve the algorithm’s global search capabilities. This progression is depicted in Figure 1. Assuming that these two techniques are conducted concurrently, the probability of selection for each is set to 0.5. The mathematical model is described as follows.
X i t + 1 = { X b e s t t + r a n d ( X b e s t t X i t ) + T F p 2 ( X b e s t t X i t ) , r a n d < 0.5 T F p 2 X i t , r a n d 0.5 ,
where TF can be either 1 or −1 at random.

2.2.2. The Principle of ITSO

Chaos is a mathematical method that is frequently employed to enhance exploration and development. In 2017, Suresh and Lal combined logistic chaotic mapping with Darwin particle swarm optimization (DPSO) to produce a reliable, robust, and fast method for segmenting satellite images while maintaining picture quality [38]. Kohli and Arora compared various variants of grey wolf optimizer (GWO) and selected Chebyshev chaotic map to modify the critical parameter of GWO. Chaotic GWO (chaotic grey wolf optimizer) significantly improved the reliability of global optimality and the quality of results [39]. In 2020, inspired by the individual intelligence and sexual motivation of chimpanzee group hunting, Khishe and Mosavi proposed a chimp optimization algorithm (Choa), in which the semi-deterministic characteristics of chaotic mapping correspondingly boosted the development capability of Choa [40].
Initializing the tuna optimization algorithm initially involves randomly generating the position of tuna individuals within the upper and lower bounds. This initialization may result in an unequal distribution of tuna throughout space, causing the algorithm to mature towards a locally optimal solution prematurely. In this study, an initialization form based on the Tent chaotic sequence is given as a solution to this problem. A segmented linear mapping constitutes the Tent chaotic sequence. Tent mapping with a uniform distribution function and high correlation enables the algorithm to readily escape from the optimal local solution, therefore preserving the variety of the population and enhancing its capacity for global search. Utilizing the sequence mapped from the range [0, 1] based on chaotic mapping, the tuna population is then initialized according to the chaotic factor. The mathematical formula of Tent mapping is as follows:
x n + 1 = { x n α , 0 x n < α 1 x n ( 1 α ) , α < x n < 1 ,
where the value range of α in this paper is 0.5. The model initialized by the Tent map is
x i int = x min + C h a o s ( x max x min ) ,
where x max and x min represent the lower limit and upper limit of the value of the independent variable, respectively.

2.2.3. Implementation Process of ITSO

For an optimization problem in n-dimensional space, the implementation process of the ITSO algorithm is described in Algorithm 1, where z is the probability that an individual tuna chooses a position in the search space in each iteration.
Algorithm 1. Pseudocode for Improved Tuna Swarm Optimization Algorithm
Initialize the random population of individuals x i
Assign free parameters a and z
 While (t < tmax)
  Calculate the fitness values of individuals
  Update X b e s t t
  For (each individual) do
   Update ω 1 ,   ω 2 ,   p
   If (rand < z) then
    Update the position X i t + 1 using Equation (8)
   Else if (rand ≥ z) then
    If (rand < 0.5) then
     If (t/tmax < rand) then
      Update the position X i t + 1 using Equation (1)
     Else if (t/tmax ≥ rand) then
      Update the position X i t + 1 using Equation (1)
    Else if (rand ≥ 0.5) then
      Update the position X i t + 1 using Equation (6)
  End for
   t = t+1
 End while
Return the best individual X b e s t and the best fitness value F ( X b e s t )

2.3. ITSO-Based Forestry Canopy Segmentation Algorithm

In this section, an ITSO-based segmentation algorithm is devised by employing the proposed algorithm to improve the symmetric cross-entropy segmentation algorithm.

2.3.1. Symmetric Cross-Entropy

Assuming that the size of the image f is M × N and its gray levels are 0 , 1 , , L . The number of all pixels with a gray scale of i in the image is noted as h ( i ) , i = 0 , 1 , , L , the probability of i is p ( i ) = h ( i ) / ( M × N ) , and i = 1 L p ( i ) = 1 . The threshold t is used to segment the pixels C T = { ( m , n ) | f ( m , n ) = 0 , 1 , , L } of the image f into object category C O = { ( m , n ) | f ( m , n ) = 0 , 1 , , t } and background category C B = { ( m , n ) | f ( m , n ) = t + 1 , t + 2 , , L } . The prior entropy of object and background are S O ( t ) = i = 0 t p ( i ) and S B ( t ) = i = t + 1 L p ( i ) . The mean value of the grayscale is μ O ( t ) = i = 0 t p ( i ) i / S O ( t ) and μ B ( t ) = i = t + 1 L 1 p ( i ) i / S B ( t ) . The overall mean is μ T ( t ) = i = 0 L p ( i ) i . Assuming that
p m , n = f ( m , n ) ( x , y ) C T f ( x , y ) ,
q m , n = { μ O ( t ) ( x , y ) C T f ( x , y ) , ( m , n ) C O μ B ( t ) ( x , y ) C T f ( x , y ) , ( m , n ) C B ,
where ( m , n ) C T p m , n = 1 , ( m , n ) C T q m , n = 1 , p m , n 0 , q m , n 0 . So p m , n and q m , n satisfy the condition of Kullback formula [41], the symmetry cross-entropy between the distribution P = { p m , n } and Q = { q m , n } is
D ( P : Q ) = 1 i = 0 L p ( i ) i { i = 0 t p ( i ) [ i μ O ( t ) ] ln i μ O ( t ) + i = i + 1 L p ( i ) [ i μ B ( t ) ] ln i μ B ( t ) }
From Equation (7), we can see that i = 0 L p ( i ) i is independent of t . After dividing this constant factor, the intra-class symmetric cross-entropy is as follows
E I . S ( t ) = i = 0 t p ( i ) [ i μ O ( t ) ] ln i μ O ( t ) + i = i + 1 L p ( i ) [ i μ B ( t ) ] ln i μ B ( t )
Therefore, the overall symmetric cross-entropy of the image is
E ( t ) = i = 0 L p ( i ) i ln i μ T + i = 0 L p ( i ) μ T ln μ T i = E I , S ( t ) + E B , S ( t )
Then,
E B , S ( t ) = i = 0 t p ( i ) [ μ O ( t ) μ T ] ln i μ T + i = t + 1 L p ( i ) [ μ B ( t ) μ T ] ln i μ T
E I . S ( t ) can be obtained by simplifying as follows
E I . S ( t ) = i = 0 L p ( i ) i ln i [ μ O ( t ) i = 0 t p ( i ) i ln i + μ B ( t ) i = i + 1 L p ( i ) ln i ] ,
where i = 0 L p ( i ) i ln i is independent of t in Equation (11). Then, minimizing Equation (11) is equivalent to maximizing Equation (12).
η ( t ) = [ μ O ( t ) i = 0 t p ( i ) i ln i + μ B ( t ) i = i + 1 L p ( i ) ln i ] = ω O ( t ) μ O ( t ) μ O ( t ) + ω B ( t ) μ B ( t ) μ B ( t ) ,
where μ O ( t ) = i = 0 t p ( i ) ln i / ω O ( t ) and μ B ( t ) = i = t + 1 L 1 p ( i ) ln i / ω B ( t ) represent the mean value of the grayscale in the object and background classes after taking logarithm, respectively.
E B . S ( t ) can be obtained by simplifying as follows
E B , S ( t ) = ω O ( t ) ω B ( t ) [ μ O ( t ) μ B ( t ) ] [ μ O ( t ) μ B ( t ) ]
Thus, the optimal threshold t is
t = A r g max 0 t L { E B , S ( t ) }

2.3.2. Implementation of the ITSO-Based Segmentation Algorithm

In this paper, the symmetric cross-entropy threshold segmentation criterion function is used as the objective function of the ITSO algorithm to calculate the optimal threshold value. The position of the tuna is the coordinate of the threshold point. First, the image histogram is extracted from the forest canopy image. Then, the objective function is set according to the symmetric cross-entropy threshold selection formula. Next, the initial position of the primary individual is randomly determined. ITSO parameters are defined, including the random parameter a and the probability z of each individual to select a position in the search space. According to the ITSO algorithm, several tactics are then utilized to iterate through the principal persons. In each iteration, each individual randomly chooses one of the two strategies to execute or selects a position in the search space based on the probability z. The optimization of the main individuals is completed by continuous comparison and selection to obtain the optimal threshold. Finally, the forest canopy image is segmented according to the optimal threshold using symmetric cross-entropy, and the segmentation result is output. The flowchart is shown in Figure 2.

3. Results

3.1. Experiment Results

In this section, the ITSO optimized symmetric cross-entropy threshold selection methods proposed in this paper, the symmetric cross-entropy threshold segmentation algorithm based on TSO, the symmetric cross-entropy threshold segmentation algorithm based on GA, the symmetric cross-entropy segmentation algorithm based on PSO, the symmetric cross-entropy segmentation algorithm based on GOA, and the Fuzzy c-means method [42] are used for forestry canopy segmentation experiments. In order to qualitatively evaluate the performance of each algorithm, 500 as the maximum number of iterations is used as the iteration termination condition of each algorithm. In the experimental results, the optimal values of each evaluation index are shown in bold in the table. The experiment runs under Intel (R) Core (TM) i5-7300 hq CPU @ 2.50 Ghz, 8 GB memory, and a 64-bit operating system, and the programming environment is Windows10, Matlab 2014b. The parameter settings of an algorithm have a significant impact on the performance of the algorithm. For a fair comparison, the parameter settings of all compared algorithms are based on the parameters used by the authors of the original article. The parameter settings of each optimization algorithm are shown in Table 1.

3.2. Performance of ITSO Algorithm

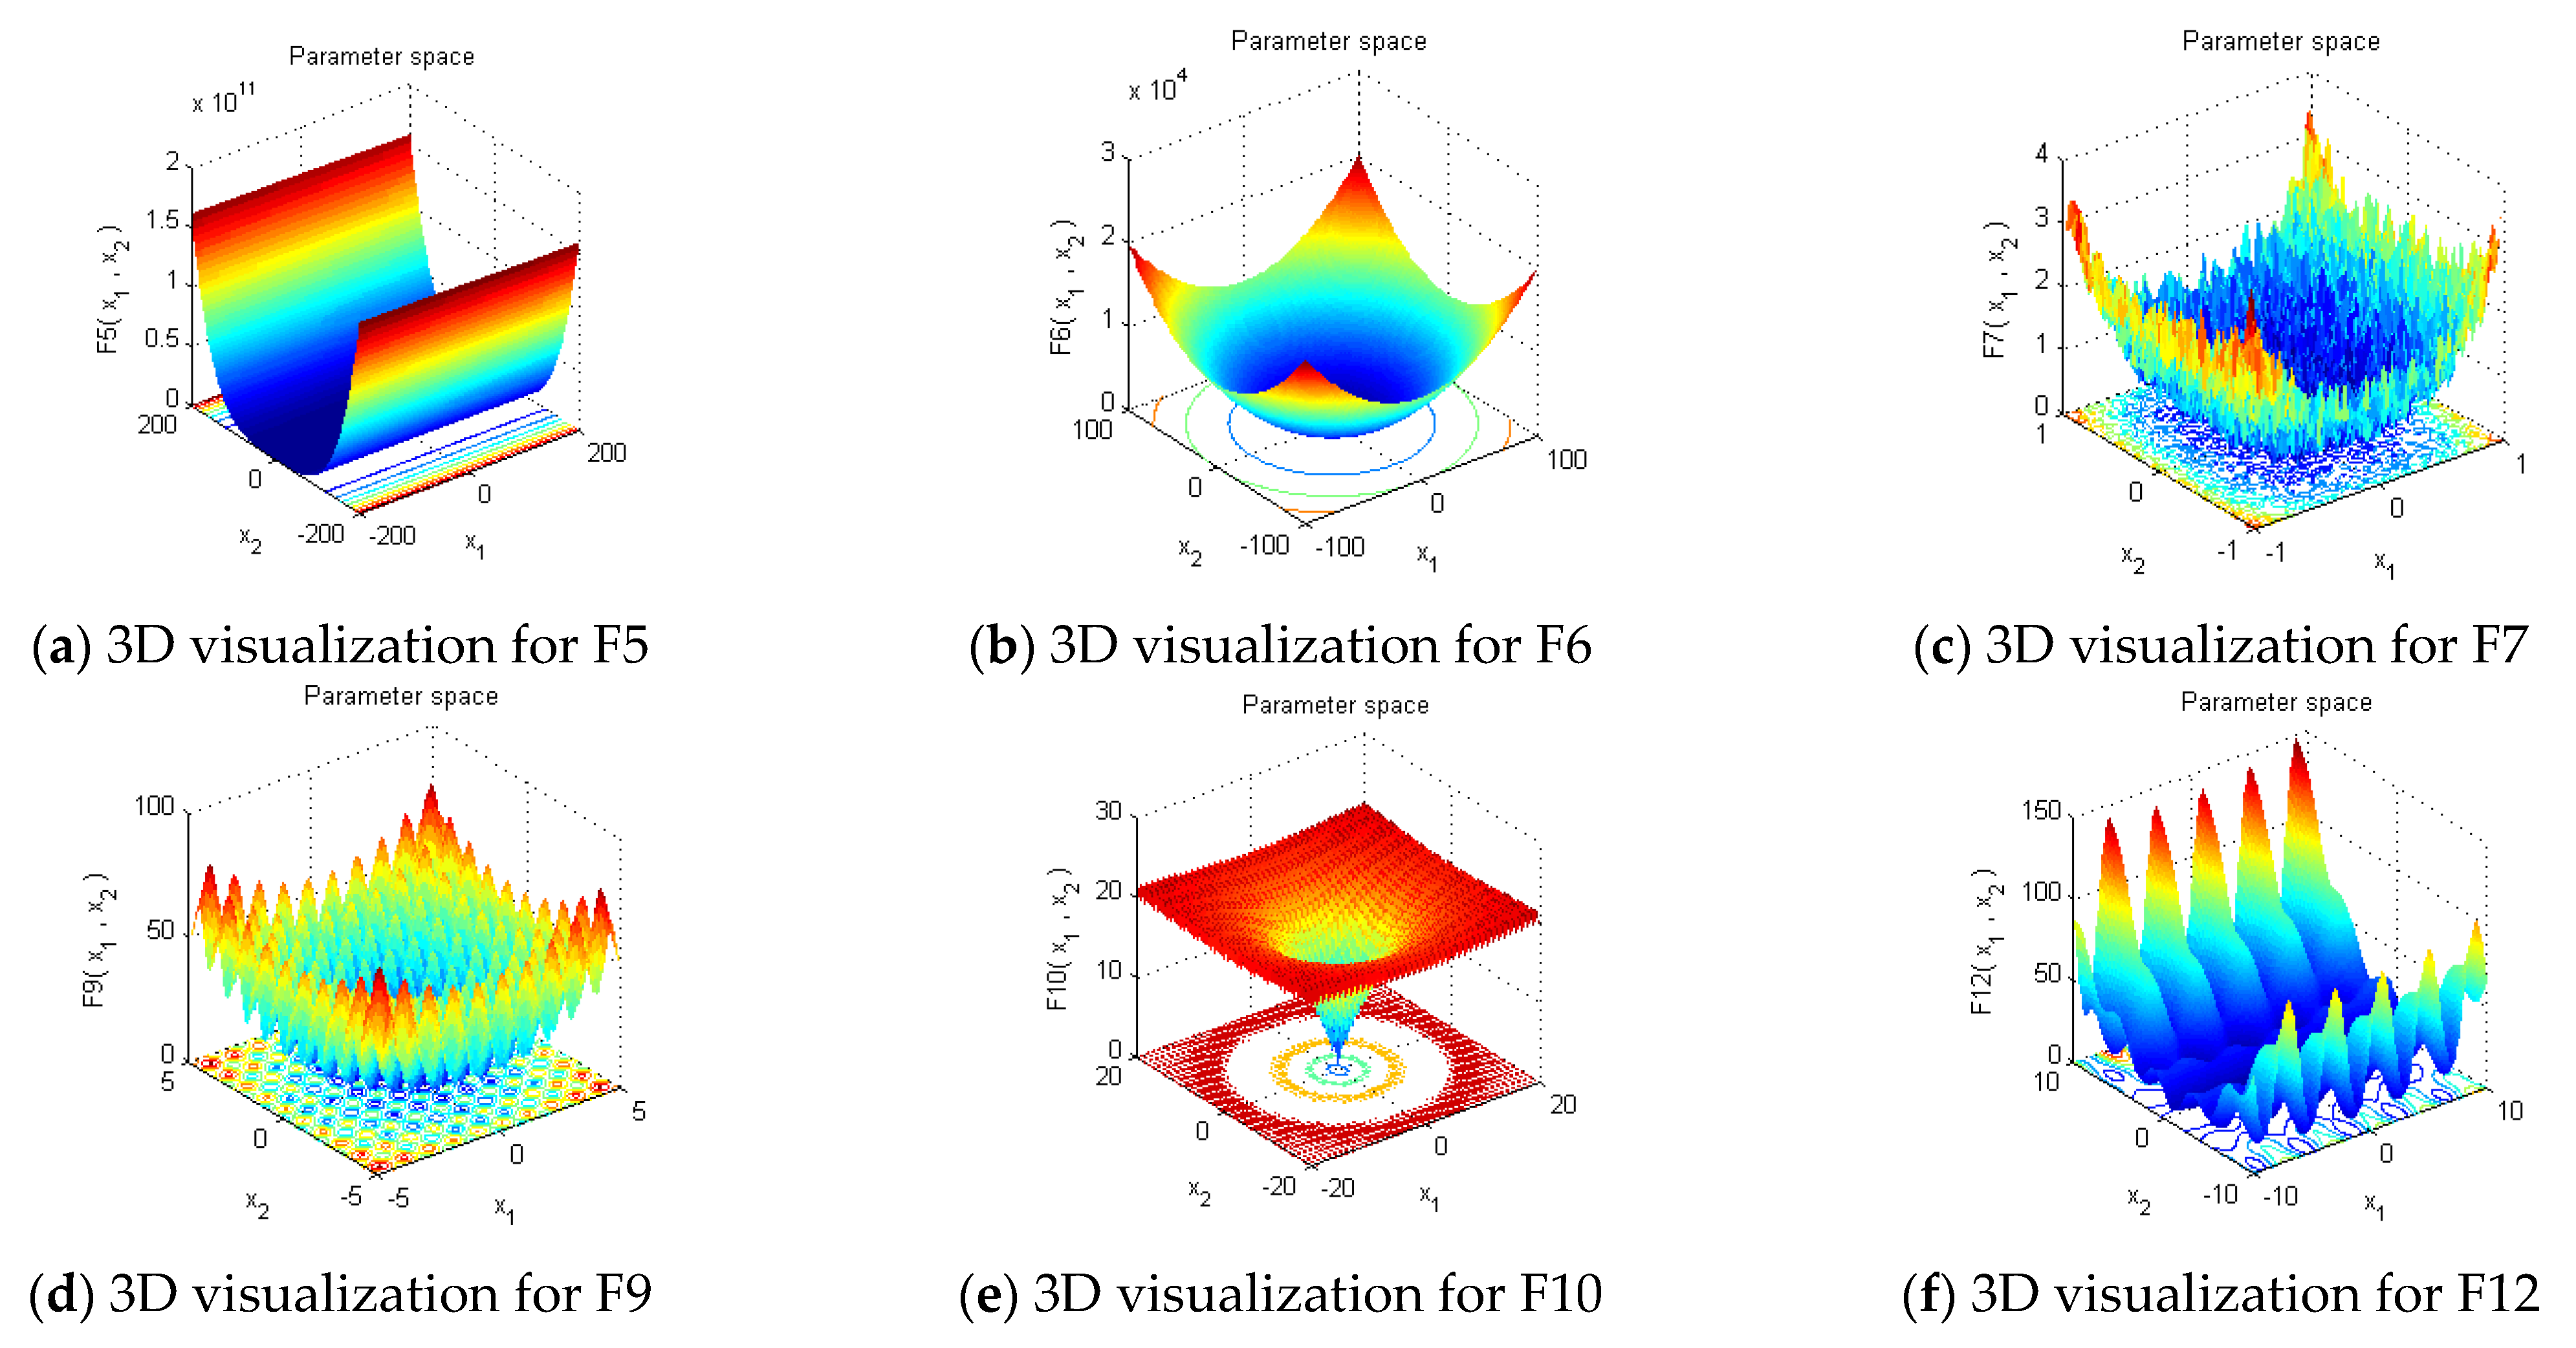
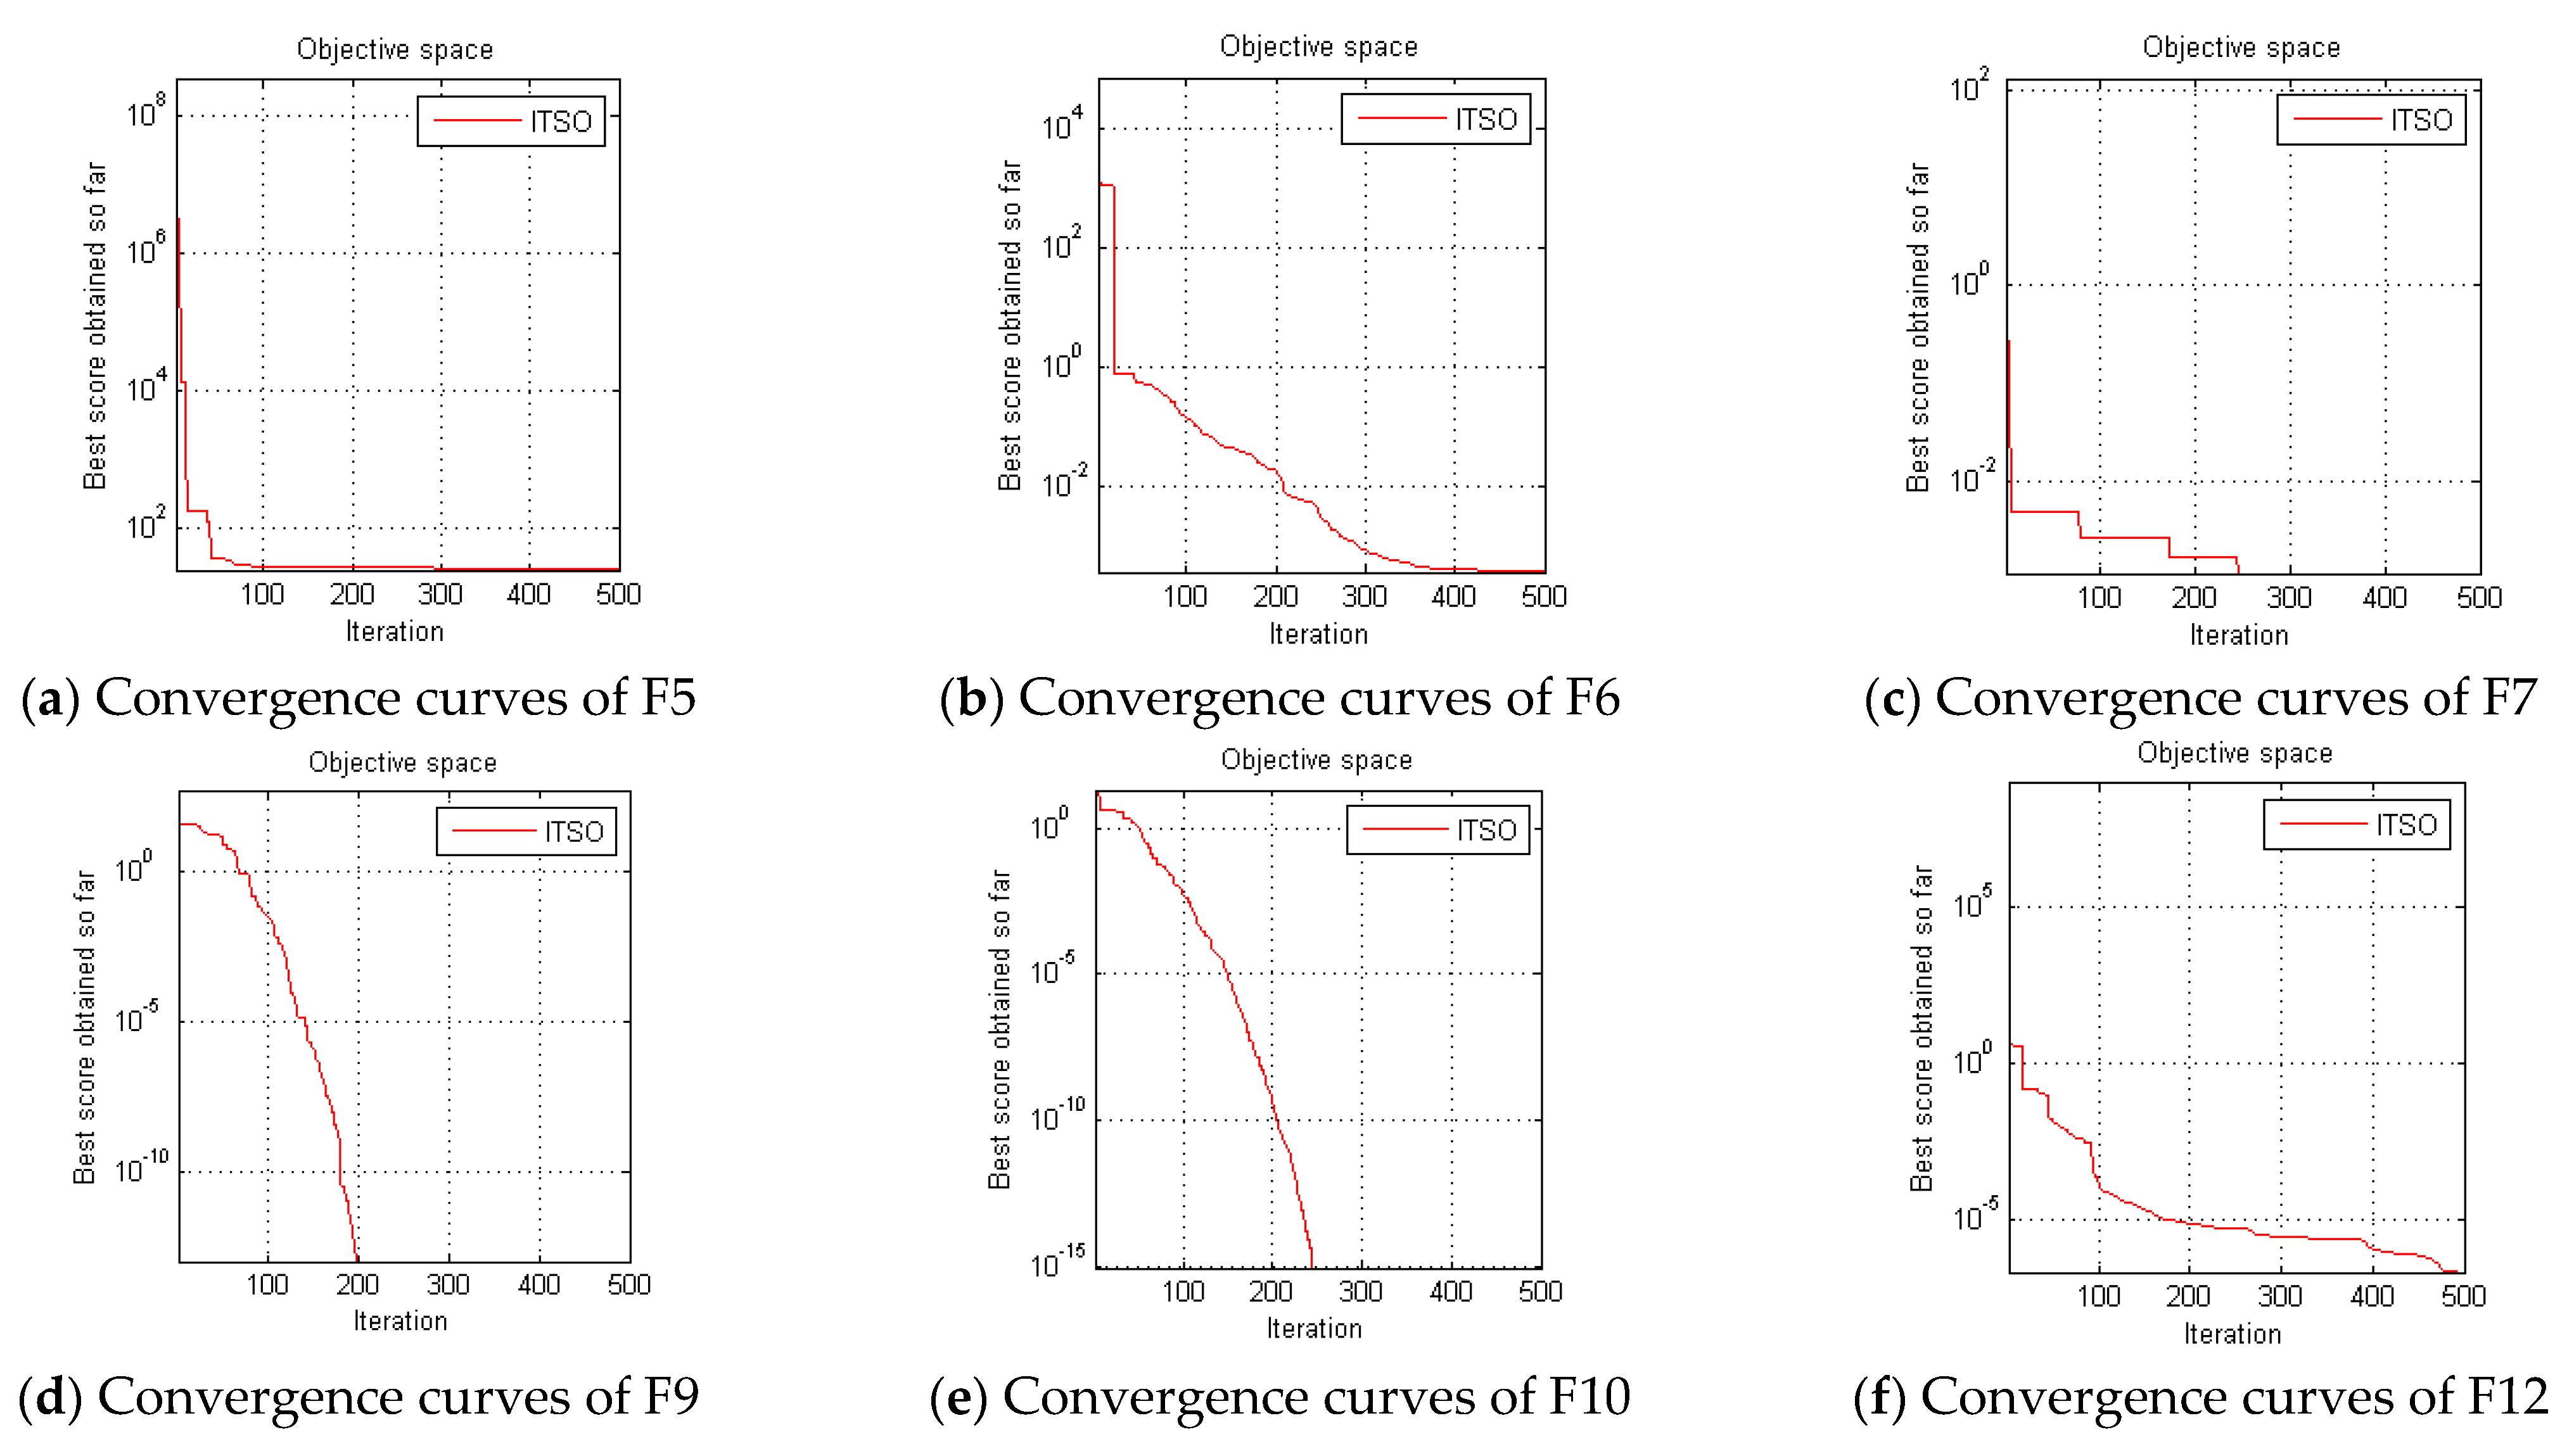
Before applying the ITSO algorithm to forestry canopy image segmentation, this section first tests the performance of the ITSO algorithm in function optimization and the improvement of the ITSO algorithm compared to the TSO algorithm. The algorithms used for comparison is ant lion Optimizer (ALO) [43], PSO, and sine cosine algorithm (SCA) [44]. In this section, three unimodal functions, namely F5, F6, and F7 (Table 2), and three multimodal functions, namely F9, F10, and F12 (Table 2), are used to test the optimization performance of the algorithm, as shown in Table 3. A three-dimensional visualization of these functions is given in Figure 3. The convergence curve of ITSO to the benchmark function is shown in Figure 4 with dimensions of 30.

3.3. Results of ITSO Algorithm on Image Segmentation

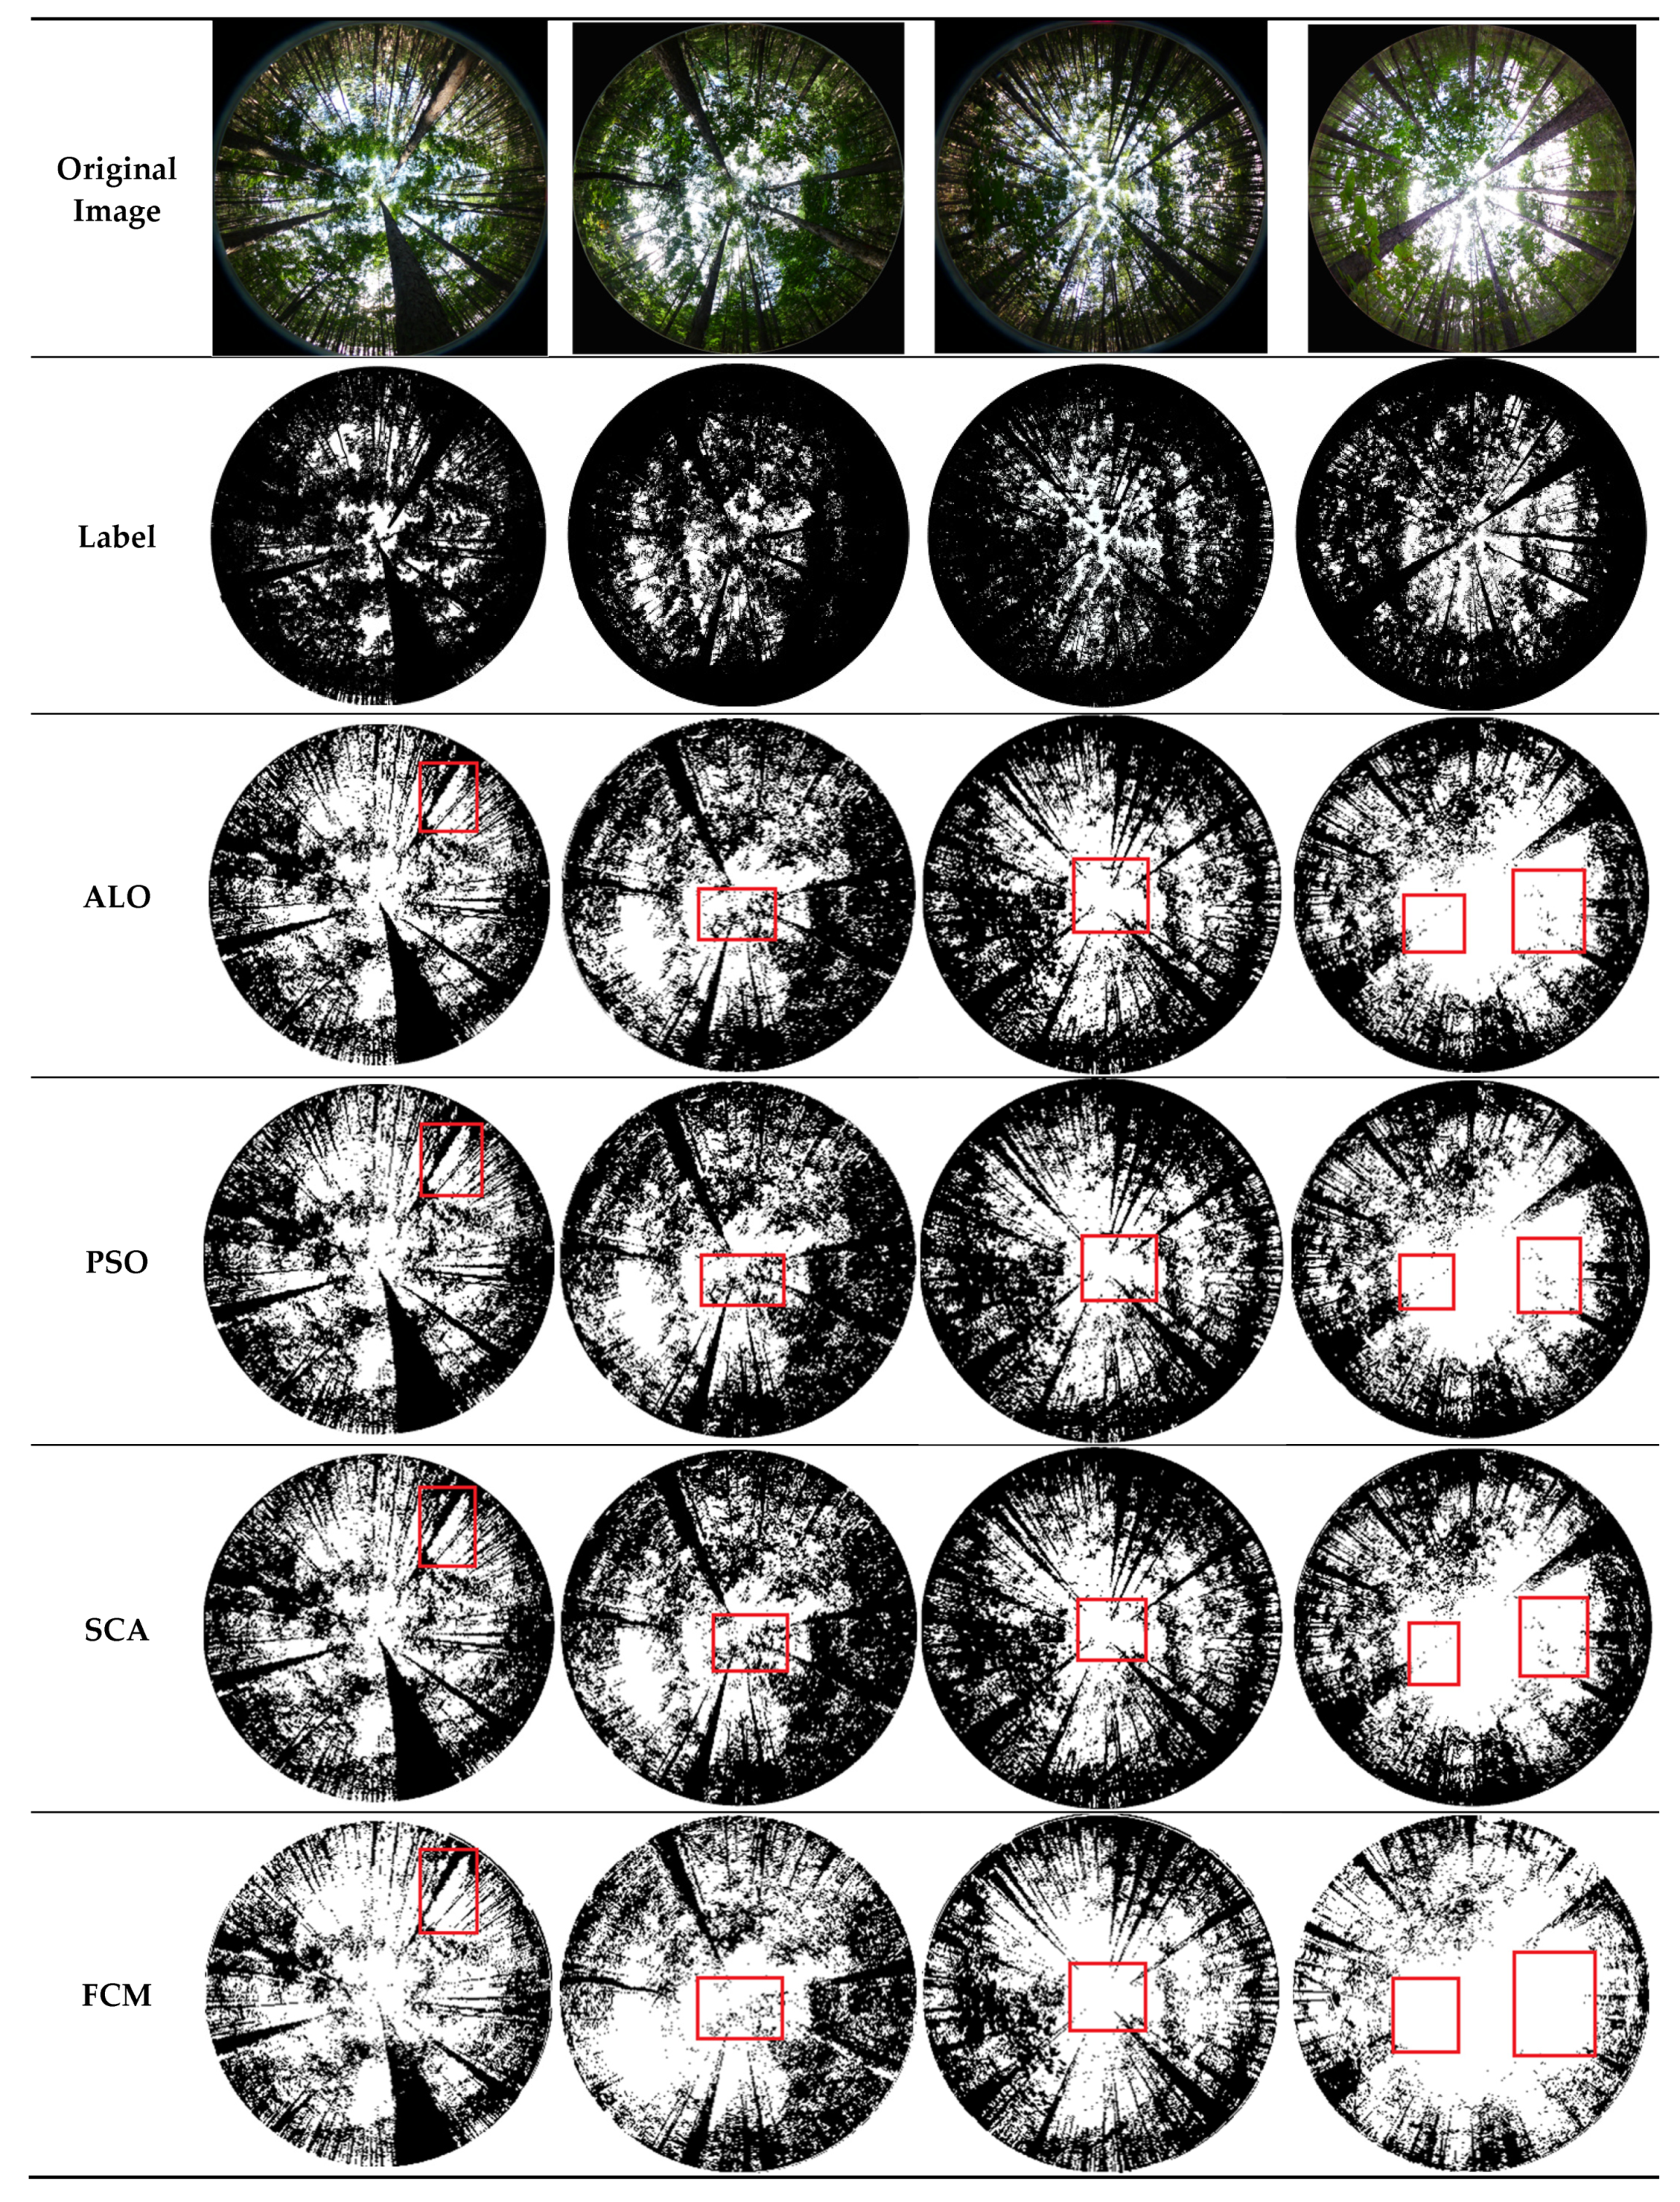
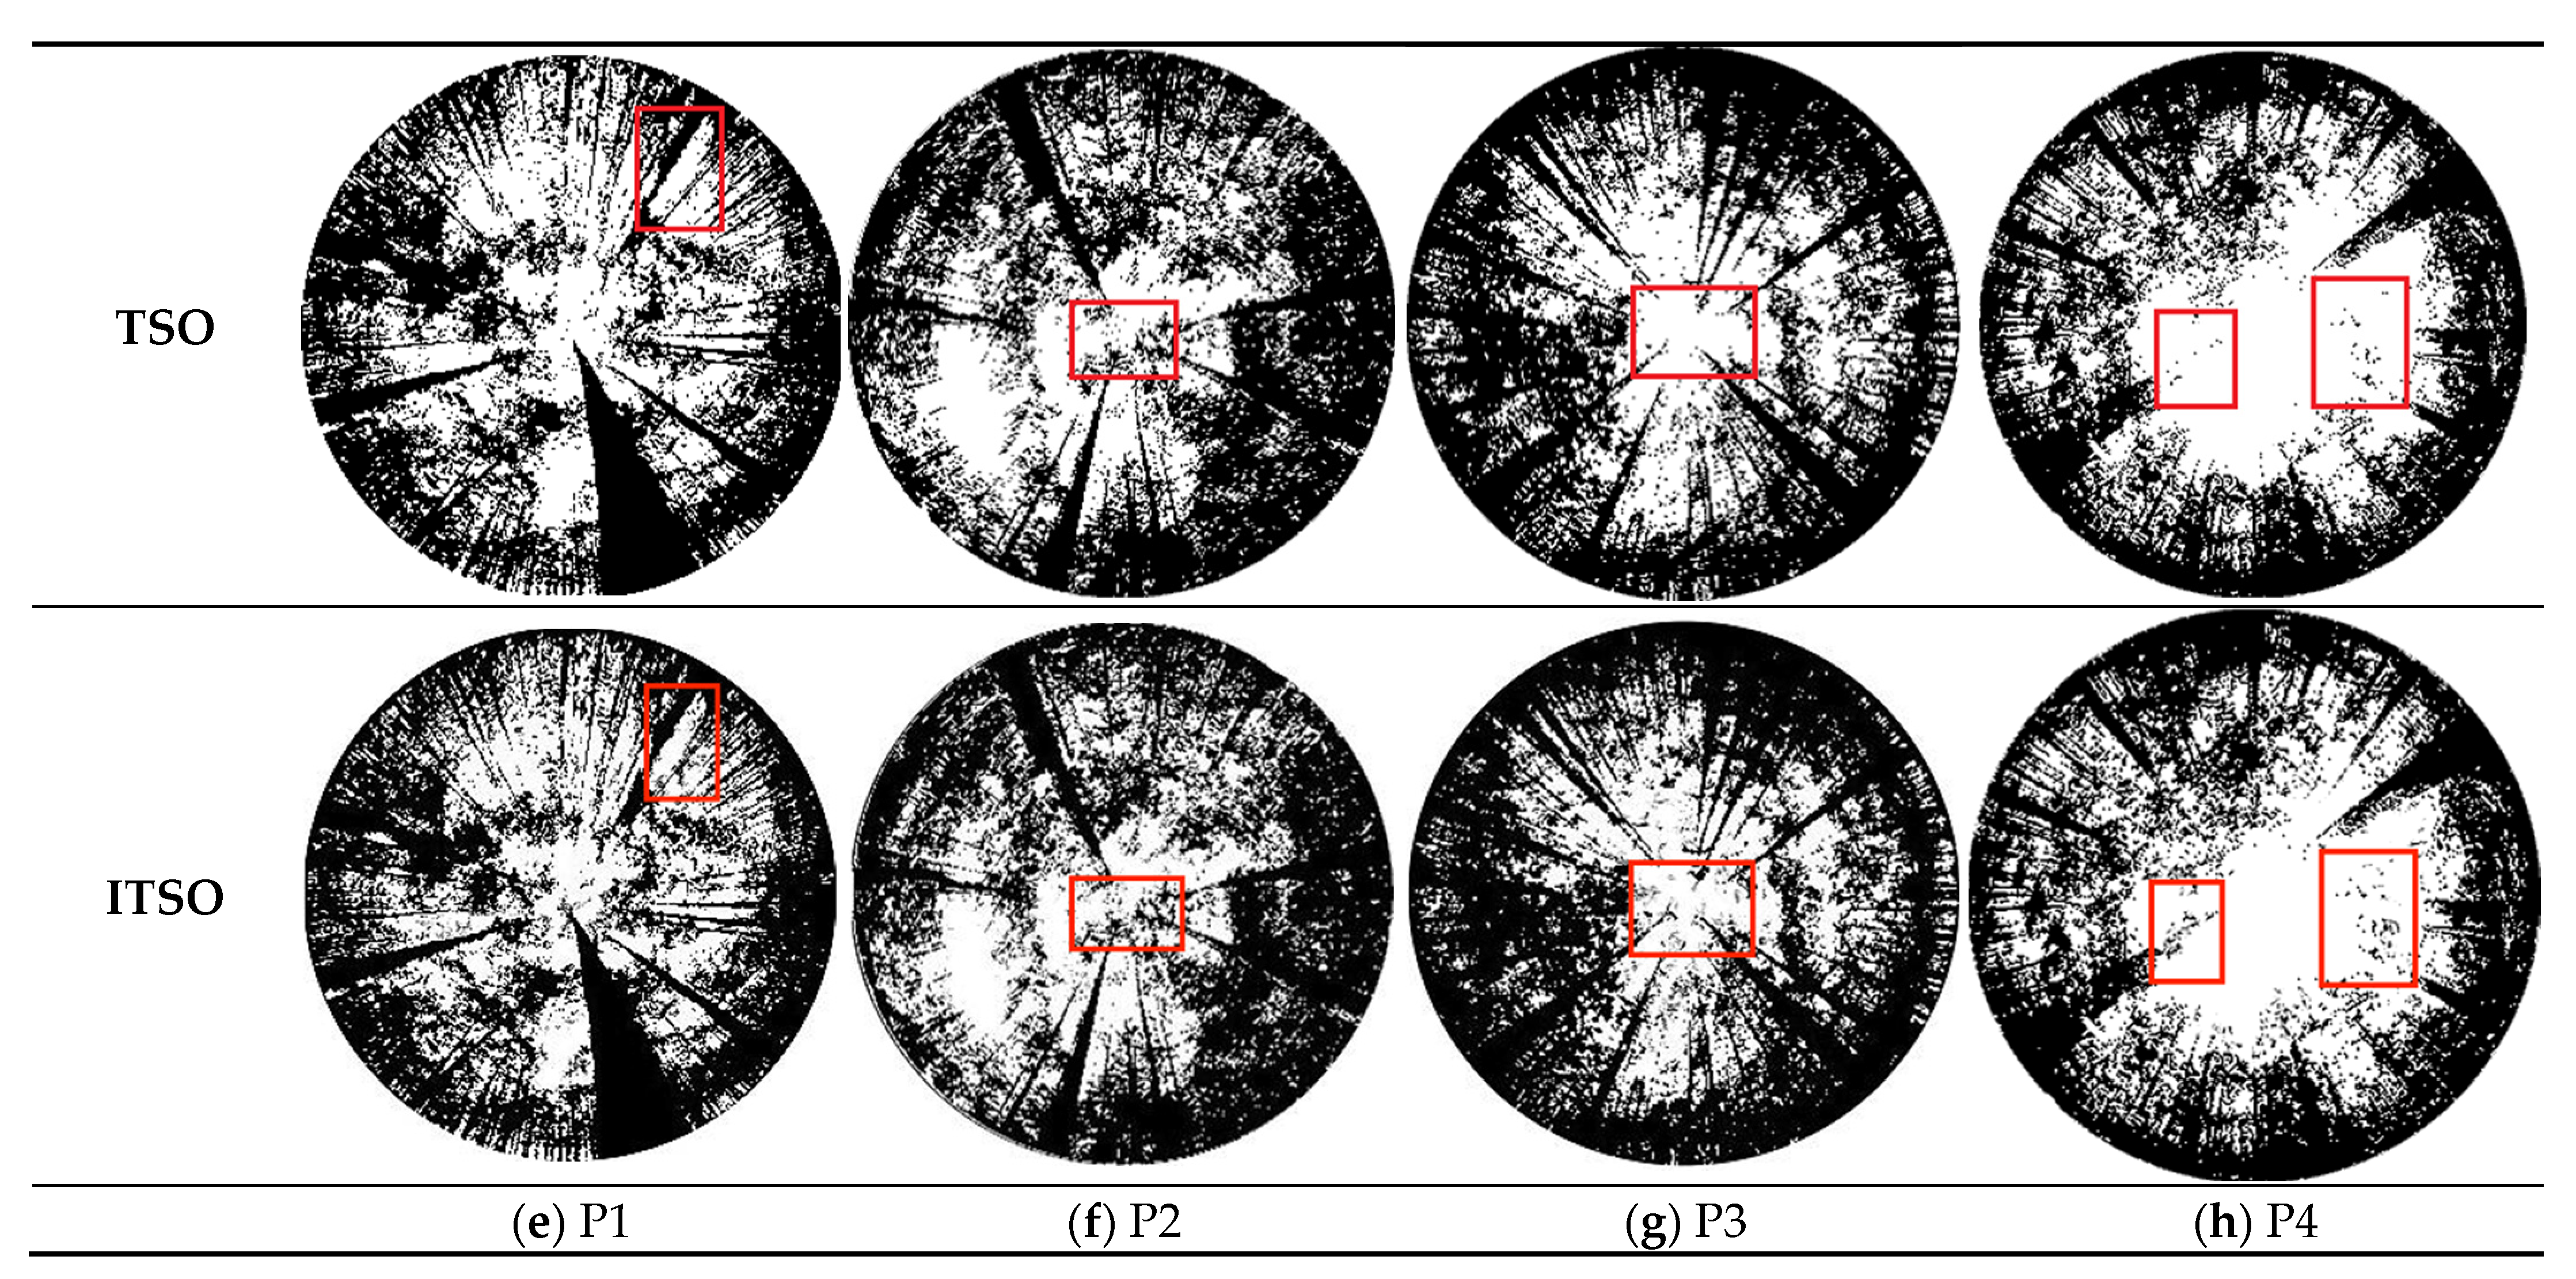
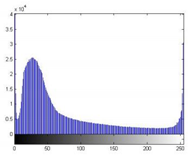
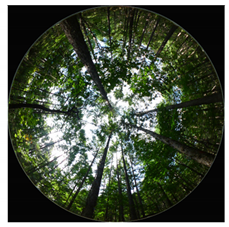
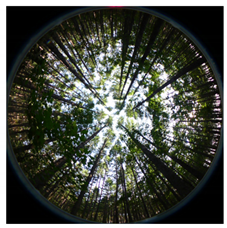
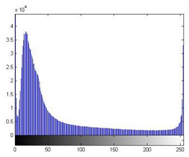
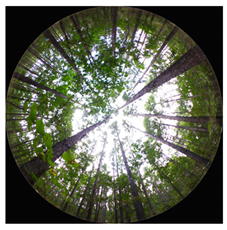
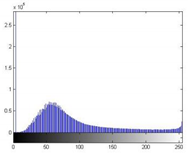
During the segmentation experiment, the images in the dataset are used to evaluate algorithm performance. In this section, we randomly select one image from each of the four categories of the dataset to demonstrate the algorithm performance (P1 is a coniferous forest, P2 is a broad-leaved forest, and P3 is an image with a complex canopy area, that is, the canopy color is not uniform and close to the background color, while P4 is an image with tough lighting conditions, that is, too strong or too dark). To confirm the fairness of the experimental studies, we apply the exact requirements to all approaches. Table 4 displays the histograms of the images. Figure 5 shows the results of image segmentation.

3.4. Performance of ITSO Algorithm on Forestry Canopy Image Segmentation

This section employs the ITSO-based segmentation algorithm in forest canopy image segmentation experiments. The threshold segmentation results are mainly carried out from two aspects: visual evaluation and quantitative evaluation. Visual evaluation is primarily evaluated from image misclassification, regional consistency, and edge integrity. Quantitative evaluation calculates the performance index of the segmented image quantitatively and evaluates the segmentation effect. Several image evaluation metrics to compare the quality of the segmented images are introduced, and the competence of the proposed algorithm is discussed. In this paper, the mean absolute error (MAE), the relative volume difference (RVD), the intersection-over-union (IoU), and the average symmetric surface distance (ASD) are used to evaluate the segmentation results quantitatively.
If the input image f is a sample of M × M pixels, X is the segmentation results, and Y is the true values.
The MAE shows the degree of deviation between the segmented result and the true value. The smaller its value, the better the segmentation performance. It is determined as follows:
M A E = 1 M × M i = 1 M j = 1 M | X ( i , j ) - Y ( i , j ) |
The RVD and IoU can reflect the regional consistency between the segmented results and the true values. RVD is defined as follows:
R V D = | V X | - | V Y | | V Y | ,
where V X and V Y denote the number of all pixels of the segmentation result X and the truth value Y , respectively. The smaller the value of RVD, the better the segmentation effect.
IoU is the overlap area between the segmentation result X and the truth value Y divided by the joint area between the segmentation result X and the truth value Y . The larger its value, the better the segmentation effect. The mathematical formula of IoU is
I o U = X Y X Y
ASD is mainly used to measure the segmentation accuracy of the boundary. The smaller the value of ASD, the better the segmentation effect. It is defined as
A S D = ( x i j B ( X ( i , j ) ) min y i j B ( Y ( i , j ) ) x y + y i j B ( Y ( i , j ) ) min x i j B ( X ( i , j ) ) y i j x i j ) | B ( X ( i , j ) ) | + | B ( Y ( i , j ) ) | ,
where B ( X ( i , j ) ) is the set of boundary pixels of the segmentation result X , and B ( Y ( i , j ) ) is the set of boundary pixels of the truth value Y .
These evaluation criteria are used to evaluate the algorithm and comparison algorithm proposed in this paper. The results are shown in Table 5.

4. Discussion

4.1. Analysis of ITSO Algorithm

In Table 3, functions F5–F7 are unimodal and suitable for assessing exploitation capability since they have only one global optimum. As can be found in Table 3, ITSO is very competitive with other compared algorithms. ITSO ranks first for all unimodal problems. In particular, there is a significant improvement over other algorithms in function 5.
Through experiments on other more complex multimodal functions, we find that the standard deviation of ITSO is smallest in functions F5, F7, F9, F10, and F12, which shows that ITSO has improved the optimization accuracy and stability. Unlike unimodal problems, multimodal functions contain numerous local optimums related to design variables. These problems measure the composite tendencies and are favored to evaluate the intensification capability and its balance between diversifications. The smallest result standard deviation shows that the proposed algorithm has an exceptional capacity to avoid local optimization and can stably converge to the optimal value with reasonable accuracy, while always being the most efficient solution for the vast majority of multimodal issues.
The experimental results in Table 3 reveal that the optimization results of the TSO and ITSO algorithms are highly accurate in terms of unimodal and multimodal functions. Additionally, the ITSO algorithm is better than TSO in terms of the mean and standard deviation of the function. The results indicate that the additional chaotic factor improves the convergence accuracy and convergence stability of TSO’s global detection ability convergence. Therefore, the ITSO algorithm effectively solves the issue that the traditional TSO algorithm is susceptible to in local convergence.

4.2. Accuracy Analysis of ITSO Algorithm on Image Segmentation

From the red rectangular boxes in Figure 5, it is not difficult to conclude that the segmentation accuracy of the optimization method is generally higher than that of FCM, which performed better in image segmentation in previous work. Due to the segmentation effect, all algorithms suffer from over-segmentation, imprecise background and target delineation, and difficulties in discerning the basic outline when applied to images of forest canopy captured under poor natural illumination circumstances. However, the algorithm in this paper retains relatively more details. For images with complex canopy regions, the segmentation advantages of other algorithms are not obvious, except for the ITSO proposed in this paper. In a comprehensive view, the ITSO algorithm is better than other algorithms and has a more effective segmentation effect. Meanwhile, the method proposed in this paper outperforms other algorithms in specific details and clarity of image segmentation.
Table 5 shows the values and the mean values of four evaluation indices of different algorithms in the forest canopy image dataset. From the data in Table 5, it can be seen that for the four selected evaluation criteria, namely MAE, RVD, IoU, and ASD, the algorithm in this paper shows the best performance in terms of the mean value, which indicates that the improved method in this paper is effective.
For the evaluation metric MAE, both TSO and ITSO achieved a minimum value of 0.0341 for the segmentation of forest canopy images with tough lighting conditions. ITSO also achieved the minimum value of MAE on the segmentation of three additional forest canopy images. When compared to other algorithms, ITSO has the lowest segmentation error, as measured by MAE.
The RVD value of the ITSO algorithm presented in this study is lower than that of all other investigated algorithms, including TSO, ALO, PSO, SCA, and FCM. This indicates the segmentation result of the ITSO algorithm is the closest to the true value.
For the segmentation of broad-leaved forest, SCA performed the best with an IoU of 0.5861, outperforming the technique presented in this study by 0.0171. SCA also performed the best with an ASD of 3.9844, which is lower than ITSO by 0.0906. For the segmentation of canopy images with complex lighting conditions, TSO performed the best with an IoU of 0.6246, outperforming the technique presented in this study by 0.0262. TSO also performed the best with an ASD of 2.3623, which is lower than ITSO by 0.1849. According to the definitions of the metrics IoU and ASD, from the data, the SCA algorithm performs best in segmenting broadleaf forest canopies, and the TSO algorithm performs best in segmenting canopy images with complex lighting conditions. However, on the evaluation indices MAE and RVD, these two algorithms performed worse than ITSO for these two types of forestry canopy images. Therefore, it can be challenging to evaluate a segmentation algorithm solely using quantitative metrics in some cases. This is the reason why we analyze the algorithms through both visual evaluation and quantitative evaluation.
Based on the above analysis, it can be concluded that the ITSO algorithm proposed in this paper has a positive effect on processing symmetric cross-entropy threshold segmentation and can segment the forest canopy image effectively. However, in order to reduce the logical complexity of the algorithm and assure its computational efficiency, the algorithm proposed in this paper is slightly underperforming in dealing with issues that require high accuracy.

5. Conclusions

This paper presents a thresholding approach for segmenting forest canopy images utilizing symmetric cross-entropy combined with improved tuna swarm optimization. Compared to the ant lion optimizer, the particle swarm optimization, the sine cosine algorithm, and the tuna swarm optimization, the results of the symmetric cross-entropy with improved tuna swarm optimization are more efficient. This research also demonstrates that the proposed algorithm is superior than the previously popular approach: the Fuzzy c-means algorithm. To assess the performance of the segmentation algorithm, the approach was reviewed and examined based on performance metrics including mean absolute error, relative volume difference, intersection-over-union, and average symmetric surface distance. In addition, the segmentation results were compared with those obtained using other methods. Using these two methodologies, the robustness of the proposed method for forest canopy image segmentation is verified quantitatively and qualitatively.
The algorithm presented in this paper only addresses the problem of segmentation of forest canopy images. In future work, we aim to improve ITSO to achieve more precise image segmentation and shorter computation time and extend its application to other forestry images. We also intend to apply the proposed ITSO method to the hyper-parameter optimization of deep learning models and practical engineering challenges.

Author Contributions

Conceptualization, L.Z.; methodology, L.Z. and J.W.; software, J.W. and B.W.; validation, J.W., B.W. and A.R.; formal analysis, J.W.; investigation, J.W.; resources, L.Z.; data curation, A.R.; writing—original draft preparation, J.W., B.W. and A.R.; writing—review and editing, L.Z. and J.W.; visualization, B.W.; supervision, L.Z.; project administration, L.Z.; funding acquisition, L.Z. and J.W. All authors have read and agreed to the published version of the manuscript.

Funding

This research was funded by Fundamental Research Funds of Central Universities (2572021AW40), the non-special funds for basic scientific research in central universities, the National Natural Science Foundation of China (31370710), the Forestry Science and Technology Extension Project (2016 [34]), the 948 Project (2014-4-46), and the Postdoctoral Research Fund of Heilongjiang Province (LBH-Q13007).

Institutional Review Board Statement

Not applicable.

Informed Consent Statement

Not applicable.

Data Availability Statement

The raw data supporting the conclusions of this article will be made available by the authors, without undue reservation.

Acknowledgments

The authors thank the anonymous reviewers for their useful comments that improved the quality of the paper.

Conflicts of Interest

The authors declare that the research was conducted in the absence of any commercial or financial relationships that could be construed as a potential conflict of interest. The funders had no role in the design of the study; in the collection, analyses, or interpretation of data; in the writing of the manuscript; or in the decision to publish the results.

References

  1. Houghton, R.A. Aboveground forest biomass and the global carbon balance. Glob. Chang. Biol. 2005, 11, 945–958. [Google Scholar] [CrossRef]
  2. Bonan, G.B. Forests and climate change: Forcings, feedbacks, and the climate benefits of forests. Science 2008, 320, 1444–1449. [Google Scholar] [CrossRef] [PubMed] [Green Version]
  3. Rehman, A.; Ma, H.; Ahmad, M.; Irfan, M.; Traore, O.; Chandio, A.A. Towards environmental Sustainability: Devolving the influence of carbon dioxide emission to population growth, climate change, forestry, livestock and crops production in Pakistan. Ecol. Indic. 2021, 125, 107460. [Google Scholar] [CrossRef]
  4. Iglhaut, J.; Cabo, C.; Puliti, S.; Piermattei, L.; O’Connor, J.; Rosette, J. Structure from motion photogrammetry in forestry: A review. Curr. For. Rep. 2019, 5, 155–168. [Google Scholar] [CrossRef] [Green Version]
  5. Birdsey, R.; Pan, Y. Trends in management of the world’s forests and impacts on carbon stocks. For. Ecol. Manag. 2015, 355, 83–90. [Google Scholar] [CrossRef]
  6. Perumal, B.; Kalaiyarasi, M.; Deny, J.; Muneeswaran, V. Forestry land cover segmentation of SAR image using unsupervised ILKFCM. In Materials Today: Proceedings; Elsevier: Amsterdam, The Netherlands, 2021. [Google Scholar]
  7. Di Gennaro, S.F.; Nati, C.; Dainelli, R.; Pastonchi, L.; Berton, A.; Toscano, P.; Matese, A. An automatic UAV based segmentation approach for pruning biomass estimation in irregularly spaced chestnut orchards. Forests 2020, 11, 308. [Google Scholar] [CrossRef] [Green Version]
  8. Moorthy, S.M.K.; Calders, K.; Vicari, M.B.; Verbeeck, H. Improved supervised learning-based approach for leaf and wood classification from LiDAR point clouds of forests. IEEE Trans. Geosci. Remote Sens. 2019, 58, 3057–3070. [Google Scholar] [CrossRef] [Green Version]
  9. Ni, W.; Sun, G.; Guo, Z.; Zhang, Z.; He, Y.; Huang, W. Retrieval of forest biomass from ALOS PALSAR data using a lookup table method. IEEE J. Sel. Top. Appl. Earth Obs. Remote Sens. 2012, 6, 875–886. [Google Scholar] [CrossRef]
  10. Yang, L.; Yan, W. Urban ecological forestry analysis based on FPGA and dynamic image sampling. Microprocess. Microsyst. 2021, 81, 103675. [Google Scholar] [CrossRef]
  11. Morales, G.; Kemper, G.; Sevillano, G.; Arteaga, D.; Ortega, I.; Telles, J. Automatic segmentation of Mauritia flexuosa in unmanned aerial vehicle (UAV) imagery using deep learning. Forests 2018, 9, 736. [Google Scholar] [CrossRef]
  12. Xue, X.; Jin, S.; An, F.; Zhang, H.; Fan, J.; Eichhorn, M.P.; Yun, T. Shortwave Radiation Calculation for Forest Plots Using Airborne LiDAR Data and Computer Graphics. Plant Phenomics 2022, 2022, 9856739. [Google Scholar] [CrossRef]
  13. Bonnor, G.M. Estimation of ground canopy density from ground measurements. J. For. 1967, 65, 544–547. [Google Scholar]
  14. Sahal, R.; Alsamhi, S.H.; Breslin, J.G.; Ali, M.I. Industry 4.0 towards Forestry 4.0: Fire detection use case. Sensors 2021, 21, 694. [Google Scholar] [CrossRef] [PubMed]
  15. Hui, G.; Wenlong, S.; Jiayin, S.; Liangkuan, Z. A segmentation method for color forest canopy hemispheric images. West. For. Sci. 2015, 44, 146–149. [Google Scholar]
  16. Zhu, L.K.; Shao, S.; Xie, J.W.P.; Liu, L. PSO optimized fast segmentation algorithm for 3D Otsu forest canopy images. J. Harbin Univ. Technol. 2019, 24, 128–133. [Google Scholar]
  17. Zhu, L.; Wang, J.; Li, K. Computer image analysis for various shading factors segmentation in forest canopy using convolutional neural networks. Int. J. Comput. Appl. Technol. 2020, 64, 415–428. [Google Scholar] [CrossRef]
  18. Bhandari, A.K.; Kumar, A.; Singh, G.K. Modified artificial bee colony based computationally efficient multilevel thresholding for satellite image segmentation using Kapur’s, Otsu and Tsallis functions. Expert Syst. Appl. 2015, 42, 1573–1601. [Google Scholar] [CrossRef]
  19. Pun, T. Entropic thresholding, a new approach. Comput. Graph. Image Process. 1981, 16, 210–239. [Google Scholar] [CrossRef] [Green Version]
  20. Pun, T. A new method for grey-level picture thresholding using the entropy of the histogram. Signal Process. 1980, 2, 223–237. [Google Scholar] [CrossRef]
  21. Abutaleb, A.S. Automatic thresholding of gray-level pictures using two-dimensional entropy. Comput. Vis. Graph. Image Process. 1989, 47, 22–32. [Google Scholar] [CrossRef]
  22. Shannon, C.E. A mathematical theory of communication. ACM SIGMOBILE Mob. Comput. Commun. Rev. 2001, 5, 3–55. [Google Scholar] [CrossRef] [Green Version]
  23. Dhal, K.G.; Das, A.; Ray, S.; Gálvez, J.; Das, S. Nature-inspired optimization algorithms and their application in multi-thresholding image segmentation. Arch. Comput. Methods Eng. 2020, 27, 855–888. [Google Scholar] [CrossRef]
  24. Hammouche, K.; Diaf, M.; Siarry, P. A multilevel automatic thresholding method based on a genetic algorithm for a fast image segmentation. Comput. Vis. Image Underst. 2008, 109, 163–175. [Google Scholar] [CrossRef]
  25. Saravanan, R.; Asokan, P.; Sachidanandam, M. A multi-objective genetic algorithm (GA) approach for optimization of surface grinding operations. Int. J. Mach. Tools Manuf. 2002, 42, 1327–1334. [Google Scholar] [CrossRef]
  26. Ishaque, K.; Salam, Z. An improved modeling method to determine the model parameters of photovoltaic (PV) modules using differential evolution (DE). Sol. Energy 2011, 85, 2349–2359. [Google Scholar] [CrossRef]
  27. Khan, M.A.; Lali MI, U.; Sharif, M.; Javed, K.; Aurangzeb, K.; Haider, S.I.; Akram, T. An optimized method for segmentation and classification of apple diseases based on strong correlation and genetic algorithm based feature selection. IEEE Access 2019, 7, 46261–46277. [Google Scholar] [CrossRef]
  28. Liu, L.; Zhao, D.; Yu, F.; Heidari, A.A.; Ru, J.; Chen, H.; Pan, Z. Performance optimization of differential evolution with slime mould algorithm for multilevel breast cancer image segmentation. Comput. Biol. Med. 2021, 138, 104910. [Google Scholar] [CrossRef] [PubMed]
  29. Fogel, D.B. Artificial Intelligence Through Simulated Evolution; Wiley-IEEE Press: New York, NY, USA, 1998. [Google Scholar]
  30. Geem, Z.W.; Kim, J.H.; Loganathan, G.V. A new heuristic optimization algorithm: Harmony search. Simulation 2001, 76, 60–68. [Google Scholar] [CrossRef]
  31. Srikanth, R.; Bikshalu, K. Multilevel thresholding image segmentation based on energy curve with harmony Search Algorithm. Ain Shams Eng. J. 2021, 12, 1–20. [Google Scholar] [CrossRef]
  32. Kirkpatrick, S.; Gelatt, C.D., Jr.; Vecchi, M.P. Optimization by simulated annealing. Science 1983, 220, 671–680. [Google Scholar] [CrossRef] [PubMed]
  33. Rashedi, E.; Nezamabadi-Pour, H.; Saryazdi, S. GSA: A gravitational search algorithm. Inf. Sci. 2009, 179, 2232–2248. [Google Scholar] [CrossRef]
  34. Jangir, P.; Parmar, S.A.; Trivedi, I.N.; Bhesdadiya, R.H. A novel hybrid particle swarm optimizer with multi verse optimizer for global numerical optimization and optimal reactive power dispatch problem. Eng. Sci. Technol. Int. J. 2017, 20, 570–586. [Google Scholar] [CrossRef] [Green Version]
  35. Farshi, T.R.; Drake, J.H.; Özcan, E. A multimodal particle swarm optimization-based approach for image segmentation. Expert Syst. Appl. 2020, 149, 113233. [Google Scholar] [CrossRef]
  36. Wu, B.-W.; Zhu, L.-K.; Wang, J.-Y. Forest canopy image segmentation based on differential evolutionary whale optimization algorithm. J. Northwest For. Acad. 2022, 37, 67–73+136. [Google Scholar]
  37. Xie, L.; Han, T.; Zhou, H.; Zhang, Z.R.; Han, B.; Tang, A. Tuna swarm optimization: A novel swarm-based metaheuristic algorithm for global optimization. Comput. Intell. Neurosci. 2021, 2021, 9210050. [Google Scholar] [CrossRef] [PubMed]
  38. Suresh, S.; Lal, S. Multilevel thresholding based on Chaotic Darwinian Particle Swarm Optimization for segmentation of satellite images. Appl. Soft Comput. 2017, 55, 503–522. [Google Scholar] [CrossRef]
  39. Kohli, M.; Arora, S. Chaotic grey wolf optimization algorithm for constrained optimization problems. J. Comput. Des. Eng. 2018, 5, 458–472. [Google Scholar] [CrossRef]
  40. Khishe, M.; Mosavi, M.R. Chimp optimization algorithm. Expert Syst. Appl. 2020, 149, 113338. [Google Scholar] [CrossRef]
  41. Wu, Y.-Q.; Zhang, X.-J.; Wu, S.-C. Threshold segmentation of 2-dimensional symmetric cross-entropy images. J. Image Gr. 2011, 16, 1393–1401. [Google Scholar]
  42. Bezdek, J.C.; Ehrlich, R.; Full, W. FCM: The fuzzy c-means clustering algorithm. Comput. Geosci. 1984, 10, 191–203. [Google Scholar] [CrossRef]
  43. Abualigah, L.; Shehab, M.; Alshinwan, M.; Mirjalili, S.; Elaziz, M.A. Ant lion optimizer: A comprehensive survey of its variants and applications. Arch. Comput. Methods Eng. 2021, 28, 1397–1416. [Google Scholar] [CrossRef]
  44. Mirjalili, S. SCA: A sine cosine algorithm for solving optimization problems. Knowl. Based Syst. 2016, 96, 120–133. [Google Scholar] [CrossRef]
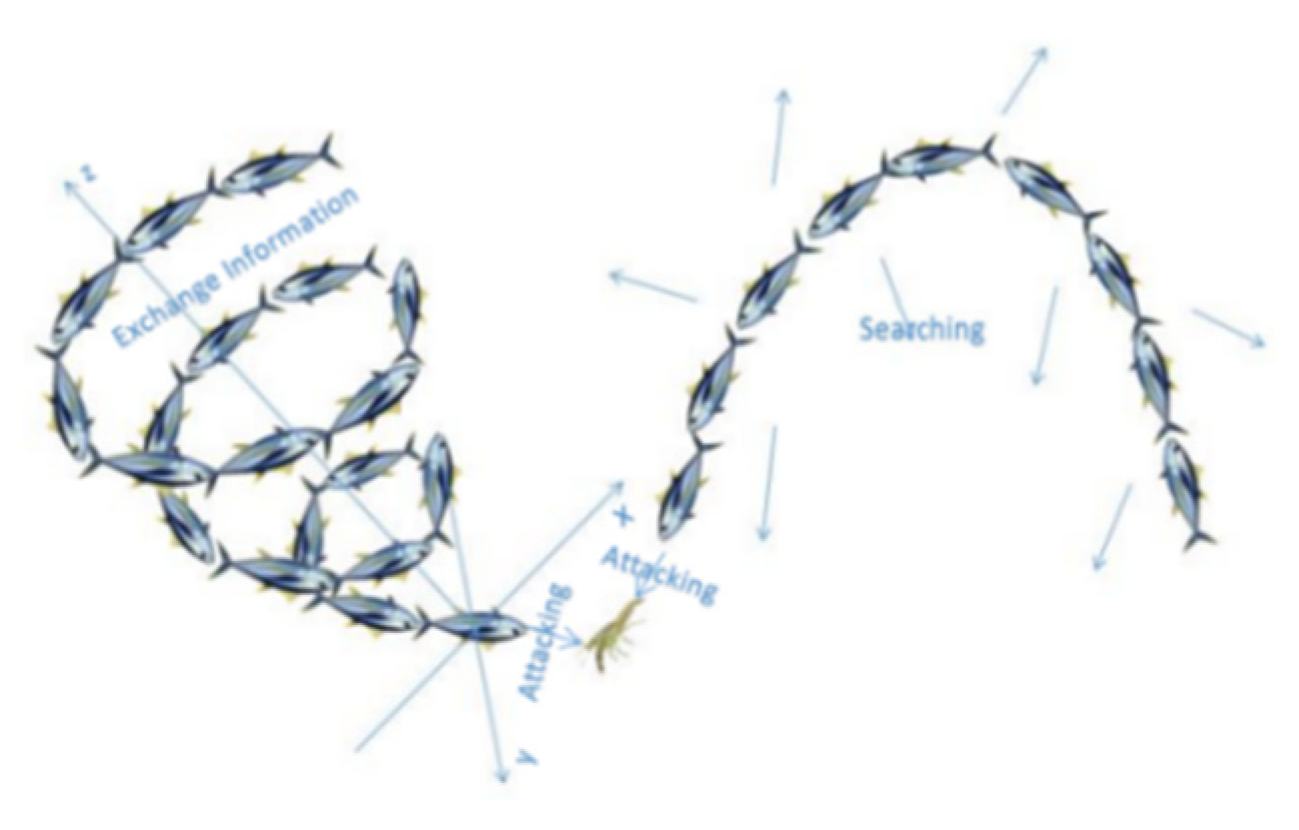
Figure 1. Search mechanism of TSO.
Forests 13 01746 g001
Figure 2. The flow chart of ITSO.
Forests 13 01746 g002
Figure 3. 3D visualization for 2D benchmark functions.
Forests 13 01746 g003
Figure 4. Convergence curves of ITSO on benchmark functions.
Forests 13 01746 g004
Figure 5. Results of image segmentation.
Forests 13 01746 g005aForests 13 01746 g005b
Table 1. Parameter settings for algorithms.
AlgorithmParameter Settings
ALOn = 20, Max_iter = 500
PSOn = 20, c1 = 2, c2 = 2, ωmin = 0.4, ωmax = 0.9, vmin = − 4, vmax = 4, Max_iter = 500
SCAn = 20, a = 2, Max_iter = 500
TSOn = 20, z = 0.05, a = 0.7, Max_iter = 500
ITSOn = 20, z = 0.05, a = 0.7, Max_iter = 500
Table 2. Benchmark functions.
FunctionsRangeOptimum
F 5 ( x ) = i = 1 n 1 [ 100 ( x i + 1 x i 2 ) 2 + ( x i 1 ) 2 ] [−30, 30]0
F 6 ( x ) = i = 1 n ( [ x i + 0.5 ] ) 2 [−1.28, 1.28]0
F 7 ( x ) = i = 1 n i x i 4 + r a n d o m [ 0 , 1 ] [−500, 500]0
F 9 ( x ) = i = 1 n [ x i 2 10 cos ( 2 π x i ) + 10 ] [−5.12, 5.12]0
F 10 ( x ) = 20 exp ( 0.2 1 n i = 1 n x i 2 ) exp ( 1 n i = 1 n cos ( 2 π x i ) ) + 20 + e [−32, 32]8.8818 × 10⁻¹⁶
F 12 ( x ) = π n { 10 sin ( π y 1 ) + i = 1 n 1 ( y i 1 ) 2 [ 1 + 10 sin 2 ( π y i + 1 ) ] + ( y n 1 ) 2 } + i = 1 n u ( x i , 10 , 100 , 4 ) y i = 1 + X i + 1 4 u ( x i , a , k , m ) = { k ( x i a ) m x i > a 0 a < x i < a k ( x i a ) m x i < a [−50, 50]0
Table 3. Mean and standard deviation of algorithms.
FunctionsITSOTSOALOPSOSCA
F5ave0.0154645364.924327909178.5090674458849038.72763.174333
std0.018010.9867137.40268.3121 × 1072.5687 × 103
F6ave0.0001711840.0002485130.00090568668804.4936116.27245885
std3.0774 × 1041.9799 × 1048.4144 × 1041.6570 × 10410.5434
F7ave0.0002778080.0004659390.275614442203.7762660.122350799
std2.5701 × 1043.5117 × 1040.160865.66580.1124
F9ave00101.6848638286.342371460.00056188
std0031.521046.067046.2836
F10ave8.88 × 10168.88 × 10163.39757106619.9614505820.25331371
std001.99110.00210.0639
F12ave1.05 × 1061.39 × 10612.2983449913824006535.708549073
std1.5672 × 1062.2229 × 1066.14912.2897 × 1086.0366
Table 4. Original benchmark images and the corresponding histograms.
Original ImageHistogramOriginal ImageHistogram
Forests 13 01746 i001Forests 13 01746 i002Forests 13 01746 i003Forests 13 01746 i004
(a) P1(b) P2
Forests 13 01746 i005Forests 13 01746 i006Forests 13 01746 i007Forests 13 01746 i008
(c) P3(d) P4
Table 5. Performances of algorithms.
Evaluation CriteriaImageALOPSOSCAFCMTSOITSO
MAE10.03170.03180.03210.03930.03260.0294
20.02970.02960.02950.03830.03000.0291
30.02850.02900.02920.03630.02910.0268
40.0350.03490.03520.04690.03410.0341
ave0.0312250.0313250.03150.04020.031450.02985
RVD10.53320.53880.55380.90030.57690.4223
20.65200.64790.64181.13310.67420.6209
30.53470.56320.57220.95820.56610.4458
40.66000.65500.67141.22580.61900.6158
ave0.5949750.6012250.60981.05440.609050.5262
IoU10.51220.50290.52530.43660.51730.5548
20.58030.56710.58610.44570.57270.5690
30.59500.56720.59400.48210.58240.6488
40.58240.60010.5960.46570.62460.5984
ave0.5674750.5593250.575350.4575250.574250.59275
ASD12.78742.97142.97534.24952.55742.4434
24.10704.04823.98446.66494.05884.0750
31.92872.11082.05753.31381.99671.4743
42.84632.86922.7674.98342.36232.5472
ave2.917352.99992.946054.80292.74382.634975
Publisher’s Note: MDPI stays neutral with regard to jurisdictional claims in published maps and institutional affiliations.