Article

A Comparison of Soil C, N, and P Stoichiometry Characteristics under Different Thinning Intensities in a Subtropical Moso bamboo (Phyllostachys edulis) Forest of China

1
The State Key Laboratory of Subtropical Silviculture, Key Laboratory of Carbon Cycling in Forest Ecosystems and Carbon Sequestration of Zhejiang Province, College of Environment and Resource Sciences, Zhejiang A&F University, Hangzhou 311300, China
2
Research Institute of Forestry, Chinese Academy of Forestry, Beijing 100091, China
3
Anhui Academy of Forestry, Hefei 230088, China
4
Qingyang Forestry Bureau, Chizhou 242899, China
*
Author to whom correspondence should be addressed.
Forests 2022, 13(11), 1770; https://doi.org/10.3390/f13111770
Submission received: 15 September 2022 / Revised: 20 October 2022 / Accepted: 25 October 2022 / Published: 27 October 2022
(This article belongs to the Special Issue Carbon and Nitrogen in Forest Ecosystems—Series II)

Abstract

:
Land management using suitable thinning intensities can promote the yield of Moso bamboo (Phyllostachys edulis) forests and alter the nutrient content and stoichiometric characteristics within the soil. However, the effects of different thinning intensities on soil carbon (C), nitrogen (N), and phosphorus (P) stoichiometry of P. edulis forests have not been comprehensively studied. Here, we evaluated the effects of three thinning intensities—no thinning control (NT), moderate thinning (annual removal of 15% of mature bamboo, MT), and heavy thinning (annual removal of 33% of mature bamboo, IT)—on the soil organic C (SOC), total N (TN), and total P (TP) stocks and their stoichiometry characteristics of a P. edulis forest located in the subtropical zone. The results showed that SOC, TN, and TP stocks decreased with increasing soil depth after three years of thinning. The SOC, TN, and TP stocks and the ecological stoichiometry ratios were varied with the change of thinning intensity and SOC stocks declining with the increased thinning intensity, but TN and TP stocks for the MT treatment were enhanced. The order of TN and TP stocks was MT > NT > IT. In comparison to CK, TN and TP stocks for MT increased significantly by 18.8 and 37.3%, while SOC, TN, and TP stocks for IT decreased by 31.0%, 7.2%, and 21.4%, respectively. The C:N and C:P ratios of MT decreased by 32.8% and 39.0%, and those of IT decreased by 26.5% and 15.6%, respectively. In summary, we conclude that the MT is an effective management strategy to promote soil nutrient cycling and provides a reference for formulating management strategies in subtropical Moso bamboo forests.

1. Introduction

Ecological stoichiometry is widely applied in soil nutrient cycling analyses and refers to the soil nutrient balances of the ecosystem and multiple chemical elements, primarily carbon (C), nitrogen (N), and phosphorus (P) [1]. Soil C, N, and P are major nutrient elements and important indicators for evaluating nutrient levels and availability [2,3]. Therefore, the C:N:P stoichiometry characteristics of forest soils are essential for analyzing biogeochemical cycles, soil nutrient stocks, the structure and function of communities in the forest, and to reveal the mechanisms of the soil C, N, and P balance [4]. In this context, a deeper understanding of the nutrient regulation factors influencing the interaction between soil layers can provide a new theoretical basis for revealing the interaction and balance restriction relationship between soil C, N, and P through studying the theories and methods of ecological chemometrics [5]. Therefore, it is significant to investigate how forest management practices (e.g., thinning) affect soil C, N, and P stocks and their stoichiometry, which is important for evaluating the nutrient status in the soil.
Thinning is a widely accepted practice for forest management worldwide and plays a critical role in the regeneration and growth of forest stands [6]. Forest thinning alters various abiotic and biotic factors by changing forest stand density and solar radiation, further influencing soil C, N, and P and their stoichiometry [7]. At present, there is no consensus on the effects of forest thinning on changes in the soil organic C (SOC), total N (TN), and total P (TP) concentration. For example, SOC and TN concentrations tended to decrease gradually with increasing thinning intensity [5], while other researchers revealed that thinning significantly increased the soil C and N concentrations in coniferous forests and decreased soil C and N concentrations in broadleaf forests [8]. Hu et al., (2016) concluded that thinning did not change the soil TP concentration in a reforested spruce forest [9], while the results from Zhou et al., (2021) [10] showed that thinning increased soil TP by 6.1% in a global meta-analysis. In addition, different thinning intensities can influence SOC stocks. Yang et al., (2022) observed that light and moderate thinning significantly increased SOC stocks, and heavy thinning reduced SOC stocks [11]. In contrast, Zhang et al., (2018) indicated that thinning did not significantly affect SOC stocks, but reduced the soil C:N ratio, and accelerated the decomposition of soil organic matter [12]. However, the effects of different thinning intensities on soil C, N, and P stocks and their stoichiometric characteristics have not been elucidated in subtropical forest ecosystems.
The stocks of C, N, and P vary with soil depth, but their driving processes could be also different for thinning. Thinning causes fresh dissolved organic carbon from the topsoil to leach into the deep subsoil in subtropical regions, enhancing the effect of the deep soil C decomposition [13,14]. N deposition [15], litter decomposition [16], and rock weathering [17] contribute to soil N. N input with leaching intensifies the imbalance of N distribution in different soil layers. In the long term, rock weathering is the primary source of P in terrestrial ecosystems and the P stock is more abundant than that in deep soil as topsoil is more weathered than deeper soils [13]. Therefore, vertical changes in soil C, N, and P stocks and their stoichiometry are heavily influenced by environmental factors [13]. However, it is not clear how forest thinning further affects soil C, N, and P stocks and their stoichiometry with variation in soil depth.
Moso bamboo is one of the most important bamboo species in China, and globally. According to the National Ninth Forest Resources Inventory, the area of Moso bamboo forests was as high as 4.68 million hectares (ha), accounting for 73% of the total area of bamboo forests in China [18]. Moso bamboo exhibits a fast height growth (about 12 cm per 2 months) (Wang et al., 2016), and its annual average carbon sequestration is 5.1 t C ha−1, which is 46–116% higher than that of Chinese fir [19]. The total carbon storage of Moso bamboo forest ecosystems is 106.36–288.47 t C ha−1, which highlights its significance as a carbon pool [20]. However, with the management intensification of Moso bamboo forests, soil acidification, fertility decline, and increased greenhouse gas emissions are observed on Moso bamboo plantations, leading to the overall decline of bamboo productivity [21]. Previous studies have shown that about half of Moso bamboo forests in China have implemented intensive management; however, little is known about the impact of thinning on soil nutrients in Moso bamboo forests, carbon cycling, and productivity limiting factors [22]. The suitable thinning intensity of intensively managed Moso bamboo forests can facilitate the soil nutrient balance of bamboo forests, ensuring a high quality and yield. Therefore, the influence of different thinning intensities on soil nutrients in Moso bamboo forests requires greater understanding.
The primary objective of this study was to evaluate the effects of different thinning intensities on the SOC, TN, and TP stocks, and the stoichiometric change characteristics of a Moso bamboo forest located in a subtropical zone in Qingyang County, Anhui Province (China). The thinning intensities included a no-thinning control (NT), moderate thinning (MT), and intensive thinning (IT). The results provide scientific data to support bamboo forest management (thinning and fertilization) and to facilitate an increased productivity of Moso bamboo forests.

2. Materials and Methods

2.1. Site Description

The study site was located at a Moso bamboo garden in Yangchong Village, Rongcheng Town, Qingyang County, Anhui Province, China (117°49′38.71″ E; 30°36′54.05″ N) (Figure 1), at the junction of the middle and lower Yangtze River plain area and the mountainous area of southern Anhui. This area has a humid subtropical monsoon climate, with an average annual temperature of 14 to 22 °C, and an average annual rainfall of 960 to 1600 mm, and the rainy season lasts from May to July. The landscape slope is 10 to 21°, and the soil depth is 60 to 80 cm. The soil has a homogeneous silt loam texture, mainly consisting of typical loess. The forest density is excessively high, and the forest structure is relatively poor, which is not conducive to bamboo shoot growth.

2.2. Experimental Design and Soil Sampling

From July to August 2017, test areas were selected with the same management histories and topographical conditions (i.e., slope position, gradient, and aspect). Three random blocks were created and three test plots under different thinning intensities were arranged in each block. A total of 9 test plots of 20 m × 20 m were established (see Table 1 for basic information), as follows:
  • No thinning (NT, 3 plots): no management activities were carried out after the abandonment of management.
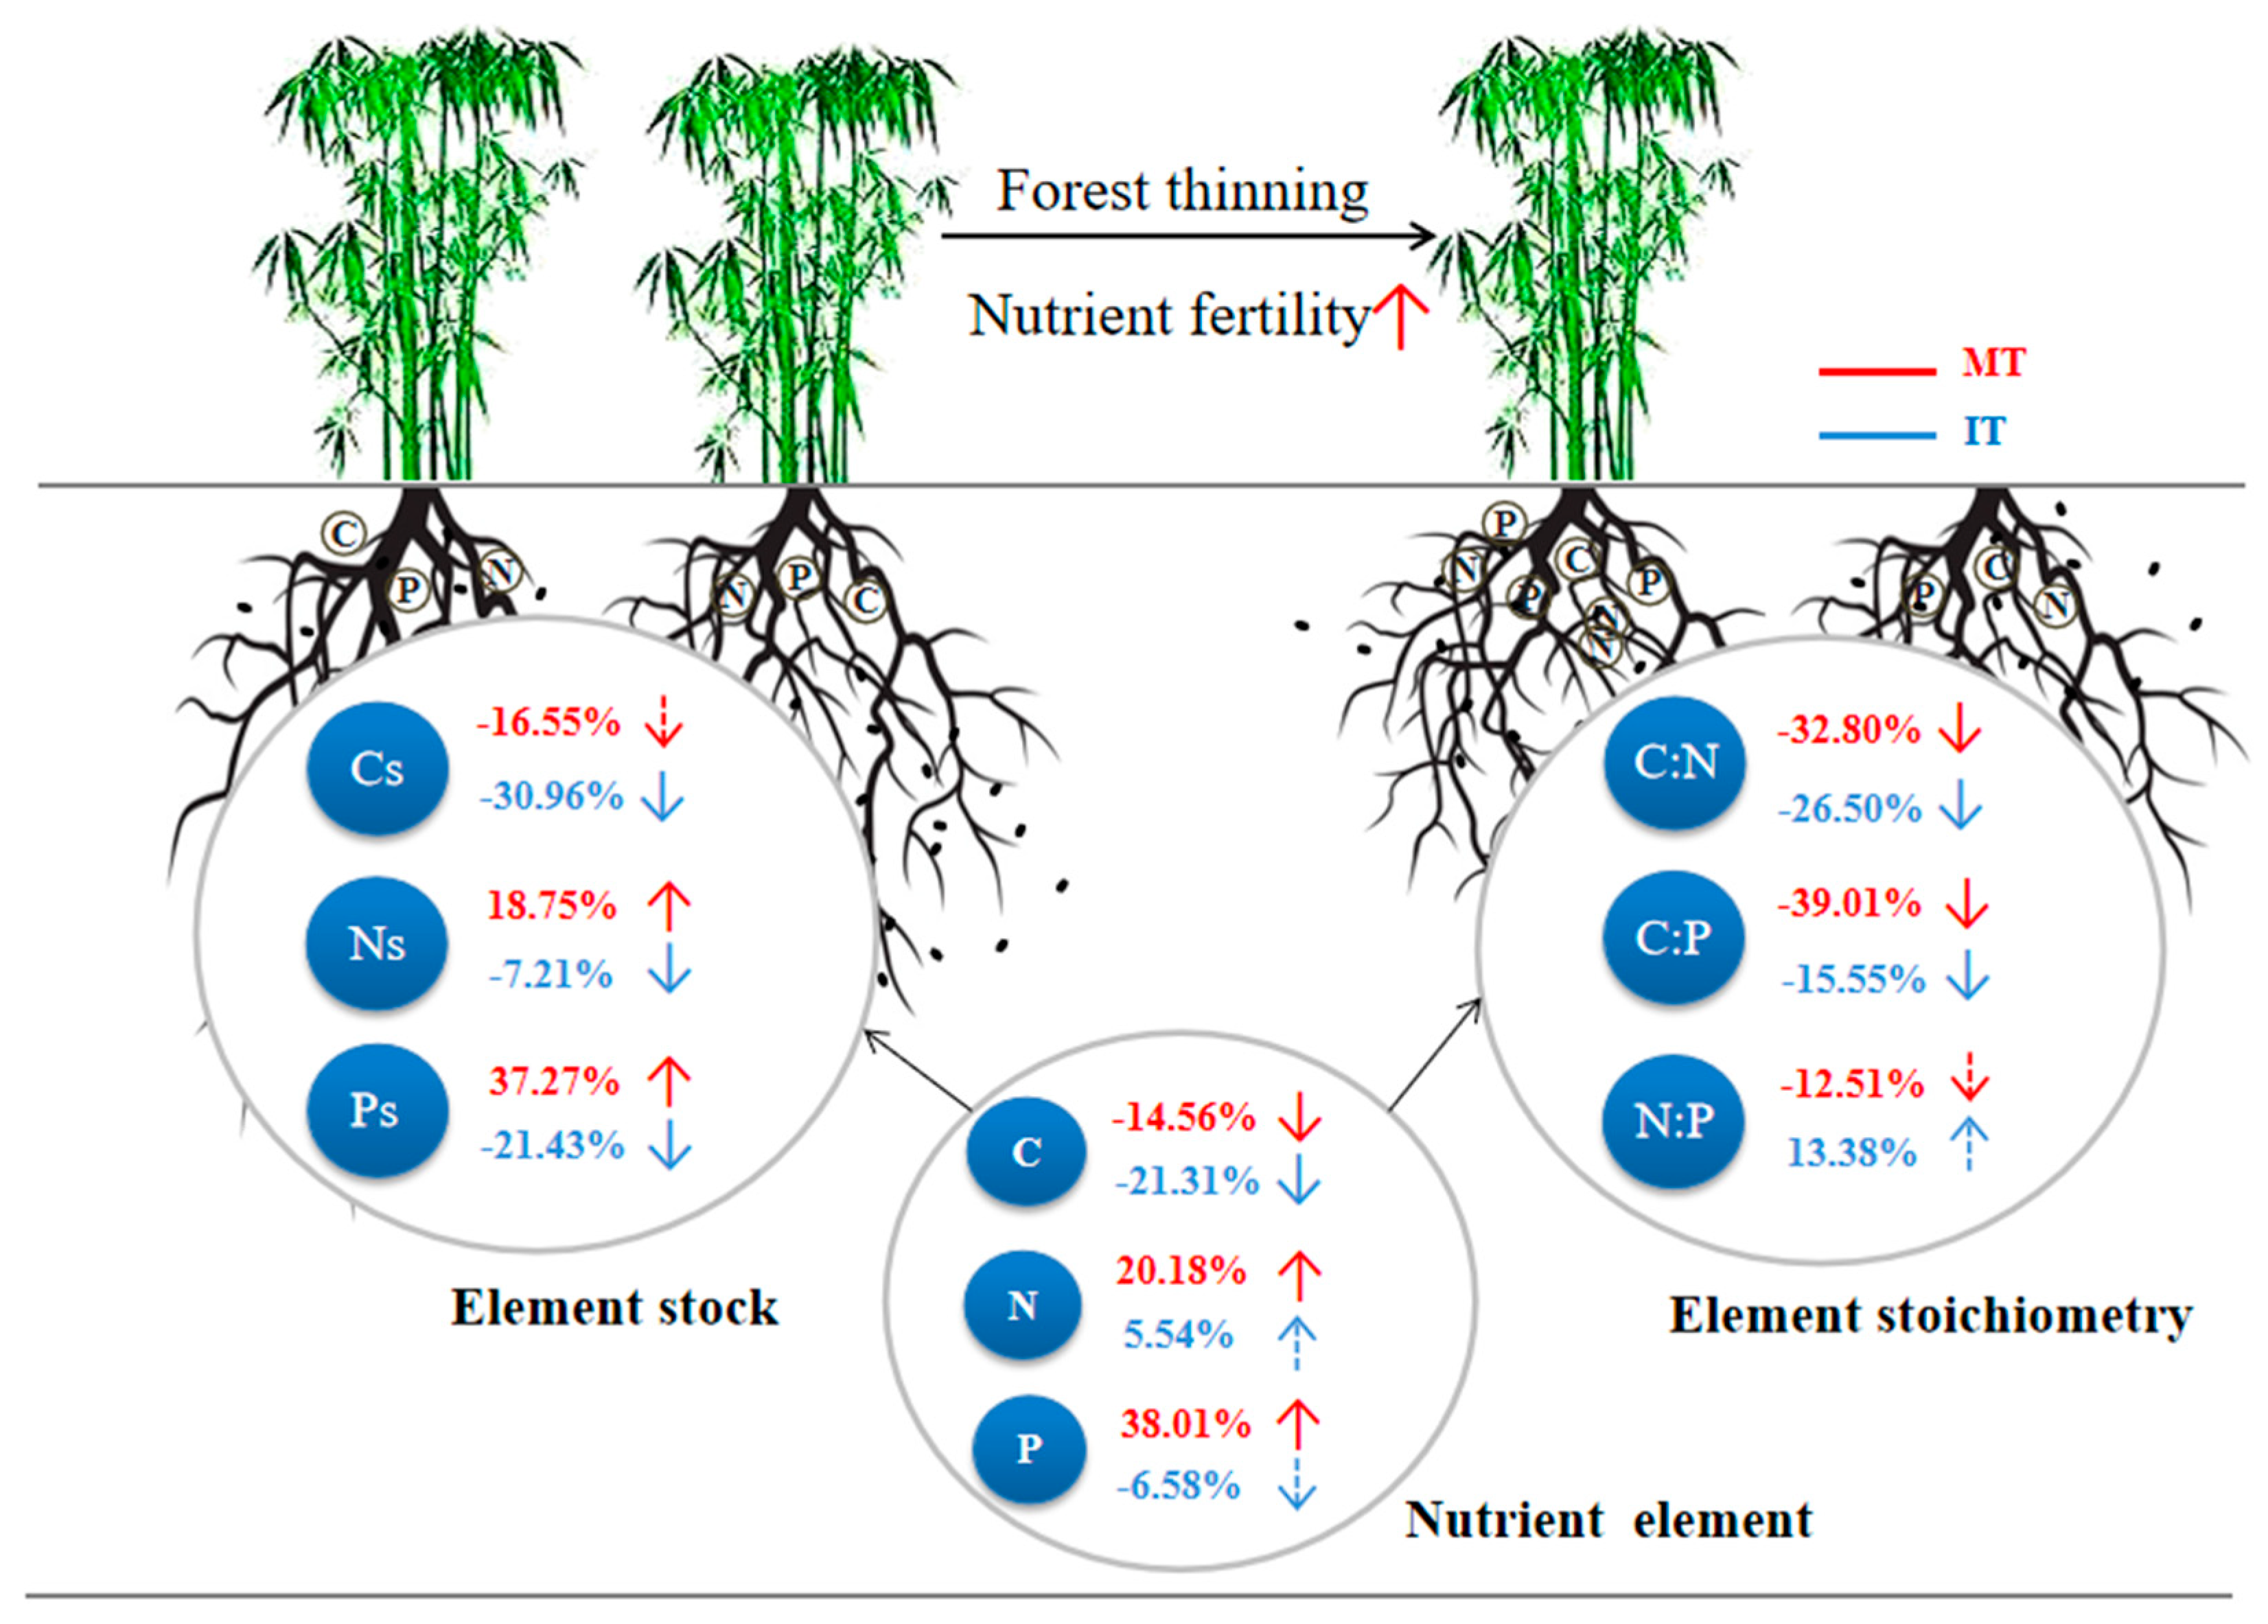
  • Moderate thinning (MT, 3 plots): In 2017, 2018, and 2019, about 15% of stem numbers of mature Moso bamboo were removed by selective cutting each year.
  • Intensive thinning (IT, 3 plots): In 2017, 2018, and 2019, about 33% of stem numbers of mature Moso bamboo were removed by selective cutting each year.
In September 2020, five sampling points in an S-shape (it means the connection of five sampling points in each plot like an “S” shape) from each test plot were identified, the litter was removed, and the soil profile was excavated with a ring-knife soil sampler (100 cm3) in each sampling point from three soil layers (0–10, 10–20, and 20–30 cm) for bulk density measurements. Approximately 100 g of soil from each layer of the soil profile was collected, and then samples from the five sampling points of the same soil layer were thoroughly mixed. The homogenized samples were brought back to the laboratory in ziplock bags for analysis. The small rocks, plant roots, and other materials in the samples were removed using a 0.149 mm sieve and the samples were air-dried before the analysis of the soil physical and chemical properties. Soil bulk density and total porosity were measured by the ring-knife method [23]; pH was measured using the potentiometric method (soil/water ratio: 1:2.5); moisture content was measured by the oven-dry method; organic carbon concentration was tested by the H2SO4–K2Cr2O7 method; soil total nitrogen (TN) was determined by the Kjeldahl determination method; and soil total phosphorus (TP) was quantified by the Mo–Sb colorimetric method after digestion with HClO4–H2SO4 [24].

2.3. Calculation of Soil Bulk Density and Porosity

The following indicators were determined using the ring-knife method [23]: the weight of each empty ring knife was weighed on a balance scale before sampling (W), and after sampling, it was put into an oven at 105 °C to dry to a constant weight, and after drying, it was weighed (W1) when the temperature in the oven dropped to room temperature, and the formula was calculated as follows:
BD = ( W 1 W ) V
where BD denotes the bulk density (g cm−3) and V denotes the volume of the ring knife (cm3).
STP   = ( 1 V 1 V ) × 100 %
where STP denoted the total porosity (%), V1 denotes the volume of soil particle (cm3), and V denotes the volume of the ring knife (cm3).

2.4. Calculation of SOC, TN, and TP Stocks

According to previous methods [25], the SOC, TN, and TP stocks (t ha−1) were calculated as follows:
SOC iStock = SOC i × BD i × D i 10
TN iStock = TN i × B D i × D i 10
TP iStock = TP i × B D i × D i 10
S = i = 1 n C i × BD i × D i 10
where SOCi denotes the organic carbon concentration of the i-th soil layer (g kg−1), TNi denotes the total nitrogen concentration of the i-th soil layer (g kg−1), TPi denotes the total phosphorus concentration of the i-th soil layer (g kg−1), BDi denotes the bulk density of the i-th soil layer (g cm−3), Di denotes the depth of the i-th soil layer (cm), S denotes the C, N, and P stocks of the 0–30 cm soil layer (t ha−1), and Ci represents the C, N, and P concentrations of the i-th soil layer (g kg−1).

2.5. Statistical Analyses

Excel 2010 and SPSS 22.0 (SPSS Inc., Chicago, IL, USA) were used for the data processing and statistical analysis. The physical and chemical properties, C, N, and P stocks, and stoichiometric ratios of the soil from the Moso bamboo forest under different thinning intensities were tested using a one-way analysis of variance (one-way ANOVA) and a least significant difference (LSD) test (α = 0.05). A Pearson correlations analysis method was used to deal with the relationship between soil physicochemical properties and element stocks and their stoichiometry. Additionally, a two-way ANOVA was employed to analyze the influences of thinning intensities and soil depth and their interactions on the physical and chemical properties of the soil and the SOC, TN, and TP stocks, and C:N, C:P, and N:P (p = 0.05). The relationships of soil physicochemical properties (i.e., SOC, TN, TP, moisture content, pH, bulk density, and total porosity) with soil element stocks (i.e., SOC, TN, and TP stocks) and soil element stoichiometry (i.e., C:N, C:P, and N:P) were determined via a principal component analysis (PCA).
Origin 2021 was used for plotting the results.

3. Results

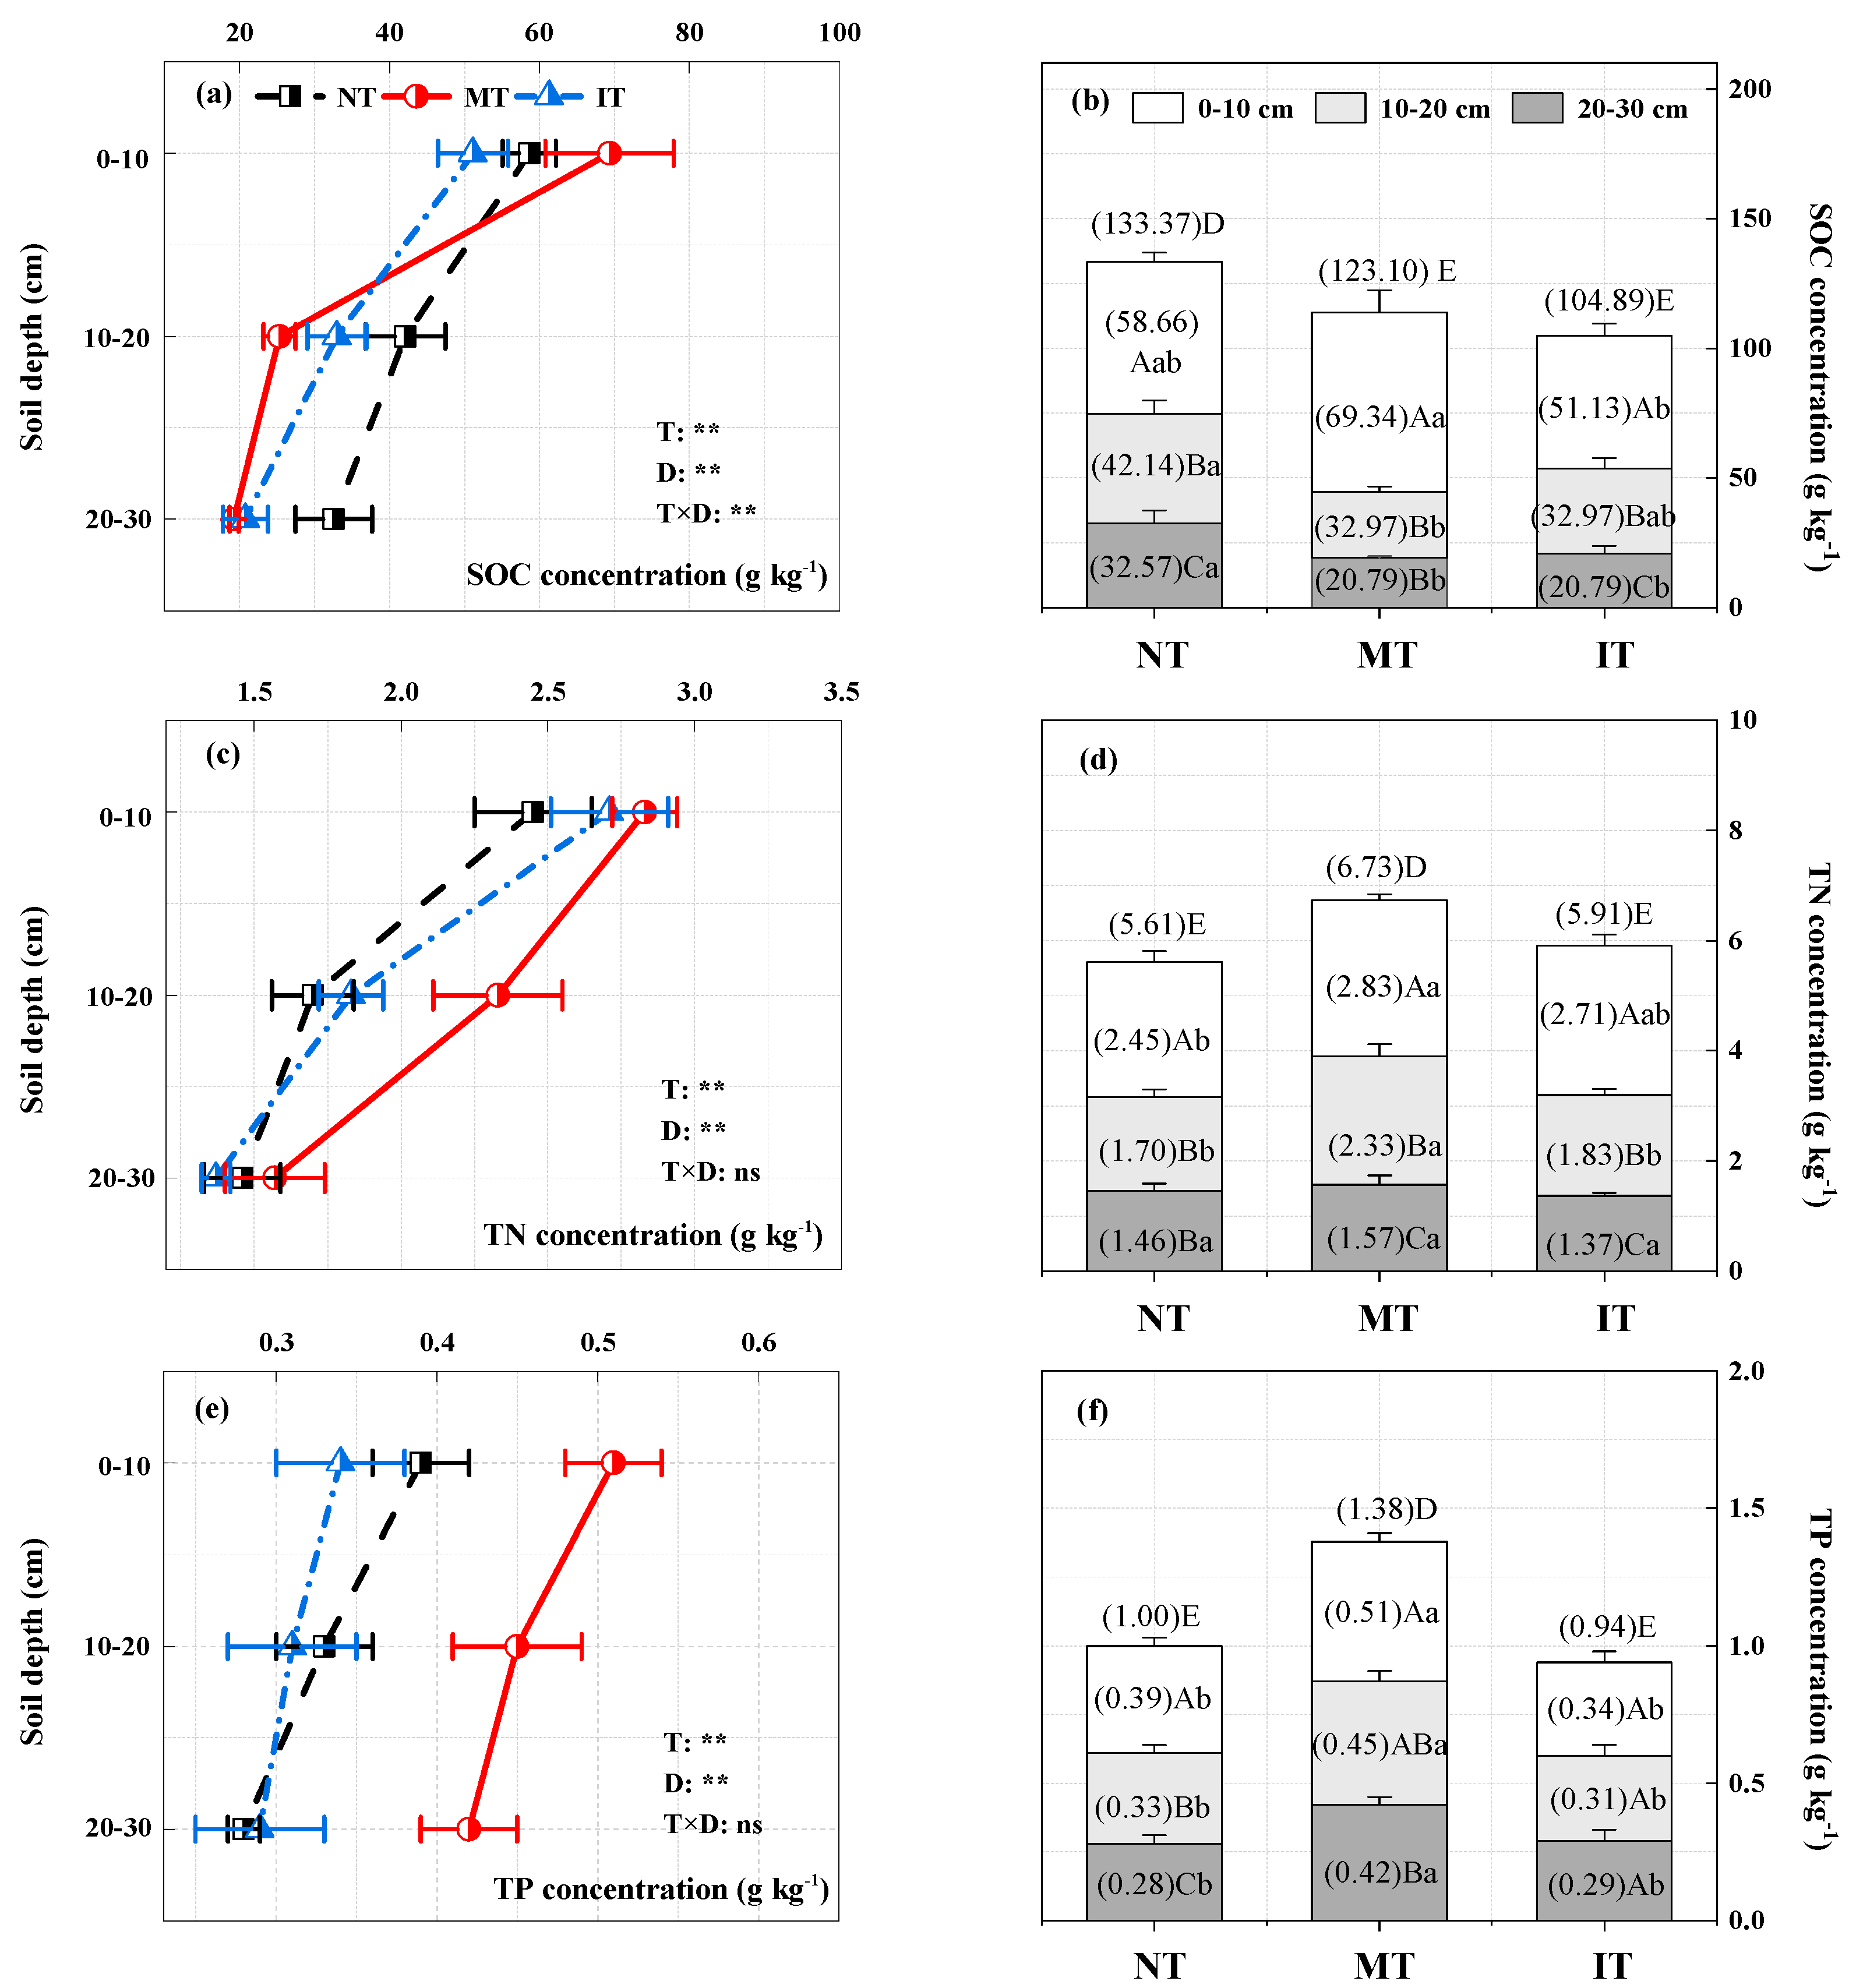
3.1. Impacts of Thinning on Soil Physical and Chemical Properties

With an increasing soil depth, the soil C, N, and P concentrations (Figure 2) and total porosity (Supplementary, Table S1) of each soil layer decreased, while the soil bulk density and pH (Supplementary Table S1) gradually increased. In the 0–10 cm soil layer, the SOC concentration of MT was significantly higher than that of the IT treatment (Figure 2a,b; p < 0.05). Compared with NT, the TN and TP concentrations in the 0–10 cm layer of MT were 15.5% and 30.8% more, respectively (Figure 2d,f; p < 0.05). In the 10–20 cm soil layer, in comparison with NT, the SOC from MT was 39.9% less (Figure 2b; p < 0.05) and TN and TP were 37.1% and 36.4% higher, respectively (Figure 2d,f; p < 0.05). The pH of each soil layer for MT significantly increased compared to NT and IT (Table S2). The soil bulk density and total porosity of each soil layer were similar between the different thinning intensities (Table S2; p < 0.05).
In the 0–30 cm soil layer, the SOC of MT and IT was, respectively, 14.6% and 21.3% lower than that of NT (Figure 2b; p < 0.05), while compared with NT, the TN and TP of MT were 20.2% and 38.0% higher, respectively (Figure 2d,f). The data demonstrate that thinning treatments can reduce the SOC concentration and that MT increases TN and TP concentrations in the soil. The effects of the treatments and soil depth on SOC, TN, and TP were significant (Figure 2a,c,e; p < 0.05), and their interactions on SOC were also significant (Figure 2a; p < 0.05).

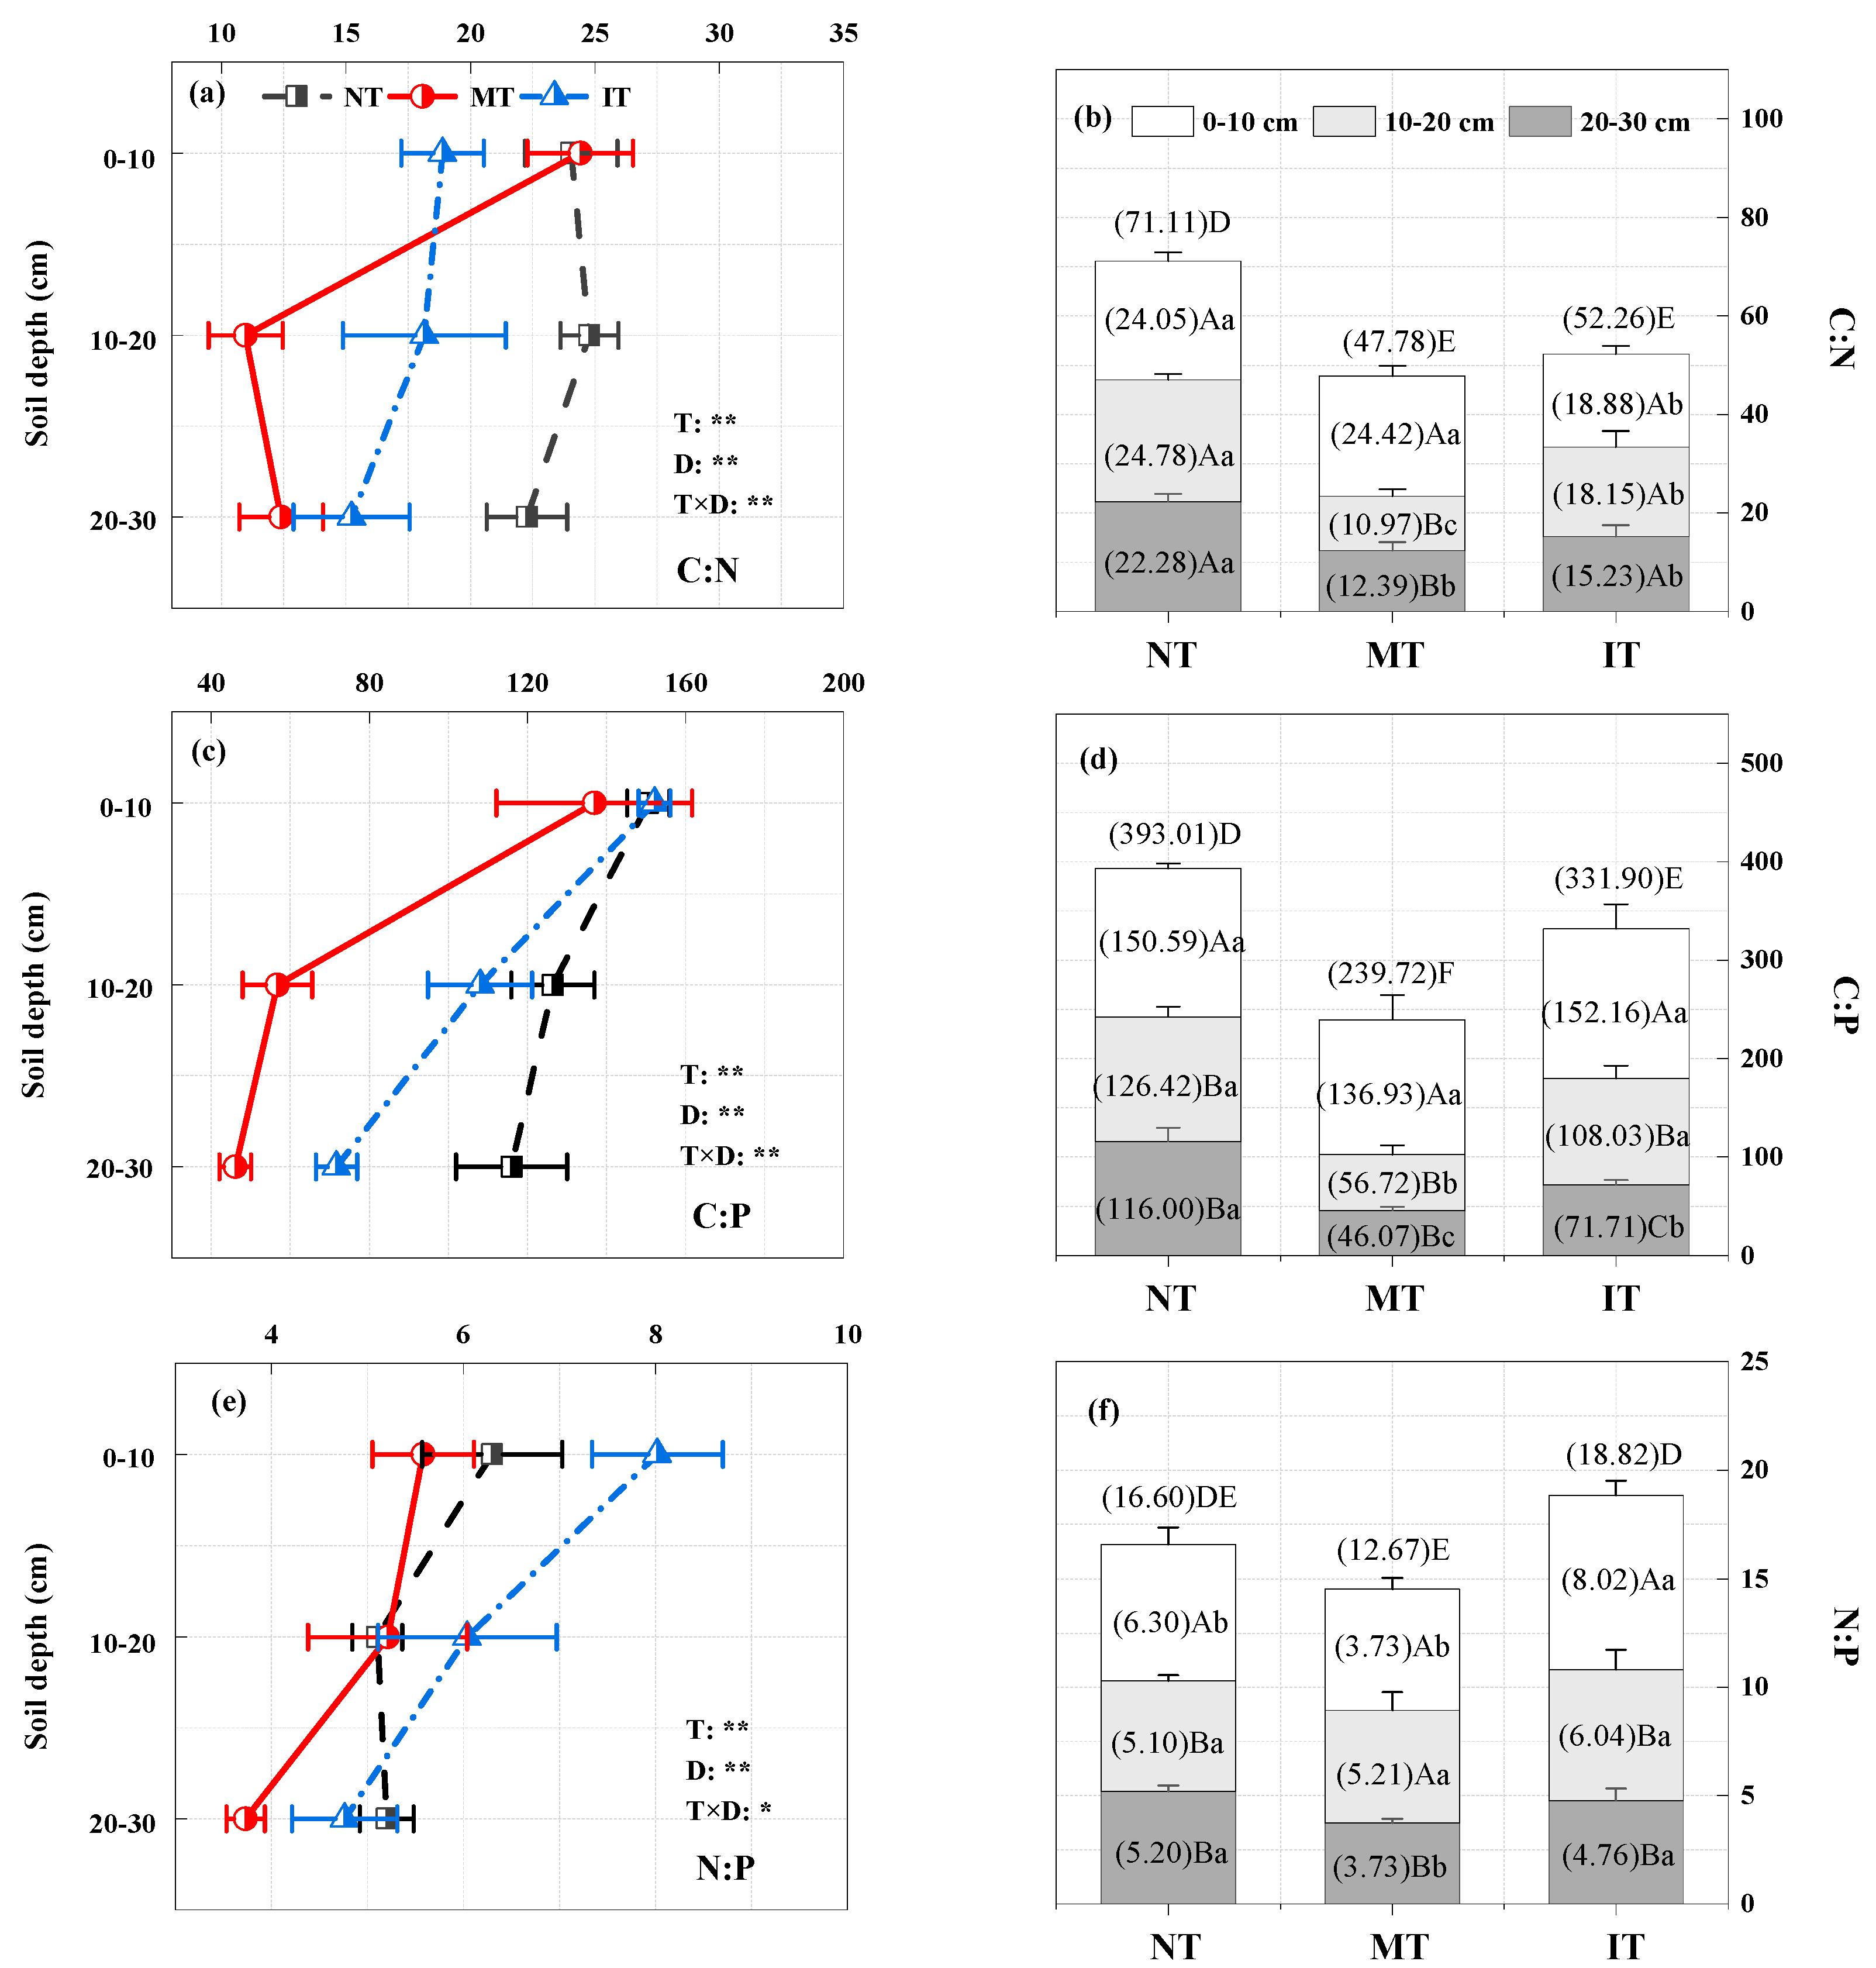
3.2. Soil C, N, and P Stocks and Stoichiometric Characteristics under Thinning

Figure 2 and Figure 3 show that SOC, TN stocks, and C:P decreased with increasing soil depth. In the 0–10 cm soil layer, the SOC, TN, and TP stocks of the MT soil layer were 27.5%, 24.9%, and 43.2% higher, respectively, compared with NT (Figure 3b,d,f; p < 0.05), and the C:N of the IT soil layer was 21.5% lower (Figure 4b). Furthermore, N:P was 27.3% more (Figure 4f; p < 0.05). In the 10–20 cm soil layer, the SOC stocks of MT and IT were 43.3% and 33.8% less, respectively (Figure 3b; p < 0.05), and C:N was 55.7% and 26.8% lower, respectively (Figure 4b; p < 0.05), while in the MT soil layer, C:P was 55.1% less (Figure 4d; p < 0.05). In the 20–30 cm soil layer, compared with NT, the SOC stocks of MT and IT were 44.8% and 47.1% lower, respectively (Figure 3b; p < 0.05); C:N was 44.4% and 31.6% less, respectively (Figure 4b; p < 0.05); and C:P was 60.3% and 38.2% less, respectively (Figure 4d; p < 0.05).
In the 0–30 cm soil layer, compared with NT, the TN and TP stocks of the MT soil layer were 18.8% and 37.3% higher, respectively (Figure 3d,f; p < 0.05), and the C:N and C:P ratios were lower by 32.8% and 39.0%, respectively (Figure 4b,d; p < 0.05). The SOC, TN, and TP stocks in IT soil layers were 31.0%, 7.2%, and 21.4% lower, respectively (Figure 3b,d,f; p < 0.05), and the C:N and C:P ratios were 26.5% and 15.6% lower, respectively (Figure 4b,d; p < 0.05). The effects of treatments and soil depth on the SOC, TN stocks, and C:N:P stoichiometry were significant (Figure 3 and Figure 4; p < 0.05), and their interactions on the SOC stock and C:N:P stoichiometry were significant (Figure 3a and Figure 4a,c,e; p < 0.05).

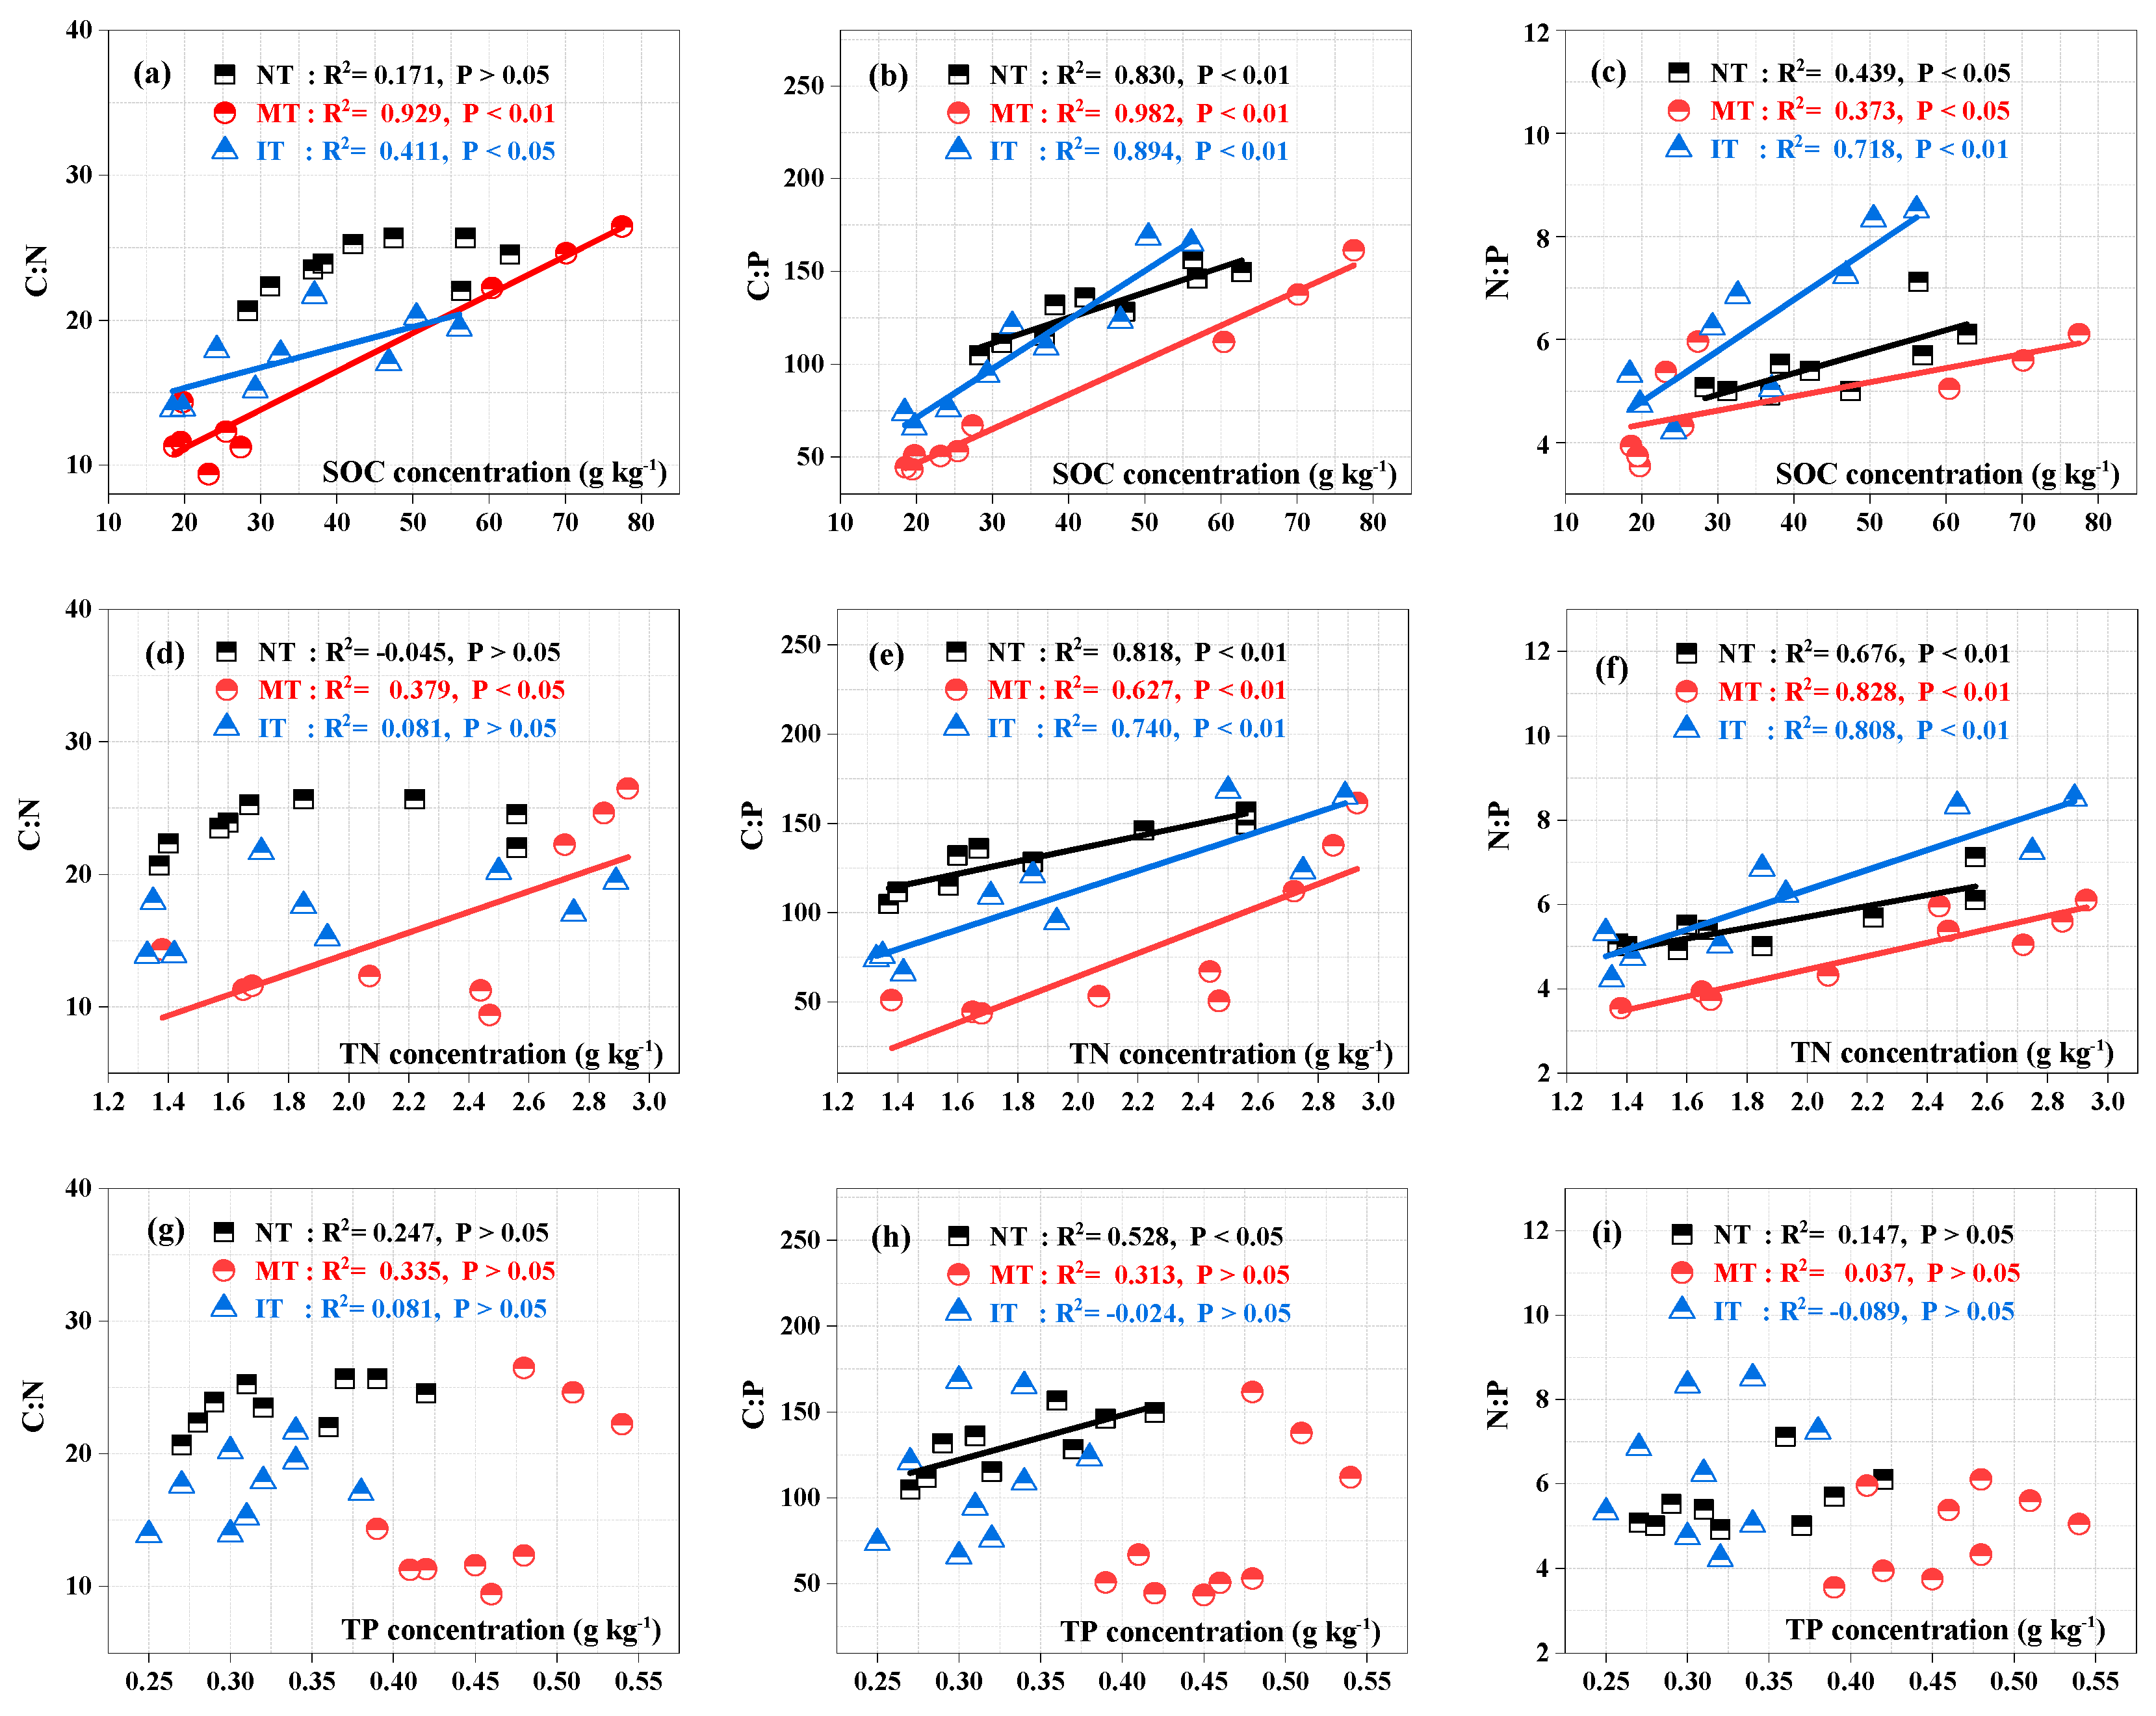
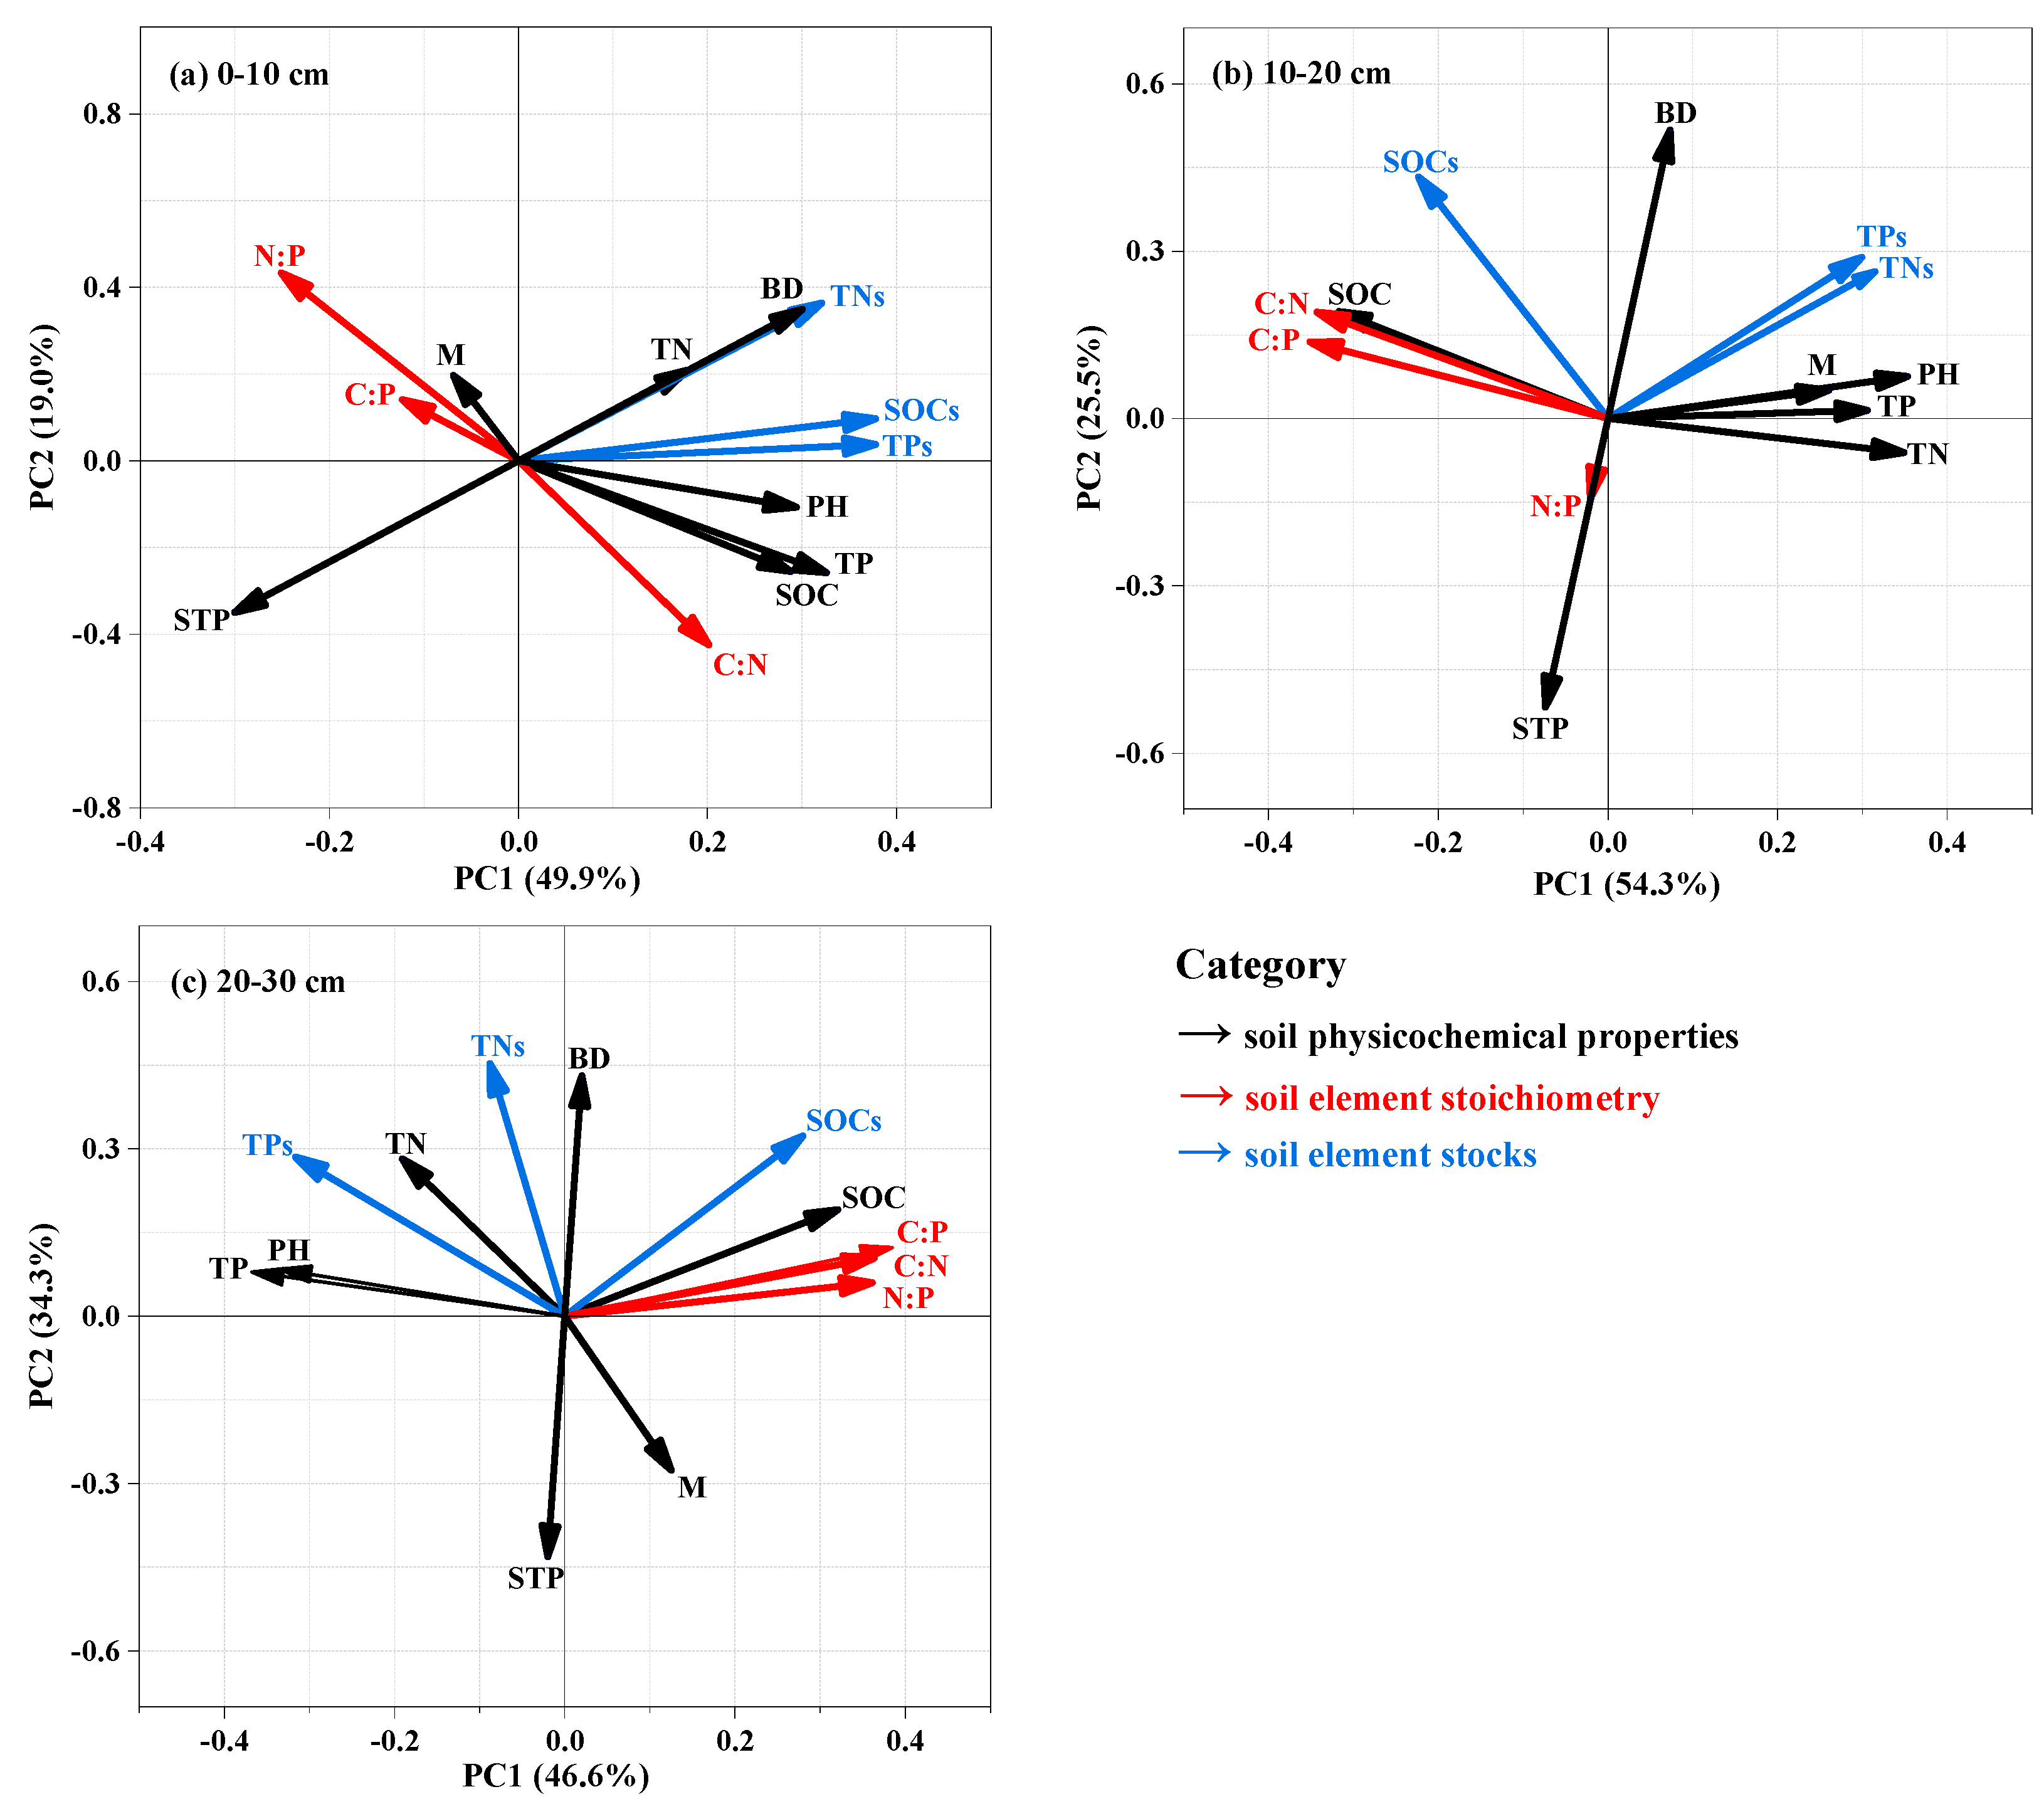
3.3. Relationships among Nutrient Stocks, Stoichiometric Ratios, and Soil Physicochemical Properties

The carbon and nutrient stocks and their stoichiometric ratios (i.e., C:P, N:P) across different thinning treatments were correlated with the changes in their concentrations (Supplementary, Figure S1; Figure 5). Specifically, the N:P was positively associated with SOC, regardless of treatment (Figure 5b,c; p < 0.05). In addition, the SOC stocks and C:P were positively associated with TN, regardless of treatment (Supplementary, Figure S1; Figure 5e,f; p < 0.05). Overall, enhanced correlations between nutrient concentrations (SOC, TN, and TP) and these soil stocks in MT and IT, compared with NT were observed (Supplementary, Figure S1; p < 0.05).
A PCA revealed the relationships between the soil physicochemical properties, element stocks, and their stoichiometry in the topsoil layer (0–10 cm) and subsoil layers (10–20 and 20–30 cm) (Figure 6). The correlation analysis further demonstrated more quantitative relationships between these variables (Supplementary, Figure S2). Compared with the subsoil layer, the SOC, TN, and TP stocks of topsoil were positively correlated with bulk density and negatively correlated with total porosity (except for the TN stock in the 20–30 cm soil layer) (Figure 6; Supplementary, Figure S2; p < 0.05).

4. Discussion

4.1. Effects of Thinning Intensity on Soil C, N, and P Concentrations and Stocks

Nutrients play a pivotal role in maintaining the quality and productivity of soil [26,27]. However, bamboo forest thinning changes the litter decomposition rates, root secretion, soil mineralization rate, and the contributions from soil animals and microorganisms, which further evokes the change of soil C, N, and P concentration [28,29]. In this study, the SOC stock decreased significantly with increased thinning intensity (Figure 1b and Figure 2b). We propose three possible reasons for this result: (1) Thinning led to a reduction of litter, which reduced the input and conversion of exogenous organic matter and increased the leaching of soluble organic carbon, resulting in decreased SOC [30]. (2) The increase in soil surface temperature and humidity as a result of thinning and the subsequent accelerated decomposition of soil organic matter resulted in decreased SOC stocks [31]. (3) The decrease in overmature bamboo density due to thinning led to a reduced decomposition rate of bamboo roots and whip, decreasing SOC stocks [32]. However, a recent meta-analysis based on China’s forest thinning dataset found that thinning significantly increased SOC stocks in planted forests by 7.2% [33]. In addition, the SOC stocks were more than that of a not-thinned forest land when trees with a diameter of <2 cm were cut after five years [34]. The response of SOC stocks to thinning varies with thinning intensity, management practices, recovery time, and forest type.
Our experiments revealed that in MT, the stocks of TN and TP markedly increased and were higher than those in NT and IT (Figure 2 and Figure 3). The reasons could be that thinning mature bamboo by up to 15% led to moderate canopy closure and plant density (Table 1), as well as an increased light, temperature, humidity, and water content (Supplementary, Table S1). Additionally, changes in primary production caused by thinning could improve both the quality and quantity of litter supply and root decomposition within the soil [35]. It also increased microbial biomass and enzyme activity, and accelerated the decomposition of litter, bamboo roots, and whip, resulting in cascading effects that increased the release and circulation of soil nutrients [35]. However, a surprising observation was that the stocks of SOC, TN, and TP in IT soil decreased and were lower than those in NT and MT (Figure 3). In addition, the SOC and TN stocks were positively correlated with these concentrations in IT stands (Supplementary, Figure S1). This is attributed to the plant density becoming too low via thinning the mature bamboo by up to 33% (Table 1), resulting in less litter input and a reduced supply of soil nutrients [32]. Meanwhile, due to the bamboo growth characteristics, the new, and rapidly growing bamboo plants had a higher nutrient consumption rate compared to mature bamboo after three years [36]. Studies have also shown that, with an increased abundance of surface litter, microbial decomposition activities and the growth of understory vegetation increased, intensifying the demand for soil C and N [37]. Therefore, it can be inferred that stand productivity is closely related to the density of bamboo forests. Different plant densities led to different competitive effects (higher competition for nutrients) among Moso bamboo forests, which resulted in a change in productivity with different thinning intensities [12].
In our study, the soil TN stocks of different thinning regimes (5.43–7.30 kg ha−1) were well below the average of China’s forest soil TN stocks (34.64 kg ha−1) [38] but were slightly higher than another bamboo forest in the same climate zone with intensive management for 15 years [32]. Furthermore, the soil TP stocks between 0.88 and 1.51 t ha−1 were slightly lower than those of a Phyllostachys praecox stand in the same climate zone with a mulching management period of three years and six years, respectively [39]. These results indicate that soil TN and TP stocks induced by thinning were lower than averages in China or similar climate zones. Therefore, appropriate fertilization management regimes to alleviate the N and P limitations of Moso bamboo forests in subtropical regions should be considered.

4.2. Effects of Thinning on Soil C:N, C:P, and N:P Stoichiometry

Soil is the most prominent pool of C and N in terrestrial ecosystems, providing plants with these elements and other essential nutrients such as P, K, S, and Ca [29]. These represent the structural elements and nutrients within soil organic matter, whose content and stoichiometric ratios are significant for maintaining ecosystem stability [40]. In addition, soil C, N, and P stoichiometry is a useful indicator of soil nutrient status and potential plant nutrient limitations. However, one of the crucial factors regulating the stoichiometric ratios of C, N, and P is forest thinning [41]. Generally, the soil C:N ratio can be used to predict the decomposition rate of organic matter, which is also an indicator of N mineralization capacity [42]. Specifically, a C:N threshold for N mineralization is commonly set at 25, with a lower C:N ratio indicating that N mineralization dominates over N immobilization [43,44]. In this study, thinning significantly decreased the soil C:N (Figure 4b), which confirmed the accelerated rate of organic matter decomposition and N mineralization with a low C:N; the soil C:N in MT stands was the lowest under all thinning intensities. This phenomenon might be ascribed to a more favorable soil environment in these stands, i.e., a suitable plant density, canopy density (Table 1), and pH, as well as higher soil TN, TP (Figure 3d,f), and water contents (Supplementary, Table S1). Soil C:P reflects the P mineralization capacity; a lower C:P demonstrates higher P availability [43,45], which can also promote the decomposition of organic matter by microorganisms and increase nutrient bioavailability [46]. Soil C:P was found to decrease significantly following thinning and was the lowest in MT stands (Figure 4d), indicating an improvement in P bioavailability. Our findings are consistent with the results of Tian et al. (2019) [47] and Qiu et al. (2020) [7], who showed that moderate thinning can improve soil P availability due to higher soil C, microbial biomass and activity, and soil moisture, thereby accelerating the decomposition and circulation of soil nutrients. These changes in soil properties were also apparent in our study (Supplementary, Table S1; Figure 2d,f). The soil N:P value reflects the restrictive effect of N and P nutrients on plant growth and is also an indicator of N saturation [44]. However, our research surprisingly found that N:P first decreased and then rose with increasing thinning intensity, and it was the lowest in MT stands (Figure 2f). Another study found that in P-deficient areas, a low soil C:P and N:P led to increased plant growth, explaining why MT stands had the most growth in our study [48]. The N:P ratio was the highest in the soil of IT, which was attributed to the low plant density, as thinning released large amounts of N and P into the soil. Substantial new bamboo growth occurred during the study period, resulting in a short-term response of soil N:P to thinning succession and plants were gradually limited by the P concentration [49]. In this study, the organic matter decomposition rates and nutrient fertility were MT > IT > NT. A low bioavailability of soil nutrients limits ecosystem net primary productivity and reduces organic matter decomposition, resulting in an accumulation of surface carbon [39].
The range of the average C:N in the three soil layers under different treatments was 15.93–23.70, which is higher than the global and Chinese average soil C:N of 14.3 and 10–12, respectively [50]. It is also one to two times that of a two-year study on thinning in a Chinese fir plantation (11.94–12.21) [51]. This result indicates low rates of soil nutrient cycling and organic matter decomposition, promoting the accumulation of organic matter in the soil. The C:P average ratio in the three soil layers under different treatments in the study area (107.18) was higher than the Chinese average value (61) [50]. However, it was lower than the average soil C:P in bamboo forests from another study, with different productivity levels and the same climate type [52]. Moreover, the soil P availability was relatively low, which is consistent with the results of Wu et al., (2020) [37] and indicates that the forest conversion increased the understory vegetation, increasing soil P uptake. The average N:P in the three soil layers under different treatments in the study area was between 4.84 and 6.27, which is higher than the global and Chinese forest soil averages of 3.9 and 5.9, respectively [50]. It was previously shown that the spatial variability of soil N:P is quite small and relatively stable [52]. Some studies reported that when the soil N:P < 10, the system is N-limited [5], severely restricting bamboo and understory vegetation growth [18].

4.3. Changes in Soil C, N, and P Stocks and Stoichiometric Characteristics with Soil Depth

Soil depth is a key factor affecting SOC, TN, and TP stocks and the stoichiometric characteristics of soil [53]. We found that soil depth significantly influenced the concentrations and stocks of C, N, and P (except TP stocks, Figure 3). The observed trend of soil bulk density, pH, and C, N, and P concentrations with soil depth is consistent with results from the literature (e.g., Shuai et al., 2017; Yang et al., 2016) [32,53]. The SOC and TN stocks of the three thinning intensities decreased with increased soil depth and those in the topsoil (0–10 cm) were significantly higher than those in the subsoil (20–30 cm) (except NT, Figure 3b,d). This is due to the topsoil being impacted by external environmental factors such as light, precipitation, soil microorganisms, and the release of nutrients in the surface litter. The nutrients released via litter mineralization were primarily concentrated on the soil surface, resulting in the surface accumulation of SOC, TN, and TP [2], which were transported to the subsoil during the leaching with rainwater. In addition, the input of organic matter was limited by soil permeability, microbial decomposition activity, and bamboo root absorption [54]. The surface soil bulk density in the study area was low and the soil porosity was high (Supplementary Table S1). The hydrothermal conditions and aeration were satisfactory and soil microorganisms exerted a strong decomposition effect on litter [55], resulting in the enrichment of nutrients in the surface soil [8]. With increasing soil depth, bamboo roots, whips, and total biomass decreased, and root exudates and soil microorganisms were the main sources of deep soil nutrition [56]. In this study, the stocks of SOC, TN, and TP in the topsoil (0–10 cm) were significantly higher in MT stands than in NT and IT stands (Figure 3). We also determined that in the topsoil (0–10 cm), there was a higher bulk density and lower total porosity in MT stands compared to the NT and IT stands (Supplementary Table S1), which is consistent with other studies reporting that soil bulk density and porosity were important indicators of C, N, and P stocks [53]. Furthermore, both the PCA and correlation analysis indicated that soil nutrient stocks were positively correlated with bulk density and negatively correlated with total porosity in the topsoil (0–10 cm) (Figure 6; Supplementary, Figure S2). There was no significant effect of soil depth on TP stocks compared to SOC and TN stocks (Figure 3e), which is consistent with prior research [55]. This is attributed to the fact that the source of P is primarily rock weathering and is, thus, greatly affected by the parent material, while C and N are mainly associated with land management, in addition to the soil parent material [40].
The ratios of C:N, C:P, and N:P in the topsoil (0–10 cm) under the three thinning intensities were greater than those in the subsoil (20–30 cm) because the surface litter released more nutrients into the topsoil [53]. With increasing depth, the C:N ratio of each soil layer was significantly different in MT stands compared to NT and IT stands (Figure 4b), which may be related to the SOC concentration (Figure 5a). Studies have shown that changes in SOC depend on the balance between the C input generated by primary net production and C consumed by soil organic matter decomposition [57]. Moreover, we found that thinning changed the quantity and quality of substrates in the surface litter, while litter deposits and decomposition were the main sources of SOC input, and differences in the quantity of soil organic matter between soil layers were observed [6]. The C:P ratio decreased with the increasing soil depth, which was related to the humus content in each layer of soil [2]. We observed that the C:N and C:P ratios of the MT and IT subsoils (10–20 cm and 20–30 cm layers) decreased significantly (except for the C:P ratio of the IT subsoil at 10–20 cm) and were the lowest in MT (Figure 4b,d). In addition, we found that the C:P ratio of the subsoil layers was negatively correlated with pH, compared to the topsoil (Figure 6; Supplementary, Figure S2). A probable reason is that the plant density of Moso bamboo forests under NT was too high, compared with MT and IT stands (Table 1), and the bottom bamboo root whip aged with the increase in the proportion of mature bamboo. Many dead roots and mature bamboo root whip decomposed, leading to the enhancement of microbial activity that in turn provided a large amount of organic matter for the deep soil and altered the soil pH (Supplementary, Table S1) [36]. The SOC in the deeper soil was greatly affected by plant root input [56]. We discovered that the effects of treatments, soil depth, and their interaction on the SOC stock and C:N:P stoichiometry were significant (Figure 3a and Figure 4), indicating that thinning intensity and soil depth were significant factors affecting soil nutrient distribution.
The study of ecosystem C, N, and P cycles is an extremely complex process. This study addressed the effects of three years of thinning on the soil C, N, and P stocks and ecological stoichiometric characteristics of Moso bamboo forests (Figure 7). However, the lack of long-term fixed–point monitoring data on the effects of thinning treatment on the stoichiometric processes of C, N, and P made it challenging to elucidate the average carbon cycling time of 21.35 years for Moso bamboo forests [36]. Future studies should include systematic and long-term monitoring of the effects of different thinning intensities on C, N, and P flows and balance in the bamboo ecosystem to provide scientific data that can support improvements in bamboo forest management and enhance soil fertility.

5. Conclusions

Our results demonstrated that in comparison with NT, moderate thinning significantly increased TN and TP stocks and significantly decreased C:N and C:P in the soil of a subtropical Moso bamboo forest. A stoichiometric analysis of soil C, N, and P, soil organic matter decomposition rate, and soil fertility status, determined that they were optimal in MT, followed by IT, and then NT. Moreover, the moderate thinning treatment resulted in a plant density and canopy density that were most suitable for improving the light, temperature, and humidity in the forest stand, thereby promoting the release, and cycling of soil nutrients. As a result, the use of MT management can be considered an effective forest management practice for enhanced soil fertility and improving the yield of bamboo wood and shoots.

Supplementary Materials

The following supporting information can be downloaded at: https://www.mdpi.com/article/10.3390/f13111770/s1, Figure S1: Linear regressions of the relationships between contents of soil organic carbon (SOC) (a,b), total nitrogen (TN) (c,d), and total phosphorus (TP) (e,f), as well as their stocks in the no-thinning control (NT), moderate thinning (MT), and heavy thinning (IT), respectively. Straight lines correspond to significant relationships. Abbreviations: SOC, soil organic carbon; TN, total nitrogen; TP, total phosphorus, Figure S2: Pearson correlations between soil physicochemical properties and element stocks and their stoichiometry in the topsoil layer (0–10 cm) (a) and subsoil layers (10–20 and 20–30 cm) (b,c). Red and blue markings denote positive and negative correlations, respectively. Abbreviations: SOC, soil organic carbon; TN, total nitrogen; TP, total phosphorus; SOCs, soil organic carbon stocks; TNs, total nitrogen stocks; TPs, total phosphorus stocks; C:N, SOC–to–TN ratio; C:P, SOC–to–TP ratio; N:P, soil TN–to–TP ratio; M, soil moisture content; BD, soil bulk density; STP, soil total porosity, Table S1: Mean values and significance levels of main effects of thinning treatment and soil depth and their interactions, obtained from a two-way ANOVA, on soil physicochemical properties.

Author Contributions

Y.B. and C.J. (Chunqian Jiang) designed the experiment; H.W., C.J. (Chunwu Jiang), S.L., Y.Z. and J.L. performed the experiment; X.H. and Y.B. conducted the statistical analysis and wrote the manuscript; Y.B., C.J. (Chunqian Jiang) and Y.W. contributed to the revisions. All authors have read and agreed to the published version of the manuscript.

Funding

This work was supported by the Asia-Pacific Network for Sustainable Forest Management and Rehabilitation (grant numbers 2016P2-CAF).

Institutional Review Board Statement

Not applicable.

Informed Consent Statement

Not applicable.

Data Availability Statement

Not applicable.

Acknowledgments

We acknowledge Hao Yanping, Ding Zengfa, Xu Xiayun, Xie Xiaoting and Chen Shiyou for their assistance during the fieldwork.

Conflicts of Interest

The authors declare that they have no known competing financial interests or personal relationships that could have appeared to influence the work reported in this paper.

References

  1. Elser, J.; Sterner, R.; Gorokhova, E.; Fagan, W.; Markow, T.; Cotner, J.; Harrison, J.; Hobbie, S.; Odell, G.; Weider, L. Biological stoichiometry from genes to ecosystems. Ecol. Lett. 2000, 3, 540–550. [Google Scholar] [CrossRef] [Green Version]
  2. Tian, H.; Chen, G.; Zhang, C.; Melillo, J.M.; Hall, C.A.S. Pattern and variation of C:N:P ratios in China’s soils: A synthesis of observational data. Biogeochemistry 2009, 98, 139–151. [Google Scholar] [CrossRef]
  3. Bai, Y.F.; Chen, S.Y.; Shi, S.R.; Qi, M.J.; Liu, X.H.; Wang, H.; Wang, Y.X.; Jiang, C.Q. Effects of different management approaches on the stoichiometric characteristics of soil C, N, and P in a mature Chinese fir plantation. Sci. Total Environ. 2020, 723, 137868. [Google Scholar] [CrossRef]
  4. Wang, Q.K.; Yu, Y.Z.; He, T.X.; Wang, Y.P. Aboveground and belowground litter have equal contributions to soil CO2 emission: An evidence from a 4-year measurement in a subtropical forest. Plant Soil 2017, 421, 7–17. [Google Scholar] [CrossRef]
  5. Wang, Y.L.; Song, C.S.; Peng, L.H.; Cui, C.W.; Zheng, M.M.; Lin, K.M.; Ren, Z.B.; Xie, R.G.; Hu, Y.Y. Effects of thinning on soil carbon and nitrogen factions in a Cunningham lanceolate plantation. J. Soil Water Conserv. 2021, 5, 9. [Google Scholar]
  6. Liu, L.; Cai, M.K.; Liu, X.J.; Han, H.R.; Cheng, X.Q.; Tian, H.X.; Guo, Q.L. Effects of thinning on ecological stoichiometry C, N and P in leaves, roots and soil of Larix principis-rupprechtii plantation. Chin. J. Northeast. For. Univ. 2019, 47, 1–7. [Google Scholar]
  7. Qiu, X.C.; Wang, H.B.; Peng, D.L.; Xin, L.; Yang, F.; Li, Z.; Cheng, S. Thinning drives C: N: P stoichiometry and nutrient resorption in Larix principis-rupprechtii plantations in North China. For. Ecol. Manag. 2020, 462, 117984. [Google Scholar] [CrossRef]
  8. Johnson, D.W.; Curtis, P.S. Effects of forest management on soil C and N storage: Meta analysis. For. Ecol. Manag. 2001, 140, 227–238. [Google Scholar] [CrossRef]
  9. Hu, B.; Yang, B.; Pang, X.; Bao, W.; Tian, G. Responses of soil phosphorus fractions to gap size in a reforested spruce forest. Geoderma 2016, 279, 61–69. [Google Scholar] [CrossRef]
  10. Zhou, T.; Wang, C.K.; Zhou, Z.H. Thinning promotes the nitrogen and phosphorous cycling in forest soils. Agric. For. Meteorol. 2021, 311, 108665. [Google Scholar] [CrossRef]
  11. Yang, L.; Wang, J.S.; Geng, Y.; Niu, S.L.; Tian, D.S.; Yan, T.; Liu, W.G.; Pan, J.X.; Zhao, X.H.; Zhang, C.Y. Heavy thinning reduces soil organic carbon: Evidence from a 9-year thinning experiment in a pine plantation. Catena 2022, 211, 106013. [Google Scholar] [CrossRef]
  12. Zhang, X.Z.; Guan, D.X.; Li, W.B.; Sun, D.; Jin, C.J.; Yuan, F.H.; Wang, A.Z.; Wu, J.B. The effects of forest thinning on soil carbon stocks and dynamics: A meta-analysis. For. Ecol. Manag. 2018, 429, 36–43. [Google Scholar] [CrossRef]
  13. Qiao, Y.; Wang, J.; Liu, H.M.; Huang, K.; Yang, Q.S.; Lu, R.L.; Yan, L.M.; Wang, X.H.; Xia, J.Y. Depth-dependent soil C-N-P stoichiometry in a mature subtropical broadleaf forest. Geoderma 2020, 370, 114357. [Google Scholar] [CrossRef]
  14. Kou, D.; Ma, W.; Ding, J.; Zhang, B.; Fang, K.; Hu, H.; Yu, J.; Wang, T.; Qin, S.; Zhao, X.; et al. Dryland soils in northern China sequester carbon during the early 2000s warming hiatus period. Funct. Ecol. 2018, 32, 1620–1630. [Google Scholar] [CrossRef]
  15. Goulding, K.W.T.; Bailey, N.J.; Bradbury, N.J.; Hargreaves, P.; Howe, M.; Murphy, D.V.; Poulton, P.R.; Willison, T.W. Nitrogen deposition and its contribution to nitrogen cycling and associated soil processes. New Phytol. 1998, 139, 49–58. [Google Scholar] [CrossRef]
  16. Manzoni, S.; Jackson, R.B.; Trofymow, J.A.; Porporato, A. The global stoichiometry of litter nitrogen mineralization. Science 2008, 321, 684. [Google Scholar] [CrossRef]
  17. Houlton, B.Z.; Morford, S.L.; Dahlgren, R.A. Convergent evidence for widespread rock nitrogen sources in Earth’s surface environment. Science 2018, 360, 58–62. [Google Scholar] [CrossRef] [Green Version]
  18. Li, J.J.; Fan, M.C.; Shangguan, Z.P. Ecological stoichiometry characteristics of soil carbon, nitrogen, and phosphorus of the Robinia pseudoacacia forest on the north-south strip of the Loess Plateau. Chin. J. Acta Ecol. Sin. 2019, 39, 7996–8002. [Google Scholar]
  19. Wang, Y.X.; Bai, S.B.; Binkley, D.; Zhou, G.M.; Fang, F.Y. The independence of clonal shoot’s growth from light availability supports Moso bamboo invasion of closed-canopy forest. For. Ecol. Manag. 2016, 368, 105–110. [Google Scholar] [CrossRef]
  20. Zhou, G.M.; Jiang, P.K. Density, storage and spatial distribution of carbon in phyllostachy pubescens forest. Chin. J. Sci. Silvae Sin. 2004, 40, 20–24. [Google Scholar]
  21. Xu, L.; Deng, X.; Ying, J.Y.; Zhou, G.M.; Shi., Y.J. Silicate fertilizer application reduces soil greenhouse gas emissions in a Moso bamboo forest. Sci. Total Environ. 2020, 747, 141380. [Google Scholar] [CrossRef]
  22. Gu, H.H.; Weng, J.; Kong, J.J.; Ye, X.M.; Liu, Y.J.; Qi, L.H.; Song, X.Z. Ecological stoichiometry of Phullostachys edulis leaves with extensive and intensive management. Chin. J. Zhejiang AF Univ. 2015, 32, 661–667. [Google Scholar]
  23. State Forestry Administration, PR China (SFAPRC). Forest Soil Analysis Methods in China; State Forestry Administration, PR China (SFAPRC): Beijing, China, 2000; p. 334. [Google Scholar]
  24. Bao, S.D. Soil Analysis in Agricultural Chemistry, 3rd ed.; China Agricultural Press: Beijing, China, 2000. [Google Scholar]
  25. Guo, L.B.; Gifford, R.M. Soil carbon stocks and land use change: A meta analysis. Glob. Change Biol. 2010, 8, 345–360. [Google Scholar] [CrossRef]
  26. Bauer, A.; Black, A.L. Quantification of the effect of soil organic matter content on soil productivity. Soil Sci. Soc. Am. J. 1994, 58, 185. [Google Scholar] [CrossRef]
  27. Doran, J.W.; Coleman, D.C.; Bezdicek, D.F. Defining Soil Quality for a Sustainable Environment; Special Publication No. 35; Soil Science Society of America: Madison, WI, USA, 1994; pp. 3–21. [Google Scholar]
  28. Robert, J.; Marcus, L.; Lars, V.; Bram, B.; Rainer, B.; Frank, H.; Dale, W.; Kari, M.; Kenneth, A. How strongly can forest management influence soil carbon sequestration? Geoderma 2006, 137, 253–268. [Google Scholar]
  29. Gao, Y.; He, N.P.; Yu, G.R. Long-term effects of different land use types on C, N, and P stoichiometry and storage in subtropical ecosystems: A case study in China. Ecol. Eng. 2014, 67, 171–181. [Google Scholar] [CrossRef]
  30. Wang, X.L.; Zhao, J.; Wu, J.P.; Chen, H.; Lin, Y.B.; Zhou, L.X.; Fu, S.L. Impacts of understory species removal and/or addition on soil respiration in a mixed forest plantation with native species in southern China. For. Ecol. Manag. 2010, 261, 1053–1060. [Google Scholar] [CrossRef]
  31. Harald, P.; Keith, V.C. Weight loss of litter and cellulose bags in a thinned white spruce forest in interior Alaska. Can. J. For. Res. 1978, 8, 42–46. [Google Scholar]
  32. Yang, M.; Li, Y.C.; Xiao, Y.H.; Yue, T.; Jiang, P.K.; Zhou, G.M.; Liu, J. Effects of intensive management on soil C and N pools and soil enzyme activities in Moso bamboo plantations. Chin. J. Appl. Ecol. 2016, 27, 3455–3462. [Google Scholar]
  33. Gong, C.; Tan, Q.Y.; Liu, G.B.; Xu, M.X. Forest thinning increases soil carbon stocks in China. For. Ecol. Manag. 2021, 482, 118812. [Google Scholar] [CrossRef]
  34. Rodrigo, V.; Edith, B.A.; Michael, F.A. Effects of Vegetation Thinning on Above- and Belowground Carbon in a Seasonally Dry Tropical Forest in Mexico. Biotrophic 2009, 41, 302–311. [Google Scholar]
  35. Chen, X.; Ma, L.Y.; Jia, Z.K. Research Progress on Effect of Intermediate Cutting to Forest Soil. Soil Water Conserv. China 2012, 9, 27. [Google Scholar]
  36. Deng, X.; Yin, J.Y.; Xu, L.; Shi, Y.J.; Zhou, G.M.; Li, Y.F.; Chen, G.S.; Ye, Y.Z.; Zhang, F.G.; Zhou, Y.F.; et al. Effects of abandonment management on soil C and N pools in Moso bamboo forests. Sci. Total Environ. 2020, 729, 138949. [Google Scholar] [CrossRef] [PubMed]
  37. Wu, L.J.; Li, W.Z.; Wei, W.; Yang, Y.L.; Wu, Q.G. Effects of alnus cremastogyne-cupressus funebris strip reform on soil C: N: P stoichiometry of cupressus funebris forests in a hilly area of central Sichuan Basin. Chin. J. Appl. Environ. Biol. 2020, 26, 425–432. [Google Scholar]
  38. Wang, R.Z.; Li, J.Q.; Yang, G.L.; Zuo, M.; Yang, Y.L. Soil Nutrient storage and its value assessment of typical forest ecosystems in the Mopan Mountains. Chin. J. West China For. Sci. 2019, 48, 93–99. [Google Scholar]
  39. Guo, Z.W.; Cheng, S.L.; Yang, Q.P.; Li, Y.C. Responses of N and P stoichiometry on mulching management in the stand of Phyllostachys praecox. Chin. J. Acta Ecol. Sin. 2012, 32, 6361–6368. [Google Scholar]
  40. Lv, J.L.; Yan, M.J.; Song, B.L.; Guan, J.H.; Shi, W.Y.; Du, S. Ecological stoichiometry characteristics of soil carbon, nitrogen, and phosphorus in an oak forest and a black locust plantation in the Loess hilly region. Chin. J. Acta Ecol. Sin. 2017, 37, 3385–3393. [Google Scholar]
  41. Kunhamu, T.K.; Kumar, B.M.; Viswanath, S. Does thinning affect litterfall, litter decomposition, and associated nutrient release in Acacia mangium stands of Kerala in peninsular India? Can. J. For. Res. 2009, 39, 792–801. [Google Scholar] [CrossRef]
  42. Marty, C.; Houle, D.; Gagnon, C.; Courchesne, F. The relationships of soil total nitrogen concentrations, pools and C: N ratios with climate, vegetation types and nitrate deposition in temperate and boreal forests of eastern Canada. Catena 2017, 152, 163–172. [Google Scholar] [CrossRef]
  43. Bui, E.N.; Henderson, B.L. C:N:P stoichiometry in Australian soils with respect to vegetation and environmental factors. Plant Soil 2013, 373, 553–568. [Google Scholar] [CrossRef]
  44. Zhao, F.Z.; Sun, J.; Ren, C.J.; Kang, D.; Deng, J.; Han, X.H.; Yang, G.H.; Feng., Y.Z.; Ren, G.X. Land use change influences soil C, N, and P stoichiometry under ‘Grain-to-Green Program’ in China. Sci. Rep. 2015, 5, 10195. [Google Scholar]
  45. Bing, H.; Wu, Y.; Zhou, J.; Sun, H.; Luo, J.; Wang, J.; Yu, D. Stoichiometric variation of carbon, nitrogen, and phosphorus in soils and its implication for nutrient limitation in alpine ecosystem of Eastern Tibetan Plateau. J. Soils Sediments 2015, 16, 405–416. [Google Scholar] [CrossRef]
  46. Peng, P.Q.; Zhang, W.J.; Tong, C.L.; Qiu, S.J.; Zhang, W.C. Soil C, N and P contents and their relationships with soil physical properties in wetlands of Dongting Lake floodplain. Chin. J. Appl. Ecol. 2015, 16, 1872–1878. [Google Scholar]
  47. Tian, H.; Cheng, X.; Han, H.; Jing, H.; Liu, X.; Li, Z. Seasonal variations and thinning effects on soil phosphorus fractions in Larix principis-rupprechtii Mayr. Plantations. Forests 2019, 10, 172. [Google Scholar] [CrossRef] [Green Version]
  48. Elser, J.J.; Acharyal, K.; Kylel, M.; Cotner, J.; Makino, W.; Markow, T.; Watts, T.; Hobbie, S.; Fagan, W.; Schade, J.; et al. Growth rate-stoichiometry couplings in diverse biota. Ecol. Lett. 2003, 6, 936–943. [Google Scholar] [CrossRef] [Green Version]
  49. Feng, D.F.; Bao, W.K. Review of the temporal and spatial patterns of soil C:N:P stoichiometry and its driving factors. Chin. J. Appl. Environ. Biol. 2017, 23, 400–408. [Google Scholar]
  50. Jack, T.T.; Dudley, J.R. Use of nitrogen to phosphorus ratios in plant tissue as an indicator of nutrient limitation and nitrogen saturation. J. Appl. Ecol. 2003, 40, 523–534. [Google Scholar]
  51. Qiu, Y.B.; Ling, G.C.; Zheng, W.H.; Xing, W.L.; Cheng, X.R. Effects of Thinning on Contents and Stoichiometry of C, N, and P in Different Components of Chinese Fir Plantation. Chin. J. For. Res. 2019, 32, 64–69. [Google Scholar]
  52. Zhao, R.Y.; Li, Z.C.; Wang, B.; Ge, X.G.; Dai, Y.X.; Zhao, Z.X.; Zhang, Y.J. Duration of mulching caused variable pools of labile organic carbon in a Phyllostachys edulis plantation. Chin. J. Plant Ecol. 2017, 41, 418–429. [Google Scholar]
  53. Shuai, O.Y.; Xiang, W.H.; Gou, M.M.; Lei, P.F.; Chen, L.; Deng, X.W.; Zhao, Z.H. Variations in soil carbon, nitrogen, phosphorus and stoichiometry along forest succession in southern China. Biogeosciences Discuss. 2017, 408, 1–27. [Google Scholar]
  54. Lv, D.; Yang, Y.H.; Zhao, W.H.; Lei, S.Y.; Zhang, X.P. Fine root biomass distribution and coupling to soil physicochemical properties under different restored vegetation types. Chin. J. Acta Ecol. Sin. 2018, 38, 3979–3987. [Google Scholar]
  55. Zhang, Y.J.; Wang, K.Q.; Song, Y.L.; Li, J.W. Ecological stoichiometry of soil carbon, nitrogen and phosphorus in five forest types in Subalpine of Middle Yunnan Province. Chin. J. Ecol. Environ. Sci. 2019, 28, 73–82. [Google Scholar]
  56. Clemmensen, K.E.; Bahr, A.; Ovaskainen, O.; Dahlberg, A.; Ekblad, A.; Wallander, H.; Stenlid, J.; Finlay, R.D.; Wardle, D.A.; Lindahl, B.D. Roots and associated fungi drive long-term carbon sequestration in Boreal forest. Science 2013, 339, 1615–1618. [Google Scholar] [CrossRef] [PubMed]
  57. Margit, V.L.; Ingrid, K.K. Temperature sensitivity of soil organic matter decomposition-what do we know? Biol. Fertil. Soils 2009, 46, 1–15. [Google Scholar]
Figure 1. Study area location in Rongcheng Town, Qing yang County, Anhui Province of China.
Forests 13 01770 g001
Figure 2. Vertical distribution of soil organic carbon (SOC) (a,b), total nitrogen (TN) (c,d), and total phosphorus (TP) (e,f) (mean ± SD, n = 3) in the 0–30 cm soil profile for the no-thinning control (NT), moderate thinning (MT), and heavy thinning (MT), respectively. Significant differences between thinning treatments (T), soil depths (D), and their interactions are shown at **, p < 0.01; and ns, p > 0.05. Different capital letters (A, B, and C) indicate significant differences between the same thinning treatment and different depths (p < 0.05); different capital (D, E) and lowercase (a–c) letters indicate significant differences among different thinning treatments in the total soil profile (30 cm) and each 10 cm layer with corresponding soil layers (p < 0.05), respectively.
Forests 13 01770 g002
Figure 3. Vertical distribution stocks of soil organic carbon (SOC) (a,b), total nitrogen (TN) (c,d), and total phosphorus (TP) (e,f) (mean ± SD, n = 3) in the 0–30 cm soil profile for the no-thinning control (NT), moderate thinning (MT), and intensive thinning (IT), respectively. Significant differences between thinning treatments (T), soil depths (D), and their interactions are shown at **, p < 0.01; and ns, p > 0.05. Different capital letters (A, B, and C) indicate significant differences between the same thinning treatment and different depths (p < 0.05); different capital (D, E, and F) and lowercase letters (a,b) indicate significant differences among different thinning treatments in the total soil profile (30 cm) and each 10 cm layer with corresponding soil layers (p < 0.05), respectively.
Forests 13 01770 g003
Figure 4. Vertical distribution of soil C:N (a,b), C:P (c,d), and N:P (e,f) (mean ± SD, n = 3) stoichiometry in the 0–30 cm soil profile in the no-thinning control (NT), moderate thinning (MT), and heavy thinning (IT), respectively. Significant differences between thinning treatments (T), soil depths (D), and their interactions are shown at *, p < 0.05; **, p < 0.01. Different capital letters (A, B, and C) indicate significant differences between the same thinning treatment and different depths (p < 0.05); different capital (D, E, and F) and lowercase letters (a, b, and c) indicate significant differences among different thinning treatments in the total soil profile (30 cm) and each 10 cm layer with corresponding soil layers (p < 0.05), respectively. Abbreviations: C:N, SOC–to–TN ratio; C:P, SOC–to–TP ratio; N:P, soil TN–to–TP ratio.
Forests 13 01770 g004
Figure 5. Linear regressions of the relationships between contents of soil organic carbon (SOC) (ac), total nitrogen (TN) (df), and total phosphorus (TP) (gi), as well as their stoichiometry in the no-thinning control (CK), moderate thinning (MT), and heavy thinning (IT), respectively. Straight lines correspond to significant relationships. Abbreviations: C:N, SOC–to–TN ratio; C:P, SOC–to–TP ratio; N:P, soil TN–to–TP ratio.
Forests 13 01770 g005
Figure 6. Principal component analysis (PCA) of soil physicochemical properties, element stocks, and their stoichiometry in the topsoil layer (0–10 cm) (a) and subsoil layers (10–20 and 20–30 cm) (b,c). Abbreviations: SOC, soil organic carbon; TN, total nitrogen; TP, total phosphorus; SOCs, soil organic carbon stocks; TNs, total nitrogen stocks; TPs, total phosphorus stocks; C:N, SOC–to–TN ratio; C:P, SOC–to–TP ratio; N:P, soil TN–to–TP ratio; M, soil moisture content; BD, soil bulk density; STP, soil total porosity.
Forests 13 01770 g006
Figure 7. A conceptual diagram showing the effects of thinning on soil element contents, stocks, and their stoichiometry in a Chinese Phyllostachys edulis forest. Abbreviations: C, soil organic carbon; N, total nitrogen; P, total phosphorus; Cs, soil organic carbon stocks; Ns, total nitrogen stocks; Ps, total phosphorus stocks; C:N, SOC–to–TN ratio; C:P, SOC–to–TP ratio; N:P, soil TN–to–TP ratio. The red and blue lines represent the influencing pathways of moderate thinning (MT) and heavy thinning (IT) on soil C, N, and P contents, stocks, and their stoichiometry, respectively. The percentage values and the solid or dashed arrows beside them indicate the ratio of significant (p < 0.05) and nonsignificant differences in the 0–30 cm soil layer compared to the control, respectively. Downward and upward arrows represent negative and positive effects, respectively.
Forests 13 01770 g007
Table 1. Basic information of the stand before (2017) and after (2020) the experiment.
TreatmentAge (a)AspectSlope
(°)
Altitude(a.s.l. m)Density (Stem ha−1)DBH (cm)Average Height (m)Canopy Density
Before Thinning
(2017)
After Thinning *
(2020)
Before Thinning
(2017)
After Thinning *
(2020)
NT10northeast15205370040921111.1140.8
MT10northeast172053725195010.610.713.20.6
IT10northeast15205363817381110.315.50.57
NT: no-thinning (Control); MT: moderate-intensity thinning; IT: heavy-intensity thinning; DBH: diameter at breast height; *: the density and breast diameter after thinning including new bamboo.
Publisher’s Note: MDPI stays neutral with regard to jurisdictional claims in published maps and institutional affiliations.

