Article

Temporal Variation and Hysteresis of Soil Respiration and Sap Flow of Pinus densiflora in a Cool Temperate Forest, Japan

1
Department of Environmental Science, Faculty of Science, Toho University, 2-2-1 Miyama Funabashi, Chiba 274-8510, Japan
2
Graduate School of Life and Environmental Science, The University of Tsukuba, 1-1-1 Tennodai, Tsukuba 305-8577, Japan
3
River Basin Research Center, Gifu University, 1-1 Yanagido Gifu, Gifu 501-1193, Japan
*
Author to whom correspondence should be addressed.
Forests 2022, 13(11), 1833; https://doi.org/10.3390/f13111833
Submission received: 12 August 2022 / Revised: 26 October 2022 / Accepted: 1 November 2022 / Published: 3 November 2022

Abstract

:
Soil respiration (Rs) consists of autotrophic (Ra) and heterotrophic (Rh) respiration, and the metabolic responses of Ra and Rh are supposedly affected by environmental factors. Our hypothesis was that the contribution of Ra and Rh would be affected by seasons. To characterize seasonal patterns of Rs, sap flow (as an indicator of photosynthetic activity), and environmental factors, we continuously measured temporal variation in Rs using an automated opening and closing chamber system in a cool temperate forest. Rs had counterclockwise hysteresis (Rs: spring < autumn) with soil temperature at a depth of 5 cm. Daily maximum Rs had a significant positive relationship with daily maximum sap flow over three seasons, and daily maximum sap flow was lower in autumn than in spring (Ra: spring > autumn). The amount of leaf litterfall increased significantly from August to October; the high Rs in autumn would be due to an increase in Rh (Rh: spring < autumn). These results suggest that Ra contributes more in spring than in autumn, and the contribution of Rh is high from summer through autumn.

1. Introduction

Soil respiration (Rs) consists of autotrophic respiration (Ra) and heterotrophic respiration (Rh), and these components use a combination of different carbon sources [1]. Numerous studies have reported that the seasonal variation in Rs mainly has an exponential relationship with soil temperature in temperate and boreal forests (e.g., [2,3]). Global meta-analysis suggests a significant relationship between Rs and air temperature anomaly [4]. However, statistical models indicate that the uncertain response of Rh to soil water content, which depends on soil characteristics, would cause a difference of at least 4% in global soil carbon stock [5]. Some studies reported that soil water content is also an essential factor in the seasonal variation in Rs [6,7]. Soil temperature and water content are essential factors in spatial variation in Rs in a cool temperate forest [8].
According to the results of a meta-analysis, the contribution of Rh to total Rs tends to be high in regions with small annual Rs–for instance, Rh/Rs ratios are significantly higher in boreal forests than in temperate forests [9]. The contribution of Ra to total Rs increases with an increase in total Rs in temperate and boreal forests, with an average contribution of 45.8% among forest sites [10,11]. The response of Ra to soil temperature is higher than that of Rh, and the contribution of Ra is 48% in a Japanese larch forest [12]. Some studies note that the seasonal variation in Rs and soil temperature has a hysteresis relationship, and clockwise and counterclockwise hysteresis tend to be caused by an accelerated or delayed response of photosynthesis to changes in soil temperature [13]. Seasonal hysteresis of Rs with soil temperature is clockwise in forests, and it is even more apparent in grasslands [14]. Clockwise hysteresis means that the response of Rs to soil temperature is greater during spring–summer than during summer–autumn. Only a few field studies that measured Rs continuously have reported daily hysteresis of Rs with soil temperature; clockwise hysteresis has been observed in a temperate forest [7,14] and in a steppe grassland at high elevation [15]. Makita et al. [16] reported that diurnal hysteresis patterns of Rs with soil temperature differed in each month.
Ra is CO2 efflux from roots and the rhizosphere. The relationship between gross primary production (GPP) and Rs has been revealed by using the eddy covariance method [16,17], but continuous GPP measurement using this method is difficult at observation sites without flux towers. Sap flow is an indicator of plant photosynthetic activity, and GPP estimated using the eddy covariance method has a positive relationship with canopy transpiration flux measured as sap flow [18]. Sap flow has been measured to understand the transpiration between the atmosphere and soil via various plants–for instance, bamboo [19], pine tree [20,21], and Japanese cedar [22]. Some studies have reported that daily variation in sap flow correlates with vapor pressure deficit (VPD) and solar radiation [19,22].
If Ra and Rh have different metabolic responses to the temporal change of environmental factors, the contribution of Ra and Rh to Rs would be affected by season. Here we aimed to (1) characterize seasonal patterns of Rs, sap flow, and environmental factors during spring, summer, and autumn, (2) predict the response of tree photosynthesis using sap flow and the contribution of plant activity (Ra) to Rs, and (3) discuss the hysteresis pattern of Rs and seasonal differences in the contribution of Ra and Rh to Rs.

2. Materials and Methods

2.1. Study Site

The study was conducted in a Pinus densiflora (red pine) forest at Sugadaira Research Station, Mountain Science Center, University of Tsukuba, Japan (36°31′ N, 138°21′ E, 1336 m elevation). The P. densiflora forest is expected to be older (by >30 years) than the adjacent grassland [23,24]. Pinus densiflora is an evergreen needleleaf tree, but new leaves begin to expand at the end of August. The mean annual air temperature was 6.8 °C, with the monthly maximum (19.5 °C) in August and minimum (−6.5 °C) in January (2015–2019, Japan Meteorological Agency). Annual precipitation varied from 1086 to 1426 mm during 2015–2019, with a minimum in 2018 (Sugadaira Research Station records). Soil was classified as Umbric Andosol [25] and Typic Melanudand (USDA Soil Taxonomy) [24]. Total content of carbon was 122.2 g kg−1 soil and that of nitrogen was 7.2 g kg−1 soil at 0–20 cm depth [24].

2.2. Measurement of Meteorological and Soil Environments

VPD was calculated from measured relative humidity and air temperature near sap flow (S-THC-M002, Onset, Bourne, MA, USA), and Rs. Soil temperature at depths of 1 and 5 cm was measured with thermocouples. Soil water content at a depth of 10 cm was measured by using an EC5 soil moisture smart sensor (S-SMC-M005, Onset).

2.3. Measurement of Soil Respiration

Rs was measured in three chambers (25 cm diameter, 25 cm height) by using an automatic opening and closing chamber (AOCC) system [26] with a CO2 probe (GMP343, Vaisala, Helsinki, Finland). After the chamber lid was closed for 5 min, CO2 concentration data were recorded every 10 s by a data logger (LR8431, Hioki, Nagano, Japan). The rate of increase in CO2 concentration was used to calculate Rs, and the determination coefficient of linear regression (R2) was above 0.90 [16,27]. As the Rs data from one chamber hardly met the R2 condition, we used the Rs data of only two chambers.

2.4. Measurement of Sap-Flow

Two P. densiflora trees nearest to the chambers were selected. Sap flow was measured with Granier-type sensors [28], and the data were recorded every 30 s by a data logger (LR5041, Hioki); 1 h averages were used for the analysis. A pair of probes of 20 mm in length and 2 mm in diameter were insulated and installed [19,20]. The diameters at breast height (DBHs) of the trees were 22.2 and 29.2 cm in 2018.

2.5. Quality Control and Data Analysis

Due to a lack of Rs data during June and September, the analysis included only three periods: 26 April to 8 June (spring), 28 June to 4 September (summer), and 2 October to 3 December (autumn). To reduce the effect of rain on Rs and sap flow, the data on sunny days were defined as days with no precipitation and with continuous solar irradiation of more than 2.5 kW m−2 h−1 between 10:00 and 13:00 h.

2.6. Statistical Analysis

A multiple regression analysis was conducted between Rs and soil temperature, daily mean Rs and soil water content, and daily maximum Rs and sap flow. The Holm–Bonferroni method was used to test the differences in daily maximum sap flow among the three seasons. All statistical analyses were performed in R (ver. 4.1.2).

3. Results

3.1. Seasonal and Diurnal Variation in Soil Respiration and Environmental Factors

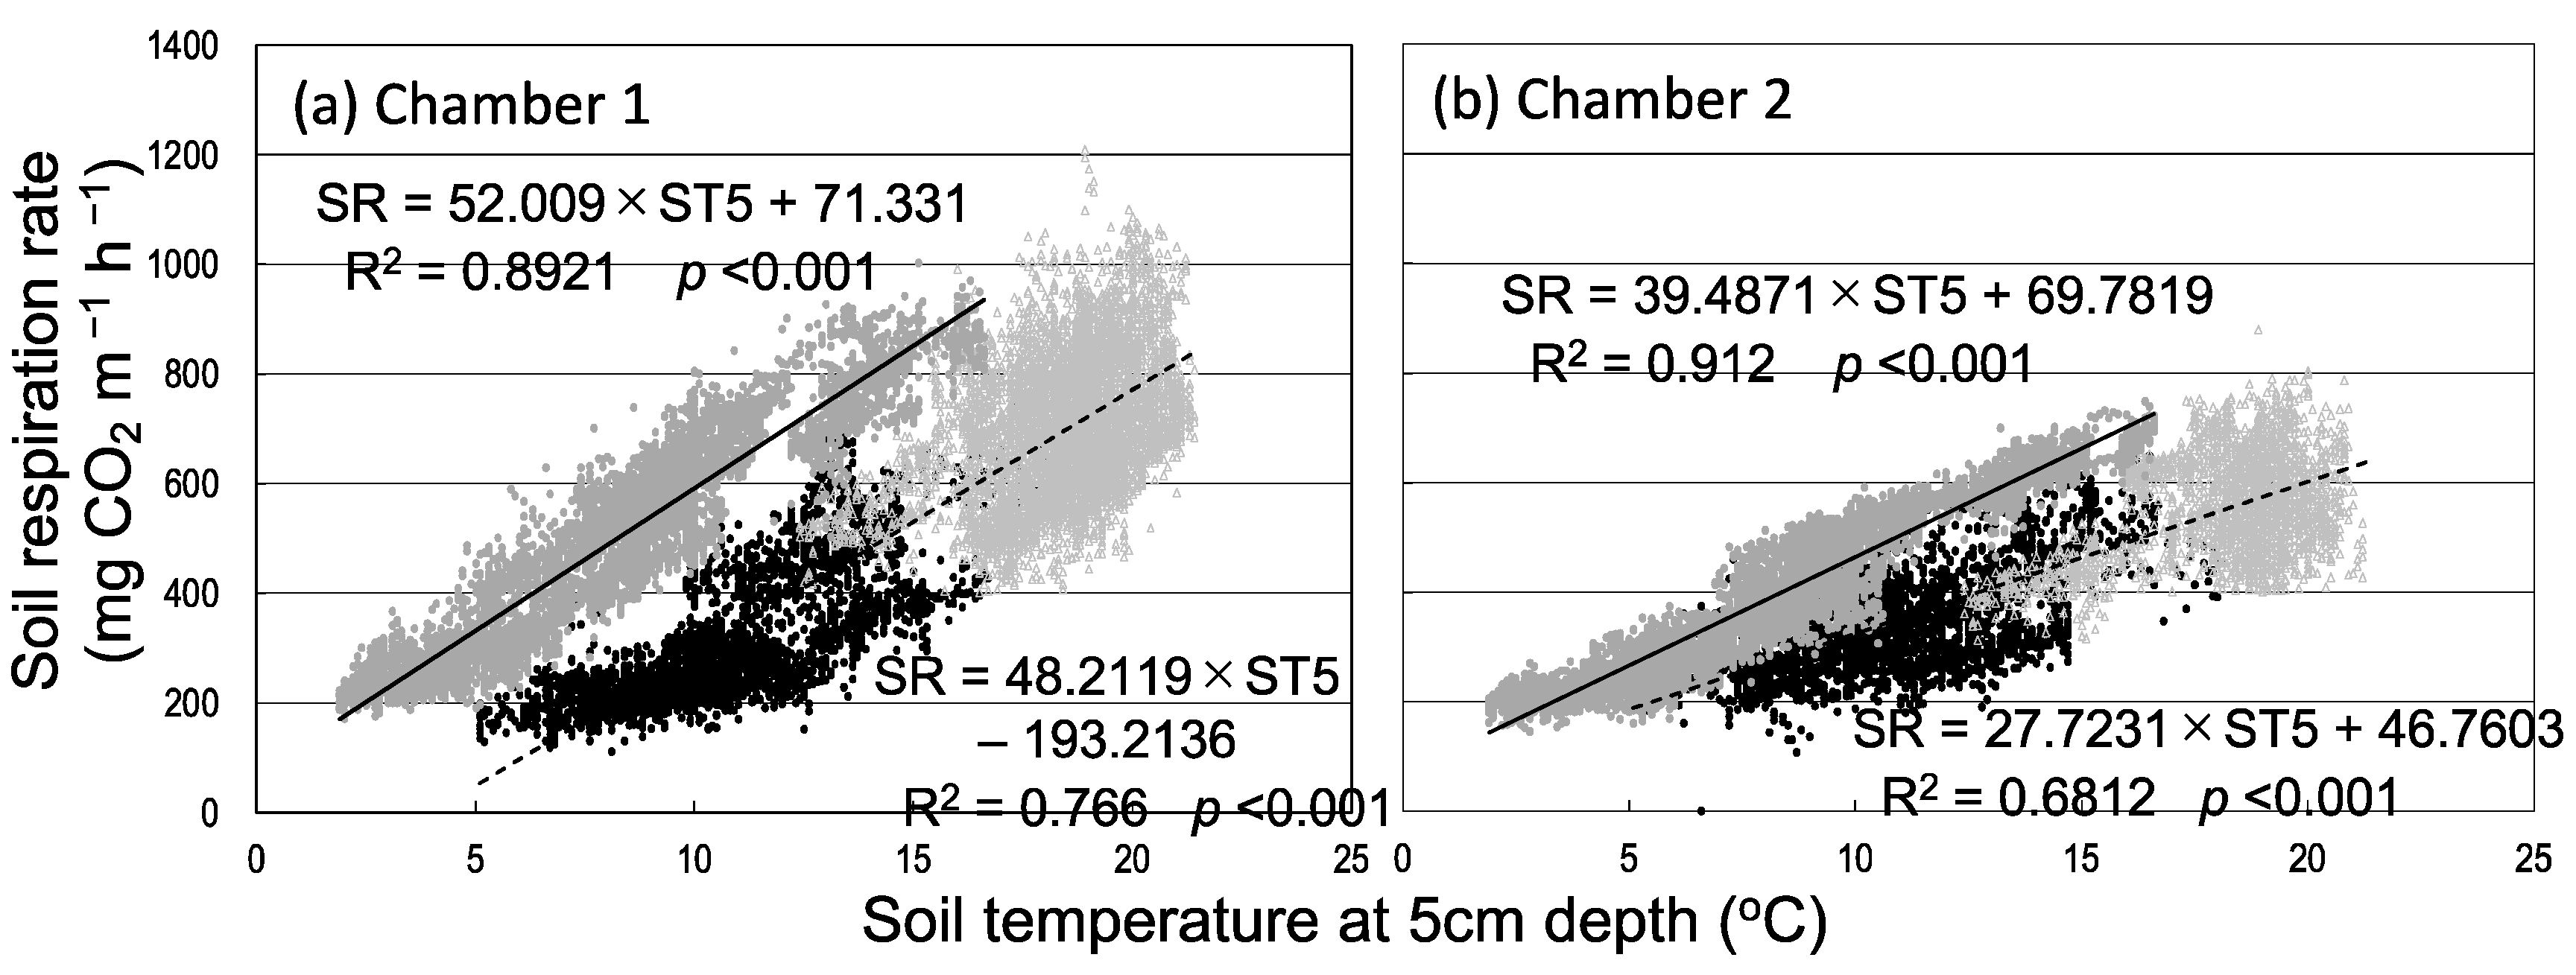
Figure 1 shows the seasonal variation in Rs and environmental factors (soil temperature and water content) among the three seasons. Rain events, which increased soil water content, increased Rs (8 May and 29 July) or decreased it (17 August) (Figure 1a,b). The relationship between Rs and soil temperature at a depth of 5 cm showed seasonal hysteresis; Rs tended to be higher in autumn than in spring at the same soil temperature (i.e., counterclockwise hysteresis in both chambers; Figure 2). Rs had a stronger positive correlation with soil temperature at a depth of 5 cm in autumn than in spring and summer in both chambers. On the other hand, daily mean Rs was negatively correlated with daily mean soil water content (Figure 3). Daily mean soil temperature was 10.8 ± 2.1 °C (mean ± SD, n = 34) in spring, 18.4 ± 1.3 °C (n = 69) in summer, and 8.3 ± 3.5 °C (n = 62) in autumn. Rs was higher in autumn than in spring despite the lower soil water content and soil temperature in autumn (Figure 3).
Figure 4 shows diurnal changes in Rs and soil temperature on sunny days. Rs tended to be higher in the morning than in the afternoon (clockwise hysteresis) in the three seasons. The diurnal variation in soil temperature was highest in spring.

3.2. Seasonal Variation in Soil Respiration and Sap Flow

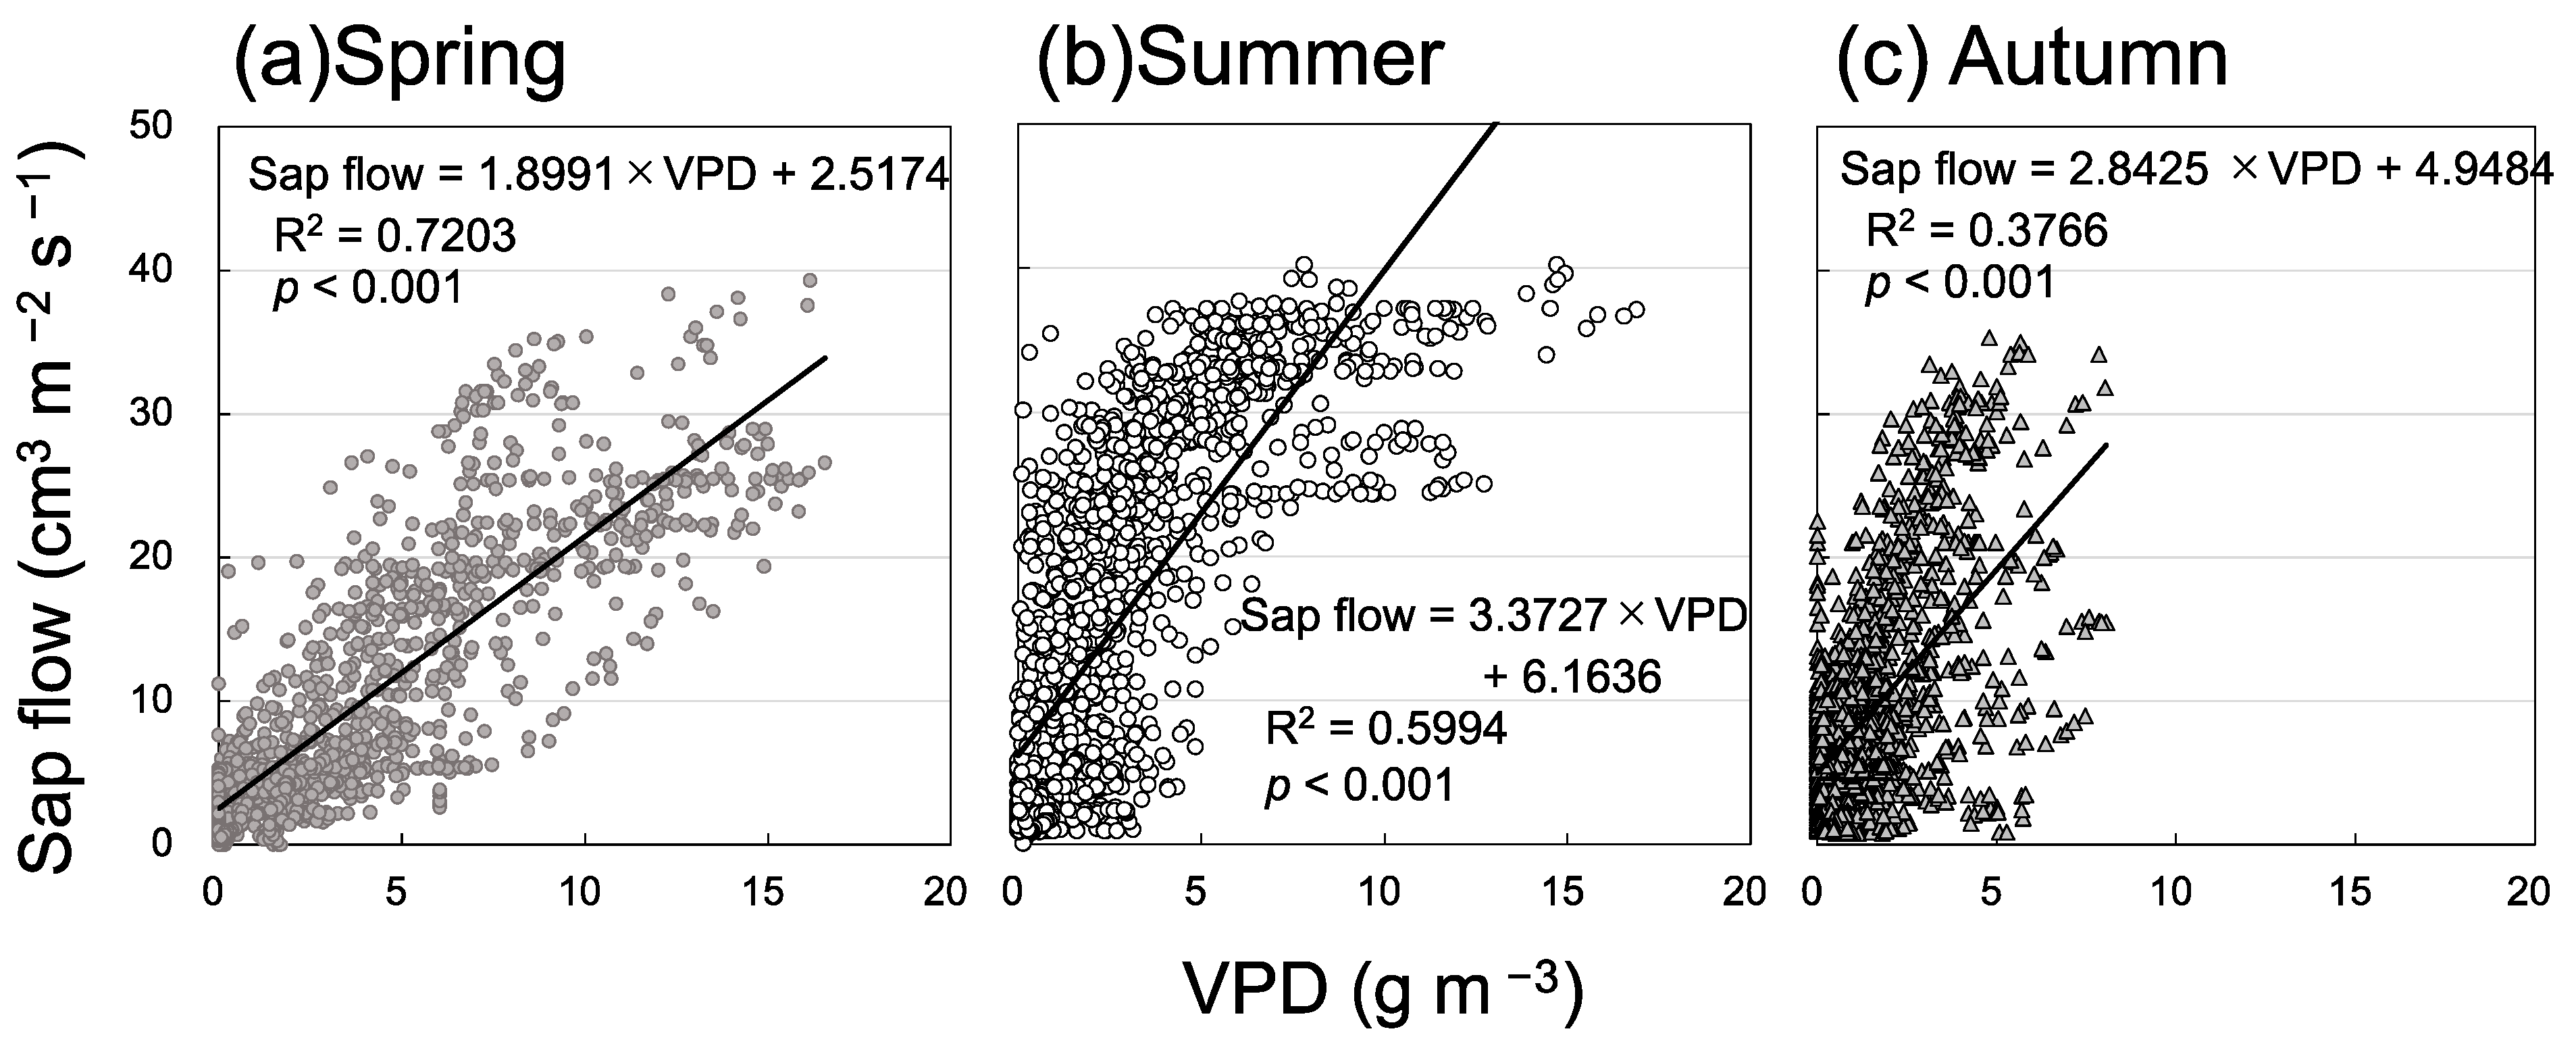
Figure 5 shows diurnal variation in Rs and sap flow in three seasons. Sap flow was very low on rainy days, for instance, on 5 and 6 July (Figure 5b). The daily maximum rate of sap flow remained high; the daily maximum Rs decreased from 14 to 26 July. Therefore, only Rs and sap flow data on sunny days were analyzed. Daily maximum Rs had a significant positive relationship with daily maximum sap flow (Figure 6). The mean daily maximum sap flow on sunny days was 32.2 ± 2.3 cm3 m−2 s−1 (n = 19) in spring, 42.3 ± 5.5 cm3 m−2 s−1 (n = 39) in summer, and 26.4 ± 9.0 cm3 m−2 s−1 (n = 15) in autumn, and these seasonal differences were significant (p < 0.01, Holm–Bonferroni method). Thus, daily maximum sap flow was lower in autumn than in spring, but Rs was higher in autumn than in spring at the same soil temperature. Sap flow and VPD had a significant positive relationship in each season, and VPD tended to be higher in spring than in autumn (Figure 7). Soil water content was higher in spring than in autumn (Figure 3); therefore, the contribution of Ra was likely higher in spring than in autumn.

4. Discussion

The results revealed the counterclockwise hysteresis of the seasonal Rs with the change of soil temperature (Figure 2), namely, Ra or Rh to Rs was higher in autumn than in spring at the same soil temperature. A comparison of the hysteresis of Rs in temperate and boreal forests is shown in Table 1. Rs tended to have a clockwise direction in warmer forests (but also in two cooler forests [7,29]) and counterclockwise direction in cooler forests. In one study of clockwise direction reported by Gaumont-Guay et al. [7], soil water content decreased from summer to autumn, and therefore Rs was higher in spring than in autumn. The study by Oe et al. [29] and the present study were conducted in the same forest but reported different results. We cannot clearly explain why the hysteresis of Rs had opposite directions in the same study area. However, maximum Rs reported by Oe et al. [29] (about 600 mg CO2 m−2 h−1) was lower than in our chamber 1 (by 50%; 1200 CO2 m−2 h−1) and chamber 2 (by 33%; 800 mg CO2 m−2 h−1). Our findings suggest that the contribution of Ra could be higher in spring than in autumn; if so, the contribution of Ra reported by Oe et al. [29] could be higher than in the present study. Zhang et al. [13] suggested that counterclockwise hysteresis is caused by a delay of photosynthetic response to soil temperature. In other words, root respiration could be higher from summer to autumn than in spring. In the present study, the daily maximum sap flow rate on sunny days was significantly higher in spring than in autumn (Figure 5), and the daily maximum sap flow was positively correlated with the daily maximum of Rs (Figure 6a). Bekku et al. [30] reported that Ra has no positive relationship with root temperature. As soil is warmer in the underlayer than at the surface in autumn in cooler forests [16], the contribution of Rh would become high in autumn.
The direction of Rs hysteresis in the present study was opposite to that in Oe et al. [29] at the same study site. Spatial variation in Rs was high, the coefficient of variation of daily summed Rs varied from 25% to 28%, and its variation was similar to that of soil water content at 121 points in a 1-ha site in a mature beech forest [8]. The response of Rs to environmental factors differs under the canopy and in the gap in a deciduous forest [26]. Continuous measurements of Rs in the present study were conducted within 1 m2; the seasonal response of Rs could differ at each point. Therefore, spatial and temporal variation in Rs and their response to environmental factors are important to understanding the soil carbon dynamics in forest ecosystems.
Using the trenching method, Tomotsune et al. [31] found that the soil temperature response of Rh is higher than that of Ra in a broad-leaved secondary forest. The trenching method allows Ra and Rh to be physically separated [3,32,33], and some studies have separated not only Rh but also soil organic matter respiration [12] and mycorrhizal respiration [12,34]. The contribution of Ra is 45.8% among forest sites around the world [10,11]. The contribution of Rh in Japanese forests tends to be higher than that of Ra: it is reportedly 52% [12] and 79% [33] in deciduous forests and 81.5% in a larch forest [3]. In red pine forests, the contribution of Rh varies from 52% in winter to 80% in summer [35]. In litter addition experiments in subtropical successional forests, soil temperature and water content were hardly affected by litter manipulation, but litter addition increased the Rs by 72%–87% in three different types of forests [36]. At our study site, the amount of leaf litterfall was significantly increased from August to October, and it was 14.9 times higher in October than in May 2018 (unpublished data). Microbial activity, such as β-glucosidase, significantly increases due to litter addition [37]. The high amount of leaf litterfall from August to October indicates that the high Rs in autumn was due to an increase in Rh.
Table 1. Direction of soil respiration (Rs) hysteresis in temperate and boreal forest in previous studies.
Direction of Rs
Hysteresis
Dominant
Species
Forest TypeDepth of Soil Temperature Measurement (cm)Forest Age (Years)Annual Air Temperature (°C)Annual
Precipitation
(mm yr−1)
References No.
ClockwisePopulus tremuloidesMF2 *810.3456[7]
ClockwiseQuercus kelloggiiMF8 *No data10.3507[14]
ClockwiseQuercus serrataMF5 *3015.51388[38]
ClockwisePinus densifloraMF0 *, 5 *, 10 *406.7 1132 [29]
ClockwiseChamaecyparis obtusaPT25013.41595[16]
CounterclockwisePinus tabuliformisPT10410.8454[39]
CounterclockwisePicea abies,
Pinus sylvestris
MF5705.5527[40]
CounterclockwiseQuercus roburPT2659.8750[41]
CounterclockwiseCryptomeria japonicaPT52–310.61734[42]
CounterclockwisePinus densifloraMF5556.81086This study
Clockwise: Rs in spring > Rs in autumn, counterclockwise: Rs in spring < Rs in autumn, Forest type: MF is mixed forest, PT is plantation. * daily mean soil temperature, data from Japan Meteorological Agency (2002–2003).

5. Conclusions

To verify our hypothesis that the contributions of Ra and Rh to Rs are affected by season, we continuously measured Rs, sap flow (as an indicator of photosynthetic activity), and environmental factors using automatic measurement systems in a cool temperate forest, Japan. The relationship between Rs and soil temperature at a depth of 5 cm showed seasonal hysteresis; Rs tended to be higher in autumn than in spring at the same soil temperature. Daily maximum sap flow was lower in autumn than in spring. Soil water content was higher in spring than in autumn, indicating that the contribution of Ra could be higher in spring than in autumn. The amount of leaf litterfall increased significantly from August to October, and we concluded that the high Rs in autumn was likely due to an increase in Rh. Moreover, soil is warmer in the underlayer than at the surface in autumn in cooler forests, and thus the contribution of Rh would become high in autumn. However, seasonal measurements of Rh are difficult, and we need more continuous data to understand the contribution of Ra and Rh to Rs.

Author Contributions

M.A. planned and performed the experiments, analyzed the data, and wrote the paper; Y.H. analyzed the data; T.M.S. and M.H. performed the experiments and contributed material tools. All the authors worked on editing and revising the manuscript. All authors have read and agreed to the published version of the manuscript.

Funding

This work was supported by JSPS KAKENHI Grant Number JP 21H05318; Mountain Science Center, University of Tsukuba; and River Basin Research Center, Gifu University (2017-F-005).

Institutional Review Board Statement

Not applicable.

Informed Consent Statement

Not applicable.

Data Availability Statement

Not applicable.

Acknowledgments

We are grateful to the staff at Sugadaira Research Station, Mountain Science Center, and the University of Tsukuba for supporting our field study and providing climate data.

Conflicts of Interest

The authors declare no conflict of interest.

References

  1. Kuzyakov, Y.; Gavrichkova, O. Time lag between photosynthesis and carbon dioxide efflux from soil: A review of mechanisms and controls. Glob. Chang. Biol. 2010, 16, 3386–3406. [Google Scholar] [CrossRef]
  2. Mo, W.; Lee, M.; Uchida, M.; Inatomi, M.; Saigusa, N.; Mariko, S.; Koizumi, H. Seasonal and annual variations in soil respiration in a cool-temperate deciduous broad-leaved forest in Japan. Agric. For. Meteorol. 2005, 134, 81–94. [Google Scholar] [CrossRef]
  3. Teramoto, M.; Liang, N.; Takahashi, Y.; Zeng, J.; Saigusa, N.; Ide, R.; Zhao, X. Enhanced understory carbon flux components and robustness of net CO2 exchange after thinning in a larch forest in central Japan. Agric. For. Meteorol. 2019, 274, 106–117. [Google Scholar] [CrossRef]
  4. Bond-Lamberty, B.; Thomson, A. Temperature-associated increases in the global soil respiration record. Nature 2010, 464, 579–582. [Google Scholar] [CrossRef]
  5. Moyano, F.E.; Vasilyeva, N.; Bouckaert, L.; Cook, F.; Craine, J.; Yuste, J.C.; Don, A.; Epron, D.; Formanek, P.; Franzluebbers, A.; et al. The moisture response of soil heterotrophic respiration interaction with soil properties. Biogeosciences 2012, 9, 1173–1182. [Google Scholar] [CrossRef] [Green Version]
  6. Davidson, E.A.; Belk, E.; Boone, R.D. Soil water content and temperature as independent or confounded factors controlling soil respiration in a temperate mixed hardwood forest. Glob. Chang. Biol. 1998, 4, 217–227. [Google Scholar] [CrossRef] [Green Version]
  7. Gaumont-Guay, D.; Black, T.A.; Griffis, T.J.; Barr, A.G.; Jassal, R.S.; Nesic, Z. Interpreting the dependence of soil respiration on soil temperature and water content in a boreal aspen stand. Agric. For. Meteorol. 2006, 140, 220–235. [Google Scholar] [CrossRef]
  8. Cai, Y.; Nishimura, T.; Ida, H.; Hirota, M. Spatial variation in soil respiration is determined by forest canopy structure through soil water content in a mature beech forest. For. Ecol. Manag. 2021, 501, 119673. [Google Scholar] [CrossRef]
  9. Subke, J.-A.; Inglima, I.; Cotrufo, M.F. Trends and methodological impacts in soil CO2 efflux partitioning: A metanalytical review. Glob. Chang. Biol. 2006, 12, 921–943. [Google Scholar] [CrossRef]
  10. Bond-Lamberty, B.; Wang, C.; Gower, S.T. A global relationship between heterotrophic and autotrophic components of soil respiration? Glob. Chang. Biol. 2004, 10, 1756–1766. [Google Scholar] [CrossRef]
  11. Raich, J.; Lambers, H.; Oliver, D. Respiration in terrestrial ecosystems. Treatise Geochem. 2014, 10, 613–649. [Google Scholar] [CrossRef]
  12. Makita, N.; Fujimoto, R.; Tamura, A. The contribution of roots, mycorrhizal hyphae, and soil free-living Microbes to soil respiration and its temperature sensitivity in larch forest. Forests 2021, 12, 1410. [Google Scholar] [CrossRef]
  13. Zhang, Q.; Phillips, R.P.; Manzoni, S.; Scott, R.L.; Oishi, A.C.; Finzi, A.; Daly, E.; Vargas, R.; Novick, K.A. Changes in photosynthesis and soil moisture drive the seasonal soil respiration-temperature hysteresis relationship. Agric. For. Meteorol. 2018, 259, 184–195. [Google Scholar] [CrossRef]
  14. Vargas, R.; Allen, M.F. Environmental controls and the influence of vegetation type, fine roots and rhizomorphs on diel and seasonal variation in soil respiration. New Phytol. 2008, 179, 460–471. [Google Scholar] [CrossRef] [PubMed] [Green Version]
  15. Guan, C.; Chen, N.; Qiao, L.; Zhao, C. Photosynthesis regulates the diel hysteresis pattern between soil respiration and soil temperature in a steppe grassland. Geoderma 2022, 408, 115561. [Google Scholar] [CrossRef]
  16. Makita, N.; Kosugi, Y.; Sakabe, A.; Kanazawa, A.; Ohkubo, S.; Tani, M. Seasonal and diurnal patterns of soil respiration in an evergreen coniferous forest: Evidence from six years of observation with automatic chambers. PLoS ONE 2018, 13, e0192622. [Google Scholar] [CrossRef] [PubMed] [Green Version]
  17. Heinemeyer, A.; Wilkinson, M.; Vargas, R.; Subke, J.-A.; Casella, E.; Morison, J.I.L.; Ineson, P. Exploring the “overflow tap” theory: Linking forest soil CO2 fluxes and individual mycorrhizosphere components to photosynthesis. Biogeosciences 2012, 9, 79–95. [Google Scholar] [CrossRef] [Green Version]
  18. Klein, T.; Rotenberg, E.; Tatarinov, F.; Yakir, D. Association between sap flow-derived and eddy covariance-derived measurements of forest canopy CO2 uptake. New Phytol. 2016, 209, 436–446. [Google Scholar] [CrossRef]
  19. Kume, T.; Onozawa, Y.; Kamatsu, H.; Tsuruta, K.; Shinohara, Y.; Umebayashi, T.; Otsuki, K. Stand-scale transpiration estimates in a Moso bamboo forest: (I) Applicability of sap flux measurements. For. Ecol. Manag. 2010, 260, 1287–1294. [Google Scholar] [CrossRef]
  20. Schäfer, K.V.; Oren, R.; Lai, C.T.; Katul, G.G. Hydrologic balance in an intact temperature forest ecosystem under ambient and elevated atmospheric CO2 concentration. Glob. Chang. Biol. 2002, 8, 895–911. [Google Scholar] [CrossRef]
  21. Moore, D.J.P.; Gonzalez-Meler, M.A.; Taneva, L.; Pippen, J.S.; Kim, H.S.; DeLucia, E.H. The effect of carbon dioxide enrichment on apparent stem respiration from Pinus taeda L. is confounded by high levels of soil carbon dioxide. Oecologia 2008, 158, 1–10. [Google Scholar] [CrossRef] [PubMed]
  22. Kumagai, T.; Aoki, S.; Nagasawa, H.; Mabuchi, T.; Kubota, K.; Inoue, S.; Utsumi, Y.; Otsuki, K. Effect of tree-to-tree and radial variations on sap flow estimates of transpiration in Japanese cedar. Agric. For. Meteorol. 2005, 135, 110–116. [Google Scholar] [CrossRef]
  23. Kato, J.; Hayasi, I. Quantitative analysis of a stand of Pinus densiflora undergoing succession to Quercus mongolica ssp. crispula: 1. A 31-year record of growth and population dynamics of the canopy trees. Ecol. Res. 2006, 21, 503–509. [Google Scholar] [CrossRef]
  24. Iimura, Y.; Fujimoto, M.; Hirota, M.; Tamura, K.; Higashi, T.; Yonebayashi, K.; Fujitake, N. Effects of ecological succession on surface mineral horizons in Japanese volcanic ash soil. Geoderma 2010, 159, 122–130. [Google Scholar] [CrossRef]
  25. Suzuki, T.; Fujitake, N.; Ueda, Y.; Oji, Y. Vertical distribution of main soil hydroxyanthraquinones in soil profiles. Soil Sci. Plant Nutr. 1999, 45, 551–561. [Google Scholar] [CrossRef]
  26. Suchewaboripont, V.; Ando, M.; Yoshitake, S.; Iimura, Y.; Hirota, M.; Ohtsuka, T. Spatial upscaling of soil respiration under a complex canopy structure in an old-growth deciduous forest, Central Japan. Forests 2017, 8, 36. [Google Scholar] [CrossRef] [Green Version]
  27. Sakabe, A.; Kosugi, Y.; Takahashi, K.; Itoh, M.; Kanazawa, A.; Makita, N.; Ataka, M. One year of continuous measurements of soil CH4 and CO2 fluxes in a Japanese cypress forest: Temporal and spatial variations associated with Asian monsoon rainfall. J. Geophys. Res. Biogeosci. 2015, 120, 585–599. [Google Scholar] [CrossRef] [Green Version]
  28. Granier, A. Evaluation of transpiration in a Douglas-Fir stand by means of sap flow measurements. Tree Physiol. 1987, 3, 309–320. [Google Scholar] [CrossRef]
  29. Oe, Y.; Yamamoto, A.; Mariko, S. Characteristics of soil respiration temperature sensitivity in a Pinus/Betula mixed forest during periods of rising and falling temperature under the Japanese monsoon climate. J. Ecol. Field Biol. 2011, 34, 193–202. [Google Scholar] [CrossRef] [Green Version]
  30. Bekku, S.Y.; Sakata, T.; Nakano, T.; Koizumi, H. Middy depression in root respiration of Quercus crispula and Chamaecyparis obtusa: Its implication for estimating carbon cycling in forest ecosystems. Ecol. Res. 2009, 24, 865–871. [Google Scholar] [CrossRef]
  31. Tomotsune, M.; Yoshitake, S.; Watanabe, S.; Koizumi, H. Separation of root and heterotrophic respiration within soil respiration by trenching, root biomass regression, and root excising methods in a cool-temperate deciduous forest in Japan. Ecol. Res. 2013, 28, 259–269. [Google Scholar] [CrossRef]
  32. Hermans, R.; McKenzie, R.; Andersen, R.; Teh, Y.A.; Cowie, N.; Subke, J.A. Net soil carbon balance in afforested peatlands and separating autotrophic and heterotrophic soil CO2 effluxes. Biogeosciences 2022, 19, 313–327. [Google Scholar] [CrossRef]
  33. Teramoto, M.; Liang, N.; Ishida, S.; Zeng, J. Long-term stimulatory warming effect on soil heterotrophic respiration in a coo-temperate boad-leaved deciduous forest in Northern Japan. J. Geophys. Res. Biogeosci. 2018, 123, 1161–1177. [Google Scholar] [CrossRef]
  34. Baraba, J.; Yuste, J.C.; Poyatos, R.; Janssens, I.A.; Lloret, F. Strong resilience of soil respiration components to drought-induced die-off resulting in forest secondary succession. Oecologia 2016, 182, 27–41. [Google Scholar] [CrossRef] [Green Version]
  35. Ohtsuka, T.; Negishi, M.; Sugita, K.; Iimura, Y.; Hirota, M. Carbon cycling and sequestration in a Japanese red pine (Pinus densiflora) forest on lava flow of Mt. Fuji. Ecol. Res. 2013, 28, 855–867. [Google Scholar] [CrossRef]
  36. Han, T.; Huang, W.; Liu, J.; Zhou, G.; Xiao, Y. Different soil respiration responses to litter manipulation in three subtropical successional forests. Sci. Rep. 2015, 5, 18166. [Google Scholar] [CrossRef] [PubMed] [Green Version]
  37. Fan, X.M.; Wang, G.G.; Xu, Z.J.; Zong, Y.Y.; Zhang, X.L.; Li, J.J.; Wang, H.; Chen, F.S. Litter addition and understory removal influenced soil organic carbon quality and mineral nitrogen supply in a subtropical plantation forest. Plant Soil 2021, 460, 527–540. [Google Scholar] [CrossRef]
  38. Kominami, Y.; Joumura, M.; Ataka, M.; Tamai, K.; Miyama, T.; Dannoura, M.; Makita, N.; Yoshimura, K. Heterotrophic respiration causes seasonal hysteresis in soil respiration in a warm-temperate forest. J. For. Res. 2012, 17, 296–304. [Google Scholar] [CrossRef]
  39. Jia, X.; Zha, T.; Wu, B.; Zhang, Y.; Chen, W.; Wang, X.; Yu, H.; He, G. Temperature response of soil respiration in a Chinese pine plantation: Hysteresis and seasonal vs. Diel Q10. PLoS ONE 2013, 8, e57858. [Google Scholar] [CrossRef] [Green Version]
  40. Morén, A.-S.; Lindroth, A. CO2 exchange at the floor of a boreal forest. Agric. For. Meteorol. 2000, 101, 1–14. [Google Scholar] [CrossRef]
  41. Yuste, J.C.; Janssens, I.A.; Ceulemans, R. Calibration and validation of an empirical approach to model soil CO2 efflux in a decisuous forest. Biogeochemistry 2005, 73, 209–230. [Google Scholar] [CrossRef]
  42. Lee, M.-S.; Lee, J.-S.; Koizumi, H. Temporal variation in CO2 efflux from soil and snow surfaces in a Japanese cedar (Cryptomeria japonica) plantation, central Japan. Ecol. Res. 2008, 23, 777–785. [Google Scholar] [CrossRef]
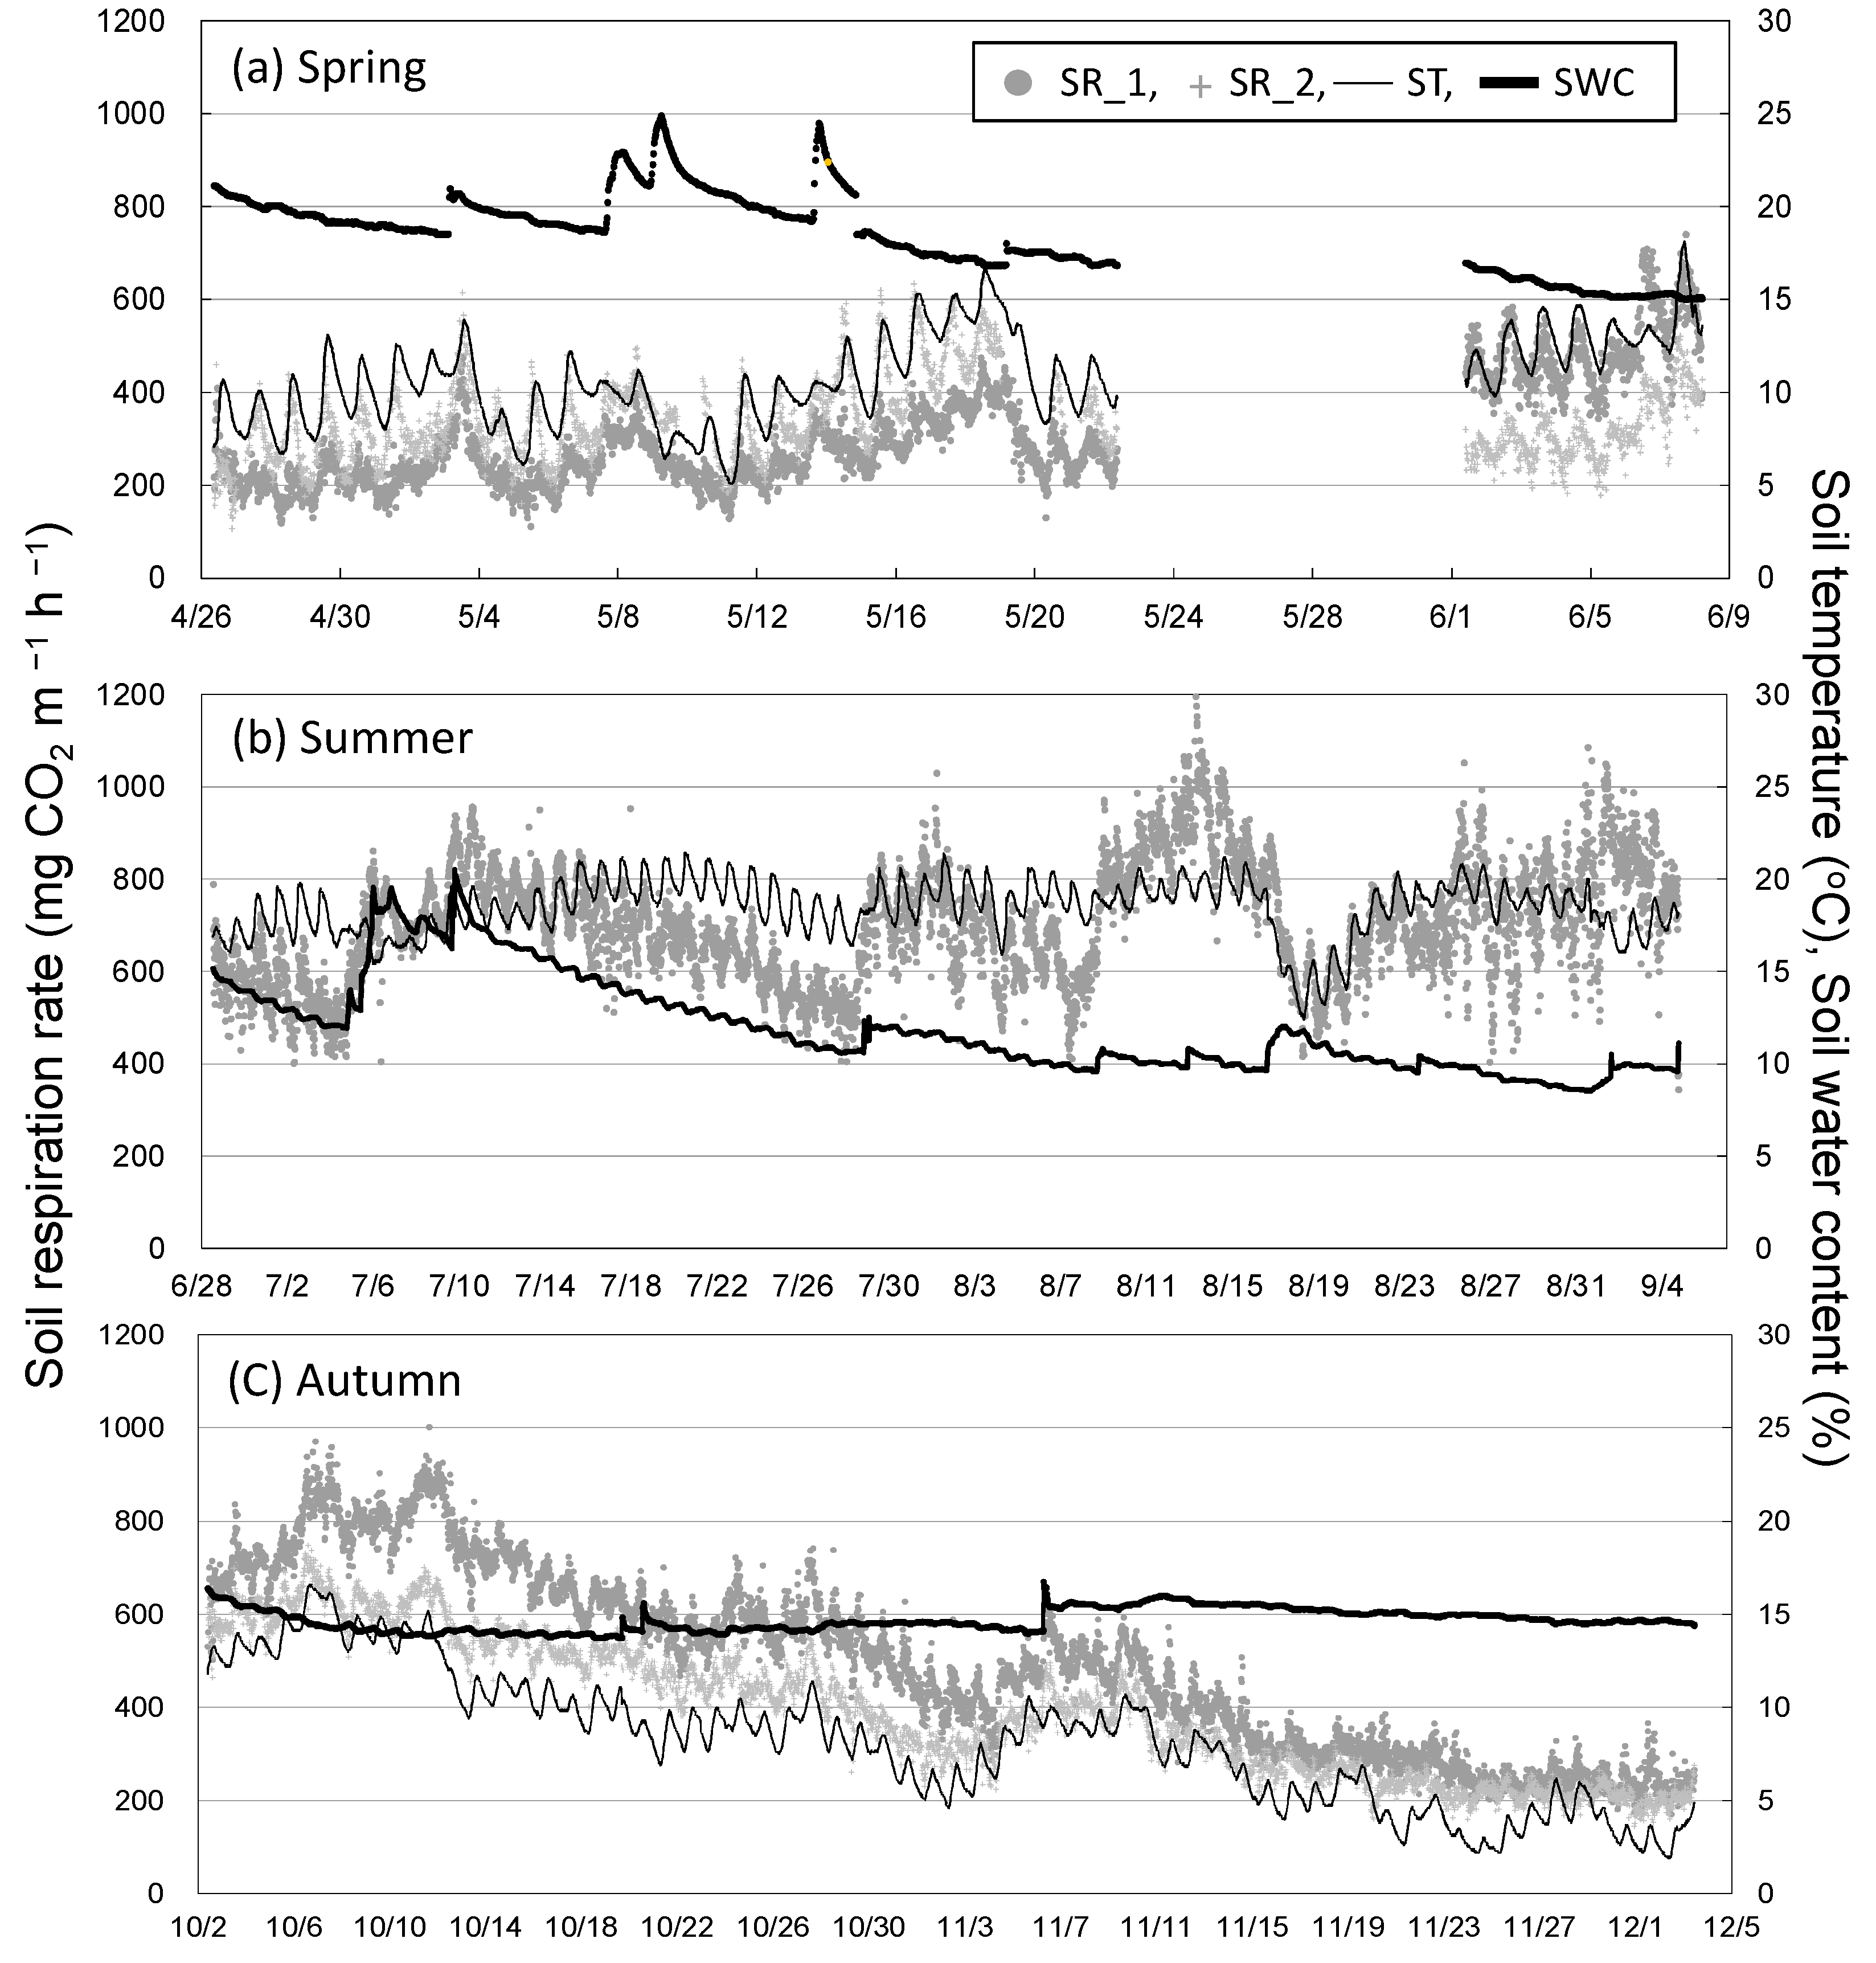
Figure 1. Seasonal variation in soil respiration and environmental factors during (a) spring, (b) summer, and (c) autumn 2018. SR_1 and SR_2, Rs in two chambers of Rs; ST, soil temperature at a depth of 5 cm; SWC, soil water content at a depth of 10 cm.
Forests 13 01833 g001
Figure 2. Relationship between soil respiration rate and soil temperature at a depth of 5 cm in the two chambers. Closed black circles, spring; open gray triangles, summer; closed gray circles, autumn.
Forests 13 01833 g002
Figure 3. Relationship between daily mean soil respiration rate and daily mean soil water content (SWC) at a depth of 10 cm in the three seasons in 2018. Closed black circles, open gray triangles, and closed gray circles were data in spring, summer, and autumn.
Forests 13 01833 g003
Figure 4. Relationship between hourly mean soil respiration rate (chamber 1) and soil temperature at a depth of 5 cm on sunny days in (a) spring (28 April to 3 May), (b) summer (14 to 18 July), and (c) autumn (5 days from 3 to 22 October).
Forests 13 01833 g004
Figure 5. Temporal variation in soil respiration (chamber 1) and two sap flows in (a) spring, (b) summer, and (c) autumn in 2018.
Forests 13 01833 g005
Figure 6. Relationship between daily maximum sap flow (Max_sap) and (a) daily maximum soil respiration rate and (b) daily mean soil temperature at a depth of 5 cm on sunny days only in three seasons. The daily maximum sap flow and soil respiration were calculated as the average values of two samples on the same day.
Forests 13 01833 g006
Figure 7. Relationship between sap flow and vapor pressure deficit (VPD) in (a) spring, (b) summer, and (c) autumn.
Forests 13 01833 g007
Publisher’s Note: MDPI stays neutral with regard to jurisdictional claims in published maps and institutional affiliations.