Article

Prediction of Primary Deformation Modulus Based on Bearing Capacity: A Case on Forest Road with a Light Falling Weight Deflectometer Zorn ZFG 3000 GPS

by
Sylwester M. Grajewski
Department of Forest Engineering, Faculty of Forestry and Wood Technology, Poznań University of Life Sciences, Wojska Polskiego 71C, 60-625 Poznań, Poland
Forests 2022, 13(11), 1874; https://doi.org/10.3390/f13111874
Submission received: 17 October 2022 / Revised: 3 November 2022 / Accepted: 4 November 2022 / Published: 9 November 2022
(This article belongs to the Section Forest Operations and Engineering)

Abstract

:
Bearing capacity and compaction are among the most important and frequently used geotechnical parameters in road construction. The aim of this study was to determine the possibility of predicting the value of the primary deformation modulus E1 (obtained from measurements using a static plate load test—PLT) based on measurements with a Zorn light falling weight deflectometer (LFWD), type ZFG 3000 GPS, with a drop weight of 10 kg. A regression analysis was performed on 245 bearing capacity measurements that were taken on 46 forest road sections with various road surfaces. Different regression models were tested, from linear to logarithmic, polynomial, exponential and power models, but excluding polynomials of fourth and higher degree. The results showed that the prediction of E1 values (PLT) from the dynamic deformation modulus values Evd (LFWD) was possible. However, the reported unsatisfactory strength of the relationship between the two parameters was associated with a high risk of error (r = 0.64, R2 = 0.41, Se = 49.78). Neither the use of more complex non-linear regression models, nor the use of multiple regression by introducing an additional estimator in the form of the s/v ratio, significantly improved estimation results. The quality of the prediction of the E1 value was not constant. It varied, depending on the type of forest road, the use of geosynthetic reinforcement and the type of road subgrade. During the study, it was also found that the quality of the prediction of the E1 value could be improved by limiting the range of Evd values tested from above. It is advisable to continue this type of research, as the obtained results could form the basis for future development of national standards for the use of LFWDs to control the bearing capacity and compaction of forest road pavements.

1. Introduction

Forest roads are the backbone of forest management, as they provide access to logging areas and allow timber to be transported from the forest to sawmills [1]. Forest roads also fulfill other important functions [2]; for example, they enable adequate fire protection of forest areas [3,4,5], or the development of tourism and recreation [6,7,8,9]. Sustainable forest management is therefore, not possible without an adequate network of forest roads, which are classified as low volume roads (LVRs) [10,11,12]. The main characteristics of LVRs are that they have an average traffic volume of < 400 vehicles per day, low design speed and suitable geometry. Many LVRs in the world, including forest roads, are single-lane roads with gravel or even native surfaces, whose carrying capacities vary greatly, depending on weather conditions and season [13].
In Poland, the main manager of forest land is the National Forest-State Forest Holding (SF-NFH), which manages almost 77% of the total forest area of 9242 thousand hectares [14]. According to SF-NFH, there are a total of nearly 104,000 km of roads in the areas it manages, which are necessary for the proper management of forest resources, and correspond to an average density of 14.5 m/ha [15]. A significant percentage of forest roads have unpaved surfaces (47%). Surfaces of gravel, crushed stone, ash, cobbles, precast concrete, wood, etc., are found on about 49% of the total length of all forest roads, and bituminous/concrete surfaces (paved roads) account for less than 4% of their length [15]. The main aggregates that are used in forest road construction are natural aggregates, which are obtained from crushing solid rock and other natural aggregates, with gravels, all-in aggregates and sands forming the basis. In road construction, substitutes for natural aggregates from recycled bricks or concrete are increasingly being used [16]. At the same time, it is becoming more common to reinforce forest road surfaces with planar and spatial geosynthetics such as woven geotextiles, geogrids and geocells. Road sections that are subject to particularly heavy use are built with much more expensive, but also more effective, bitumen and concrete technologies. Alternatives to these costly solutions are technologies that involve prefabricated concrete elements, or the surface treatment of existing aggregate pavements with asphalt emulsions [16].
Despite the significant annual expenditure on road infrastructure improvement, which amounted to PLN 42.24 billion between 2010 and 2021, the need for investment in the construction, modernisation and rehabilitation of the road network in forests remains enormous, and concerns all types of forest roads. Suffice it to say that the technical conditions of only 18% of roads are described as good, while more than 17% are considered poor [15]. The need for modernisation mainly concerns the main unpaved roads, which combine the functions of providing access to fire and timber transport. These roads need to be characterised using appropriate technical parameters, with the bearing capacity of the surface playing an important role [17]. The prospect of continued intensive investment in forest road infrastructure reinforces the need for investors to find quick, relatively inexpensive, and at the same time, reliable methods of assessing the quality of the construction work. Quality assessment methods are essential to the implementation of any investment process.
Bearing capacity and compaction are among the most important and frequently used geotechnical parameters in road construction. They can already be encountered in the preparation phase of a road construction project. They are no less important during execution, during the step-by-step and final assessment of the correctness of the road works, or during the road operation phase, when their technical condition is regularly assessed [17]. Bearing capacity and compaction tests for most cubic and linear structures in civil engineering, from soil investigation to quality control of the works, have been carried out for many years, using the static plate load test (PLT). Especially in European countries, this is still a very popular test method, and at the same time, one of the most frequently used methods for measuring the bearing capacity parameters of forest roads in Poland.
The static plate load test measures the vertical deformations (settlements) of the road subgrade or pavement layer(s) that occur during the double process of applying static pressure on a steel plate [18,19,20]. According to Polish regulations, between two loading cycles of the plate performed in steps (stages) of 0.05 MN·m−2 until the required final value is reached, unloading is also performed in steps (stages) of 0.1 MN·m−2 [21,22]. The test begins with the introduction of a preload (0.02 MN·m−2), and setting the displacement sensor(s) to 0.00 mm. A pressure of 0.05 MN·m−2 is then applied to the layer under test, and the dial gauges are not read until the settlement stabilises. The pressure is increased in steps of 0.05 MN·m−2 until the target level is reached, and the dial gauges are not read each time until the settlements have stabilised. The maximum load capacities are brought to the following values (the pressure plate is placed directly on the layer to be tested):
  • 0.25 MN·m−2—when testing the road subgrade or embankment;
  • 0.35 MN·m−2—when testing the layer(s) of the improved road subgrade;
  • 0.45 MN·m−2—when testing the layer(s) of road base course;
  • 0.55 MN·m−2—when testing the entire pavement structure.
Based on the measurement results, the values of two deformation moduli are calculated: the primary deformation modulus E1 (determined in the first loading cycle of the plate) and the secondary deformation modulus E2 (also determined in the second loading cycle of the plate), as well as the deformation index Io. The deformation modulus is calculated according to Formula (1), while the value of the deformation index Io [-] is calculated according to Formula (2).
E i = 3 Δ p 4 Δ s · D
where Ei—primary (E1) or secondary (E2) modulus of deformation [MN·m−2]; Δp—load increase in the assumed interval: Δp = p0.15 − p0.05 for the road subgrade test, Δp = p0.25 − p0.15 for the improved subgrade and structural pavement layers, Δp = p0.35 − p0.25 for the whole pavement [MN·m−2]; Δs—settlement increase corresponding to the load increase: Δs = s0.15 − s0.05 for the road subgrade, Δs = s0.25 − s0.15 for the improved subgrade and the structural pavement layers, Δs = s0.35 − s0.25 for the whole pavement [mm]; D—plate diameter [mm].
I o = E 2 E 1
Road pavement tests usually use a 300 mm diameter plate, to which pressure is applied via a hydraulic cylinder that is supported by a counterweight whose weight is significantly greater than the applied force [23]. The counterweight must allow the measuring device to be positioned at the test site in order to obtain meaningful measurement results [24]. Another complication of using PLTs is the extended test time needed. A minimum of 1.5 h is required to perform a measurement on a single test point of a pavement, according to the standard requirements (maximum load of 0.55 MN·m−2), unless the measurements are accompanied by surface deformations of more than 0.05 mm, at two-minute intervals at each loading step/stage. Maintaining the correct time interval between the loading and unloading steps is also very important to obtain meaningful results [18]. An argument that sometimes discourages the use of this test method pertains to the need to secure sufficient space, which can quite often mean the short-term exclusion of a certain road section from use [17].
Despite the inconveniences mentioned above, PLTs remain the principal method for assessing the correctness of road investments in Polish forests [17,25]. For its relatively low costs, it provides incontestable data on the condition of the studied area, and the quality of execution of road works. Equally important, the method provides a reference for other methods of bearing capacity testing, or for the determination of layer compaction.
The use of the light falling weight deflectometer is increasingly seen as a complement, or even as an alternative, to the static plate load test (PLT). The light falling weight deflectometer (LFWD) [26] is also referred to as the light drop-weight (LDW) [27], light drop-weight tester [28], portable falling weight deflectometer (PFWD) [29], or light weight deflectometer (LWD) [30]. In contrast to the static plate, this device has the following advantages:
  • it is small, and does not require a counterweight;
  • the measurement can be performed in a very short time
  • the results are obtained immediately after the measurement, and are automatically stored in a recorder that works together with the plate, eliminating the risk of errors;
  • the test can be carried out in almost all conditions, e.g., in narrow and deep excavations where it would not be possible to set up a counterweight for the PLT measurement;
  • the large number of results allows not only a more complete inspection of the object, but also for the statistical evaluation of the measurement results.
During the LFWD test, the maximum displacement of the measuring plate caused by the weight falling on it is measured. The values of the displacements and their velocities are recorded, and on this basis, the average values of the plate settlement (deflection of the tested surface) s [mm], the plate settlement velocity v [mm·s−1] and the ratio of these values s/v [ms], as well as the value of the dynamic deformation modulus Evd [MN·m−2], are calculated. Assuming a uniform stress distribution under the loaded plate, the calculations of the dynamic deformation modulus are carried out according to Formula (3).
E vd = 1.5 · r · σ s
where Evd—dynamic modulus of deformation [MN·m−2]; σ—average value of the load under the plate (for a drop weight of 10 kg it is 0.1 MN·m−2); s—average settlement of the compression plate calculated from the results of three impacts (measurements) after three initial impacts [mm]; r—radius of the loading force (150 mm when using a loading plate with 300 mm diameter).
The ratio s/v, which is understood to be the ratio between the settlement value of the loading plate at impact s, and the settlement velocity v, can be interpreted as a measure of compaction [31]. It is assumed that the compaction of the tested layers is sufficient, so long as the value of s/v does not exceed 3.5 ms [32].
There is no doubt that the light falling weight deflectometer is a useful device for testing the stiffness and compaction of aggregates and soils on the road; this has been repeatedly confirmed by numerous scientific studies, e.g., [1,31,33,34,35]. There are a number of publications which aimed at developing and refining LFWD test methods, searching for, and analysing factors that influence measurement results, or attempted to establish correlations between LFWD results and other geotechnical parameters, e.g., [36,37,38,39,40,41,42,43]. Great success has been achieved in comparing LFWD results with the results of the falling weight deflectometer (FWD) [26,29,35,44], dynamic cone penetrometer (DCP) [26,45,46], Benkelman beam [47] or California bearing ratio (CBR) [43,48]. The correlations usually obtained at least good correlations between the measurement results, leading to the interchangeable use of the instruments tested. This offers the opportunity to significantly accelerate and improve the measurement service of ongoing investments.
Unfortunately, there are fewer studies on the relationships between the LFWD and the PLT, and their results have been characterised by greater uncertainty in interpretation (Table 1). Two elements seem to be the main reasons for this. Firstly, the result of a LFWD measurement depends not only on the characteristics of the layer under testing, but also to varying degrees on a number of other factors that relate both to the way the measurement is made, and to the design of the equipment used, i.e., the way the test site is prepared; the number, type and position of the sensors used to measure the displacement of the load plate; the value of the contact stress; the stiffness and the radius of the load plate. Secondly, the development of a clear assessment is complicated as a result of the different standards in use for conducting PLT tests in different countries. The differences include the maximum applied loads, the number of loading and unloading stages of the plate, the loading/unloading times in each stage or the load ranges used to calculate the modulus values, e.g., [22] vs. [49]. Therefore, it is necessary to continue global research, in order to investigate the relationships between LFWDs and PLTs in detail. These should lead to resolutions to applying the two types of devices interchangeably, and the use of LFWD-derived parameter predictions in PLT tests. In addition, the results of such studies should lead to a solid basis for the development of national standards for the use of LFWDs. One area that requires special attention is forest road construction, due to its specificities, and generally weaker regulations than those used for public road construction [1,17].
The aim of the research was to determine the possibility of predicting the value of the primary deformation modulus obtained from PLT measurements with a Zorn light falling weight deflectometer, type ZFG 3000 GPS, with a drop weight of 10 kg. The following research questions were formulated for the current project:
  • Does the use of Zorn’s ZFG 3000 GPS light falling weight deflectometer with a drop weight of 10 kg in bearing capacity tests of forest road surfaces allow for a simple and accurate prediction of the value of the primary deformation modulus?
  • Is the Zorn light falling weight deflectometer ZFG 3000 GPS with a drop weight of 10 kg able to predict the value of the primary deformation modulus, regardless of the type of forest road pavement tested, the use of geosynthetic reinforcement for the road surface, or the bearing capacity of the road subgrade?
  • Does the light falling weight deflectometer Zorn ZFG 3000 GPS with a drop weight of 10 kg achieve consistent prediction of the values of the primary deformation modulus over the entire range of values of the dynamic deformation modulus determined in LFWD bearing capacity measurements of forest road pavements?

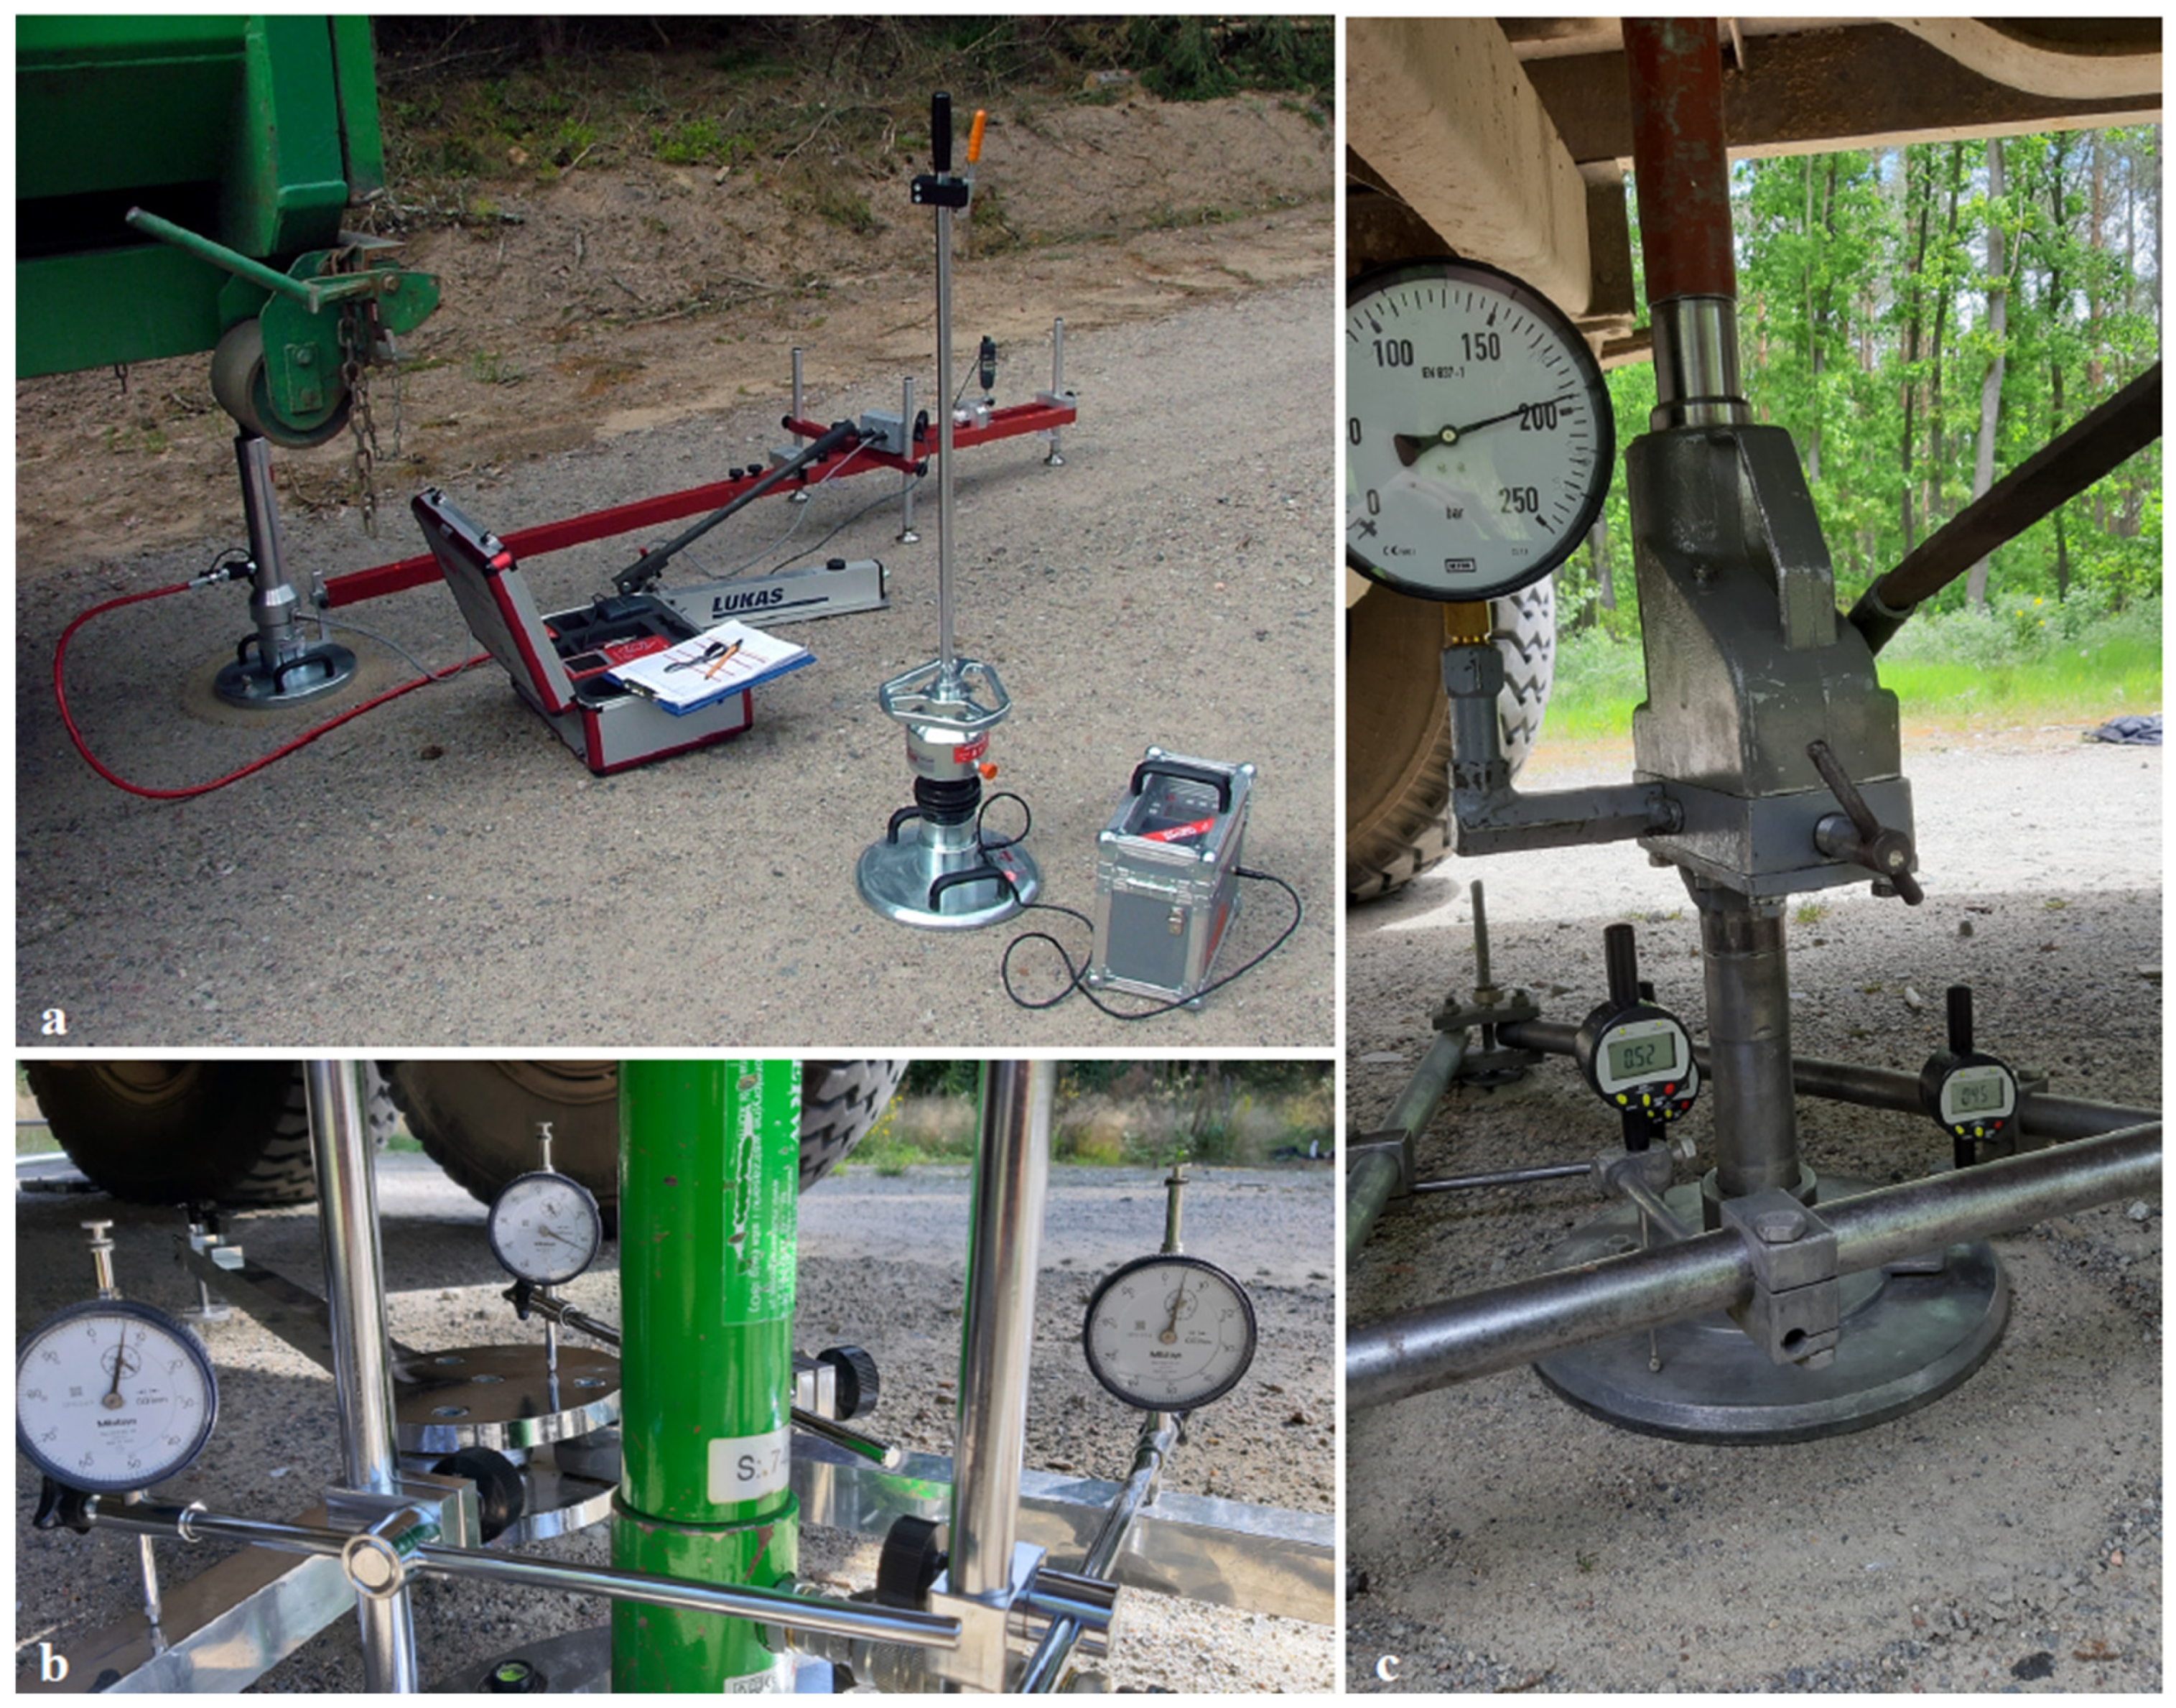
2. Materials and Methods

The values of the dynamic deformation modulus Evd, the s/v ratio and the primary deformation modulus E1 were determined during bearing capacity measurements using a light falling weight deflectometer and static load plates. Over several years, 46 sections of forest roads, with various pavements in western and central Poland, were investigated (Figure 1, Table 2). The bearing capacity measurements were carried out with the following (Figure 2):
  • a light falling weight deflectometer ZFG 3000 GPS, manufactured by Zorn Instruments, with a drop weight of 10 kg and a load plate with a diameter of 300 mm;
  • a static load plate (VSS) HMP PDG Pro, manufactured by Prüfgerätebau GmbH, equipped with 1 electronic displacement sensor and a load plate diameter of 300 mm;
  • a static load plate VSS-3P-000 7408, manufactured by Multiserw-Morek, equipped with 3 analogue displacement sensors and a load plate diameter of 300 mm;
  • a static load plate VSS-3P, equipped with 3 electronic displacement sensors and a load plate diameter of 300 mm.
The tests with static load plates were carried out in the wheel path, in accordance with the applicable Polish standards. Regardless of the type of road pavement, the plates were loaded twice, with a maximum pressure of 0.55 MN·m−2. Based on the obtained measurement results, the E1 values were calculated according to formula (1), assuming that the incremental displacement of the plate Δs corresponded to the pressure difference Δp in the range of 0.25 to 0.35 MN·m−2.
LFWD measurements were performed according to the methodology that was recommended by the plate manufacturer [32], and according to the Road and Bridge Research Institute in Warsaw [39]. The tests with an LFWD in the wheel path were each carried out simultaneously with the measurements with static load plates; the measurement points were placed in close proximity to the PLT points, with a minimum distance of 1.0 m between them.
The structure of the roadway was recorded, and the geotechnical conditions were determined by open excavation of the roadway and geotechnical borings.
The office study included 245 paired Evd (s/v) and E1 values, which were processed so that a PLT result corresponded to the average of at least 3 measurements with an LFWD. No outliers were removed from the database, which refers to the bearing capacity measurements that were carried out in practice. Thus, the data prepared were subjected to a regression analysis in CurveExpert Professional 2.7.3 software (Hyams Development, Chattanooga, TN, USA). In the first stage, a simple regression with one independent variable (i.e., Evd) was used, while in the second stage, a multiple regression with an additional explanatory variable, the s/v ratio, was applied. The modelling that was carried out in the different data groups (Table 2) focused on finding the simplest possible relationships between Evd and E1 that could be used in engineering practice. However, in order to obtain a more comprehensive assessment of the relationship between the parameters studied, not only were linear models tested, but also other models (logarithmic, polynomial, exponential and power models)—with the exception of fourth- and higher-degree polynomials.
Normality of the distribution of the tested variables was assumed for all groups of data that were analysed. Student’s t-test was used to assess the significance of Pearson’s linear correlation coefficient r. The r values (R2) with a corresponding standard error value Se were used as a measure of the goodness of fit for each model.

3. Results

There were statistically significant, moderate or strong correlations (r > 0.40, Table 3) between Evd and E1 values in the vast majority of the analysed variants of the data sets. In the set of all collected load results (A), Evd and E1 correlated moderately (r > 0.40, Table 3, Figure 3), but showed an unsatisfactory model fit (R2 < 0.50), and a significant value for the standard error of the estimate (Se > 49). The resulting very irregular distribution of points in Figure 3 is a consequence of the particular nature of the forest road surfaces tested, and the weakening relationship between the bearing capacity parameters tested as their values increased. In other words, the higher the bearing capacity values (Evd, E1) were, the more they deviated from the simple regression, indicating even a randomness of their location in the upper range. Thus, the strongest correlations were seen in the data sets that were bounded from above, by values of Evd = 60.00, 65.00 and 70.00 MN·m−2, with values of r = 0.80, R2 = 0.64, Se = 17 for the former (Table 3, Figure 4). The assumed value of 60.00 MN·m−2 was below the upper limit of the range of results (70 MN·m−2) considered to be authoritative by the device manufacturer when measurements are performed with a drop weight of 10 kg [32]. In contrast, the weakest relationship between Evd and E1 was recorded for the data set that described the bearing capacity of aggregate pavements in typical macadam design (McA) and optimised natural soil mixtures (Mopt).
Using a regression model other than the linear regression model increased the correlation r and goodness of fit R2 in 14 cases (Table 3). The best effect of using a more complex regression model was expected for the data sets with gravel and all-in aggregate pavements (Mix), pavements made of native soils (GN) and optimised natural soil mixes (Mopt).
A comparison of the E1 values that were obtained during the test (yi) with the predicted values ( y ^ i ) using the best-fit model, is shown in Figure 5. The relative error of the prediction RE according to the linear regression model described by the equation E1 = 0.11 + 1.60Evd and determined by Formula (4) was ±26% (Figure 5).
RE = | y i y ^ i y i | · 100 %
The tests of the linear multivariate regression models did not have the expected effect of increasing the fit of the model to the data collected (Table 4). The addition of a second explanatory variable (s/v) increased the complexity of the regression relationship, but did not significantly increase the r or R2 values, and sometimes had a negative effect on the standard error. The quality of the prediction obviously increased when the data set was analysed for pavements having a layer that was stabilised by hydraulic binder (Stab), and for pavements that were reinforced with geosynthetics (GeoY). The use of a multivariate regression model that is not linear had a stronger effect on increasing the correlation and the degree of model fit than using simple regression models (Table 4).

4. Discussion

The results of this study show that there are some relationships between the values of the dynamic deformation modulus (LFWD) and the primary deformation modulus (PLT). However, in most cases, these are too weak to be used in practice without significant errors occurring. Therefore, previous research results in this area, some of which were very promising, have not been confirmed [26,28,33,50,52,53,54] (Table 1).
A curiosity that needs to be further investigated is the fact that thus far, there is no unambiguity in assessing which modulus (primary or secondary) can be more accurately estimated by the value of the dynamic deformation modulus. Some studies point to E1 [28,39,52,53], while others point to E2 [26,33,39,50,51,54]. Analogous analyses that were performed on the same data set for the secondary deformation modulus showed that Evd was a better estimator for E2 values than for E1 [57].
The potential difficulties of using a light falling weight deflectometer for compliance purposes have been pointed out much earlier, e.g., by Shahid et al. [37] or Kumor et al. [58]. Hildebrand [59], in turn, even suggested that LFWDs should not be used on granular base courses. Later analyses of theoretical mathematical models, and the experience of other researchers, have even questioned the wisdom of aiming for a close relationship between the two testing methods, pointing out that there are too many differences between them [19,60,61]. Among other things, static testing differs from dynamic testing, by the maximum range of loading effects. It is estimated that the range of static testing is almost 37% larger than that of dynamic testing when assessing an unimproved road subgrade (measurements in the range of 0.00–0.25 MN·m−2). When testing an improved subgrade (measurements in the range of 0.00–0.35 MN·m−2), the reported difference is more than 53%, while when testing a road subgrade (measurements in the range of 0.00–0.45 MN·m−2), the differences can be up to 67% [19]. This means that it is not possible to give a simple and unambiguous answer to the question of the magnitude of the PLT effect, since it depends on the type and condition of the soil, as well as on the level of the applied load. At the same time, the above facts indicate that the depth of the PLT effect in load tests on forest roads can extend far below the structural layers of the pavement (down to the road base), which is much less likely when an LFWD is used.
The strong correlations between LFWD and PLT measurements that were shown by some researchers could be due to the relatively thick and homogeneous road embankment layers that were used in the tests [54], or to the solid structural layers of motorways/public roads [50,52]. Strictly controlled laboratory conditions may also play an important role [28,33,39,53]. Forest roads, as well as other roads in the LVR group, are often built as thin structures on variable road substrates, and under different moisture conditions in the vertical and horizontal directions [17,25,62]. In addition, the construction of LVR roads often uses cheaper (inferior) construction materials and a lower quality of road construction, combined with a lower standard of construction supervision (compared to that used for public roads) [1,13].
The described situation leads to modelling that yields relatively high values for the prediction errors, which have their origin in the considerable variability of the PLT results described by both the standard deviation SD and the coefficient of variation Zp (Table 2). Excluding extreme values from the correlation and regression analyses (which are considered measurement errors) would most likely significantly improve the quality of the mathematical models obtained. However, while the exclusion of the highest values did not raise major objections, the rejection of the lowest values—which in practice, are crucial for the final assessment of the quality of road performance—may already raise justified objections.
The weakness of the developed models, as well as their high error values, were also due to the use of PLT measurements, in which much higher pressure plate loads were applied than those used in previous studies (up to 0.55 MN·m−2). In addition, modulus values in the high range of 0.25–0.35 MN·m−2 were calculated. Thus far, no attempts have been made to find a relationship between similar characteristics. Higher PLT loading, to which the complete and relatively thin-layer forest road pavements were subjected, leads to a deeper pressure plate effect, especially for less stiff media (unbound aggregate pavements), which increased the discrepancy between the LFWD and PLT results. One could try to improve the situation using a larger drop weight in the LFWD test, or using a smaller diameter compression plate—according to the author, these would be the most interesting directions for further research in this area.
The goodness of fit of the linear model was significantly increased by limiting the upper limit of the Evd values used in the model, which significantly reduced the standard error, from 49.78 to 16.87 MN·m−2. Obviously, the tested LFWD (with 10 kg drop weight) performed significantly worse when measuring road surfaces with higher bearing capacities.
The introduction of an additional explanatory variable (s/v ratio) in the regression analysis did not significantly increase the prediction quality for the values of the primary strain modulus (Table 3 versus Table 4). Thus, the earlier observations of Sulewska [31] and Sulewska and Bartnik [53], in which the s/v ratio was considered to be a very important parameter for assessing the quality of compaction and bearing capacity, were not confirmed. It is also noted that the tested linear regression models had a slightly lower predictive quality than the parameters of more complex models (logarithmic, polynomial, exponential, power). It seems that the increase in model complexity was disproportionate to the benefits that were derived from its application.
Consequently, the above results justify the discrepancies in the values of the moduli that were obtained with the two methods, and the difficulties in unambiguously assessing the bearing capacity of the embedded layers. The analysed data came from 46 road sections; although grouped among themselves (types and physical states of the soils/aggregates of the pavement and the road subgrade, thicknesses of the construction layers, presence or absence of reinforcement with different types of geosynthetics), they differed so much that it was not possible to determine a universal LFWD–PLT relationship of satisfactory quality for them.
Therefore, it still seems most effective to avoid the risk of error, by establishing a correlation between the dynamic and the static methods under construction conditions (in situ), through carrying out comparative tests each time, for a specific layer system, and for specific soil and water conditions. In other cases, LFWD tests can be used to quickly diagnose geotechnical parameters (correctness of road subgrade preparation, construction of embankments or pavement structure) that are not the basis for engineering acceptance. Until national standards for the use of LFWDs, and the interpretation of the measurement results are developed, their purpose should be to indicate the weakest areas where, in case of doubt, other safe tests can be carried out, e.g., with a static plate.
Less than 4% and 9% of the obtained results of bearing capacity tests on forest roads were below the original value of the primary deformation modulus calculated by reducing the dynamic deformation modulus by 20% and 5%, respectively; this fact can be used for an ad hoc assessment of the quality of the road construction (Figure 6).

5. Conclusions

Based on the analysis of the results of 245 bearing capacity measurements on 46 forest road sections with different pavements, which were carried out with a Zorn light falling weight deflectometer (LFWD), type ZFG 3000 GPS, with a drop weight of 10 kg and static plates (PLT), the following conclusions and generalisations can be formulated:
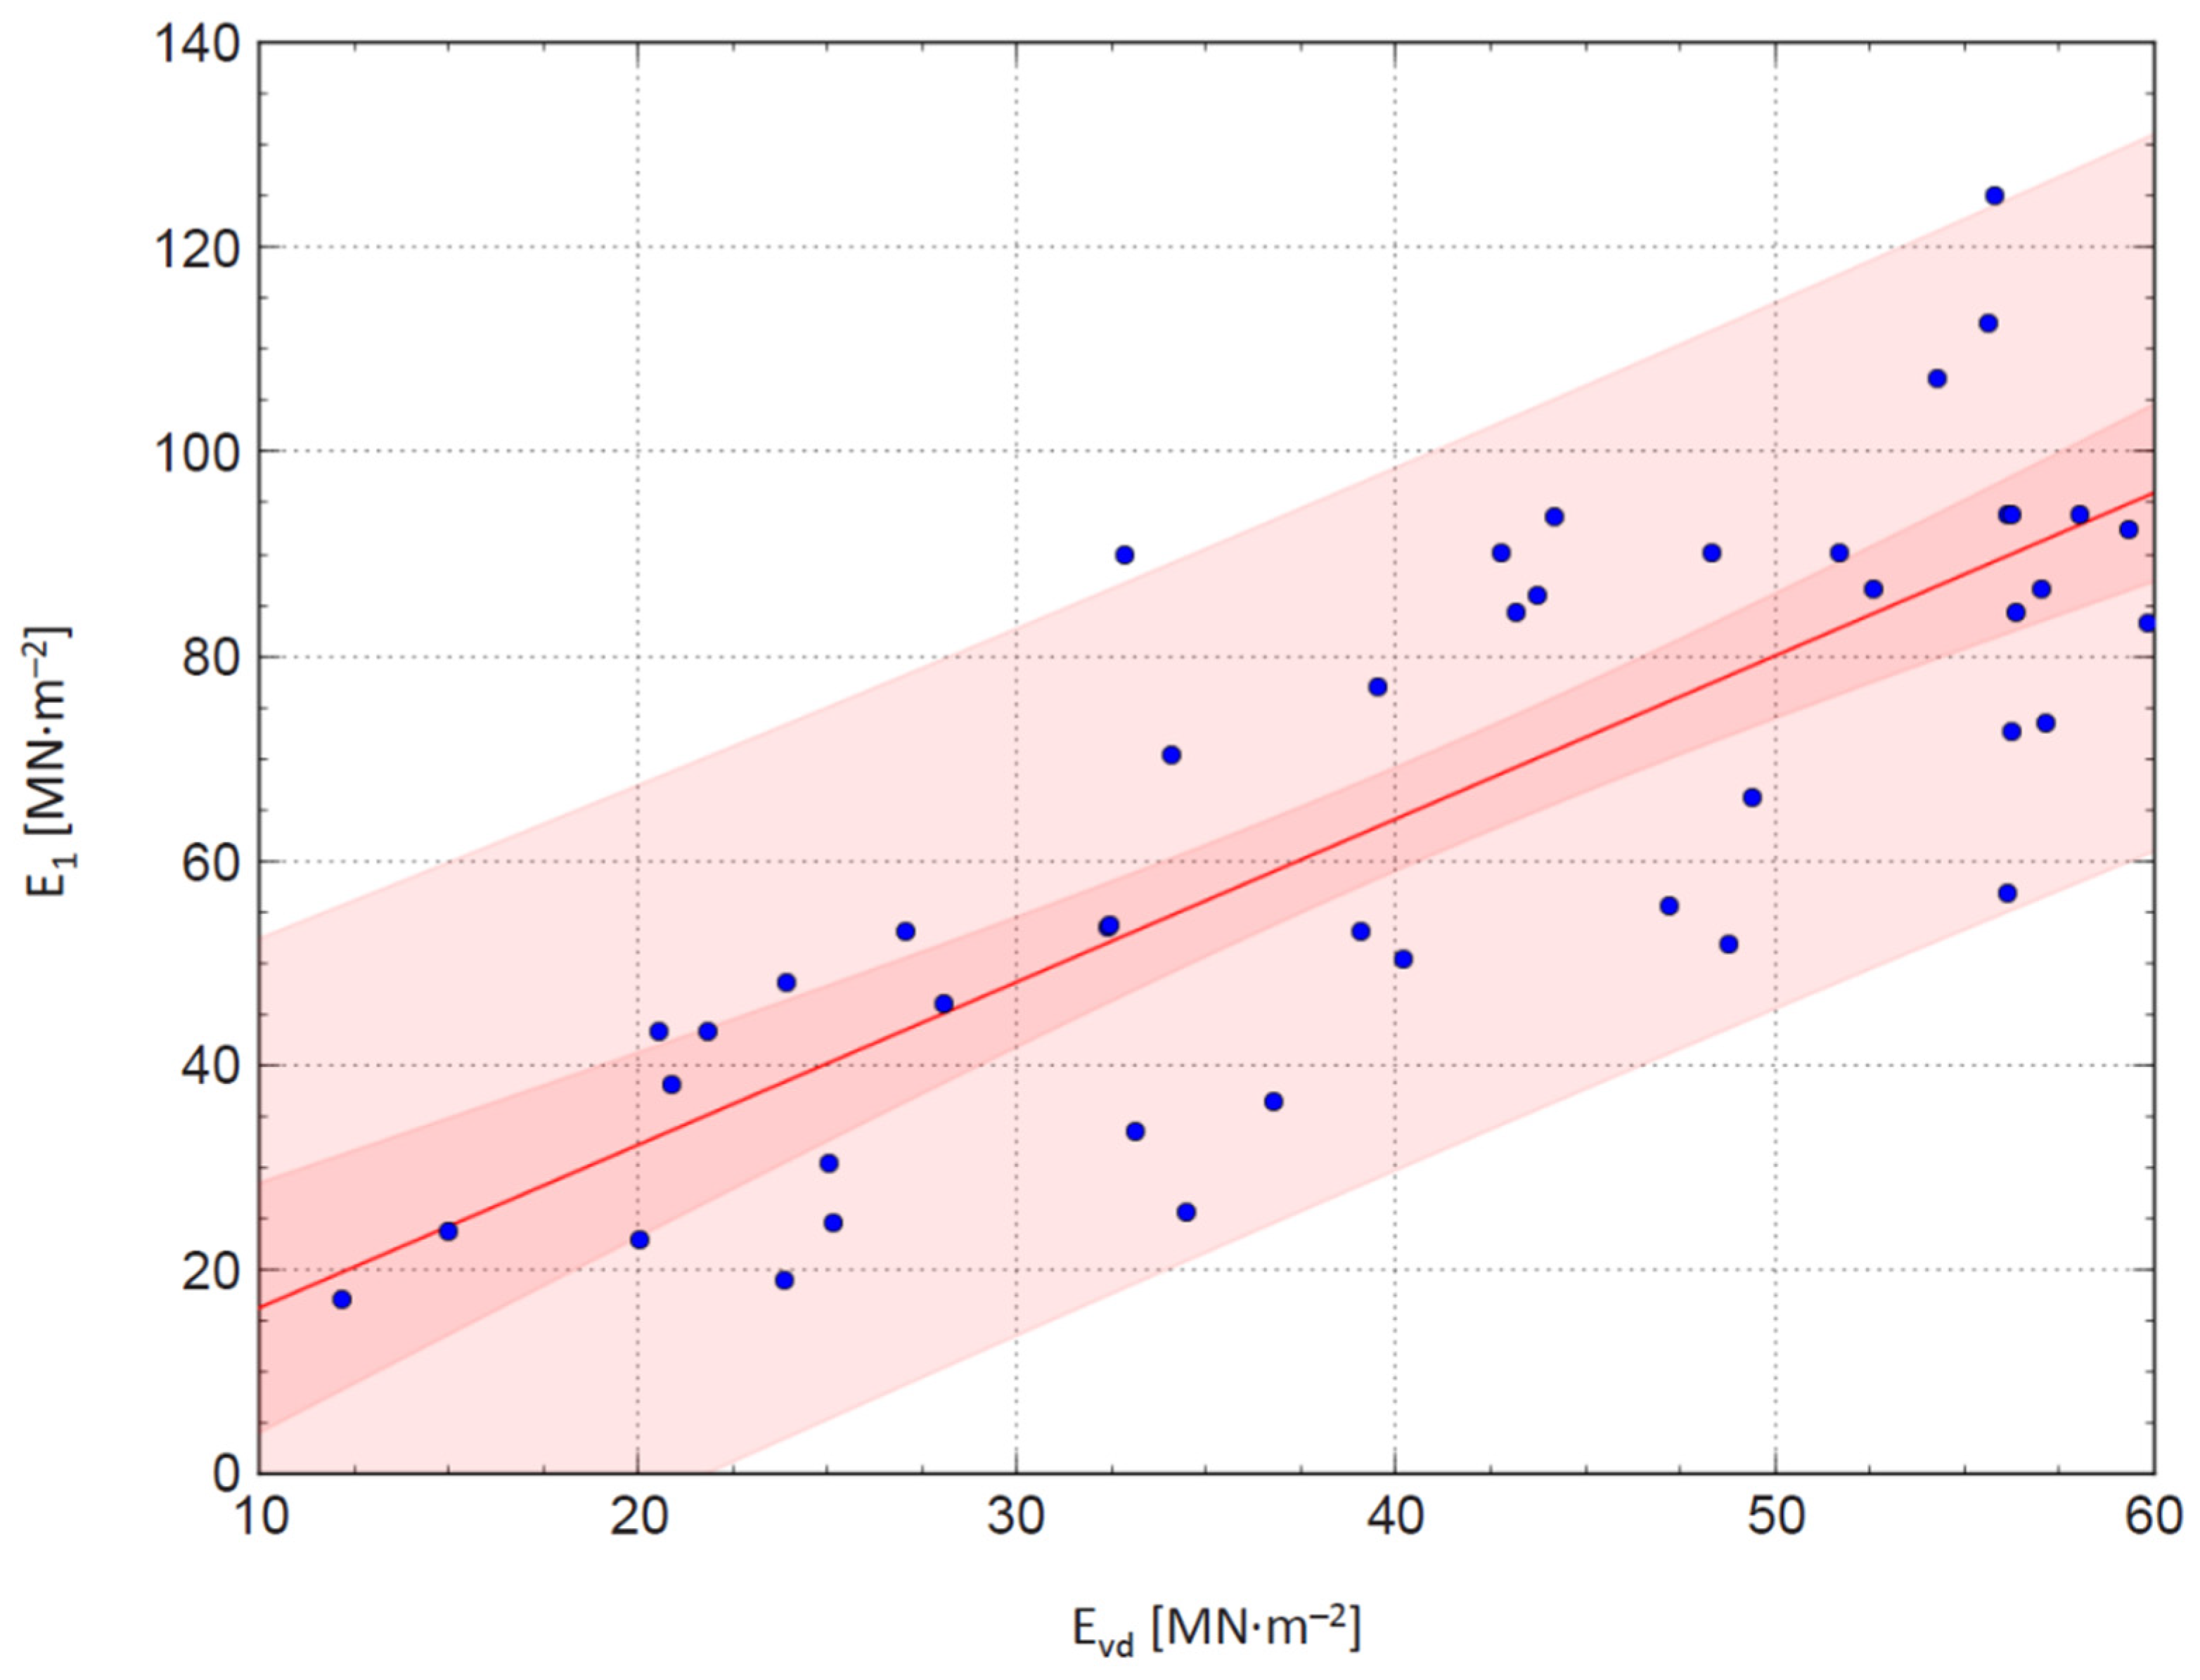
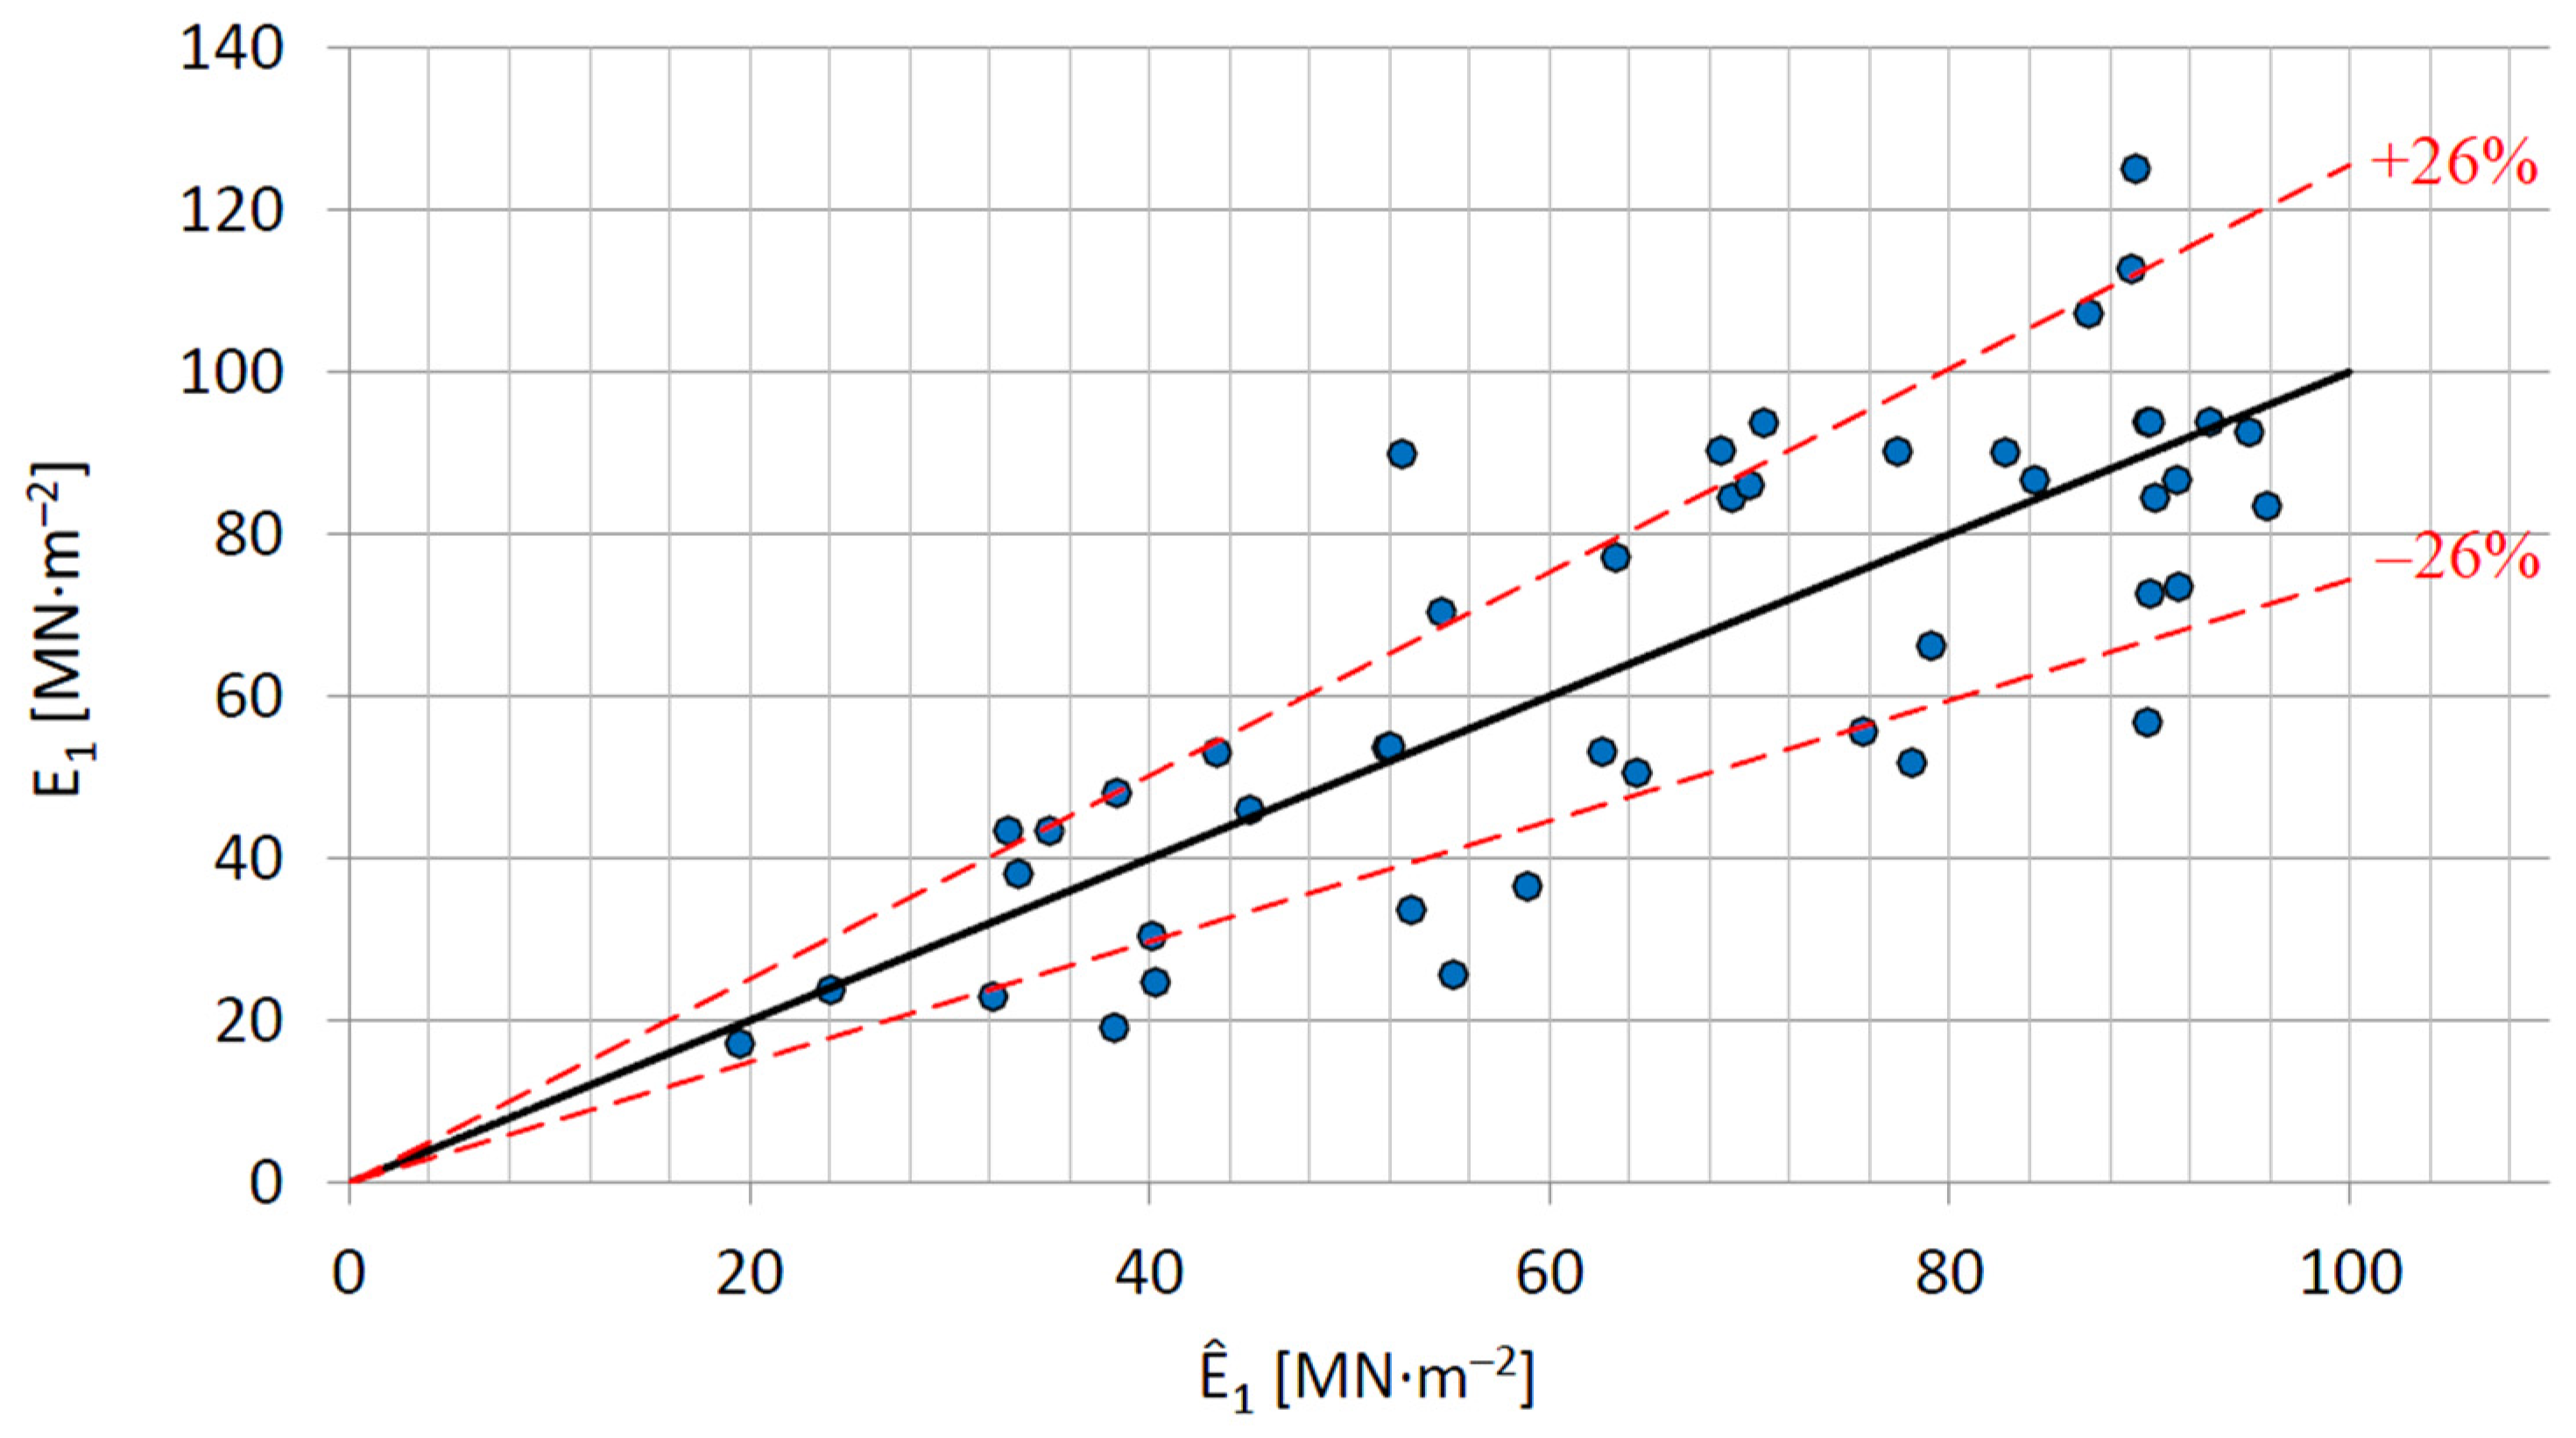
  • A prediction of the value of the primary deformation modulus that is obtained from PLT measurements is possible, based on LFWD measurements. However, it should be noted that while a satisfactory correlation was demonstrated between the values of dynamic deformation modulus Evd and primary deformation modulus E1 (r = 0.64), the fit of the proposed linear model was unsatisfactorily poor (R2 = 0.41), with a correspondingly high value for the standard error (Se = 49.78 MN·m−2). The estimation results were not significantly improved, using more complex non-linear regression models, or using multiple regressions by introducing an additional estimator in the form of the s/v ratio.
  • The quality of the prediction of E1 values was not constant, but varied depending on the type of forest road, the use of geosynthetic reinforcement and the type of road subgrade. A poorer fit of the regression models was obtained for roads with aggregate pavements of typical macadam construction, and with soil-optimised mixes. A similar effect was caused by the presence of all-in aggregate or gravel pavements. It is worth noting that the goodness of fit of the models was lower for pavements that had a higher bearing capacity, which were also characterised by significant variability in the E1 modulus. The quality of the prediction of E1 can be improved by limiting the range of the compared Evd values, even below the threshold values given by the device manufacturer to be the upper limits of validity for the measurements of the tested LFWD. The results showed that the tested device is better suited for measuring forest roads with lower bearing capacities.
  • The lack of possibility to make a precise prediction of the primary modulus value of deformation on the basis of the results of LFWD measurements, does not exclude the possibility of using this device to find the weakest places in the road construction, where tests that use recommended and universally accepted measurement methods (e.g., PLTs) should be performed first.
  • It appears that one of the main reasons for the significant discrepancies that were observed between the results of the LFWD and PLT conducted on forest roads could be the significant difference in the range of influence of the two devices, as known from the literature. Therefore, it is suggested that a light drop weight deflectometer using a higher drop weight should be subjected to similar testing in the near future.
  • Despite the unsatisfactory results of the current study, given the undeniable advantages of using LFWDs, it is advisable to continue the investigation, as the results that were obtained could form the basis for developing much needed national standards for the use of light falling weight deflectometers for rapid bearing capacity and compaction testing of forest road surfaces in the future.

Funding

This publication was co-financed within the framework of the Polish Ministry of Science and Higher Education’s program: “Regional Excellence Initiative”, in the years 2019–2022, project no. 005/RID/2018/19, financing amount 12,000,000.00 PLN.

Data Availability Statement

The data presented in this study are available on request from the corresponding author. The data are not publicly available because the process of their planned scientific analysis has not yet been completed.

Acknowledgments

I would like to thank Karolina Duńska, Rafał Borkowski and Adrian Kasztelan for their valuable assistance with research logistics and field data collection during this study.

Conflicts of Interest

The author declares that there are no conflict of interest.

References

  1. Kaakkurivaara, T.; Vuorimies, N.; Kolisoja, P.; Uusitalo, J. Applicability of portable tools in assessing the bearing capacity of forest roads. Silva Fenn. 2015, 49, 1239. [Google Scholar] [CrossRef] [Green Version]
  2. Keramati, A.; Lu, P.; Sobhani, A.; Esmaeili, S.A.H. Impact of forest road maintenance policies on log transportation cost, routing, and carbon-emission trade-offs: Oregon case study. J. Transp. Eng. Part A Syst. 2020, 146, 04020028. [Google Scholar] [CrossRef]
  3. Laschi, A.; Foderi, S.; Fabiano, F.; Neri, F.; Cambi, M.; Mariotti, B.; Marchi, E. Forest road planning, construction and maintenance to improve forest fire fighting: A review. Croat. J. For. Eng. 2019, 40, 207–219. Available online: https://hrcak.srce.hr/21741106.08.2021 (accessed on 30 March 2021).
  4. Thompson, M.P.; Gannon, B.M.; Caggiano, M.D. Forest roads and operational wildfire response planning. Forests 2021, 12, 110. [Google Scholar] [CrossRef]
  5. Živanović, S.; Zigar, A.; Čipev, J. Forest roads as the key to forest protection against fire. Saf. Eng. 2021, 11, 59–64. [Google Scholar] [CrossRef]
  6. Termansen, M.; Zandersen, M.; McClean, C.J. Spatial substitution patterns in forest recreation. Reg. Sci. Urban Econ. 2008, 38, 81–97. [Google Scholar] [CrossRef]
  7. Termansen, M.; McClean, C.J.; Jensen, F.S. Modelling and mapping spatial heterogeneity in forest recreation services. Ecol. Econ. 2013, 92, 48–57. [Google Scholar] [CrossRef]
  8. Santiago, L.E.; Loomis, J. Recreation benefits of natural area characteristics at the El Yunque National Forest. J. Environ. Plan. Manag. 2009, 52, 535–547. [Google Scholar] [CrossRef]
  9. Olson, L.E.; Squires, J.R.; Roberts, E.K.; Miller, A.D.; Ivan, J.S.; Hebblewhite, M. Modeling large-scale winter recreation terrain selection with implications for recreation management and wildlife. Appl. Geogr. 2017, 86, 66–91. [Google Scholar] [CrossRef]
  10. Uusitalo, J. Introduction to Forest Operations and Technology; JVP Forest Systems Oy: Helsinki, Finland, 2010; pp. 1–287. [Google Scholar]
  11. Demir, M. Impacts, management and functional planning criterion of forest road network system in Turkey. Transp. Res. Part A: Policy Pract. 2007, 41, 56–68. [Google Scholar] [CrossRef]
  12. Bitir, I.; Musat, E.C.; Lunguleasa, A.; Ciobanu, V.D. Monitoring the transport on the Ciobănuș forest road within the Bacău Forestry Department. Recent J. 2021, 1, 10–16. [Google Scholar] [CrossRef]
  13. Coghlan, G.T. Opportunities for low-volume roads. Transportation in the Millennium: State of art and future directions. Transp. Res. Board Natl. Res. Counc. TR News 2000, 205, 1–7. [Google Scholar]
  14. Raport o Stanie Lasów w Polsce; General Directorate of State Forests National Forest Holding: Warsaw, Poland, 2019; pp. 1–181. Available online: https://www.lasy.gov.pl/pl/informacje/publikacje/informacje-statystyczne-i-raporty/raport-o-stanie-lasow/raport-o-lasach-2020.pdf/view (accessed on 6 July 2022).
  15. Grajewski, S.M.; Poznań University of Life Sciences, Poznań, Poland; Majewski, K.; General Directorate of State Forests National Forest Holding, Warsaw, Poland. Personal Communication, 2022.
  16. Grajewski, S.M. Forest road engineering in Poland: Current status and development perspectives. Sylwan 2022, 166, 123–140. [Google Scholar] [CrossRef]
  17. Grajewski, S.M. Functionality of Forest Fire Roads in View of Requirements of Modern Fire Engines and Pumper Trucks and Currently used Forest Firefighting Tactics and Technologies; Poznań University of Life Sciences Publishing House: Poznań, Poland, 2019; pp. 1–226. [Google Scholar]
  18. Mackiewicz, P.; Krawczyk, B. Influence of loading time on subgrade parameters derived from VSS static plate test. Roads Bridges 2015, 14, 19–29. [Google Scholar] [CrossRef]
  19. Węgliński, S. Determination of load action ranges in static and dynamic tests of subgrades by applying rigid plates. Roads Bridges 2018, 17, 73–88. [Google Scholar] [CrossRef]
  20. Czerniak, A.; Grajewski, S.M.; Kurowska, E.E. Bearing capacity standards for forest roads constructed using various technologies from mechanically and chemically stabilised aggregate. Croat. J. For. Eng. 2021, 42, 477–489. [Google Scholar] [CrossRef]
  21. BN-8931-02:1964; Roads for Cars. Determination of Deformation Modulus of Susceptible Pavements and Subgrade by Static Plate Loading. PKNMiJ: Warsaw, Poland, 1964; pp. 1–4.
  22. PN-S-02205:1998; Roads for Cars. Earthworks. Requirements and Tests. PKN: Warsaw, Poland, 1998; pp. 1–30.
  23. Wyroślak, M.; Ossowski, R. Evaluation of deformation moduli in controlled soil embankment based on VSS plate and LFWD plate. Acta Sci. Pol. Archit. 2016, 15, 111–118. [Google Scholar]
  24. Krawczyk, B.; Mackiewicz, P.; Szydło, A. Influence analysis of counterweight type used in static plate test on identified parameters of pavement courses and subgrade. Roads Bridges 2015, 14, 143–157. [Google Scholar] [CrossRef]
  25. Trzciński, G. Analysis of Technical Parameters of Forest Roads in Terms on Timber Haulage by High-Tonnage Vehicles; Warsaw University of Life Sciences Publishing House: Warsaw, Poland, 2011; pp. 1–128. [Google Scholar]
  26. Nazzal, M.D.; Abu-Farsakh, M.Y.; Alshibli, K.; Mohammad, L. Evaluating the light falling weight deflectometer device for in situ measurement of elastic modulus of pavement layers. Transp. Res. Rec. J. Transp. Res. Board 2007, 2016, 13–22. [Google Scholar] [CrossRef]
  27. Livneh, M.; Goldberg, Y. Quality assessment during road formation and foundation construction: Use of falling-weight deflectometer and light drop weight. J. Transp. Res. Board 2001, 1755, 69–77. [Google Scholar] [CrossRef]
  28. Sulewska, M.J. The application of the modern method of embankment compaction control. J. Civ. Eng. Manag. 2004, 10 (Suppl. S1), 45–50. [Google Scholar]
  29. Steinert, B.C.; Humphrey, D.N.; Kestler, M.A. Portable Falling Weight Deflectometer Study; Report No. NETCR52; Department of Civil and Environmental Engineering, University of Maine: Maine, ME, USA, 2005; pp. 1–277. [Google Scholar]
  30. Sabouri, M.; Khabiri, S.; Asgharzadeh, S.M.; Abdollahi, S.F. Investigating the performance of geogrid reinforced unbound layer using light weight deflectometer (LWD). Int. J. Pavement Res. Technol. 2022, 15, 173–183. [Google Scholar] [CrossRef]
  31. Sulewska, M.J. The control of soil compaction degree by means of LFWD. Balt. J. Road Bridge Eng. 2012, 7, 36–41. [Google Scholar] [CrossRef]
  32. Zorn. User Manual for the Light Weight Deflectometer ZFG 3000 GPS in Accordance with the German Technical Test Requirements for Soil and Rocks in Road Construction TP BF–StB Part B 8.3; Merazet: Poznań, Poland, 2014; pp. 1–21. [Google Scholar]
  33. Alshibli, K.A.; Abu-Farsakh, M.; Seyman, E. Laboratory evaluation of the geogauge and light falling weight deflectometer as construction control tools. J. Mater. Civ. Eng. 2005, 17, 560–569. [Google Scholar] [CrossRef]
  34. Fleming, P.R.; Frost, M.W.; Lambert, J.P. Review of the lightweight deflectometer for routine in situ assessment of pavement material stiffness. Transp. Res. Rec. Soil Mech. 2007, 2004, 80–87. [Google Scholar] [CrossRef] [Green Version]
  35. Kestler, M.; Berg, R.; Steinert, B.; Hanek, G.; Truebe, M.; Humprey, D. Determining when to place and remove spring load restrictions on low-cost roads. Transp. Res. Rec. J. Transp. Res. Board 2007, 1989, 219–229. [Google Scholar] [CrossRef]
  36. Rafalski, L. Metoda badania zagęszczenia podtorza za pomocą płyty obciążanej dynamicznie. Pr. IBDiM W Warszawie 1985, 3, 5–29. [Google Scholar]
  37. Shahid, M.A.; Thom, N.H.; Fleming, P.R. In-situ assessment of road foundations. Highw. Transp. 1997, 44, 15–17. [Google Scholar]
  38. Fleming, P.R. Small-scale dynamic devices for the measurement of elastic stiffness modulus on pavement foundations. In Nondestructive Testing of Pavements and Backcalculation of Moduli; Tayabji, S.D., Lukanen, E.O., Eds.; STP 1375; ASTM International: West Conshohocken, PA, USA, 2000; Volume 3, pp. 41–58. [Google Scholar]
  39. Szpikowski, M.; Dreger, M.; Przygoda, M.; Dróżdż, R.; Dąbrowski, M.; Tokarczyk, T.; Har, M.; Mitrut, M.; Żuławnik, P. Badanie i Ustalenie Zależności Korelacyjnych dla Oceny Stanu Zagęszczenia i Nośności Gruntów Niespoistych Płytą Dynamiczną; IBDiM, Laboratorium Geotechniki: Warsaw, Poland, 2005; pp. 1–104. [Google Scholar]
  40. Mooney, M.A.; Miller, P.K. Analysis of lightweight deflectometer test based on in situ stress and strain response. J. Geotech. Geoenvironmental Eng. 2009, 135, 199–208. [Google Scholar] [CrossRef]
  41. Kavussi, A.; Rafiei, K.; Yasrobi, S. Evaluation of PFWD as potential quality control tool of pavement layers. J. Civ. Eng. Manag. 2010, 16, 123–129. [Google Scholar] [CrossRef] [Green Version]
  42. Stamp, D.H.; Mooney, M.A. Influence of lightweight deflectometer characteristics on deflection measurement. Geotech. Test. J. 2013, 36, 216–226. [Google Scholar] [CrossRef] [Green Version]
  43. Kamal, M.; Arshid, M.; Sha, M.; Khan, E. Relationship between dynamic deformation modulus (Evd) and CBR for common and granular materials. Tech. J. 2018, 23, 9–14. Available online: https://tj.uettaxila.edu.pk/index.php/technical-journal/article/view/532 (accessed on 6 July 2022).
  44. Horak, E.; Maina, J.; Guiamba, D.; Hartman, A. Correlation study with the light weight deflectometer in South Africa. In Proceedings of the 27th Annual Southern African Transport Conference (SATC), Partnership for research and progress in Transportation, Pretoria, South Africa, 7–11 July 2008; pp. 304–312. [Google Scholar]
  45. Kongkitkul, W.; Saisawang, T.; Thitithavoranan, P.; Kaewluan, P.; Posribink, T. Correlations between the surface stiffness evaluated by light-weight deflectometer and degree of compaction. Tunn. Undergr. Constr. 2014, GSP 242, 65–75. [Google Scholar] [CrossRef]
  46. Cafiso, S.; D’Agostino, C.; Capace, B.; Motta, E.; Capilleri, P. Comparison of in Situ Devices for the Assessment of Pavement Subgrade Stiffness. In Proceedings of the 1st IMEKO TC-4 International Workshop on Metrology for Geotechnics (MetroGeotechnics 2016), Benevento, Italy, 17–18 March 2016; Available online: https://www.academia.edu/26126280/Comparison_of_in_situ_devices_for_the_assessment_of_pavement_subgrade_stiffness (accessed on 10 August 2022).
  47. Guzzarlapudi, S.D.; Adigopula, V.K.; Kumar, R. Comparative studies of lightweight deflectometer and Benkelman beam deflectometer in low volume roads. J. Traffic Transp. Eng. 2016, 3, 438–447. [Google Scholar] [CrossRef] [Green Version]
  48. Sudarsono, I.; Aisyah, L.; Prakoso, R.N.P. Correlation of modulus elasticity between light weight deflectometer (LWD) and dynamic cone penetrometer (DCP) for subgrade of pavement. J. Phys. Conf. Ser. 2020, 1517, 012030. [Google Scholar] [CrossRef]
  49. DIN 18134:2012-04; Soil: Testing Procedures and Testing Equipment. Plate Load Test. Beuth Verlag: Berlin, Germany, 2012; pp. 1–25. [CrossRef]
  50. Nazzal, M.D.; Abu-Farsakh, M.Y.; Alshibli, K.; Mohammad, L. Evaluating the potential use of a portable LFWD for characterizing pavement layers and subgrades. In Proceedings of the Geotechnical engineering for transportation projects, Geo-Trans 2004, Los Angeles, CA, USA, 27–31 July 2004; ASCE Geotechnical Special Publication: Reston, VA, USA, 2004; Volume 1, pp. 915–924. [Google Scholar] [CrossRef]
  51. Tompai, Z. Conversion between static and dynamic load bearing capacity moduli and introduction of dynamic target values. Period. Polytech. Civ. Eng. 2008, 52, 97–102. [Google Scholar] [CrossRef]
  52. Gorączko, A.; Śmigiel, P.; Topoliński, S. Correlations for compaction parameters of road embankment. Logistyka 2014, 6, 4025–4030. [Google Scholar]
  53. Sulewska, M.J.; Bartnik, G. Application of the light falling weight deflectometer (LFWD) to test aggregate layers on geosynthetic base. Procedia Eng. 2017, 189, 221–226. [Google Scholar] [CrossRef]
  54. Wyroślak, M. Relationship between subgrade parameters obtained from field test of controlled compaction soil. Inżynieria Morska I Geotech. 2017, 1, 21–26. [Google Scholar]
  55. The State Forests in Figures 2018; Graphic design by Fabryka Wyobraźni - www.fabrykawyobrazni.pl; State Forests Information Centre: Warsaw, Poland; pp. 1–64. Available online: https://www.lasy.gov.pl/pl/informacje/publikacje/in-english/the-state-forests-in-figures/the-state-forests-in-figures-2018.pdf (accessed on 18 August 2022).
  56. Katalog Typowych Konstrukcji Nawierzchni Podatnych i Półsztywnych; Załącznik do zarządzenia nr 31 Generalnego Dyrektora Dróg Krajowych i Autostrad z dnia 16.06.2014 r; Generalna Dyrekcja Dróg Krajowych i Autostrad: Warsaw, Poland; pp. 1–112. Available online: https://www.gov.pl/attachment/d7ded9b0-1b73-4c62-b3c5-9eecf20daeef (accessed on 27 July 2022).
  57. Grajewski, S.M. Evaluation of the light falling weight deflectometer for in situ measurement of the secondary deformation modulus of various forest road pavements. Croat. J. For. Eng. 2023; in press. [Google Scholar]
  58. Kumor, M.K.; Farmas, J.; Kumor, Ł.A. The selected correlations of compaction parameters determined by VSS and LWD methods. Bud. I Inżynieria Sr. 2013, 4, 271–279. [Google Scholar]
  59. Hildebrand, G. Comparison of various types of bearing capacity equipment. Nord. Road Transp. Res. 2003, 15, 12–14. [Google Scholar]
  60. Adam, C.; Adam, D.; Kopf, F.; Paulmichl, I. Computational validation of static and dynamic plate load testing. Acta Geotech. 2009, 4, 35–55. [Google Scholar] [CrossRef]
  61. Krawczyk, B.; Mackiewicz, P. Impact of reinforcement layer material and thickness on deflections measured in the static and dynamic plate load tests. Roads Bridges 2016, 15, 87–102. [Google Scholar] [CrossRef]
  62. Grajewski, S.M. Influence of pavement moisture content on the load-bearing capacity of forest road. Infrastruct. Ecol. Rural. Areas 2016, 4, 1451–1462. [Google Scholar] [CrossRef]
Figure 1. Locations of the test road sections on the afforestation map of Poland (adapted from The State Forests in Figures 2018 [55] with permission from State Forests Information Centre, Warsaw, Poland, 2022.
Forests 13 01874 g001
Figure 2. Equipment used for measuring the bearing capacity of forest roads: (a) light falling weight deflectometer Zorn ZFG 3000 GPS (foreground), and static load plate HMP PDG Pro (background); (b) static load plate VSS-3P-000 with 3 analogue displacement sensors; (c) static load plate VSS-3P with 3 electronic displacement sensors (Photos: S.M. Grajewski).
Forests 13 01874 g002
Figure 3. Linear regression for the values of dynamic deformation modulus Evd (LFWD Zorn, type ZFG 3000 GPS, 300 mm diameter loading plate, 10 kg drop weight), and primary deformation modulus E1 (PLT, 300 mm diameter loading plate) for the entire data set included in the study (n = 245, r = 0.64).
Forests 13 01874 g003
Figure 4. Linear regression for the values of dynamic deformation modulus Evd (LFWD Zorn, type ZFG 3000 GPS, 300 mm diameter loading plate, 10 kg drop weight), and primary deformation modulus E1 (PLT, 300 mm diameter loading plate) for the data set that was limited to a maximum value of Evd ≤ 60 MN·m−2 (n = 45, r = 0.80).
Forests 13 01874 g004
Figure 5. Comparison of the values of the deformation modulus after the first loading cycle from the tests (E1) with the predicted values (Ê1) by the proposed linear regression model (Ê1 = 0.11 + 1.60Evd), together with the cones of relative error (RE).
Forests 13 01874 g005
Figure 6. Estimation of the static deformation modulus during primary compression (E1), based on the dynamic deformation modulus (Evd) values according to the following: (a) the proposed linear regression model; (b) and (c) the simplified conversions from Evd to E1, in relation to the bearing capacity measurements that were carried out with a static plate on 245 forest road sections.
Forests 13 01874 g006
Table 1. Selected results of comparative studies of the dynamic deformation modulus Evd (LFWD), and the primary deformation modulus E1 (PLT).
AuthorType of LFWD TestedTest SiteType of Materials TestedResults
Nazzal et al. [50]Prima 100, loading plate with 200 mm diameter, 10 kg drop weightField tests on motorway sectionsPavement layers and subgrades: crushed limestone base, cement-treated base, cement-treated subbase, lime-treated subbase, clayey silt soil, cement-treated soil, lime-treated soil, blended calcium sulfate (BCS)E1 = 22.00 + 0.70Evd
r = 0.96, R2 = 0.92, Se = 36.38
Sulewska [28]ZFG 01, loading plate with 300 mm diameter, 10 kg drop weightLaboratory testsMedium-grained sandEvd = 6.32 + 0.81E1
r = 0.96, R2 = 0.93, Se = 2.74
Alshibli et al. [33]Prima 100, loading plate with 200 mm diameter, 10 kg drop weightLaboratory testsClay, clayey silt, sand, cement-treated soil, crushed limestone, recycled asphalt pavement (RAP), sand-clay-gravel mixE1 = 0.91Evd – 1.81
r = 0.92, R2 = 0.84
Szpikowski et al. [39]ZFG 01 and ZFG 2000, loading plate with 300 mm diameter, 10 kg drop weightField tests on motorway embankments1. Burned colliery shale embankment, 2. non-burned colliery shale embankmentE1* = 0.45Evd + 21.65
r = 0.40, R2 = 0.16, Se = 10.48
E1* = 0.39Evd + 7.68
r = 0.59, R2 = 0.34, Se = 11.30
Szpikowski et al. [39]ZFG 01 and ZFG 2000, loading plate with 300 mm diameter, 10 kg drop weightLaboratory testsAll-in aggregate, medium sandE1* = 0.50Evd + 3.97
r = 0.79, R2 = 0.63, Se = 3.09
E1* = 1.20Evd – 19.87
r = 0.92, R2 = 0.85, Se = 3.67
Nazzal et al. [26]Prima 100, loading plate with 200 mm diameter, 10 kg drop weightLaboratory and field tests on motorway sectionsPavement layers and subgrades: crushed limestone base, cement-treated base, cement-treated subbase, lime-treated subbase, clayey subbase, lime-treated subgrade, sand, blended calcium sulfate (BCS), recycled asphalt pavement (RAP)E1 = 1.04Evd
r = 0.96, R2 = 0.92
E1 = 0.83Evd
r = 0.73, R2 = 0.53
Tompai [51]Loading plate with 300 mm diameter, 10 kg drop weightNot specifiedNot specifiedE1 = 1.04Evd
r = 0.96, R2 = 0.92
Gorączko et al. [52]ZFG 2000, loading plate with 300 mm diameter, 10 kg drop weightField tests on public roadsCrushed stone 0/31.5 mmE1* = 1.11Evd + 13.57
r = 0.88, R2 = 0.78, Se = 9.15
Sulewska and Bartnik [53]ZFG 3000, loading plate with 300 mm diameter, 10 kg drop weightLaboratory testsCrushed stone (dolomite) 0/31.5 mm subgrade composed of layers: a reinforcement in the form of non-woven geotextile was laid on a layer of a weak soil subgradeE1 = 1.17Evd – 3.06
r = 0.92, R2 = 0.84, Se = 2.88
E1 = 0.94Evd – 1.92s/v–13.95
r = 0.94, R2 = 0.88, Se = 2.54
Wyroślak [54]ZFG 2000, loading plate with 300 mm diameter, 10 kg drop weightField tests on embankmentsSand with an admixture of coarse dustEvd = 8.22 E 1 0.43
r = 0.80, R2 = 0.64
* The values were calculated on the basis of data provided by the authors of the publications; Se—standard error.
Table 2. Variants of the data sets that were subjected to the regression analysis, together with their numbers (n), the mean values of the dynamic deformation modulus ( E ¯ vd ) [MN·m−2], the s/v ratio ( s / v ¯ ) [ms] and the primary deformation modulus ( E ¯ 1 ) [MN·m−2].
Classification CriteriaData Group Descriptionn E ¯ vd
(SD, Zp)
s / v ¯
(SD, Zp)
E ¯ 1
(SD, Zp)
Group Symbol
All types of forest roads tested24576.93
(26.6, 35)
2.63
(0.5, 19)
122
(64.6, 53)
A
Type of road pavementForest roads with native soil surface (ungraded dirt road, graded dirt road, improved dirt road pavement)1227.64
(8.7, 32)
3.74
(0.6, 17)
45
(19.3, 43)
GN
Forest roads with gravel or all-in aggregate surface1149.94
(9.7, 19)
2.98
(0.3, 9)
90
(12.1, 13)
Mix
Forest roads with surfaces made of optimal natural soil mixtures1383.06
(8.2, 10)
2.56
(0.1, 2)
163
(33.8, 21)
Mopt
Forest roads with an aggregate surface laid using typical McAdam technology8172.41
(9.2, 13)
2.54
(0.2, 7)
115
(34.2, 30)
McA
Forest roads with an aggregate surface4169.07
(16.3, 24)
2.72
(0.5, 20)
88
(28.3, 32)
CS
Forest roads with surface stabilised by hydraulic binders6093.71
(27.6, 29)
2.30
(0.1, 6)
155
(75.3 49)
Stab
Forest roads with surface made of recycled aggregates (concrete rubble, construction rubble, brick rubble)2795.07
(39.2, 41)
2.86
(0.8, 29)
153
(105.7, 69)
Rec
Geomaterials
reinforcement
Forest roads with surfaces that were not reinforced with geosynthetics17681.98
(28.5, 35)
2.58
(0.5, 21)
131
(71.2, 54)
GeoN
Forest roads with surfaces reinforced with geosynthetics (non-woven geotextiles, woven geotextiles, geogrids, geocells)6964.04
(14.7, 23)
2.76
(0.4, 15)
100
(35.0, 35)
GeoY
Type of subgrade 1Forest roads on G1 subgrade18482.30
(26.9, 33)
2.56
(0.4, 16)
131
(68.8, 52)
G1
Forest roads on G2 subgrade2166.85
(9.4, 14)
2.59
(0.2, 8)
102
(30.0, 29)
G2
Forest roads on G3 and G4 subgrade4057.48
(20.2, 35)
2.98
(0.8, 27)
92
(42.9, 47)
G3/G4
Evd limit value 2Value of dynamic deformation modulus Evd ≤ 60 MN·m−24540.64
(14.1, 35)
3.38
(0.8, 22)
65
(28.0, 43)
≤60
Value of dynamic deformation modulus Evd > 60 MN·m−220085.09
(21.4, 25)
2.46
(0.2, 8)
135
(63.5, 47)
>60
Value of dynamic deformation modulus Evd ≤ 65 MN·m−26046.30
(15.7, 34)
3.16
(0.8, 24)
75
(32.7, 44)
≤65
Value of dynamic deformation modulus Evd > 65 MN·m−218586.86
(21.3, 25)
2.45
(0.2, 8)
138
(64.8, 47)
>65
Value of dynamic deformation modulus Evd ≤ 70 MN·m−28252.04
(16.5, 32)
3.00
(0.7, 24)
84
(36.0, 43)
≤70
Value of dynamic deformation modulus Evd > 70 MN·m−216389.45
(21.4, 24)
2.44
(0.2, 8)
142
(67.2, 47)
>70
Value of dynamic deformation modulus Evd ≤ 75 MN·m−212058.82
(16.6, 28)
2.84
(0.6, 23)
93
(39.1, 42)
≤75
Value of dynamic deformation modulus Evd > 75 MN·m−212594.60
(22.0, 23)
2.43
(0.2, 8)
151
(71.5, 48)
>75
1—Type of road subgrade (CBR—California bearing ratio) G1: CBR ≥ 10%, G2: 5% ≤ CBR < 10%, G3: ≤ 3% CBR < 5%, G4: 2% ≤ CBR < 3% (classification according to [56]). 2—the upper limits of the tested compartments were set at the maximum value considered to be authoritative by the equipment manufacturer, i.e., 70 MN·m−2 [32], plus two smaller values and one larger value at intervals of 5 MN·m−2. SD—standard deviation, Zp—coefficient of variation Zp = (SD · x ¯ 1 ) · 100%.
Table 3. Dependencies of dynamic deformation modulus Evd (LFWD Zorn, type ZFG 3000 GPS, 300 mm diameter load plate, 10 kg drop weight) on primary deformation modulus E1, tested with static load plate—simple regression (E1 = f(Evd)).
Data Group *Form of Linear FunctionLinear Model ParametersBest-Fit Model Parameters
rR2SerR2Se
A E 1 = 2.94 + 1.55 · E v d 0.640.4149.780.640.4149.82
GN E 1 = 5.05 + 1.43 · E v d 0.650.4215.400.860.7411.60
Mix E 1 = 68.39 + 0.43 · E v d 0.340.1211.950.610.3711.46
Mopt E 1 = 255.99 1 , 12 · E v d 0.270.0733.960.440.1935.14
McA E 1 = 54.09 + 0.84 · E v d 0.230.0533.500.330.1132.86
CS E 1 = 22.92 + 0.94 · E v d 0.540.2924.090.560.3224.27
Stab E 1 = 14.44 + 1.50 · E v d 0.550.3063.320.560.3262.64
Rec E 1 = 3.03 + 1.58 · E v d 0.590.3487.310.670.4583.42
GeoN E 1 = 2.22 + 1.57 · E v d 0.630.4055.550.630.4055.56
GeoY E 1 = 24.52 + 1.18 · E v d 0.500.2530.590.590.3429.00
G1 E 1 = 5.88 + 1.53 · E v d 0.600.3655.380.600.3655.37
G2 E 1 = 10.01 + 1.67 · E v d 0.530.2826.190.530.2826.06
G3/G4 E 1 = 1.64 + 1.62 · E v d 0.760.5828.090.800.6426.58
Evd ≤ 60 E 1 = 0.11 + 1.60 · E v d 0.800.6416.870.810.6616.92
Evd > 60 E 1 = 5.59 + 1.52 · E v d 0.510.2654.570.520.2754.50
Evd ≤ 65 E 1 = 1.69 + 1.65 · E v d 0.790.6220.240.790.6220.24
Evd > 65 E 1 = 5.18 + 1.53 · E v d 0.500.2556.210.510.2656.05
Evd ≤ 70 E 1 = 0.98 + 1.63 · E v d 0.750.5624.170.750.5624.32
Evd > 70 E 1 = 4.32 + 1.54 · E v d 0.490.2458.720.510.2658.38
Evd ≤ 75 E 1 = 1.33 + 1.57 · E v d 0.670.4429.240.670.4429.36
Evd > 75 E 1 = 9.48 + 1.49 · E v d 0.460.2163.810.480.2363.51
Description: *—abbreviations are explained in Table 2; r—Pearson’s linear correlation coefficient (statistically significant values at p = 0.05 are in bold); R2—coefficient of determination; Se—standard error.
Table 4. Dependencies of dynamic deformation modulus Evd and ratio s/v (LFWD Zorn, type ZFG 3000 GPS, 300 mm diameter load plate, 10 kg drop weight) on primary deformation modulus E1, tested with static load plate—complex regression (E1 = f(Evd, s/v)).
Data Group *Form of Linear FunctionLinear Model ParametersBest-Fit Model Parameters
rR2SerR2Se
A E 1 = 28.10 + 1.47 · E v d 7.13 · s / v 0.640.4149.790.670.4448.49
GN E 1 = 23.66 + 1.76 · E v d + 5.25 · s / v 0.650.4316.120.920.8517.60
Mix E 1 = 58.19 + 0.49 · E v d + 2.44 · s / v 0.340.1212.670.990.984.99
Mopt E 1 = 65.76 0.95 · E v d + 119.67 · s / v 0.330.1135.000.990.9710.86
McA E 1 = 144.44 + 0.66 · E v d 30.38 · s / v 0.280.0833.260.420.1832.89
CS E 1 = 9.51 + 1.01 · E v d + 3.04 · s / v 0.540.2924.380.620.3925.15
Stab E 1 = 399.21 + 1.37 · E v d 161.86 · s / v 0.620.3860.180.700.4958.44
Rec E 1 = 42.67 + 1.44 · E v d 9.14 · s / v 0.590.3588.950.700.4992.92
GeoN E 1 = 20.84 + 1.51 · E v d 5.37 · s / v 0.630.4055.660.660.4453.91
GeoY E 1 = 164.48 + 0.45 · E v d 33.71 · s / v 0.560.3229.390.630.3929.23
G1 E 1 = 35.17 + 1.45 · E v d 8.99 · s / v 0.600.3655.450.630.4053.66
G2 E 1 = 23.85 + 1.53 · E v d 9.48 · s / v 0.530.2826.860.810.6523.93
G3/G4 E 1 = 35.41 + 1.37 · E v d 7.61 · s / v 0.770.5928.240.800.6429.22
Evd ≤ 60 E 1 = 8.76 + 1.52 · E v d 1.69 · s / v 0.800.6517.050.810.6618.32
Evd > 60 E 1 = 78.30 + 1.48 · E v d 28.05 · s / v 0.520.2754.430.560.3153.09
Evd ≤ 65 E 1 = 7.72 + 1.57 · E v d 1.86 · s / v 0.790.6220.410.800.6420.15
Evd > 65 E 1 = 76.40 + 1.49 · E v d 27.59 · s / v 0.510.2656.080.550.3054.67
Evd ≤ 70 E 1 = 6.51 + 1.58 · E v d 1.52 · s / v 0.750.5624.320.750.5725.20
Evd > 70 E 1 = 94.13 + 1.50 · E v d 35.41 · s / v 0.500.2558.500.540.3057.98
Evd ≤ 75 E 1 = 38.44 + 1.31 · E v d 7.81 · s / v 0.670.4529.240.680.4629.05
Evd > 75 E 1 = 81.13 + 1.48 · E v d 28.99 · s / v 0.470.2263.830.530.2863.00
Description: *—abbreviations are explained in Table 2; r—Pearson’s linear correlation coefficient (statistically significant values at p = 0.05 are in bold); R2—coefficient of determination; Se—standard error.
Publisher’s Note: MDPI stays neutral with regard to jurisdictional claims in published maps and institutional affiliations.

