Article

Effects of Drying and Rewetting Cycles on Carbon Dioxide Emissions and Soil Microbial Communities

Institute of Grassland, Flowers and Ecology, Beijing Academy of Agriculture and Forestry Sciences, Beijing 100097, China
*
Author to whom correspondence should be addressed.
These authors have contributed equally to this work.
Forests 2022, 13(11), 1916; https://doi.org/10.3390/f13111916
Submission received: 10 September 2022 / Revised: 9 November 2022 / Accepted: 12 November 2022 / Published: 15 November 2022
(This article belongs to the Special Issue Soil Carbon Storage in Forests: Mechanisms, Dynamics, and Management)

Abstract

:
Extreme rainfall and drought events attributed to climate change are anticipated to occur in the current century, resulting in frequent drying and rewetting cycles (DWCs) in soils, which will, in turn, influence soil properties and microorganisms. Sample plots of Sophora japonica, Pinus tabulaeformis, and Ginkgo biloba were selected, and undisturbed soil columns were collected. CK was the constant drying treatment; the precipitation intensities of R80, R40, and R20 were 80 mm, 40 mm, and 20 mm, respectively, and the total precipitation for the four treatments was 160 mm. Significant differences were observed in the cumulative CO2 emissions among the various DWC frequencies for the same woodland soils. A significant correlation was observed between the Birch effect and the DWC frequencies of the three woodland soils. A Pearson’s correlation analysis revealed that background nutrient contents were the key factors influencing alpha diversity. In conclusion, DWCs generally increased CO2 fluxes, cumulative CO2 emissions, and the Birch effect in addition to decreasing the alpha diversity of soil microorganisms when compared to those in the constant drying treatment.

1. Introduction

Terrestrial ecosystems store large quantities of carbon in living plants, dry branches, fallen leaves, and soil organic matter (SOM). A release of the stored carbon into the atmosphere as greenhouse gases, such as carbon dioxide (CO2) and methane, can have far-reaching impacts on the environment. Climate change effects, including extreme precipitation, drought, heat, and cold, have been occurring more frequently in recent years [1,2]. Previous studies have revealed that terrestrial ecosystems could provide positive and amplifying feedback to climate change at a global scale [3,4,5]. Significant variations have been observed in the impacts of climate extremes on the terrestrial carbon cycle, and such climate extremes tend to reduce the potential of carbon sinks in terrestrial ecosystems, which may cause them to shift to carbon sources [6,7,8]. Soils in terrestrial ecosystems often experience drought periods followed by rapid rewetting periods and then repeated drying and rewetting. The drying and rewetting events are anticipated to occur more frequently in summer [9,10,11]. Consequently, the effects of drying and rewetting cycles (DWCs) on soil carbon and nitrogen cycles, mineralization [12,13,14], soil microbial activity [5,15], and soil microbial community composition [5,16,17,18] have attracted considerable attention.
In the arid and semi-arid regions of China, soil water is a vital factor that influences the carbon cycle, and soil carbon mineralization rates in soils under constant wetting treatments are significantly higher than those in soils under constant drying treatments [19]. According to the findings of an experiment conducted in a Norway spruce forest, DWCs reduced carbon mineralization when compared to soils under constant wetting treatments, and the total reduction in DWCs increased with drought intensity [11]. Studies conducted in the Sudano-Sahelian regions have also revealed that DWCs did not increase soil carbon mineralization when compared to the constant wetting treatments [20]. Therefore, carbon mineralization rates in different woodland soils can be considerably influenced by DWCs, and the rates are mostly low in soils under constant drying treatments and high in soils under constant wetting treatments.
Soil respiration is caused by organic carbon mineralization in soils, and the soil moisture status can influence soil respiration or modify the response of soil respiration to temperature, thereby resulting in the changes in CO2 concentration and fluxes [21,22]. Previous studies have revealed that DWCs can induce both direct and legacy effects on soil respiration, and the effects vary with drought intensity and forest type [23]. DWCs substantially modulate rhizosphere respiration and SOM decomposition in soils with sunflower and soybean cover, and the degree of impact depends on the soil drying intensity and plant growth performance [24]. The rewetting of dry soils usually results in a pulse of carbon mineralization or soil respiration pulses, known as the “Birch effect” [25,26]. The Birch effect can be induced by rapid changes in microbial biomass [27] and the activation of extracellular enzymes [28]. The responses of soil enzyme activities to DWCs in forests, farmlands, grasslands, and desert ecosystems are similar; however, the soil microbial biomass and community composition in forest soils are generally more resistant to DWCs than those in desert soils, indicating that soil microbial communities in arid ecosystems are readily influenced by precipitation patterns [29,30,31]. In addition, the responses of extracellular enzyme activities to DWCs are independent of microbial community composition [32].
The intensity, frequency, and timing of precipitation considerably influence carbon fluxes in grassland ecosystems during the growing season, with carbon fluxes and assimilation increasing with an increase in precipitation intensity [33]. The carbon turnover in northern China grasslands increases considerably with drying intensity, but the opposite is true for microbial biomass carbon (MBC) [34]. Frequent DWCs in arable calcareous loam soils decrease soil MBC and increase cumulative CO2-C evolution; however, the rate of cumulative CO2-C evolution decreases with an increase in DWCs [12]. The dynamics of MBC can be substantially influenced by DWCs, although the degree of influence varies in soils with oak and grass cover, with rewetting effects being greater in soils with oak cover than in soils with grass cover [35]. DWCs have also been reported to increase microbial activity and microbial substrate availability in soils subjected to alternate partial root-zone irrigation when compared to deficit or full irrigation [36,37].
Furthermore, historical drought can reduce the sensitivity of microbial communities to changes in soil water content [38,39]. Microbial communities can adapt to changing climate conditions, which may decrease the rate of soil organic carbon (SOC) loss as a result of future cyclic droughts [40]. To understand how soil microbes respond to DWC events, ribosomal RNA (rRNA) gene transcripts have been sequenced, and the results have demonstrated that Proteobacteria, Actinobacteria, and Acidobacteria are the microbial phyla that are most responsive to variations in water content as well as that the ability of microbial taxa to recover from drought stress facilitates the maintenance of microbial biodiversity under extreme events [41].
Based on the previous research findings, we can conclude that the effects of DWCs on soil nutrient cycling and microbial communities are influenced by plant species and their growth performance, soil status and texture (background conditions), soil layers, seasons, ambient temperature and moisture, DWC frequency, drying and rewetting intensities during DWC, and experiment duration. Few studies have investigated CO2 fluxes, soil microbial community compositions, and microbial diversity in various types of woodland soils under different DWC frequencies. In addition, studies regarding correlations among soil properties, MBC, microbial biomass nitrogen (MBN), and predominant genera and phyla are insufficient. Therefore, in the present study, we investigated the soil properties, CO2 fluxes, and microbial communities in three woodland soils under Sophora japonica, Pinus tabulaeformis, and Ginkgo biloba that were exposed to four gradients of DWC frequencies (0, 2, 4, and 8 DWCs). The objectives of the present study were to (1) analyze the soil depth, species, and interaction effects on soil properties; (2) identify the changes in CO2 fluxes, cumulative CO2 emissions, and the Birch effect among the three woodland soils under various DWC frequencies; (3) determine the soil microbial diversity and community compositions at the phylum and genus levels among the various treatments; and (4) explore correlations among the soil properties, MBC, MBN, and predominant phyla and genera in the surface soil layer (0–10 cm).

2. Materials and Methods

2.1. Sample Collection and Site Description

Soil columns and samples were collected at the Xiaotangshan experimental site, Beijing Academy of Agriculture and Forestry Sciences, which is located in the northwestern part of the North China Plain (40°18′ N and 116°46′ E). Laboratory culture experiments were conducted in a greenhouse at the Beijing Academy of Agriculture and Forestry Sciences. The area belongs to a warm temperature zone with a continental monsoon climate, a mean annual precipitation of approximately 600 mm, and a mean annual temperature of approximately 10–12 °C. Seventy to eighty percent of the precipitation occurs during summer, mainly from June to August. Only 10% of the precipitation occurs during spring and winter. The monthly mean temperature ranges from −7 °C to −4 °C in January and from 25 °C to 29 °C in July. The minimum and maximum temperatures under extreme weather conditions are −27.4 °C and 42 °C, respectively. These data were extracted from the Daily Value Data Set of Surface Climatic Data (1951–2011).
In the present study, Sophora japonica (mean tree height and diameter at breast height were 10.72 m and 54 cm, respectively), Pinus tabulaeformis (mean tree height and diameter at breast height were 4.85 m and 44.35 cm, respectively), and Ginkgo biloba (mean tree height and diameter at breast height were 6.53 m and 31.1 cm, respectively), the dominant afforestation and gardening tree species in northern China [42], were selected as the research objects, and they were all planted in 2012. First, 12 sampling sites for each tree species were identified and marked. Soil columns were collected from the sampling sites using cylindrical polyvinyl chloride (PVC) pipes (20 cm in diameter and 40 cm high). Subsequently, all litter layers, including stone particles and impurities were removed from the surface soil layers at the sampling sites. The PVC pipes were vertically driven into the soil using a hammer until only 10 cm of the PVC pipe remained exposed above the soil surface, which implied that the length of the soil columns was 30 cm. Thereafter, PVC pipes containing 30 cm soil columns were lifted from the pits, and the soil columns were then removed from the bottoms of the PVC pipes with a shovel. The bottom parts of the PVC pipes with soil columns were covered with PVC caps to prevent soil loss. A total of 36 soil columns were collected from the sampling sites with the three tree species and immediately transported for storage in the greenhouse.
Furthermore, three additional sampling sites under each tree species were identified, and soil samples were collected using cutting rings (100 cm3). Soil samples at each sampling site were collected at 0–10 cm, 10–20 cm, and 20–30 cm depths, and three replicate soil samples in each soil layer were thoroughly mixed. Finally, two sets of soil samples under each tree species cover were obtained, and the same soil sampling strategy was repeated twice. Soil samples were immediately transported to the laboratory, where one set of soil samples was dried naturally and used to determine the soil physicochemical properties, while the other set of soil samples was stored at 4 °C for the subsequent determination of soil MBC and MBN.

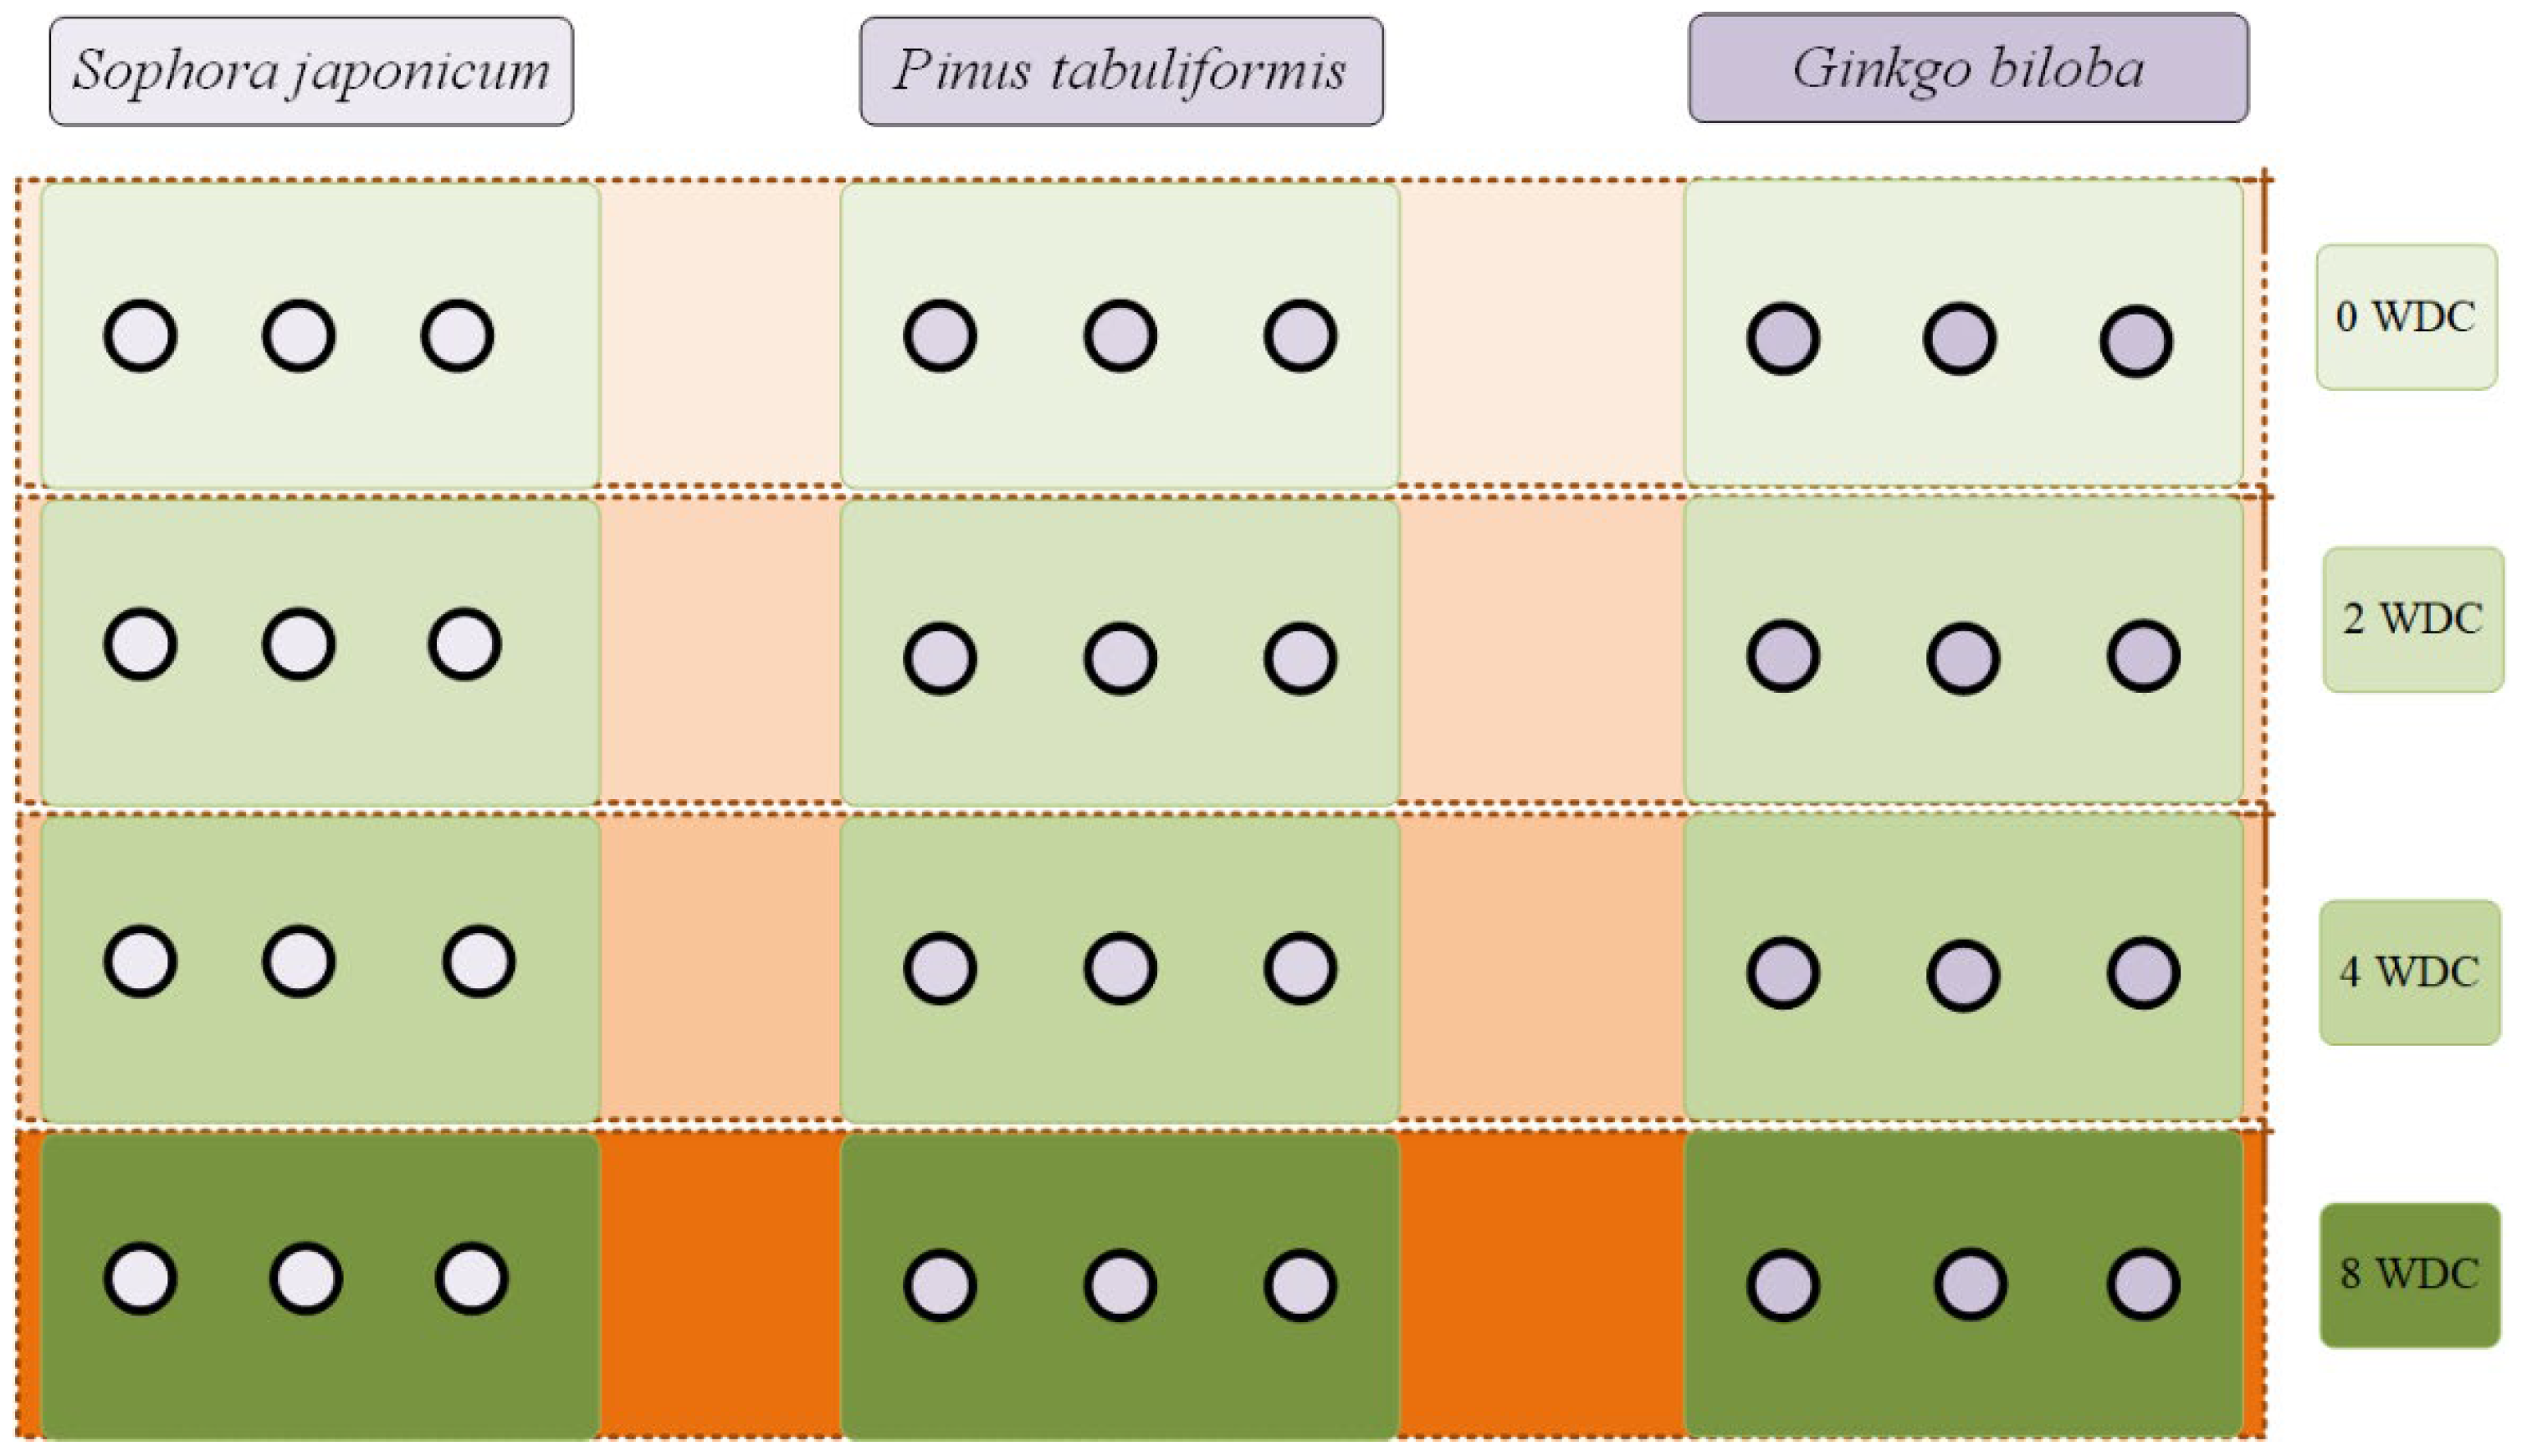
2.2. Experimental Design

The experiment was conducted in June 2020 in a greenhouse at the Beijing Academy of Agriculture and Forestry Sciences. To restore the soil biochemical properties and facilitate adaptation to greenhouse conditions, the undisturbed soil columns were stored in a greenhouse maintained at 25 °C for 10 days before using them for further analyses. The initial CO2 emissions were measured and recorded before applying the treatments, and the initial soil samples (0–10 cm layer) were obtained and stored in an ultra-low-temperature freezer.
Based on the intensity and frequency of summer precipitation events over the last three years, extreme rainfall is expected to occur in the future coupled with DWC events. A complete DWC consists of a drying period and a wetting period, with low evaporation rates being observed indoors when compared to those in the field. Therefore, we used four DWC frequencies, with each frequency consisting of three soil columns (Figure 1). The 12 undisturbed soil columns for each tree species were evenly divided into four groups, with each group having three soil columns (Figure 1). Detailed information, including the amount of precipitation for each cycle, the precipitation period, the drought period, the total amount of precipitation, and the experimental duration, is listed in Table 1.
Afterward, soil samples from the 0–10 cm soil layer under the frequencies of 0, 2, 4, and 8 DWCs were collected and labeled as CK (constant drying treatment), R80, R40, and R20, respectively, based on the amount of precipitation for each cycle. The initial soil samples, which were collected before the beginning of the experiments and stored in an ultra-low-temperature freezer were labeled as CS. A total of five groups of soil samples from the 0–10 cm soil layer were collected and stored in an ultra-low-temperature freezer for the high-throughput sequencing of microbial communities.

2.3. Determination of Soil Physicochemical Properties and Microbial Biomass Carbon and Nitrogen

The soil pH was measured using a pH meter (Thermo Fisher Scientific Inc., Waltham, MA, USA) in soil–water solutions mixed at a ratio of 1:5 (dry soil/water). The soil particle size distribution was determined using a laser particle size analyzer (Microtrac S3500; Microtrac Inc., Largo, FL, USA). The bulk density (BD) was calculated based on the weight of dry soil in the cutting ring and the volume of the cutting ring. The soil total carbon (TC) was determined by volumetric and heating methods using potassium dichromate, whereas the soil total nitrogen (TN) was determined using the semi-micro Kjeldahl method [43]. The MBC and MBN were determined using the chloroform fumigation extraction method [44].

2.4. Determination of Soil CO2 Fluxes

CO2 fluxes were measured using an automatic portable soil CO2 flux system (PS-3010, ABB Bomem, Quebec, QC, Canada), which can regulate the measurement process and store and monitor data. Variations in CO2 concentrations in the respiratory chamber during the experiment were measured and read in real time by an ultraportable greenhouse gas analyzer. Moreover, the analyzer was equipped with a self-controlled sensor for monitoring data, such as the air temperature, atmospheric pressure, and soil temperature, which were used to calculate the CO2 emission fluxes.
The formula used to calculate closed-circuit fluxes was as follows:
Fi = 10 V P 0 ( 1 W 0 1000 ) R S ( T 0 + 273.15 )   ×   t
Fi—the flux of measured gas in soil within time i (μmol/(m2·s)).
W0—the initial vapor concentration in the air chamber (mmol/mol).
P0—the initial pressure in the air chamber (kPa).
T0—the initial air temperature in the air chamber (°C).
S—the measured soil area (cm2).
V—the total volume of the internal system (cm3).
R—the universal gas constant (8.314 Pa·m3/(k·mol)).
t —the emission rate of measured dry air after water correction (1/μmol·s).
Cumulative CO2 emission flux was calculated using the following formula [45]:
C i + 1 = F i + F i + 1 2 × ( t i + 1 t i ) + C i
Ci—cumulative CO2 emission flux within time i.
Fi—CO2 emission flux within time i.
ti—time of the ith gas collection.
If i = 0, then Fi and Ci are equal to 0.
The Birch effect caused by DWCs was calculated based on the maximum soil CO2 emission rates before and after rewetting using the following formula:
Birch effect intensity = (CO2-postCO2-pre)/(CO2-pre)
CO2-pre and CO2-post refer to the maximum soil CO2 emission rates before and after rewetting, respectively.

2.5. DNA Extraction and High-Throughput Sequencing of Soil Microorganisms

The 16S rRNA high-throughput sequencing was performed by LC-Bio Technologies Co., Ltd. (Hangzhou, China). Genomic DNA was extracted from soil microorganisms using the E.Z.N.A. Soil DNA Kit (Omega Bio-Tek Inc., Norcross, GA, USA). Subsequently, the quality of the extracted DNA was evaluated by 2% agarose gel electrophoresis, and the DNA was quantified using an ultraviolet spectrophotometer. The hypervariable region (V3+V4) of the bacterial 16S rRNA was amplified using the 338F (5′-ACTCCTACGGGAGGCAGCAG-3′) and 806R (5′-GGACTACHVGGGTWTCTAAT-3′) primers. The amplified PCR products were analyzed by 2% agarose gel electrophoresis. Afterward, the target fragments were recycled using an AxyPrep Mag PCR Cleanup Kit (Appleton Woods Ltd., Birmingham, UK). The recycled products were quantified by fluorescence using a Quant-iT PicoGreen dsDNA Assay Kit (Thermo Fisher Scientific, Waltham, MA, USA), and the qualified library concentration was > 2 nM. The qualified sequencing libraries were gradient-diluted (the index sequence could not be repeated) and then deformed as a single strand using sodium hydroxide for high-throughput sequencing. A MiSeq sequencer and a MiSeq reagent kit (Illumina, San Diego, CA, USA) were used for 2 × 300 bp double-end sequencing.
The obtained sequences were merged using FLASH v1.2.8 due to the overlapping relationship between the double-end sequences [46]. A barcode (introduced for library construction) and a primer sequence were deleted from the sequence, and the chimera was filtered using Vsearch v2.3.4 [47]. The alpha diversity indices of the microbial communities analyzed in the present study include the Shannon, Simpson, Chao1, and observed species indices [48].

2.6. Statistical Analyses

The preliminary collation and analysis of the initial data were conducted in MS Excel 2016 (Microsoft Corp., Redmond, WA, USA). A one-way analysis of variance (ANOVA), a two-way ANOVA, a regression analysis, and a correlation analysis were performed using R.4.2.1 (https://www.r-project.org, accessed on 10 October 2022), IBM SPSS Statistics for Windows v25.0 (IBM Corp., Armonk, NY, USA), and OriginPro 2019 (OriginLab Corporation, Northampton, MA, USA). All figures were obtained using Origin 2019, Python, and R 4.2.1 (https://www.r-project.org, accessed on 10 October 2022). The experimental results are represented as means ± standard deviations.

3. Results

3.1. Soil Physicochemical Properties and Microbial Biomass Carbon and Nitrogen

A two-way ANOVA was used to analyze the interactive effects of the soil layers and species on seven physicochemical properties of soils, including the pH, BD, carbon-to-nitrogen ratio (TC/TN), clay proportions, MBC, MBN, and MBN/TN. The results indicated that the interaction between soil layers and species had a significant effect on pH (F = 3.54, p < 0.05) among the seven physicochemical properties.
The one-way ANOVA results of soil layers and species on the seven soil physicochemical properties are presented in Table 2.
No significant differences were observed in pH within the same soil layers under the three tree species, and no significant differences were observed in pH between the soil layers in soils planted with S. japonica and G. biloba. However, the pH values decreased with an increase in the soil layer in plots with P. tabulaeformis, with the pH value of the first soil layer (0–10 cm) being significantly higher than that of the third soil layer (20–30 cm) (p < 0.05). The pH values ranged from 7.50 to 7.71, which indicated that the soils were alkalescent.
The BD values of the first soil layers (0–10 cm) of the three tree species were in the order of S. japonica > P. tabulaeformis > G. biloba. The BD value of S. japonica in the first soil layer (0–10 cm) (p < 0.05) was significantly higher than that under G. biloba; however, no significant differences were observed in the other soil layers among the three tree species covers. Overall, the BD values for soils under the three tree species covers increased with an increase in the soil layer, with significant differences (p < 0.05) being observed in soil layers under P. tabulaeformis and G. biloba. However, no significant differences were observed in the BD values of the soil layers under S. japonica.
With regard to the TC/TN ratios, no significant differences were observed in soil layers under the three tree species’ covers. The TC/TN ratios decreased with an increase in the soil layer, with the ratio in the first soil layer being significantly higher (p < 0.05) than that in the third soil layer under P. tabulaeformis.
The clay proportions of the soil layers under the three tree species followed the order of S. japonica > G. biloba > P. tabulaeformis, with the first and second soil layers under S. japonica having significantly higher clay proportions (p < 0.05) than those under P. tabulaeformis. The clay proportions in the three soil layers under the three tree species ranged from 17.77% to 21.40%, which were all lower than 25% and higher than 15%. Moreover, the sand proportions in the soil layers under the three tree species ranged from 55% to 85%. The results indicate that the soils under the three tree species covers were sandy clay loam. In summary, the clay proportion increased with an increase in the soil layer, with the value in the third soil layer being significantly higher than that in the first soil layer under S. japonica (p < 0.05).
The MBC values of soil layers under the three tree species covers were in the order of S. japonica > G. biloba > P. tabulaeformis. Furthermore, the MBC values of the first and second soil layers (0–10 cm and 10–20 cm) under S. japonica were significantly higher (p < 0.05) than those of soil layers under P. tabulaeformis. However, no significant differences were observed in the third soil layer (20–30 cm) under the three tree species. The MBC values increased with an increase in the soil layer under the three tree species, with the values of the third soil layer being significantly higher than those of the first soil layer (p < 0.05).
No significant differences were observed in the MBN values of the soil layers among the three tree species. In general, the MBN values increased with an increase in the soil layer, with the values of the third soil layer under G. biloba and P. tabulaeformis being significantly higher than those of the first soil layer (p < 0.05). In addition, no significant differences were observed in the MBN/TN ratios of the same soil layers among the three woodland soils. Overall, the MBN/TN ratios increased with an increase in the soil layer; however, the MBN/TN ratio in the third soil layer (20–30 cm) under G. biloba was significantly higher than that in the first soil layer (p < 0.05).

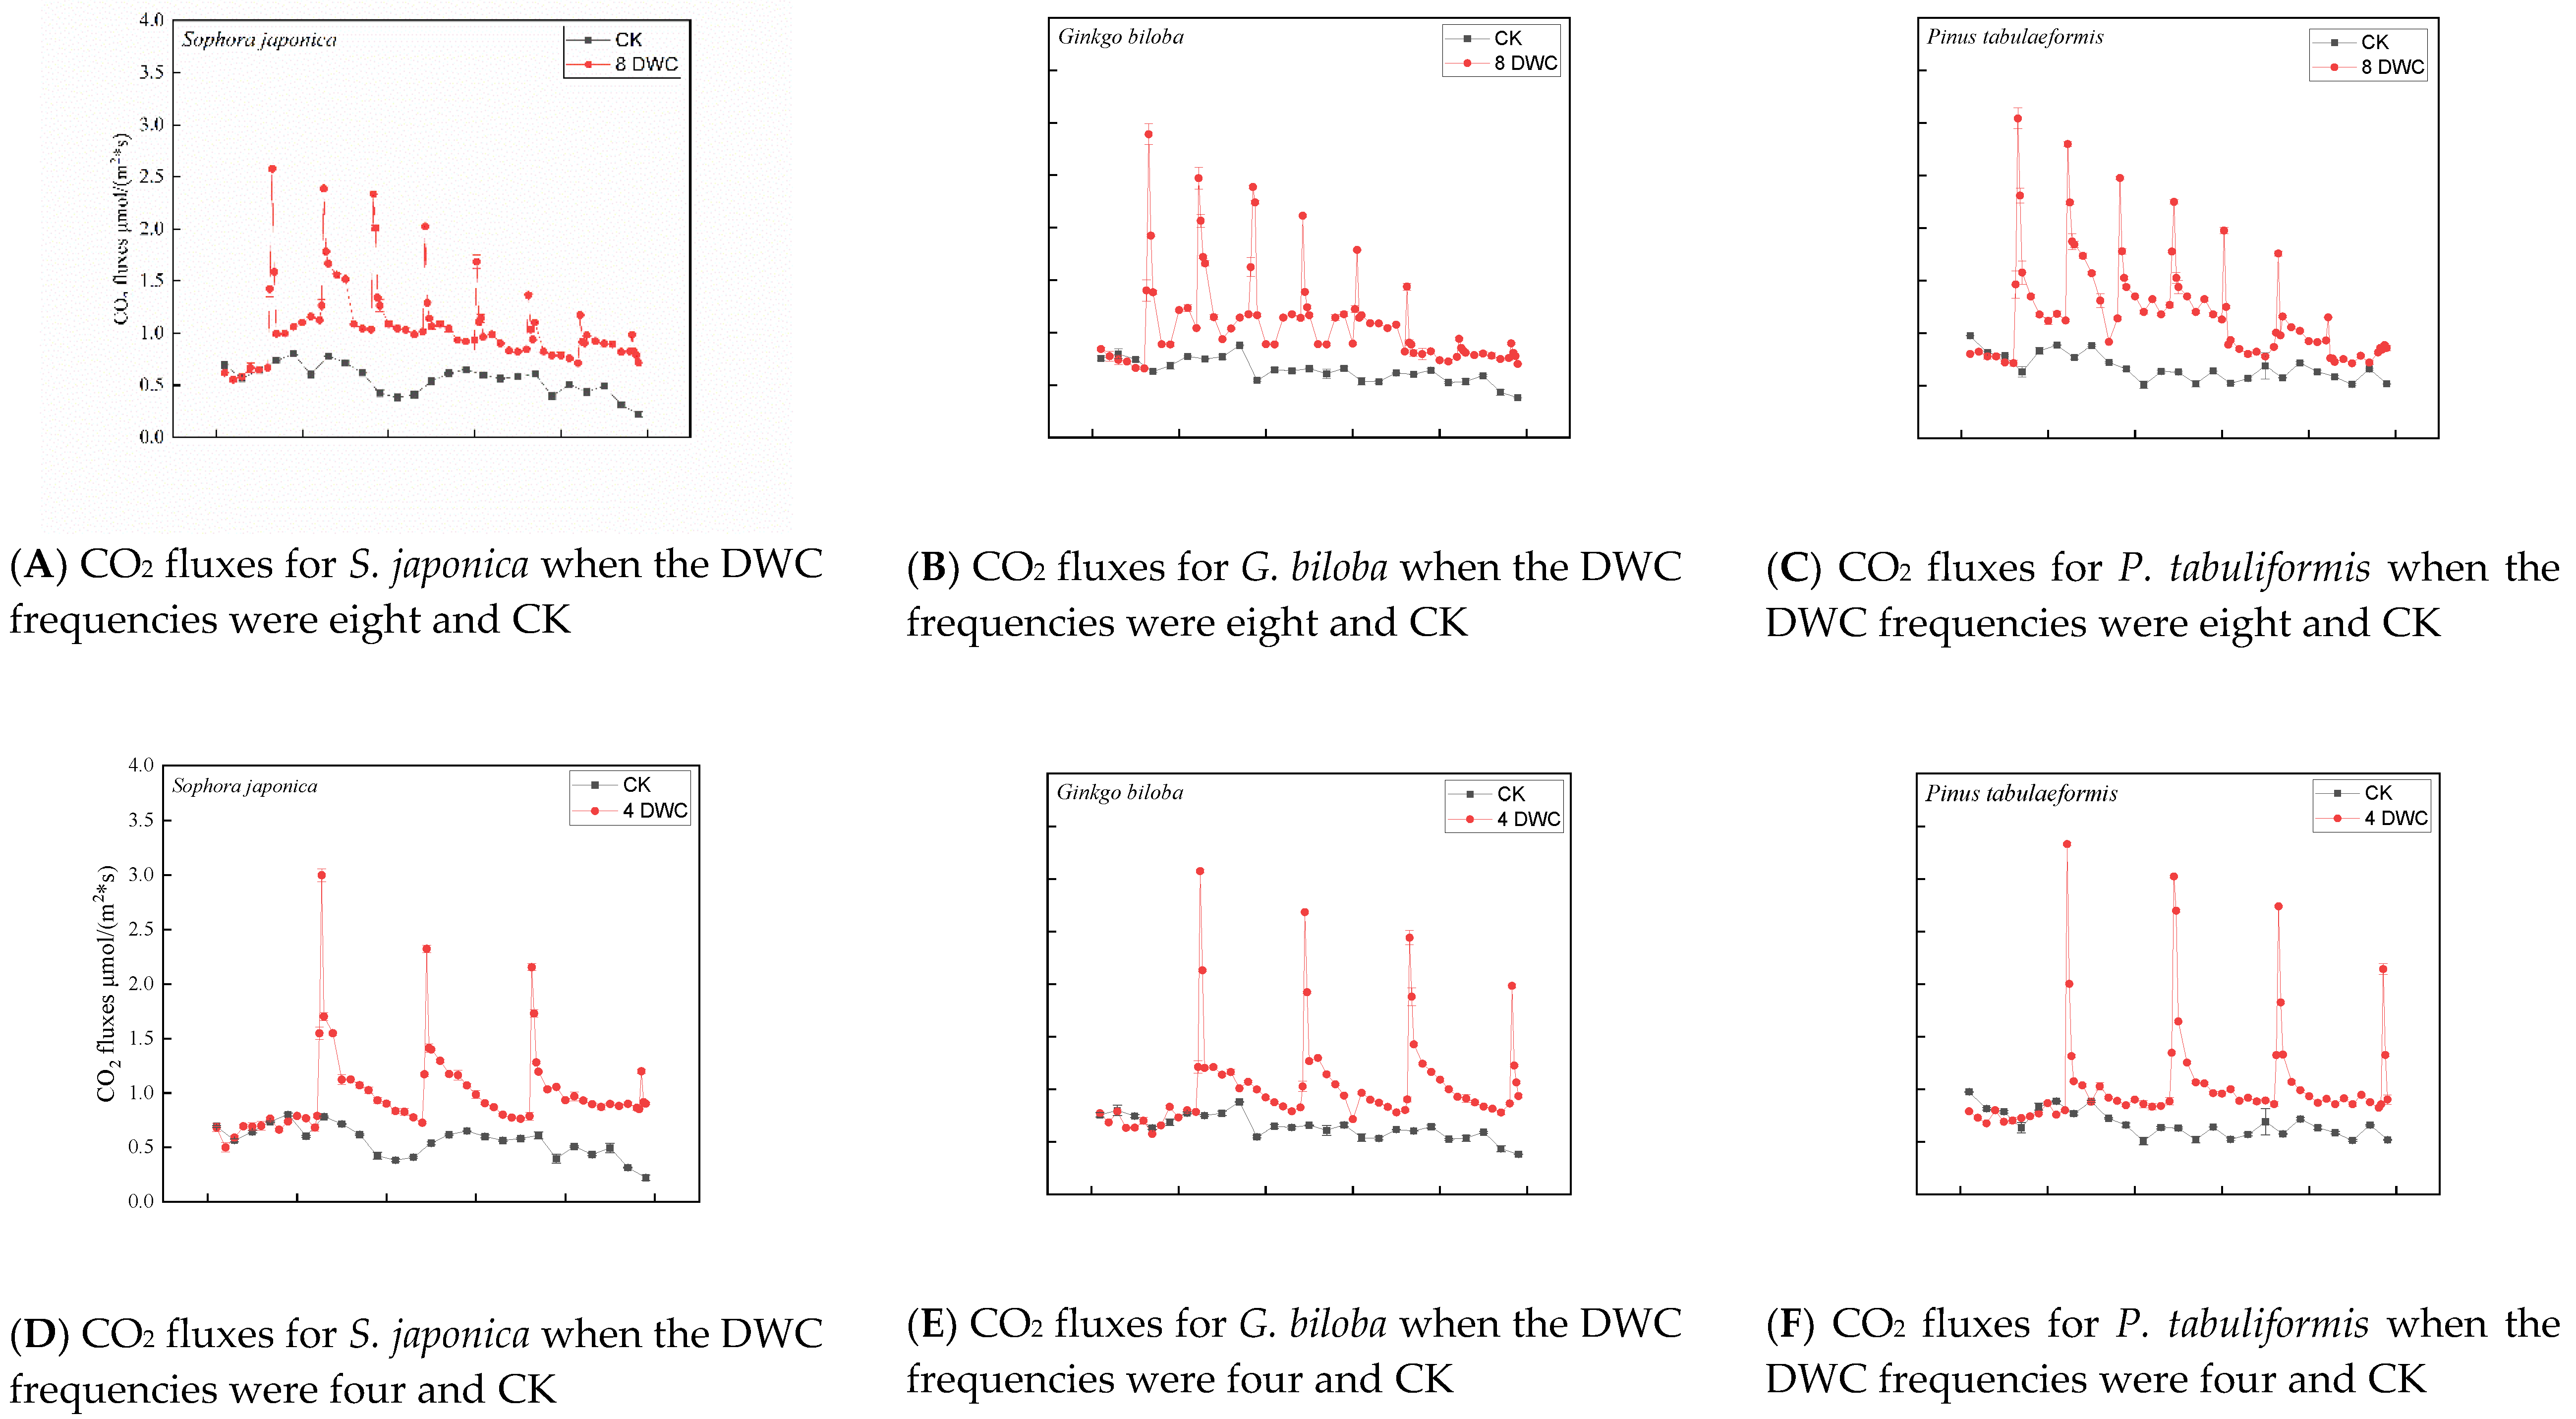
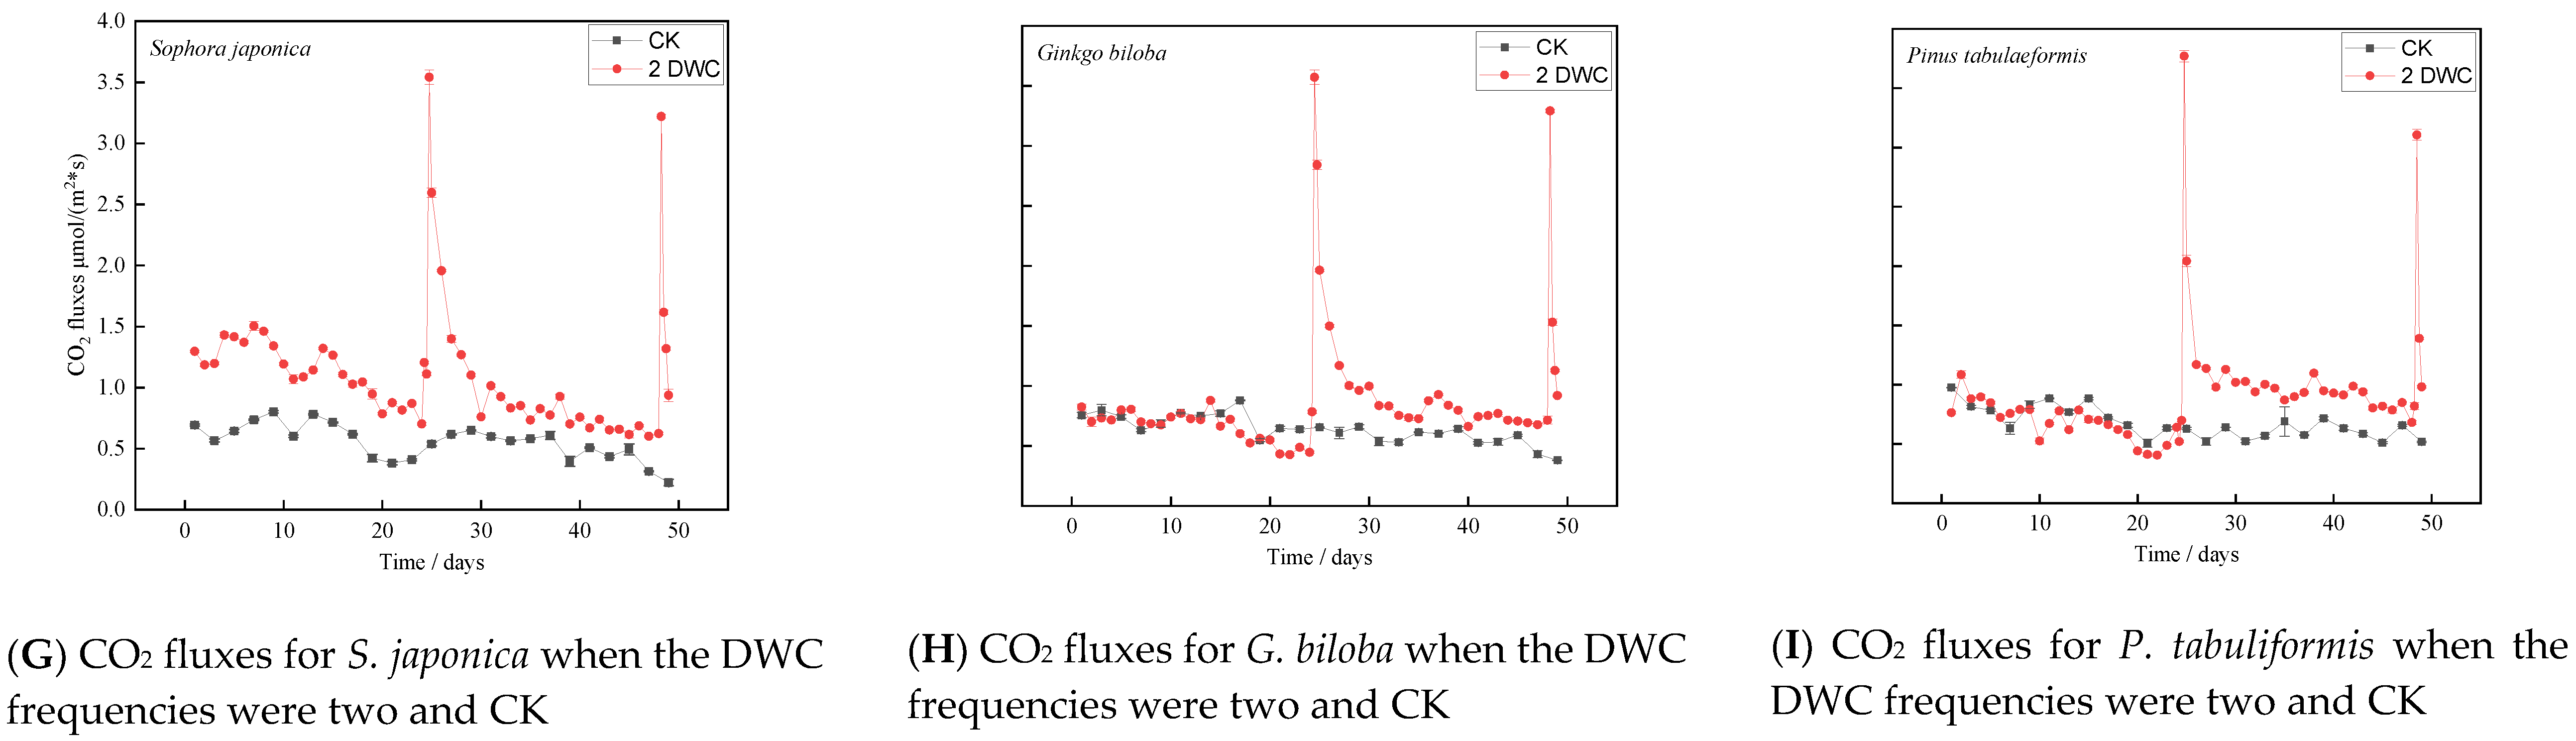
3.2. Effects of Drying and Rewetting Cycle Frequencies on CO2 Fluxes

The results show that CO2 fluxes increased rapidly after artificial precipitation. The CO2 fluxes were higher than those under the constant drying treatment (CK) (Figure 2), and we can conclude that soil moisture is an important control factor of CO2 fluxes.
Eight peak values of CO2 fluxes were observed in all soils under the three tree species covers when the DWC frequency was eight, and the peak values decreased with an increase in the frequency of precipitation during the experimental period (Figure 2A–C). Four and two peak values of CO2 fluxes were observed in soils under the three tree species when the DWC frequencies were four (Figure 2D–F) and two (Figure 2G–I), respectively. The results illustrate that the maximum CO2 flux occurred after the first precipitation event, whereas the minimum CO2 flux occurred after the last precipitation event. The CO2 fluxes reached peak values and then decreased within one day after artificial precipitation. The peak values of CO2 fluxes increased threefold to eightfold when compared to the initial values.

3.3. Effects of Drying and Rewetting Cycle Frequencies on Cumulative CO2 Fluxes

The two-way ANOVA results (DWC frequency and species) show that the DWC frequency (F = 1327.18, p < 0.001), the species (F = 77.13, p < 0.001), and the interaction between the DWC frequency and species (F = 11.55, p < 0.001) had significant effects on cumulative CO2 emission fluxes. The cumulative CO2 emission fluxes of the three categories of woodland soils under the four DWC frequencies are illustrated in Figure 3 (one-way ANOVA). The ANOVA results revealed significant differences in the cumulative CO2 emission fluxes within the same woodland soils at different DWC frequencies. The order of cumulative CO2 emission fluxes in the three woodland soils at various DWC frequencies were as follows: 8 DWCs > 4 DWCs > 2 DWCs > 0 DWCs (control group), implying that the precipitation intensity significantly increased the cumulative CO2 emission fluxes.
Significant differences were observed in the cumulative CO2 emission fluxes among the three woodland soils in the control group (0 DWCs), which followed the order of P. tabulaeformis > G. biloba > S. japonica (p < 0.05). The cumulative CO2 emission fluxes for soils under S. japonica with two, four, and eight DWCs increased by 46.9%, 75.45%, and 85.6%, respectively, when compared to the control group (0 DWCs). The cumulative CO2 emission fluxes for soils under G. biloba with two, four, and eight DWCs increased by 30.7%, 55.1%, and 63.2%, respectively, when compared to the control group. The cumulative CO2 emission fluxes for soils under P. tabulaeformis with two, four, and eight DWCs increased by 34.4%, 48.2%, and 73.1%, respectively, when compared to the control group. Overall, an increase in precipitation intensity increased the cumulative CO2 emissions from the three woodland soils.

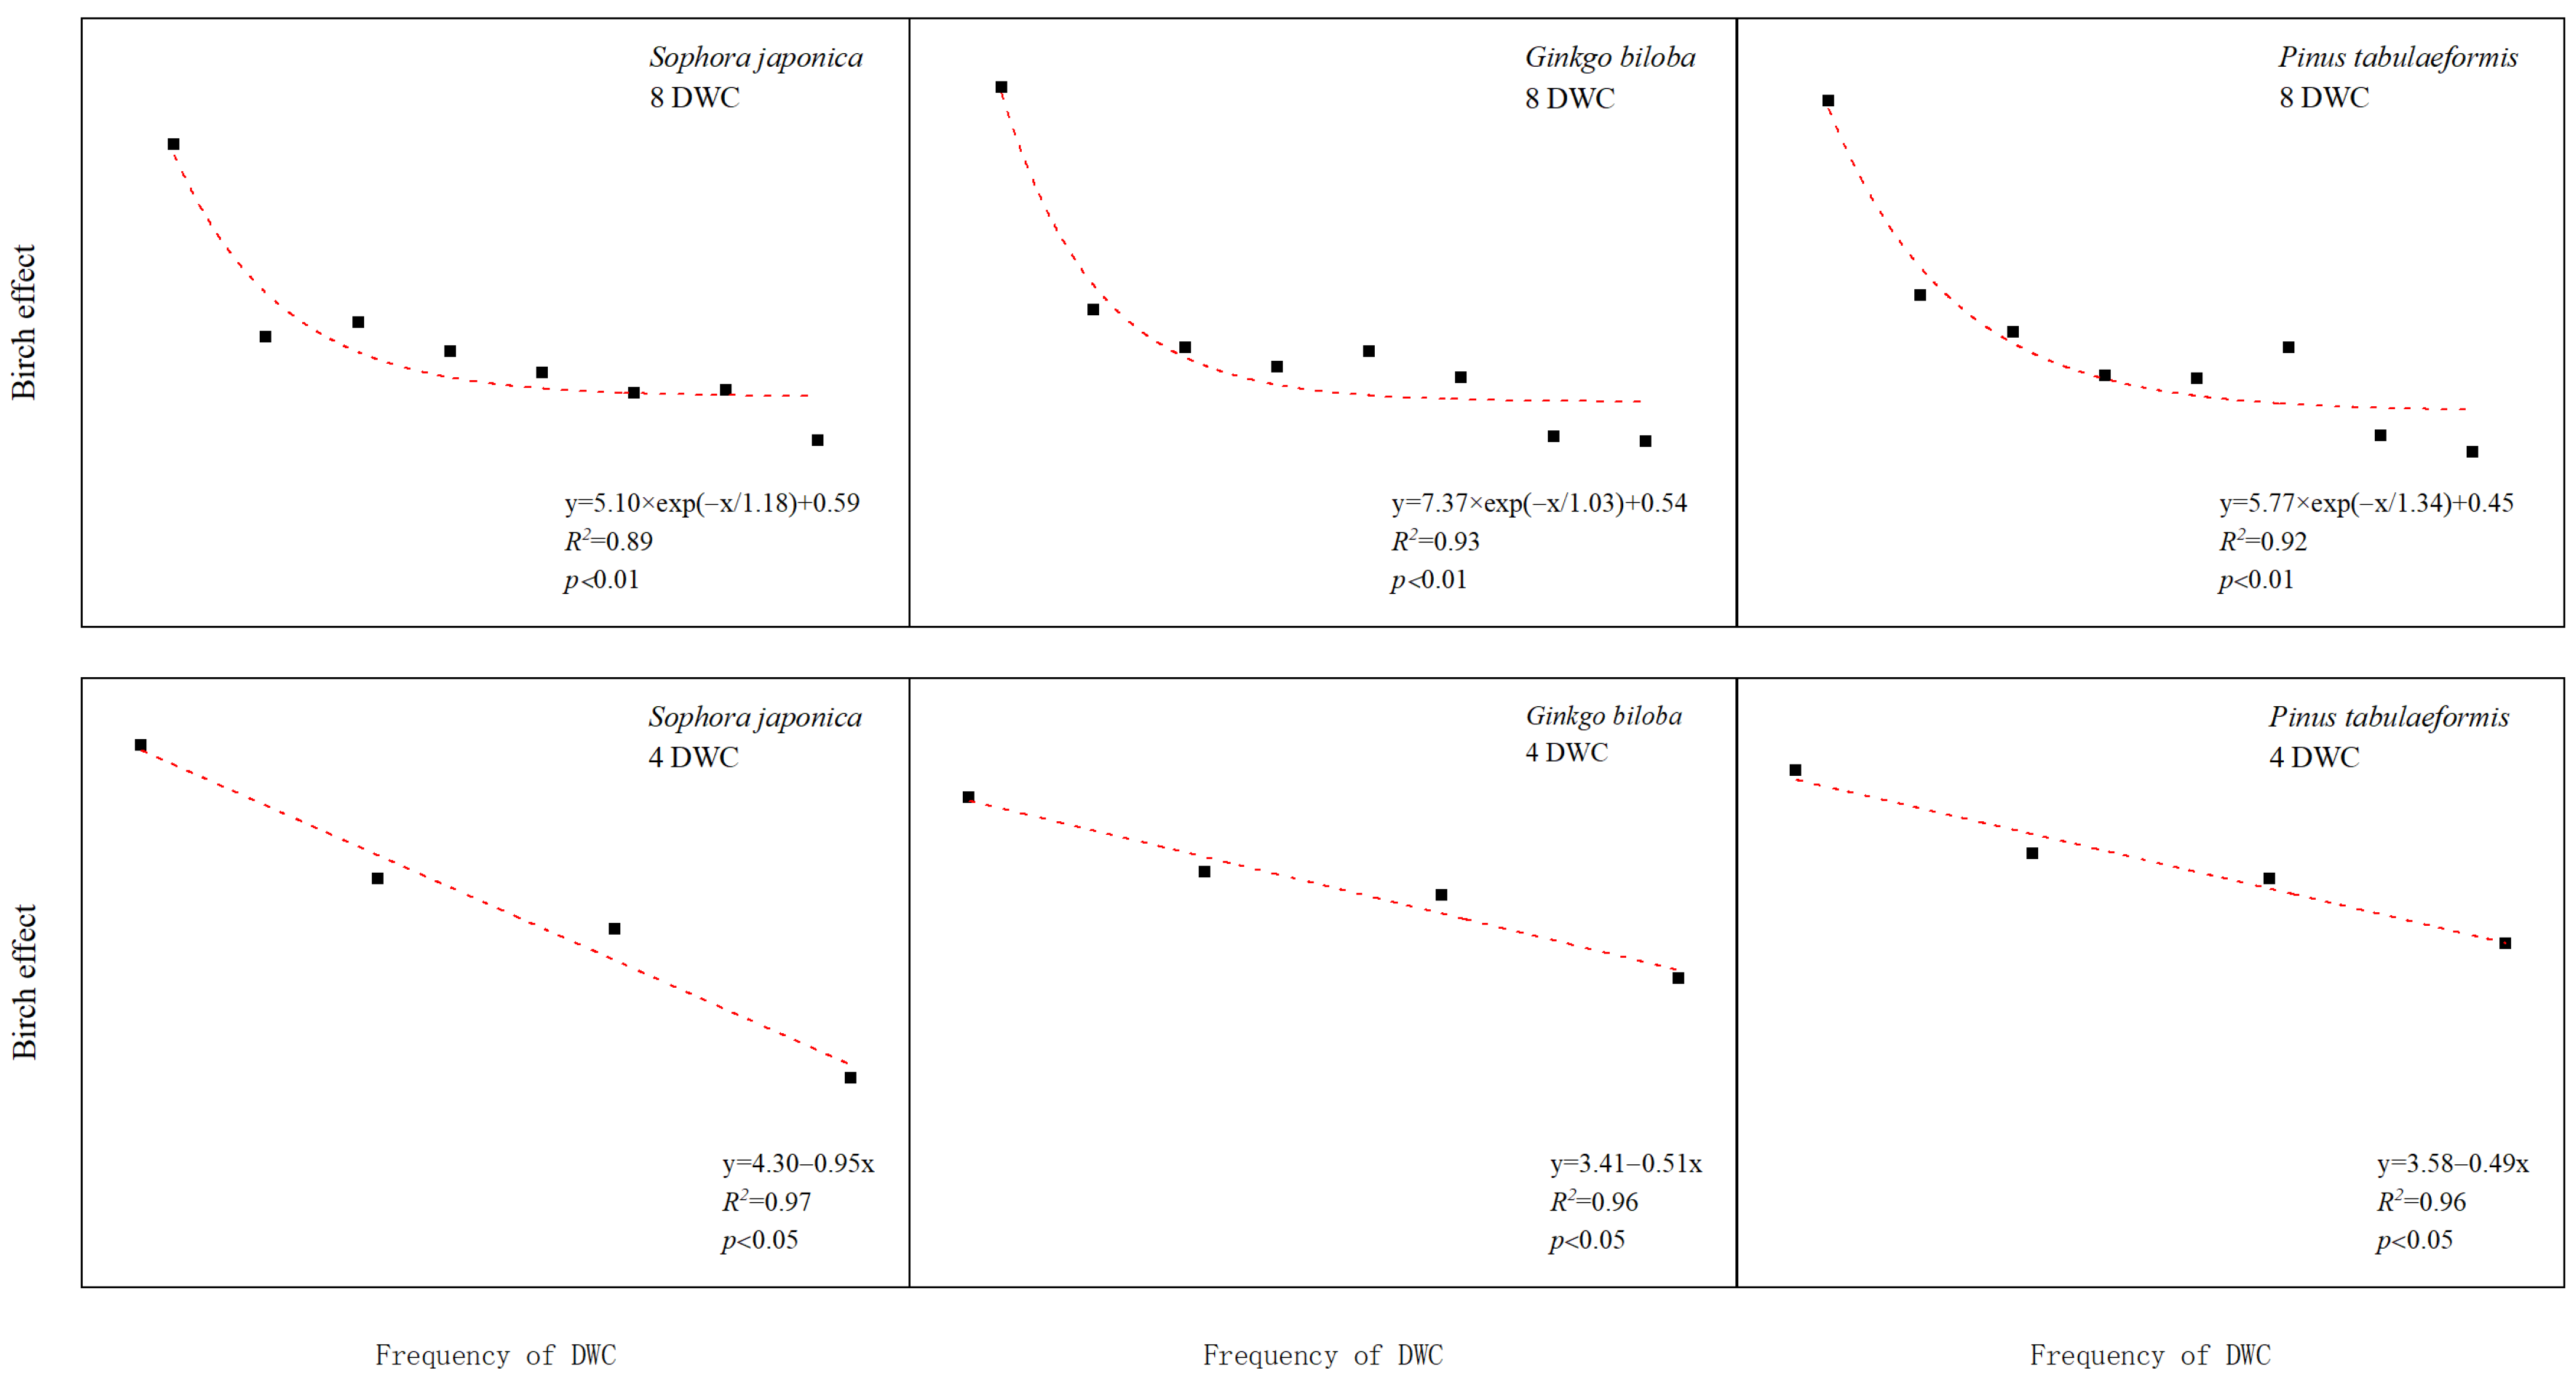
3.4. Effects of Drying and Rewetting Cycle Frequencies on the Birch Effect

A significant correlation was observed between the Birch effect and the DWC frequency (p < 0.05). The relationship between the Birch effect and the DWC frequency, which was determined by the DWC, is illustrated in Figure 4. The DWC frequencies of four and eight exhibited linear and exponential relationships with the Birch effect during the experimental period.
The initial and final Birch effect values of soil under S. japonica with eight DWCs were 2.87 and 0.19, respectively, which was a decrease of 93.5%, and those with four DWCs were 3.40 and 0.39, respectively, which was a decrease of 88.6%. The Birch effect of the soil under G. biloba decreased from 3.39 (first cycle) to 0.18 (last cycle) with eight DWCs, and the percentage decrease was 94.6%. The Birch effect value with four DWCs decreased from 2.93 (first rewetting cycle) to 1.30 (last rewetting cycle), and the percentage decrease was 55.8%. The initial and final Birch effect values of the soil under P. tabulaeformis with eight DWCs were 3.26 and 0.09, respectively, which was a decrease of 97.4%. The Birch effect value with four DWCs decreased from 3.17 to 1.61 (49.3% decrease).

3.5. Effects of Drying and Rewetting Cycles on Soil Bacterial Community

3.5.1. Soil Bacterial Community Diversity

The alpha diversity indices of the soil bacterial communities are listed in Table 3. Overall, the soil microbial communities in the CS group had relatively high diversity and species richness when compared to the other four groups, suggesting that DWCs can decrease the diversity of soil microbial communities.

3.5.2. Abundance of Bacterial Communities at the Phylum and Genus Levels

The relative abundances of Actinobacteria, Proteobacteria, and Acidobacteria in the five groups are listed in Table 4. The results prove that a constant drying treatment (CK) can significantly increase the relative abundance of Actinobacteria but significantly decrease the relative abundance of Proteobacteria when compared to the DWCs.
The top four genera are used to illustrate the diversity of the soil bacterial communities in the five groups (Table 5). The results show that a low DWC frequency and a high precipitation intensity significantly decreased the relative abundance of Gp6. The constant drying treatment (CK) significantly decreased the relative abundances of Gemmatimonas and Gp4.

3.5.3. Correlation Analysis between Soil Physicochemical Properties and Bacterial Communities

The results of the correlation analysis between the soil physicochemical properties and the soil bacterial communities are presented in Figure 5. Significant positive correlations were observed between the observed species index and MBN/TN, between the Shannon index and MBN, and between the Shannon index and MBN/TN. Furthermore, the Chao1 index exhibited a significant positive correlation with the observed species and Shannon indices (p < 0.05), suggesting that MBN and MBN/TN were the key factors influencing the bacterial diversity in the soil.

4. Discussion

4.1. Effects of Drying and Rewetting Cycles on CO2 Emissions

The Birch effect is considered a major contributor to soil CO2 emissions [49,50], and soil water repellency can reduce the Birch effect [51], which is mainly determined by the wetting intensity [52]. DWCs significantly induce CO2 emissions, and the response models of CO2 emissions to DWCs in various types of soils (forest, agriculture, grassland, and desert ecosystems) are similar. For soils under oak and grass cover, frequent DWCs decrease CO2 fluxes upon rewetting [35]. The short-term effect of simulated rainfall amounts on soil CO2 emissions was measured during the summer and autumn periods, and the results revealed that the factors associated with soil drying prior to rewetting have a considerable impact on CO2 emissions, especially at greater rewetting intensities [53]. In addition, a previous study revealed that CO2 emission rates decreased with the DWC frequency during the rewetting period, and the degree of response was correlated with the initial soil carbon content [17].
Soil CO2 concentrations and fluxes caused by DWCs have been reported to vary with soil depth. CO2 fluxes are the highest in surface soils, and soil carbon in the deeper soil layers exhibits a higher sensitivity to changes in temperature during the drying periods than that in surface soil, which in turn leads to dynamic changes in the direction of CO2 fluxes across soil profiles [21]. Our results are consistent with the findings of previous studies. In the present study, the peak values of CO2 fluxes in surface soil occurred after rewetting, and the values decreased with the frequency of rewetting during the experimental period. Increases in DWCs lead to the disruption of aggregates, and the DWC frequency enhances CO2 emissions when compared to the constant moisture treatment [54].
The total CO2 loss during incubation increased significantly with the frequency of rewetting in soils with oak cover but not in soils with grass cover [35]. The total amount of CO2 released from DWC treatments was higher than that from a control treatment with constant soil moisture [17]. In a previous study, the cumulative CO2 fluxes induced by DWCs reduced significantly by 62%–83% when compared to the control group without any rainfall events [13]. Our results demonstrated that the cumulative CO2 emissions decreased significantly with the precipitation intensity during the experimental period, which was consistent with the findings of a previous study [35]. Moreover, the cumulative CO2 emissions in the present study were significantly higher than those under the constant drying treatment. Therefore, the DWCs with high precipitation intensity could enhance cumulative CO2 emission.

4.2. Effects of Drying and Rewetting Cycles on Microbial Communities

The water content and soil nutrients are key factors that explain microbial resource limitations [55]. The water content during the drying period of DWCs can affect the size of the flush of microbial activity upon rewetting. The microbial activity in dried soils may not be completely restored, even after several days of moisture incubation, suggesting that the drying of soils can have a substantial and long-term impact on microbial functioning [56]. Previous studies have indicated that microbial activity and community composition in moderately saline soils can withstand a variety of DWCs better than those in nonsaline soils, and that saline soils in semi-arid climates have a greater carbon storage potential than nonsaline soils [15]. DWCs decrease microbial carbon contents in arable lands, resulting in an increase in the extractable organic carbon; however, MBC and extractable organic carbon are rapidly restored to the initial levels [12]. A previous study showed that total organic carbon stocks and stable SOM pools (lignin) are not influenced by moderate drought followed by rewetting events. However, labile SOM pools (plant- and microbe-derived sugars) decrease considerably, and the soil microbial community structure is altered [57].
A low DWC frequency and a high precipitation intensity significantly increase CO2 emissions, resulting in an increase in the microbial activities of Acidobacteria and Actinobacteria, among others [38]. Acidobacteria tend to maintain their metabolic activity at low water potentials [38]. Actinobacteria have a lineage-specific relationship with soil moisture but not with carbon or nitrogen [58]. Furthermore, Actinobacteria is one of the most common taxa that is adapted to drying and rewetting events resulting from ambient and altered precipitation regimes in field soils [38].

5. Conclusions

The present study revealed that DWCs generally increase CO2 fluxes and cumulative CO2 emissions when compared to constant drying treatments, and CO2 fluxes and cumulative CO2 emissions increased with an increase in precipitation intensity. The soils in the three woodlands exhibited significant correlations between the DWC frequencies and the Birch effect (p < 0.05). In addition, the Birch effect decreased linearly or exponentially with the rewetting frequency during the experimental period when the DWC frequency was four or eight, respectively. DWC events decreased the Shannon and Simpson diversity indices of soil microorganisms and altered the microbial community composition when compared to those under the constant drying treatments. The MBN content and the MBN/TN ratios considerably influenced the diversity of the microbial communities. According to the results of this study, frequent drying and rewetting events in woodland soils, especially high rewetting intensities, could disrupt the carbon balance in terrestrial ecosystems.

Author Contributions

Conceptualization, J.Z.; Methodology, J.Z., Y.Z. (Yun Zhang) and X.L. (Xiaohan Li); Software, X.L. (Xiaohan Li); Validation, J.Z. and Y.Z. (Yun Zhang); Formal analysis, J.Z., Y.Z. (Yun Zhang) and X.L. (Xiaohan Li); Investigation, X.L. (Xinmei Liu), Y.C., Y.Z. (Ye Zhang), X.Z., W.Z. and Y.F.; Writing—original draft preparation, Y.Z. (Yun Zhang) and X.L. (Xiaohan Li); Writing—review and editing, Y.Z. (Yun Zhang) and J.Z. All authors have read and agreed to the published version of the manuscript.

Funding

This research was funded by the Excellent Youth Scholars Program and the Special Project on Hi-Tech Innovation Capacity (KJCX20210416) from the Beijing Academy of Agriculture and Forestry Sciences (BAAFS) and the National Key Research and Development Program of China (2017YFA0604604).

Data Availability Statement

Sequence data reported in this study were archived in the Sequence Read Archive (SRA), with the accession number PRJNA868173.

Acknowledgments

We thank the Beijing Academy of Agriculture and Forestry Sciences for providing a greenhouse and support.

Conflicts of Interest

The authors declare no conflict of interest.

References

  1. Marengo, J.A.; Jones, R.; Alves, L.M.; Valverde, M.C. Future change of temperature and precipitation extremes in South America as derived from the PRECIS regional climate modeling system. Int. J. Climatol. 2010, 29, 2241–2255. [Google Scholar] [CrossRef] [Green Version]
  2. Wang, W.; Shao, Q.; Tao, Y.; Peng, S.; Sun, F. Changes in daily temperature and precipitation extremes in the Yellow River Basin, China. Stoch. Environ. Res. Risk Assess. 2012, 27, 401–421. [Google Scholar] [CrossRef]
  3. Heimann, M.; Reichstein, M. Terrestrial ecosystem carbon dynamics and climate feedbacks. Nature 2008, 451, 289–292. [Google Scholar] [CrossRef] [Green Version]
  4. Deluca, T.H.; Boisvenue, C. Boreal forest soil carbon: Distribution, function and modelling. Forestry 2012, 34, 4678–4689. [Google Scholar]
  5. Ouyang, Y.; Li, X. Recent research progress on soil microbial responses to drying–rewetting cycles. Acta Ecol. Sin. 2013, 33, 1–6. [Google Scholar] [CrossRef]
  6. Piao, S.; Zhang, X.; Chen, A.; Liu, Q.; Lian, X.; Wang, X.; Peng, S.; Wu, X. The impacts of climate extremes on the terrestrial carbon cycle: A review. Sci. China 2019, 62, 1551–1563. [Google Scholar] [CrossRef]
  7. Reichstein, M.; Bahn, M.; Ciais, P.; Frank, D.; Mahecha, M.D.; Seneviratne, S.I.; Zscheischler, J.; Beer, C.; Buchmann, N.; Frank, D.C. Climate extremes and the carbon cycle. Nature 2013, 500, 287–295. [Google Scholar] [CrossRef]
  8. Dorothea, F.; Markus, R.; Michael, B.; Kirsten, T.; David, F.; Miguel, D.M.; Pete, S. Effects of climate extremes on the terrestrial carbon cycle: Concepts, processes and potential future impacts. Glob. Change Biol. 2015, 21, 2861–2880. [Google Scholar]
  9. Skansi, M.; Brunet, M.; Sigró, J.; Aguilar, E.; Jones, P.D. Warming and wetting signals emerging from analysis of changes in climate extreme indices over South America. Glob. Planet. Change 2013, 100, 295–307. [Google Scholar] [CrossRef]
  10. Cook, B.I.; Smerdon, J.E.; Seager, R.; Coats, S. Global warming and 21st century drying. Clim. Dyn. 2014, 43, 2607–2627. [Google Scholar] [CrossRef] [Green Version]
  11. Jan, M.; Janine, F.; Werner, B. Drying–rewetting events reduce C and N losses from a Norway spruce forest floor. Soil Biol. Biochem. 2010, 42, 1303–1312. [Google Scholar]
  12. Chen, H.; Lai, L.; Zhao, X.; Li, G.; Lin, Q. Soil microbial biomass carbon and phosphorus as affected by frequent drying–rewetting. Soil Res. 2016, 54, 321–327. [Google Scholar] [CrossRef]
  13. Michelle, M.S.L.; Derrick, Y.F.L. Impacts of wetting-drying cycles on short-term carbon and nitrogen dynamics in Amynthas earthworm casts. Pedosphere 2021, 31, 423–432. [Google Scholar]
  14. Zhang, C.G.; Gao, Y.; Wang, G.S.; Shuang, L.I. Effects of drying-wetting and additional nitrogen on CO_2 and N_2O emissions from farmland soils. J. Agro-Environ. Sci. 2018, 37, 2079–2090. [Google Scholar]
  15. Chowdhury, N.; Nakatani, A.S.; Setia, R.; Marschner, P. Microbial activity and community composition in saline and non-saline soils exposed to multiple drying and rewetting events. Plant Soil 2011, 348, 103–113. [Google Scholar] [CrossRef]
  16. Tiemann, L.K.; Billings, S.A. Changes in variability of soil moisture alter microbial community C and N resource use. Soil Biol. Biochem. 2011, 43, 1837–1847. [Google Scholar] [CrossRef]
  17. Ouyang, Y.; Li, X. Impacts of drying-wetting cycles on CO2 and N2O emissions from soils in different ecosystems. Acta Ecol. Sin. 2013, 33, 1251–1259. [Google Scholar] [CrossRef]
  18. Peralta, A.L.; Ludmer, S.; Kent, A.D. Hydrologic history influences microbial community composition and nitrogen cycling under experimental drying/wetting treatments. Soil Biol. Biochem. 2013, 66, 29–37. [Google Scholar] [CrossRef]
  19. Fan, Z.P.; Hu, Y.L.; Li, J.T.; Zeng, D.H. Effects of drying-rewetting on soil C and N mineralization rates in Mongolian pine plantation in a semi-arid region. Chin. J. Ecol. 2015, 34, 3360–3367. [Google Scholar]
  20. Yemadje, P.L.; Chevallier, T.; Deleporte, P.; Bernoux, M. Effect of biomass management regimes and wetting-drying cycles on soil carbon mineralization in a Sudano-Sahelian region. J. Arid Environ. 2016, 127, 1–6. [Google Scholar] [CrossRef]
  21. Min, K.; Berhe, A.A.; Khoi, C.M.; Asperen, H.V.; Six, J. Differential effects of wetting and drying on soil CO2 concentration and flux in near-surface vs. deep soil layers. Biogeochemistry 2020, 148, 255–269. [Google Scholar] [CrossRef]
  22. Wang, B.; Zha, T.S.; Jia, X.; Wu, B.; Zhang, Y.Q.; Qin, S.G. Soil moisture modifies the response of soil respiration to temperature in a desert shrub ecosystem. Biogeosci. Discuss. 2013, 10, 9213–9242. [Google Scholar] [CrossRef] [Green Version]
  23. Li, J.T.; Wang, J.J.; Zeng, D.H.; Zhao, S.Y.; Huang, W.L.; Sun, X.K.; Hu, Y.L. The influence of drought intensity on soil respiration during and after multiple drying-rewetting cycles. Soil Biol. Biochem. 2018, 127, 82–89. [Google Scholar] [CrossRef]
  24. Zhu, B.; Cheng, W. Impacts of drying–wetting cycles on rhizosphere respiration and soil organic matter decomposition. Soil Biol. Biochem. 2013, 63, 89–96. [Google Scholar] [CrossRef] [Green Version]
  25. Miller, A.E.; Schimel, J.P.; Meixner, T.; Sickman, J.O.; Melack, J.M. Episodic rewetting enhances carbon and nitrogen release from chaparral soils. Soil Biol. Biochem. 2005, 37, 2195–2204. [Google Scholar] [CrossRef]
  26. Kim, D.G.; Vargas, R.; Bond-Lamberty, B.; Turetsky, M.R. Effects of soil rewetting and thawing on soil gas fluxes: A review of current literature and suggestions for future research. Biogeosciences 2012, 9, 2459–2483. [Google Scholar] [CrossRef]
  27. Waring, B.G.; Powers, J.S. Unraveling the mechanisms underlying pulse dynamics of soil respiration in tropical dry forests. Environ. Res. Lett. 2016, 11, 105005. [Google Scholar] [CrossRef]
  28. Todman, L.C.; Fraser, F.C.; Pawlett, M.; Ritz, K.; Deeks, L.K. On the origin of carbon dioxide released from rewetted soils. Soil Biol. Biochem. 2016, 101, 1–5. [Google Scholar]
  29. Ouyang, Y.; Li, X. Effect of repeated drying-rewetting cycles on soil extracellular enzyme activities and microbial community composition in arid and semi-arid ecosystems. Eur. J. Soil Biol. 2020, 98, 103187. [Google Scholar] [CrossRef]
  30. Nielsen, U.N.; Ball, B.A. Impacts of altered precipitation regimes on soil communities and biogeochemistry in arid and semi-arid ecosystems. Glob. Change Biol. 2015, 21, 1407–1421. [Google Scholar] [CrossRef]
  31. Zhao, M.; Guo, S.; Wang, R. Diverse soil respiration responses to extreme precipitation patterns in arid and semiarid ecosystems. Appl. Soil Ecol. 2021, 163, 103928. [Google Scholar] [CrossRef]
  32. Huygens, D.; Schouppe, J.; Roobroeck, D.; Alvarez, M.; Balocchi, O.; Valenzuela, E.; Pinochet, D.; Boeckx, P. Drying–rewetting effects on N cycling in grassland soils of varying microbial community composition and management intensity in south central Chile. Appl. Soil Ecol. 2011, 48, 270–279. [Google Scholar] [CrossRef]
  33. Yang, P.; Wang, N.a.; Zhao, L.; Su, B.; Niu, Z.; Zhao, H. Responses of grassland ecosystem carbon fluxes to precipitation and their environmental factors in the Badain Jaran Desert. Environ. Sci. Pollut. Res. 2022, 29, 75805–75821. [Google Scholar] [CrossRef] [PubMed]
  34. Dasheng, S.; Qingfang, B.; Kejie, L.; Jun, Z.; Qichun, Z.; Chongwei, J.; Lingli, L.; Xianyong, L. Effect of Soil Drying Intensity During an Experimental Drying-Rewetting Event on Nutrient Transformation and Microbial Community Composition. Pedosphere 2018, 28, 644–655. [Google Scholar]
  35. Fierer, N.; Schimel, J.P. Effects of drying–rewetting frequency on soil carbon and nitrogen transformations. Soil Biol. Biochem. 2002, 34, 777–787. [Google Scholar] [CrossRef]
  36. Wang, Y.; Liu, F.; Neergaard, A.D.; Jensen, L.S.; Luxhi, J.; Jensen, C.R. Alternate partial root-zone irrigation induced dry/wet cycles of soils stimulate N mineralization and improve N nutrition in tomatoes. Plant Soil 2010, 337, 167–177. [Google Scholar] [CrossRef]
  37. Wang, Y.; Liu, F.; Andersen, M.N.; Jensen, C.R. Carbon retention in the soil-plant system under different irrigation regimes. Agric. Water Manag. 2010, 98, 419–424. [Google Scholar] [CrossRef] [Green Version]
  38. Veach, A.M.; Zeglin, L.H. Historical Drought Affects Microbial Population Dynamics and Activity During Soil Drying and Re-Wet. Microb. Ecol. 2020, 79, 662–674. [Google Scholar] [CrossRef]
  39. Zeglin, L.H.; Bottomley, P.J.; Jumpponen, A.; Rice, C.W.; Arango, M.; Lindsley, A.; McGowan, A.; Mfombep, P.; Myrold, D. Altered precipitation regime affects the function and composition of soil microbial communities on multiple time scales. Ecology 2013, 94, 2334–2345. [Google Scholar] [CrossRef]
  40. Nijs, E.D.; Hicks, L.C.; Leizeaga, A.; Tietema, A.; Rousk, J. Soil microbial moisture dependences and responses to drying-rewetting: The legacy of 18 years drought. Glob. Change Biol. 2018, 25, 1005–1015. [Google Scholar] [CrossRef]
  41. Xue, Z.; Dario, F.; Makoto, I.; Isao, A.; Zhang, R.; Jia, Z. The Resilience of Microbial Community under Drying and Rewetting Cycles of Three Forest Soils. Front. Microbiol. 2016, 7, 1101. [Google Scholar]
  42. Zhao, J.; Ouyang, Z.; Zheng, H.; Zhou, W.; Wang, X.; Xu, W.; Ni, Y. Plant species composition in green spaces within the built-up areas of Beijing, China. Plant Ecol. 2010, 209, 179. [Google Scholar] [CrossRef] [Green Version]
  43. Zhang, P.; Wang, G.; Zhang, T. Responses of foliar δ13C in Sabina przewalskii and Picea crassifolia to altitude and its mechanism in the Qilian Mountains, China. Chin. J. Plant Ecol. 2010, 34, 125–133. [Google Scholar]
  44. Wang, Y.; Liu, X.; Chen, F.; Huang, R.; Deng, X.; Jiang, Y. Seasonal dynamics of soil microbial biomass C and N of Keteleeria fortunei var.cyclolepis forests with different ages. J. For. Res. 2020, 31, 2377–2384. [Google Scholar] [CrossRef] [Green Version]
  45. Lin, J.; Zhu, B.; Cheng, W. Decadally cycling soil carbon is more sensitive to warming than faster-cycling soil carbon. Glob. Change Biol. 2015, 21, 4602–4612. [Google Scholar] [CrossRef]
  46. Magoc, T.; Salzberg, S.L. FLASH: Fast length adjustment of short reads to improve genome assemblies. Bioinformatics 2011, 27, 2957–2963. [Google Scholar] [CrossRef] [Green Version]
  47. Rognes, T.; Flouri, T.; Nichols, B.; Quince, C.; Mahé, F. VSEARCH: A versatile open source tool for metagenomics. PeerJ 2016, 4, e2584. [Google Scholar] [CrossRef] [Green Version]
  48. Mendes, L.W.; Tsai, S.M.; Navarrete, A.A.; Hollander, M.; Veen, J.; Kuramae, E.E. Soil-Borne Microbiome: Linking Diversity to Function. Microb. Ecol. 2015, 70, 255–265. [Google Scholar] [CrossRef]
  49. Leon, E.; Vargas, R.; Bullock, S.; Lopez, E.; Panosso, A.R.; Scala, N.L. Hot spots, hot moments, and spatio-temporal controls on soil CO2 efflux in a water-limited ecosystem. Soil Biol. Biochem. 2014, 77, 12–21. [Google Scholar] [CrossRef]
  50. Smith, A.P.; Bond-Lamberty, B.; Benscoter, B.W.; Tfaily, M.M.; Hinkle, C.R.; Liu, C.; Bailey, V.L. Shifts in pore connectivity from precipitation versus groundwater rewetting increases soil carbon loss after drought. Nat. Commun. 2017, 8, 1335. [Google Scholar] [CrossRef]
  51. Sánchez-García, C.; Oliveira, B.; Keizer, J.J.; Doerr, S.H.; Urbanek, E. Water repellency reduces soil CO2 efflux upon rewetting. Sci. Total Environ. 2019, 708, 135014. [Google Scholar] [CrossRef] [PubMed] [Green Version]
  52. Lado-Monserrat, L.; Lull, C.; Bautista, I.; Lidón, A.; Herrera, R. Soil moisture increment as a controlling variable of the “Birch effect”. Interactions with the pre-wetting soil moisture and litter addition. Plant Soil 2014, 379, 21–34. [Google Scholar] [CrossRef]
  53. Gebremichael, A.; Orr, P.J.; Osborne, B. The impact of wetting intensity on soil CO2 emissions from a coastal grassland ecosystem. Geoderma 2019, 343, 86–96. [Google Scholar] [CrossRef]
  54. Zhang, Z.; Wang, D.; Li, M. Soil respiration, aggregate stability and nutrient availability affected by drying duration and drying-rewetting frequency. Geoderma 2022, 413, 115743. [Google Scholar] [CrossRef]
  55. Jla, C.; Ld, B.; Yla, C.; Jw, B.; Jie, W.B.; Zsab, C.; Lei, D. Soil organic carbon variation determined by biogeographic patterns of microbial carbon and nutrient limitations across a 3000-km humidity gradient in China. Catena 2022, 209, 105849. [Google Scholar]
  56. Chowdhury, N.; Burns, R.G.; Marschner, P. Recovery of soil respiration after drying. Plant Soil 2011, 348, 269–279. [Google Scholar] [CrossRef]
  57. Schmitt, A.; Glaser, B. Organic matter dynamics in a temperate forest soil following enhanced drying. Soil Biol. Biochem. 2011, 43, 478–489. [Google Scholar] [CrossRef]
  58. Cruz-Martinez, K.; Rosling, A.; Zhang, Y.; Song, M.; Andersen, G.L.; Banfield, J.F. Effect of Rainfall-Induced Soil Geochemistry Dynamics on Grassland Soil Microbial Communities. Appl. Environ. Microbiol. 2012, 78, 7587. [Google Scholar] [CrossRef]
Figure 1. A schematic diagram of the experimental setup, illustrating the frequencies of DWC for three woodland soils.
Forests 13 01916 g001
Figure 2. Effects of DWC frequencies on soil CO2 fluxes.
Forests 13 01916 g002aForests 13 01916 g002b
Figure 3. Effects of drying and rewetting cycle (DWC) frequencies on the cumulative CO2 emission fluxes among different woodland soils. Note: uppercase letters represent the comparison of cumulative CO2 emission fluxes among the different DWC frequencies within the same soils, whereas lowercase letters represent the comparison of cumulative CO2 emission fluxes among the three woodland soils under the same DWC frequency.
Forests 13 01916 g003
Figure 4. Effects of different drying and rewetting cycle frequencies on the Birch effect of soil CO2.
Forests 13 01916 g004
Figure 5. Analysis of correlation between the soil properties and soil bacterial communities.
Forests 13 01916 g005
Table 1. Drying and rewetting cycles.
Number of Drying and Rewetting CyclesAmount of Precipitation for Each Cycle (mm)Precipitation Period (d)Drought Period (d)Total Amount of Precipitation (mm)Experimental Duration (d)
0 (0 DWCs/CK) 0048048
2 (2 DWCs/R80)8012316048
4 (4 DWCs/R40)4011116048
8 (8 DWCs/R20)201516048
Table 2. Physicochemical properties of soils collected from different soil layers under three tree species covers.
Soil PropertiesSoil LayerSophora japonicaPinus tabulaeformisGinkgo biloba
pH0–10 cm7.55 ± 0.09 Aa7.71 ± 0.05 Aa7.64 ± 0.08 Aa
10–20 cm7.62 ± 0.04 Aa7.63 ± 0.03 Aab7.67 ± 0.01 Aa
20–30 cm 7.62 ± 0.01 Aa7.50 ± 0.12 Ab7.62 ± 0.07 Aa
BD (g/cm3)0–10 cm1.43 ± 0.01 Aa1.38 ± 0.01 Ac1.30 ± 0.03 Bb
10–20 cm1.45 ± 0.06 Aa1.48 ± 0.01 Ab1.53 ± 0.00 Aa
20–30 cm 1.49 ± 0.06 Aa1.52 ± 0.01 Aa1.55 ± 0.01 Aa
TC/TN0–10 cm12.55 ± 1.87 Aa13.95 ± 0.49 Aa12.47 ± 1.19 Aa
10–20 cm13.30 ± 1.54 Aa11.41 ± 1.17 Ab12.39 ± 0.43 Aa
20–30 cm 11.39 ± 0.31 Aa11.76 ± 0.37 Ab11.44 ± 0.24 Aa
The proportion of clay (%)0–10 cm21.02 ± 0.17 Aab17.77 ± 1.79 Ba20.49 ± 0.33 Aa
10–20 cm20.79 ± 0.66 Ab19.07 ± 0.93 Ba20.49 ± 0.33 ABa
20–30 cm 23.18 ± 1.59 Aa20.35 ± 0.19 Aa21.40 ± 2.47 Aa
MBC (mg/kg)0–10 cm188.60 ± 38.37 Ab75.26 ± 46.99 Bb150.23 ± 36.77 ABb
10–20 cm215.14 ± 28.24 Aab132.21 ± 17.53 Bb194.54 ± 39.67 ABb
20–30 cm 298.11 ± 51.94 Aa252.40 ± 16.14 Aa354.96 ± 82.53 Aa
MBN (mg/kg)0–10 cm28.75 ± 17.25 Aa14.01 ± 10.08 Ab19.89 ± 3.84 Ab
10–20 cm29.59 ± 5.49 Aa26.93 ± 5.72 Aab28.09 ± 1.11 Ab
20–30 cm 45.87 ± 18.14 Aa31.36 ± 5.74 Aa68.98 ± 27.63 Aa
MBN/TN0–10 cm370.41 ± 147.57 Aa221.59 ± 101.93 Aa238.94 ± 54.74 Ab
10–20 cm394.37 ± 34.18 Aa296.34 ± 75.60 Aa321.58 ± 7.20 Aab
20–30 cm 425.11 ± 158.09 Aa288.07 ± 70.30 Aa545.54 ± 172.97 Aa
Note: Different uppercase letters within the same row indicate significant differences (p < 0.05) in soil properties within the same soil layer under the three woodland soils, whereas different lowercase letters within the same column indicate significant differences (p < 0.05) between soil layers of the same woodland soil. Data are presented as means ± standard deviations.
Table 3. Alpha diversity indices of soil bacterial communities under different treatments.
GroupShannon IndexSimpson IndexChao1 IndexObserved Species
R2010.05 ± 0.09 b0.9976 ± 0.0001 ab4128.46 ± 232.23 ab3084 ± 134.30 b
R4010.13 ± 0.14 ab0.9977 ± 0.0006 ab4242.28 ± 82.09 ab3164 ± 88.86 ab
R8010.04 ± 0.04 b0.9970 ± 0.0005 ab4107.14 ± 65.34 b3081 ± 25.98 b
CK9.98 ± 0.08 b0.9969 ± 0.0004 b4176.49 ± 108.01 ab3122 ± 62.13 ab
CS10.18 ± 0.05 a0.9978 ± 0.0001 a4351.69 ± 143.93 a3282 ± 121.38 a
Note: Different lowercase letters within the same column indicate significant differences (p < 0.05) among the various groups. Data are presented as means ± standard deviations.
Table 4. Relative abundances of the three dominant phyla in the five groups of soils.
GroupActinobacteria (%)Proteobacteria (%)Acidobacteria (%)
R20 22.30 ± 4.97 b26.18 ± 2.47 a22.45 ± 2.96 a
R4019.65 ± 2.62 b28.59 ± 2.76 a20.81 ± 5.37 ab
R80 26.06 ± 2.19 ab28.11 ± 3.83 a17.19 ± 3.36 b
CK35.29 ± 4.86 a20.90 ± 2.55 b17.42 ± 2.85 b
CS26.10 ± 5.99 ab24.03 ± 2.88 ab21.99 ± 3.36 ab
Note: Different lowercase letters (a and b) within the same column indicate significant differences at p < 0.05 among the various groups. Data are presented as means ± standard deviations.
Table 5. Relative abundances of the four dominant genera in the five groups of soils.
GroupGp6GaiellaGemmatimonasGp4
R20 10.70 ± 2.17 a4.68 ± 1.57 a4.31 ± 1.18 a3.70 ± 1.15 a
R4010.37 ± 4.55 ab3.22 ± 0.55 a3.37 ± 0.53 a2.97 ± 0.78 ab
R80 7.67 ± 1.43 b3.76 ± 0.90 a3.56 ± 0.90 a2.44 ± 1.36 ab
CK8.49 ± 0.97 ab4.39 ± 1.27 a1.75 ± 0.47 b1.82 ± 0.92 b
CS10.86 ± 2.73 a4.56 ± 1.17 a2.86 ± 0.70 ab2.82 ± 0.96 ab
Note: Different lowercase letters (a and b) within the same column indicate significant differences at p < 0.05 among the various groups. Data are presented as means ± standard deviations.
Publisher’s Note: MDPI stays neutral with regard to jurisdictional claims in published maps and institutional affiliations.

