Article

Greener or Greyer? Exploring the Trends of Sealed and Permeable Spaces Availability in Italian Built-Up Areas during the Last Three Decades

Dipartimento di Bioscienze e Territorio (DiBT), Università degli Studi del Molise, C. da Fonte Lappone, I-86090 Pesche, IS, Italy
*
Author to whom correspondence should be addressed.
Forests 2022, 13(12), 1983; https://doi.org/10.3390/f13121983
Submission received: 26 October 2022 / Revised: 15 November 2022 / Accepted: 21 November 2022 / Published: 24 November 2022
(This article belongs to the Section Urban Forestry)

Abstract

:
Increasing the availability of greenspaces in built-up areas (GSB) is one of the main challenges to improving sustainability and livability in urban landscapes. Concurrently, the availability of brownfields and permeable spaces offers the chance to increase sustainability through the implementation of Nature-Based Solutions. This work aims to evaluate how land use/cover changes influenced the availability of permeable spaces in Italian built-up areas over the last three decades. These spaces were classified according to population density, vegetation type, and average size, to better characterize recent dynamics (2008–2016) and offer remarks and tips concerning ongoing soil sealing dynamics. According to the findings, despite an overall increase of 41.5% in built-up areas with respect to their 1990 extension, permeable spaces increased only by 25.2% during the same time-span, moving from 49.8% coverage in 1990 to 44.7% today, in relation to the whole national built-up area. Moreover, our in-depth analysis for the 2008–2016 period shows that forested spaces increased by 0.4%, while permeable unforested ones decreased by 0.7%, especially in thinly and intermediately populated areas. Overall, the scarcity of these spaces should be carefully considered when assigning residual vacant lots to new buildings and grey infrastructure, especially in densely populated areas. The proposed methodology provides reliable estimates and represents a starting point to develop advanced monitoring tools supporting sustainable urban policies.

1. Introduction

The world’s urban population has grown from 30% in 1930 to the present 55%, and it is expected to increase up to 60% by 2030 [1]. At the same time, built-up areas are expanding worldwide at a rate double that of the population, posing major societal and environmental challenges [2,3,4,5]. While these areas provide several social and economic opportunities, it is important to note that the intensification of food and energy production, as well as soil sealing associated with them, has had an impact on the structures and functions of ecosystems, and in turn on human wellbeing [6]. Indeed, it is globally accepted that the transition from natural and agricultural lands to urban ones is having the greatest impact on Earth, claiming the need to increase Ecosystem Services (ES) supply within built-up areas [7]. For this reason, in recent years, the well-being of urban citizens has proved to be increasingly linked to the correlation between the growth of built-up areas and the availability of greenspaces [8,9,10]. Specifically, past literature [10] has estimated that many premature deaths in European cities could be prevented by increasing exposure to green spaces, according to the World Health Organization recommendation. However, despite the increasing literature regarding this topic, a standardized definition of urban greenspaces is still missing [11].
The expansion of built-up areas followed different speeds and trajectories in relation to place-specific socio-economic and environmental drivers such as demography, working conditions, and biophysical characteristics of the territory [12,13]. Fertile agricultural lands, pastures, and shrubs are often the land use classes more prone to soil sealing [14,15]. These dynamics also led to different spatial arrangements of residual permeable spaces within built-up areas (e.g., small and fragmented vs. extended; [16]). For instance, some permeable spaces originated from the abandonment process of industrial and commercial functions from core urban zones to suburbs, or as the residual of urban sprawl/infilling development [17,18,19]. Despite these spaces having different nomenclature in literature (e.g., residuals, voids, vacant lands), they are usually defined as temporarily unused, underused, or improperly used permeable spaces within built-up areas, which have not yet been formally assigned to suitable land use [8,20,21,22]. Therefore, in addition to conservation and maintenance of urban greenspaces (e.g., heritage gardens, urban parks and forests), there is a growing emphasis on the restoration and greening of vacant lands (e.g., brownfield sites and open spaces) [18]. Although they are currently characterized by a lower ES supply, these spaces can play a crucial role in improving ecological connectivity and functionality of green infrastructures [8] and helping with water management, microclimate regulation, and air pollution reduction [20,23]. Furthermore, their social perception is usually negative in relation to their degraded status, and they are sometimes associated with vandalism, crime, and a lack of social cohesion [21,24]. Their restoration through greening actions also act in favor of urban décor [25], being an important step toward re-building community, balancing greenspace deficiencies in core neighborhoods, and reducing inequalities [21,26,27].
The coexistence of sealed and permeable spaces within the urban domain claims for careful planning strategies able to guarantee the availability of greenspaces as well as their accessibility and usability, combined with the possibility to create new ones [11,16,28,29,30,31]. Therefore, the need to identify, classify, and monitor permeable spaces is essential to improving urban and environmental planning [32]. However, this step can be critical and ambiguous due to the difficulty of clearly defining the boundaries of an urban area [33], where permeable spaces can be assessed and monitored [11,31,34]. A proxy usually accepted to define urban areas is population density [35]. For instance, the European Commission [36] adopts the Degree of Urbanization scheme (DEGURBA) for identifying urban boundaries. However, this approach leads to the exclusion of sparsely populated areas that, as pointed out by [11], should be considered for the permeable spaces account. As an alternative, urban ecology employs land use/cover databases to define the urban domain. However, classification schemes for land use/cover are proposed as binary. An area is defined as “urban” when the amount of sealed surfaces is predominant, while the remaining is defined as “non-urban” [37], and thus often includes small towns, rural settlements, and road networks. Such a simplified classification scheme could appear unreliable for territories characterized by fragmented, and scattered urban mosaics, where the boundaries between these domains are necessarily smoothed (e.g., Italy; [38,39]). In addition, permeable spaces in urban domains are often in small, fragmented and isolated patches, thus increasing the difficulties related to their large-scale detection and monitoring [40]. Moreover, conceptual differences between land use and land cover hamper the integration of related classification systems. For this reason, the implementation of monitoring approaches based on the integration of inventory and cartographic approaches is particularly useful in urban domains, combining the time/cost-effectiveness of land use inventories with the accuracy of land cover maps in identifying small and residual urban patches [41]. Finally, the assessment and monitoring of permeable spaces should be correlated with those of sealed spaces in order to analyze and better understand the spatial and temporal relationships among all forms of the built environment [42].
This work aims to evaluate how land use and land cover changes (LULCC) influenced the availability and characteristics of permeable spaces in Italian built-up areas over the last three decades. Using Italy as a case study, we proposed a methodology integrating cartographic and inventory approaches, aiming to characterize sealed and permeable spaces within built-up areas and evaluate their changes in the 1990–2016 period nationwide, including 2008 as an intermediate time step. As already proposed by similar works (e.g., [43]), here we refer to “built-up areas” instead of “urban areas” in order to include roads and scattered settlements in our analysis. Indeed, as demonstrated by [43], enlarging information to include greenspaces in built-up areas rather than only those ascribable to “urban” is strategic to better and fully incorporate ecological principles within land and urban planning processes. This is particularly important in countries such as Italy where urban sprawl has increased the fragmentation of settlements and infrastructure [44], leading to several ecological and functional impacts [39]. Our methodological approach (Figure 1) enables us to (i) differentiate LULCC trends in two different time steps (1990–2008 and 2008–2016) and (ii) define permeable spaces according to their type, location, size, and population density classes, offering insights regarding Nature-Based Solutions (NBS) implementation towards sustainable urban development.

2. Materials and Methods

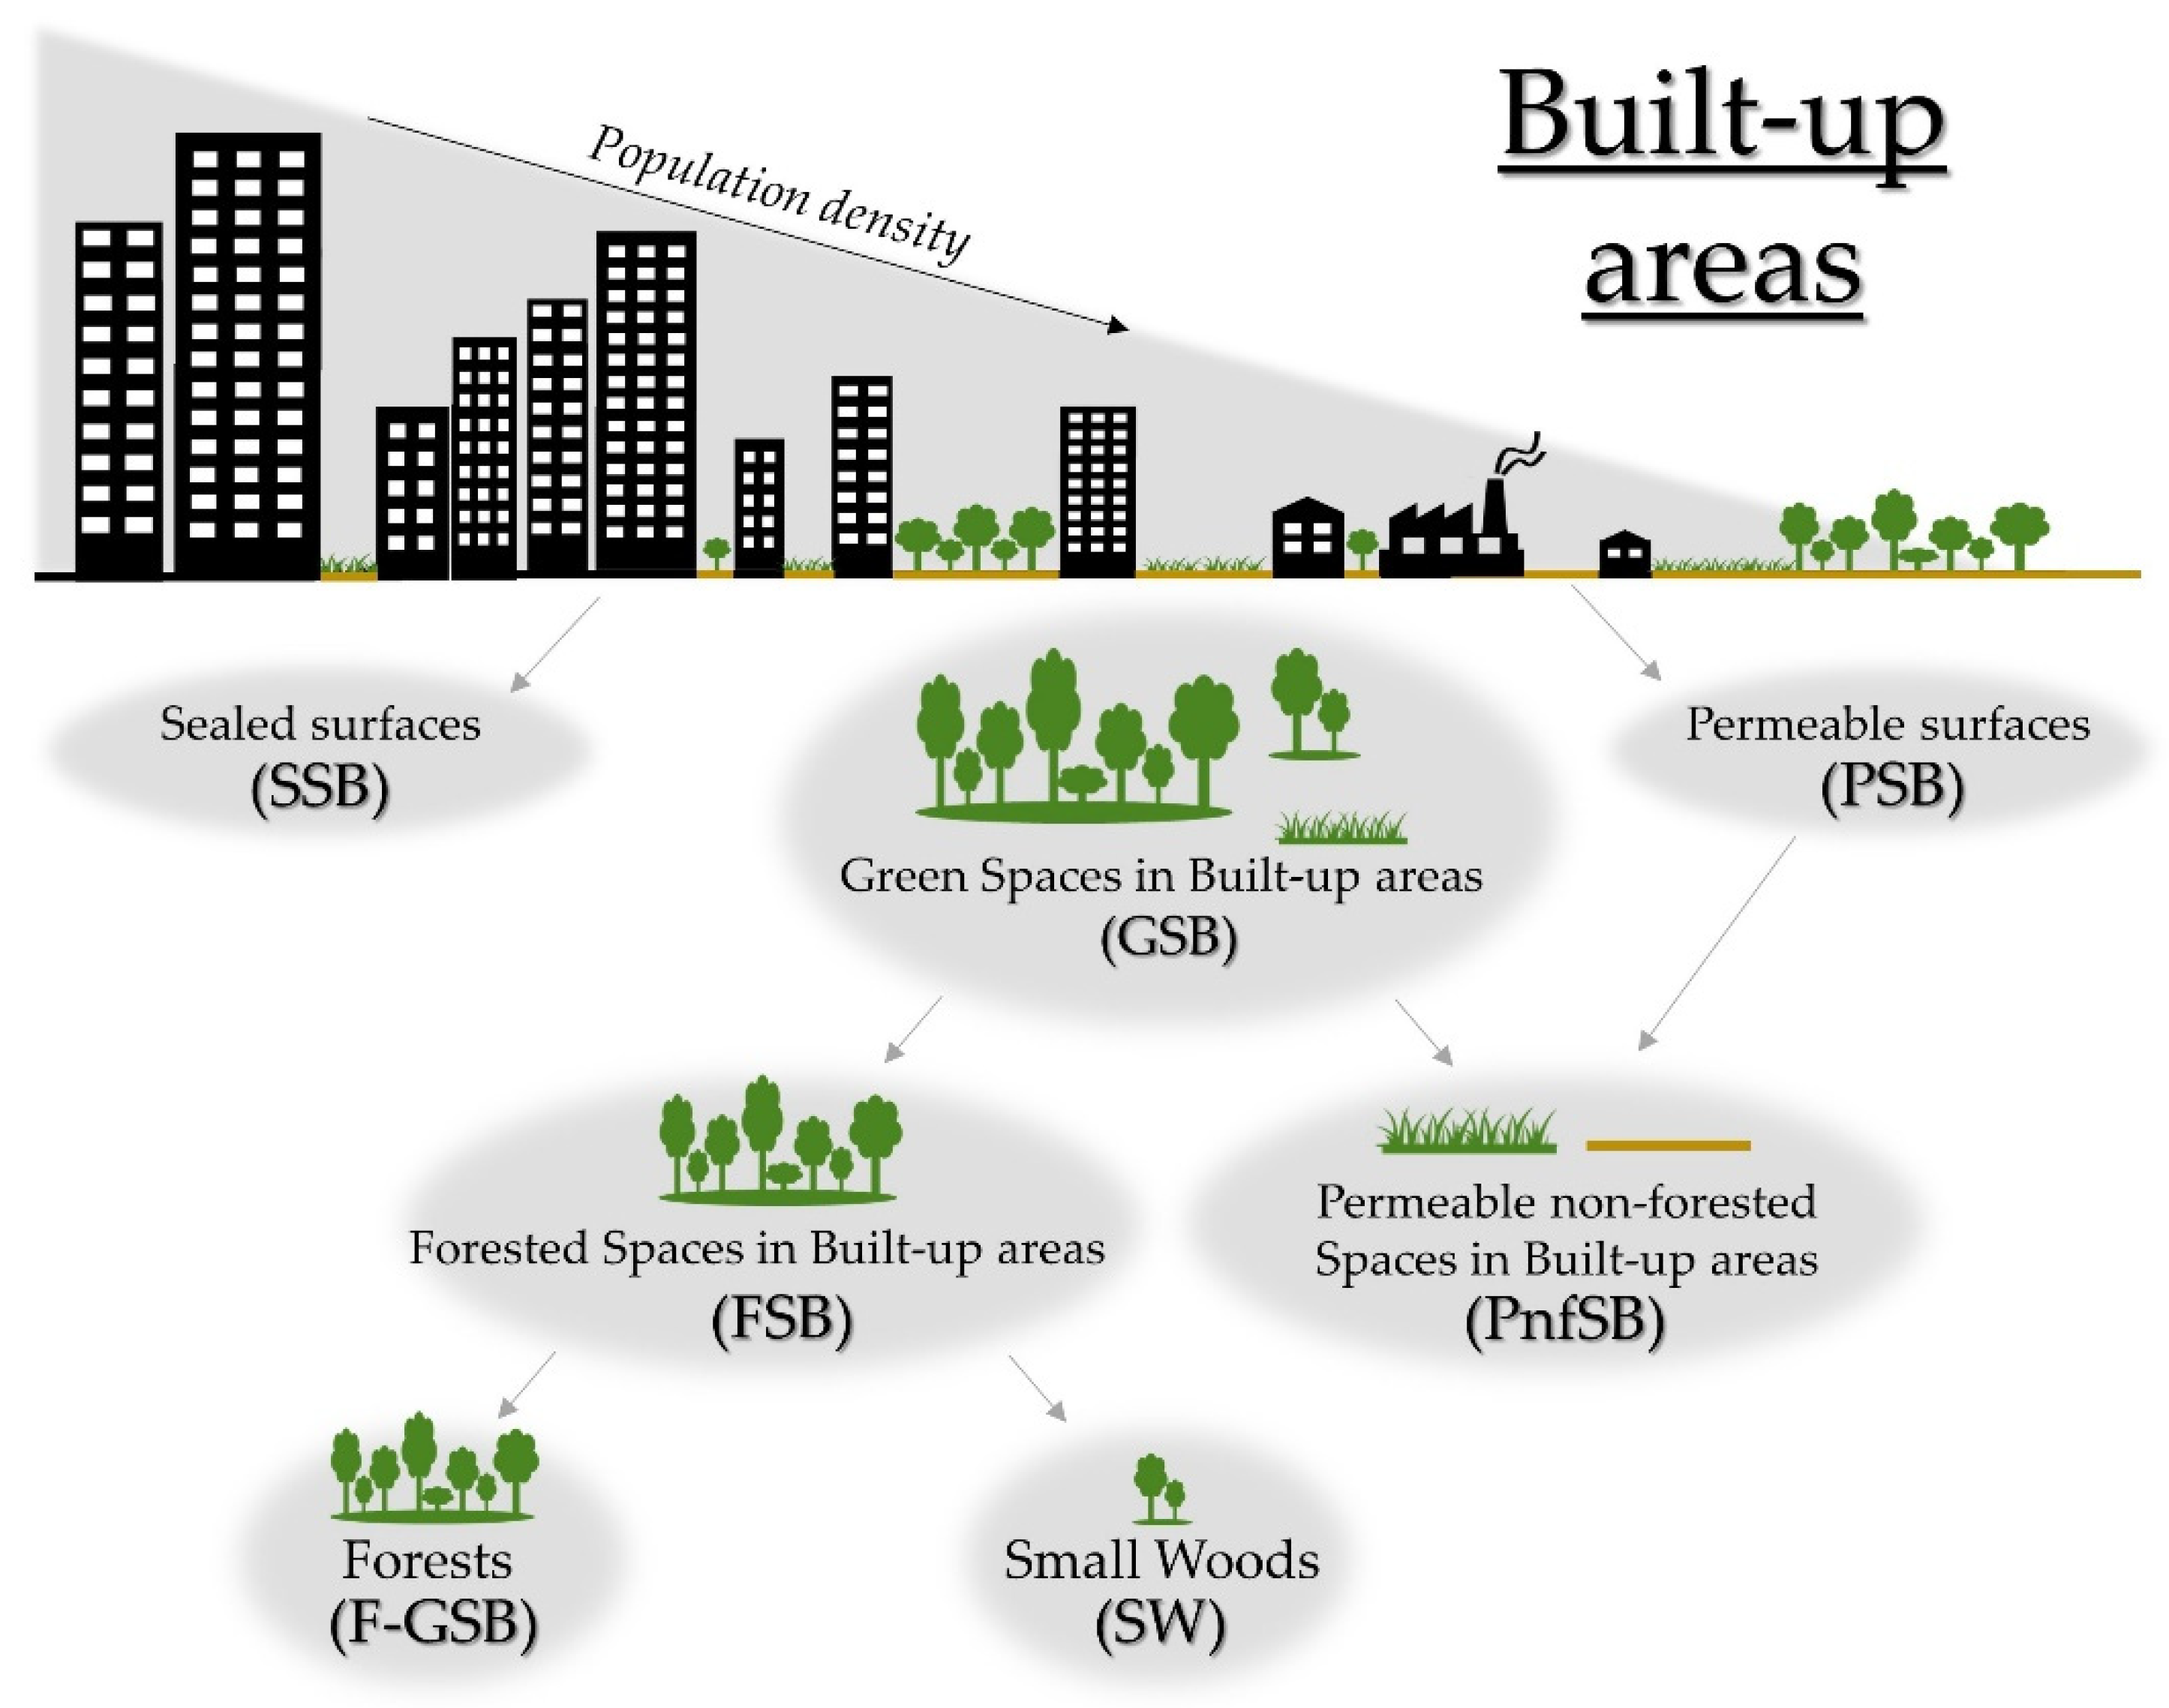
2.1. Identification and Characterization of Sealed and Permeable Spaces within Italian Built-Up Areas in 1990, 2008, and 2016

The study area covers the entire Italian territory, equal to 302,000 km2. Between 1990 and 2016, the population increased in Italy from 56.7 million to 60.6 million inhabitants [45]. In this period, built-up areas’ expansion has been mainly shaped by the migration of people from inner marginal zones in mountain areas towards areas characterized by greater socio-economic opportunities, mostly in the plains and along the coast [46,47]. Indeed, during this time span, built-up area expansion (+1.73%) was counterbalanced by the reduction of croplands (−2.86%) and grasslands (−1.62%) and the subsequent forest expansion (+1.55%) [48]. These socio-economic drivers, linked to the wide geomorphological heterogeneity of the Italian territory, triggered a distinctive case of urban sprawl. In depth, soil sealing mainly occurred in croplands close to the urban fringes [39].
In a first step, we identified Italian built-up areas through the Land Use Inventory of Italy (IUTI) [49]. IUTI was implemented by the Italian Ministry of the Environment, Territory, and Sea as a tool for estimating land use changes in Italy over the last three decades. Applying a tessellated stratified sampling scheme, the entire Italian territory was covered by a grid of 25-hectare squares, with randomly assigned sample points within each square [50]. Based on high resolution aerial photos, a land use class was assigned to each sample point through photointerpretation. IUTI classification includes six land use classes, i.e., forests, cropland, grassland, wetland, settlements, and other lands. The dataset is provided in historical series for 1990, 2000, and 2008. The Supporting National Registry for forest carbon sinks, IUTI classification agrees with the Good Practices Guidance for Land Use, Land Use Change, and Forestry Classification System [51], defining settlements as “an area characterized by presence of residential buildings, industry, commerce and services infrastructures, and areas used for the transit and transport of people and things” [49]. By using a one-per-stratum stratified sampling approach [48], 10% of the original sample points were selected and classified at 1990, 2008, and 2016, thus expanding the original time series (Figure 2).
In a second step, we classified the whole sample of points in built-up areas at the three reference times (i.e., 1990, 2008, and 2016) according to three population density classes. We used the JRC Global Human Settlement Database [52] that provides population density layers, expressed as the number of people per 1 km2 cell, for the following years: 1975, 1990, 2000, and 2015. We conducted all the analysis in a GIS environment. We used three population density thresholds according to DEGURBA classification [36], specifically: i. thinly populated areas (less than 300 inhabitant/km2); ii. intermediately populated areas (between 300 and 1500 inhabitant/km2); and iii. densely populated areas (over 1500 inhabitant/km2). We adopted these population density thresholds since the European Commission proposed them to respectively discriminate i. rural areas; ii. towns and suburbs; and iii. urban centres, and in turn allowing statistical comparisons among these domains [53]. In our analysis, we employed 1990-population density layer to classify built-up areas at 1990, while for the classification of both built-up areas at 2008 and 2016, we accepted the 2015 population density layer.
In a third step, we conducted a diachronic photo-interpretation process on high resolution aerial photos of built-up points in order to distinguish points characterized by sealed soil from those that are permeable in 1990, 2008, and 2016.
Furthermore, only for the 2008–2016 period, we classified permeable spaces within Italian built-up areas into permeable non-forested spaces and forested greenspaces. For this additional analysis, we used the Copernicus High Resolution Layers (HRL), available for Italy only in 2012 and 2018 (please see Figure 2). HRL are a set of four land cover layers (i.e., imperviousness, grassland, forests, and water and wetlands) [54], provided with a 20-m resolution for 2012, and with a 10-m resolution for 2018. Using ArcGIS software (Version 10.0, Redlands, CA, USA), we converted the original HRL raster layers into vectors in order to obtain two unified land cover maps (for the two-time steps of 2012 and 2018) with four land cover classes, specifically: i. sealed soil (derived from the HRL imperviousness class); ii. trees and forest coverage (derived from the HRL forests class); iii. permeable soil (derived from all HRL classes excluding imperviousness, forests, water and wetlands); and iv. others (derived from the class including water bodies, wetlands, and unclassified zones). Accordingly, to identify the different polygons of land covers within built-up areas in 2008 and 2016 we classified them as follows:
  • “Sealed Spaces within Built-up areas” (SSB), when built-up sampling points intercept the polygons of sealed soil;
  • “Permeable non-forested Spaces within Built-up areas” (PnfSB), when built-up sampling points intercept the polygons of permeable soil;
  • “Forested Green Spaces within Built-up areas” (F-GSB more than 0.5 ha and SW less than 0.5 ha), when built-up sampling points intercept the polygons of trees and forest coverage.

2.2. Land Use and Land Cover Estimation

We calculated coverage (A) in 1990, 2008, and 2016, and abundance (N) and average patch size (a) in 2008 and 2016 of sealed and permeable spaces within Italian built-up areas applying the design-based estimation approach developed by [55], evaluating relative changes in intermediaries and overall reference periods. Let Q be the extent of the national area covered by the n square grid cells fully overlapping the entire territory under the IUTI sampling scheme, the estimate of A is given by:
A ^ = p ^ Q
where:
p ^ = n u n
where nu is the number of sample points classified as small patches (or their sub-types). The variance of A can be estimated as:
v a ^ r ( A ^ ) = Q 2 n u ( n n u ) n 2 ( n 1 ) .
Let S and aj be, respectively, the set of small patches (or their sub-types) selected by the n sampling points and the size of the jth patch. Whether aj values are negligible with respect to Q, the estimate of N is given by:
N ^ = Q n j S 1 a j ,
with estimated variance equal to:
v a ^ r ( N ^ ) = 1 n ( n 1 ) ( Q 2 j S 1 a j 2 n N ^ 2 ) .
Accordingly, the estimate of a is given by A/N, i.e.,
a - ^ = n u j S 1 a j ,
with estimated variance equal to:
v a ^ r ( a - ^ ) = Q 2 N ^ 2 n ( n 1 ) j S ( 1 a - ^ a j ) 2 .
Considering the standard normal distribution of variables, we performed the statistical t-test to assess the significance of changes in estimates between 2008 and 2016, assuming that changes are i. “extremely significant” for p value < 0.001, ii. “very significant” for p value < 0.01, iii. “significant” for p value < 0.05, iv. “poor significant” for p value < 0.1, and v. “not significant” for p value > 0.1.

3. Results

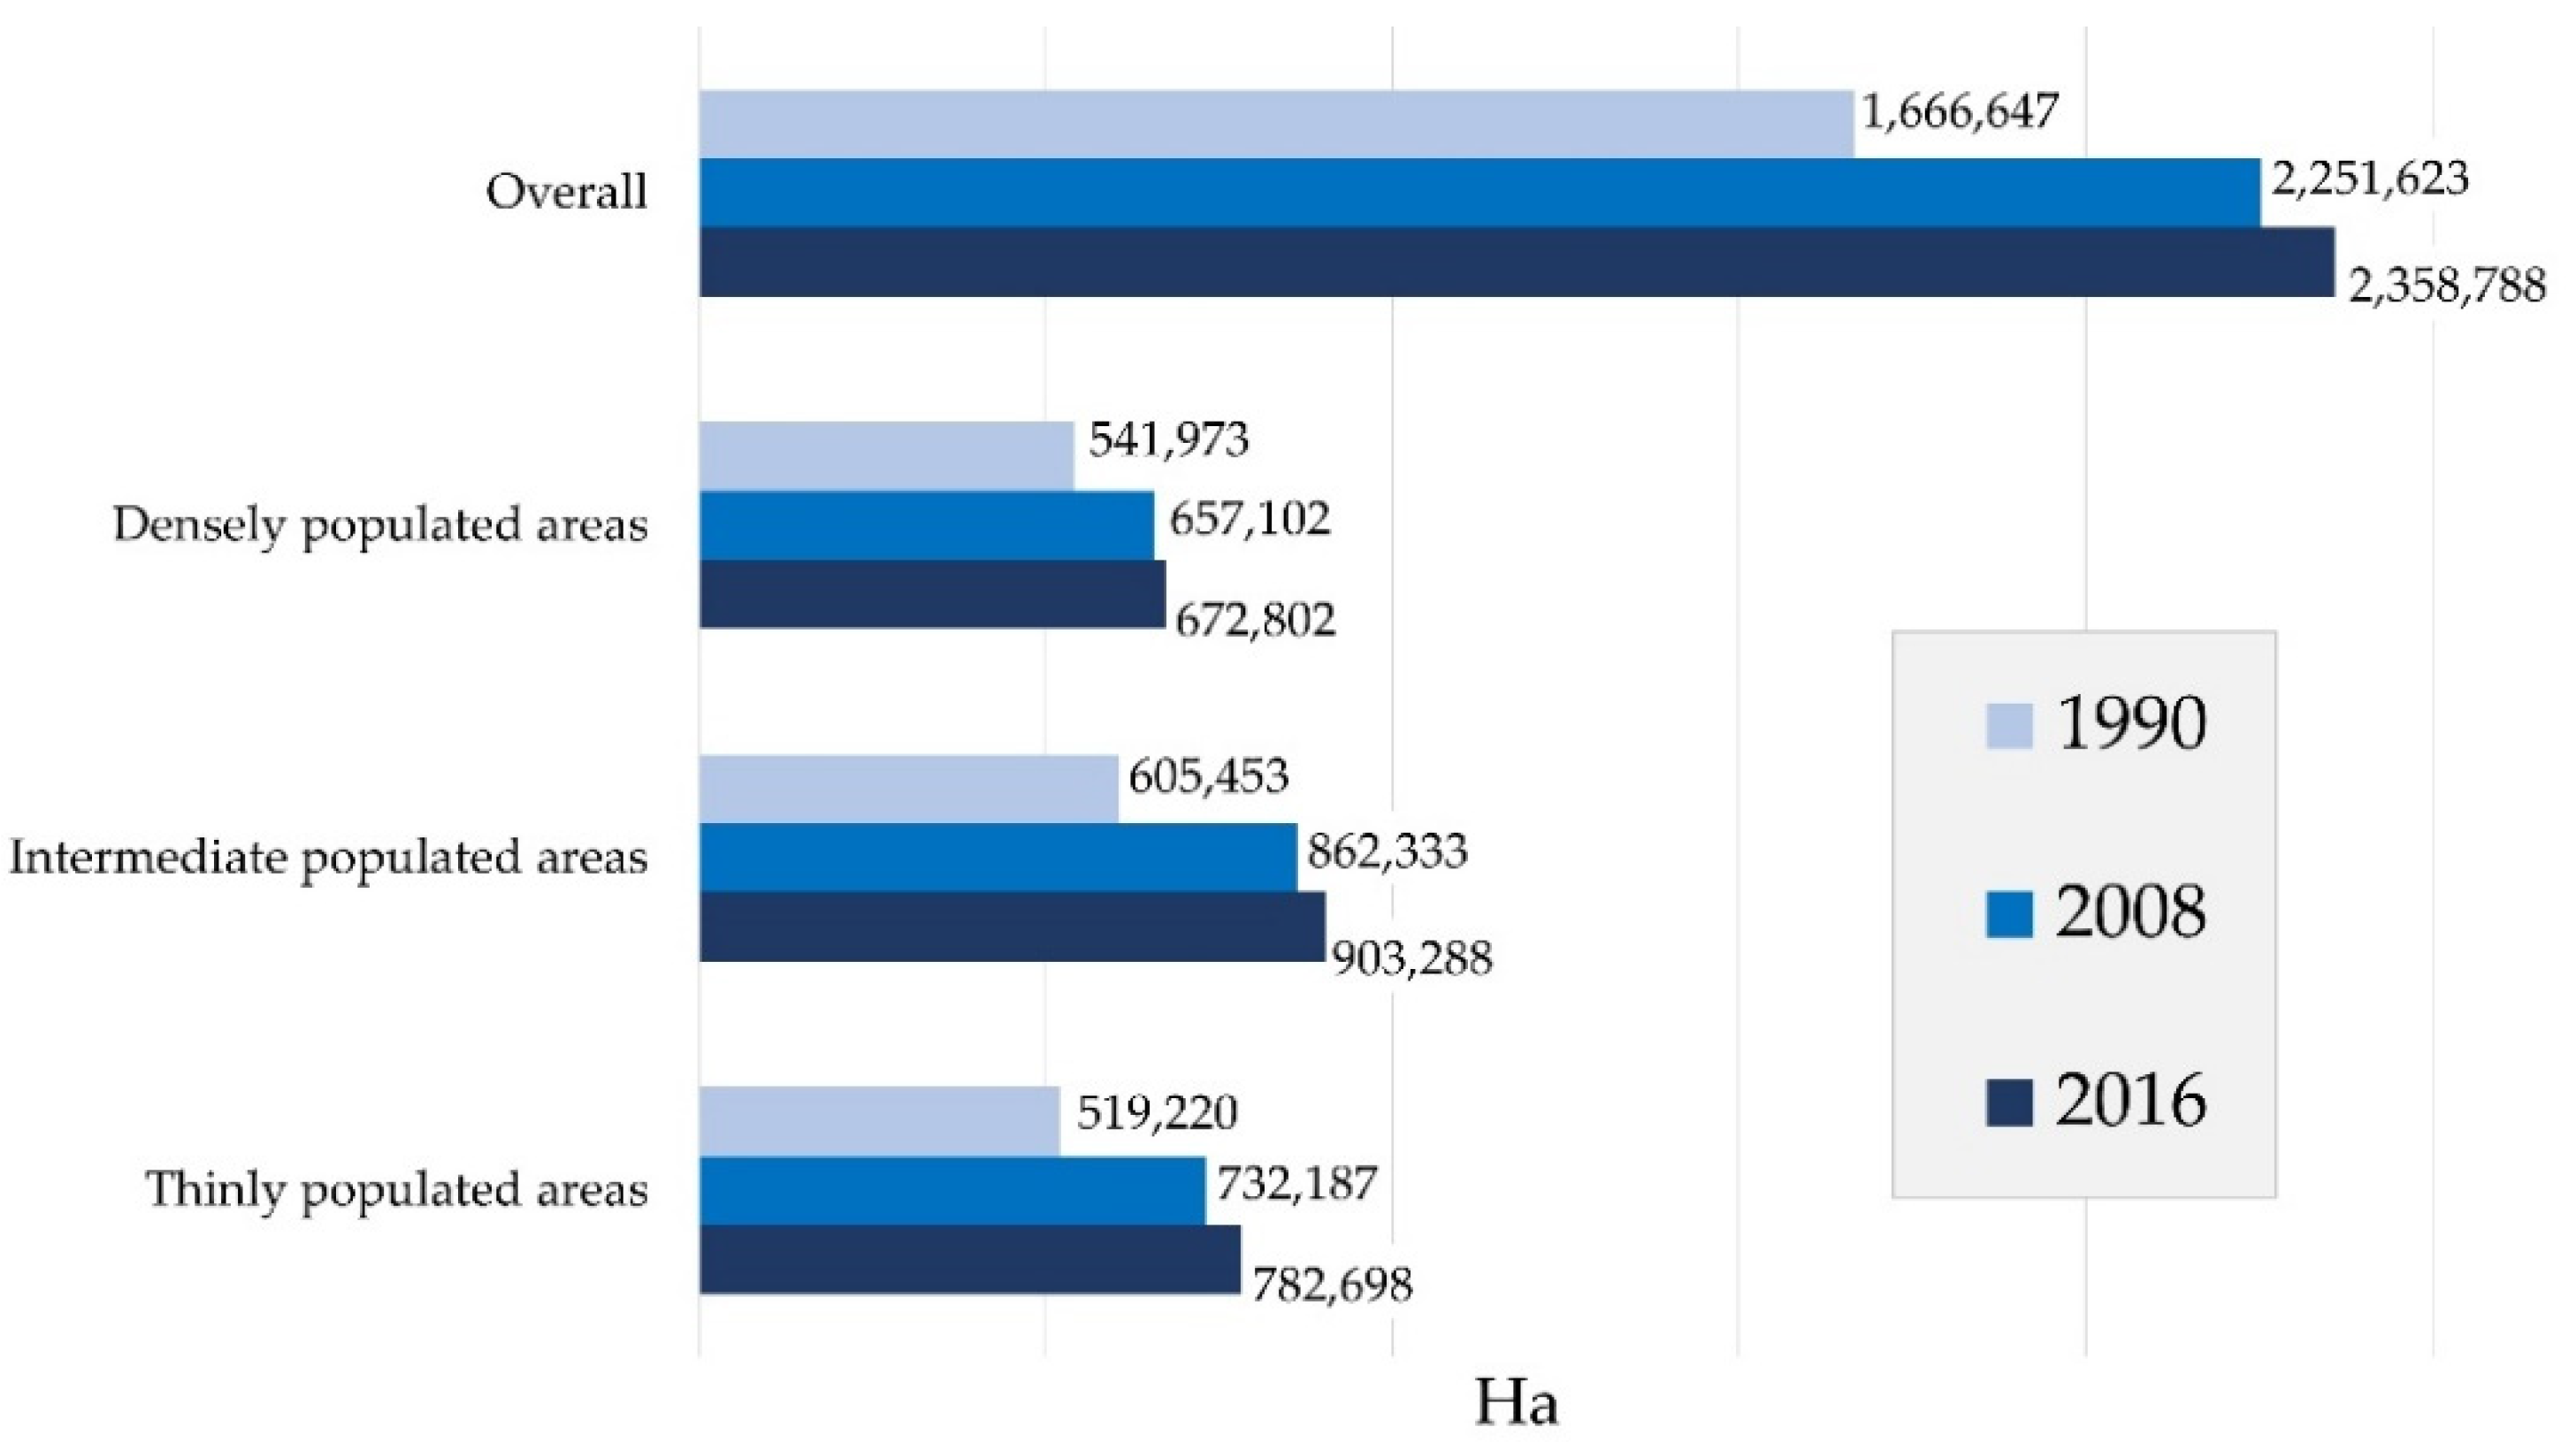
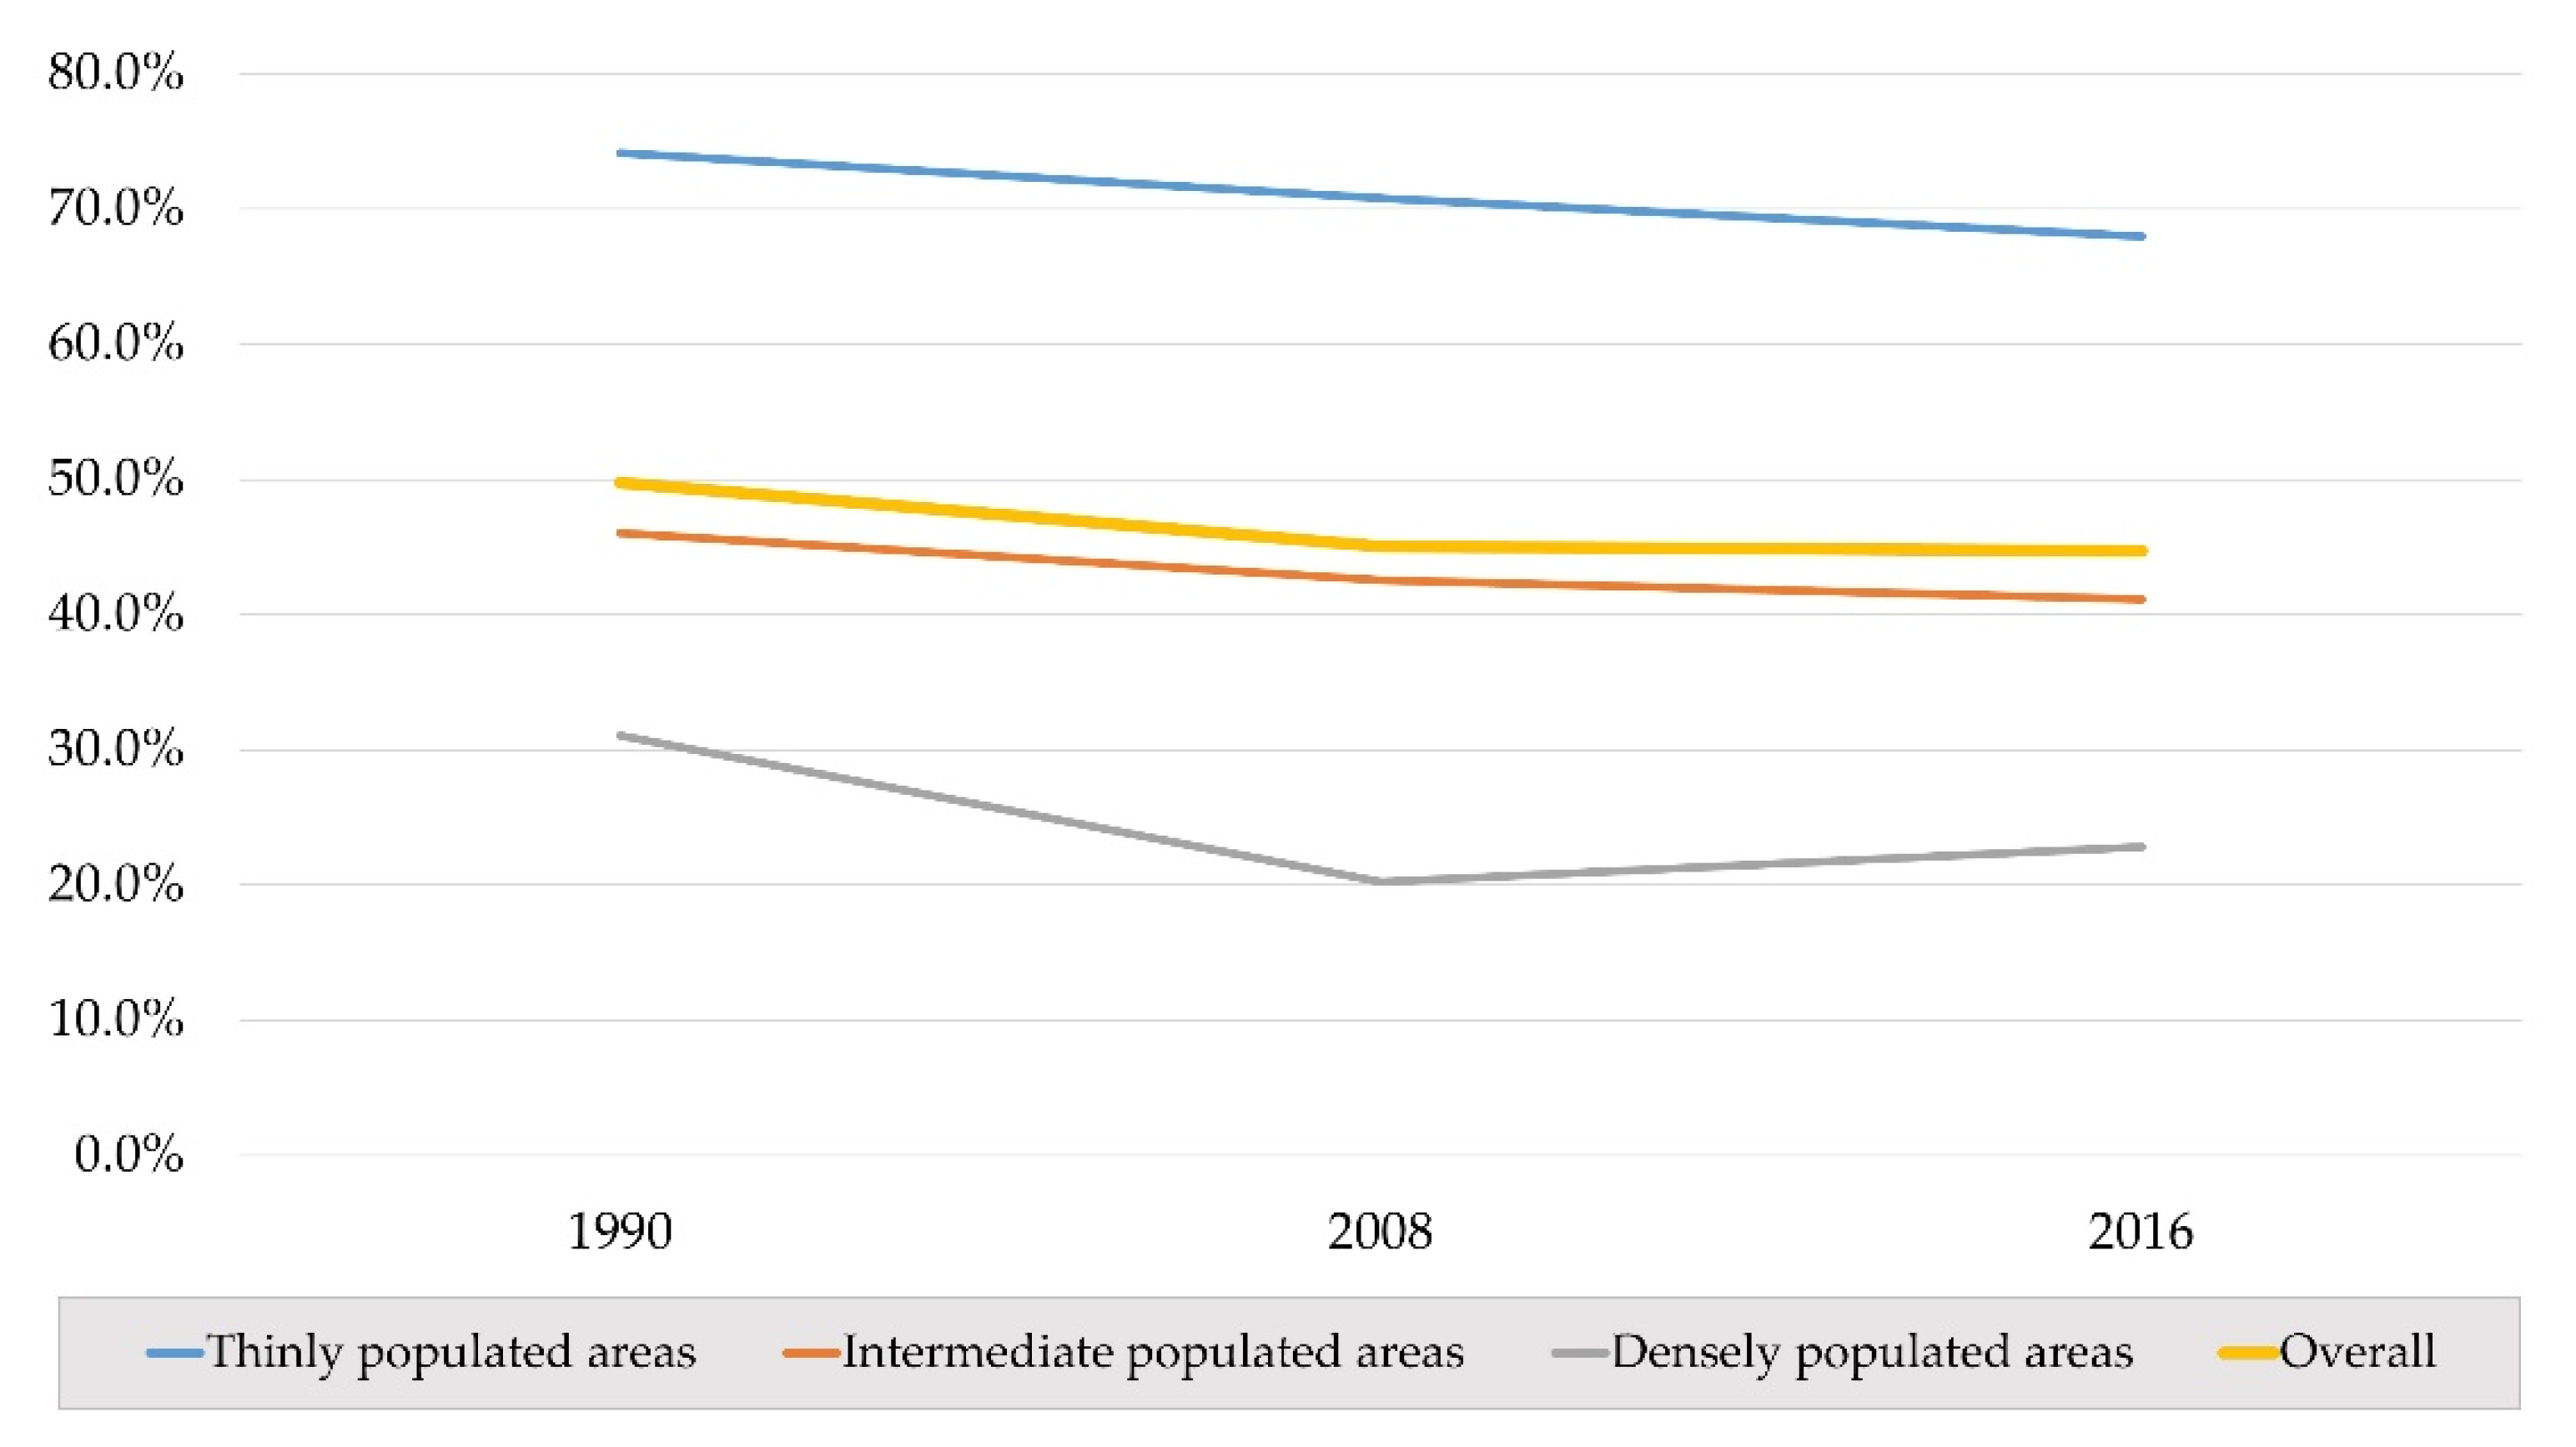
3.1. Changes in Built-Up Areas, Soil Sealing, and Permeability between 1990 and 2016

Between 1990 and 2016, built-up areas in Italy increased by 692,142 ha (+41.5% compared to 1990), passing from 5.5% to 7.8% of the whole national surface. This expansion is different based on the population density of urban areas. Indeed, as clearly shown by Figure 3, this expansion is emphasized in thinly and intermediately populated areas (+50.7% and +49.2% with respect to 1990, respectively), while less evident in densely populated ones (+24.1% with respect to 1990). Regarding the two time steps analysed (i.e., 1990–2008 and 2008–2016), our results show an overall reduction of the annual relative increase of built-up areas compared to the starting point (i.e., 1990 or 2008). Indeed, the annual relative increase of built-up areas passed from 1.9% in the 1990–2008 period to 0.6% in 2008–2016 (−69%). In this case, the shrinking of the relative annual built-up area increase is higher in intermediate and densely populated areas (−75% in both), while it is lower in thinly populated ones (−62%).
The land cover analysis within built-up areas shows that in 2016, about 44.7% of the Italian built-up area is permeable, a decrease of 10.2% compared to the permeability in 1990 (49.8%) (Figure 4). The permeability within built-up areas is quite heterogeneous among areas with different population densities, with a higher permeability in the thinly populated areas (68.0% of built-up areas in 2016) against the intermediate and densely populated ones (41.1% and 22.8% of built-up areas in 2016, respectively). The reduction of permeability in built-up areas from 1990 to 2016 follows the population density gradient. Indeed, compared to the baseline (i.e., 1990), the lower relative reduction of permeability is recorded in thinly populated areas (−8.3%), while the higher is in densely populated ones (−26.5%). Extended data are reported in Table S1 (please see Supplementary Materials).

3.2. Changes in Coverage, Abundance and Average Size of Permeable Spaces within Italian Built-Up Areas and Their Changes between 2008 and 2016

Permeable spaces in built-up areas are constituted by PnfSB, F-GSB, and SW. The absolute values of their coverage, abundance, and average size in 2008 and 2016, as well as their absolute changes in this timespan, are shown in Table 1 along with estimates of the accuracy and significance of the changes. In 2016, PnfSB always had the highest relative coverage within the permeable spaces in built-up areas (82.1%), ranging from 86.4% in thinly populated areas to 69.2% in densely populated ones. F-GSB in 2016 represented 13.5% of the permeable spaces in built-up areas nationwide, ranging from 11.7% in thinly populated areas to 19.6% in densely populated ones. The same trend can be seen for SW, which account for 4.4% of permeable built-up areas nationwide, ranging from 1.9% in thinly populated areas to 11.2% in densely populated ones.
The total coverage of permeable spaces in built-up areas increased by 35,722 ha from 2008 to 2016 (975,870 ha and 1,011,592 ha, respectively). At the national level, this net increase is mostly due to the increase in SW and PnfSB (+240.4% and +2.5% compared to their coverage in 2008, respectively). In contrast, in this period, F-GSB decreased by 15,699 ha (−10.3% compared to its coverage in 2008). The net increase in SW from 2008 to 2016 is more emphasized passing from thinly to densely populated areas (+207.1% and +265.0%, respectively). The net increase in PnFSB from 2008 to 2016 is mostly due to their increase in thinly populated areas (+7.3%). The net decrease of F-GSB from 2008 to 2016 is mostly due to their reduction in thinly populated areas (−28.2% with respect to their coverage in 2008), only partially balanced by their expansion in densely populated ones (+56.1%). In fact, it is interesting to highlight that F-GSB passed from a total coverage of 18,657 ha in 2008 to a total coverage of 29,124 ha in 2016 in densely populated areas, thus sensitively increasing their relevance in these areas with respect to the overall availability of permeable spaces (i.e., from 14.4% to 19.6%).
Looking at the trends in terms of abundance and average size of both sealed (i.e., SBS) and permeable spaces (i.e., PnfSB, F-GSB, and SW), a generalized increase in the number of patches is visible (Table 1). This increase is reflected in a generalized reduction in the average size of the patches. Compared to the average size of the patches in 2016, it is interesting to note that it increases for SBS passing from thinly to densely populated areas (0.42 ha and 6.39 ha, respectively), while it generally decreases following the same population gradient for PnfSB (from 1.28 ha to 0.23 ha) and F-GSB (from 6.28 ha to 1.92 ha).

4. Discussion

During the 1990–2008 period, the relative increase of built-up area, compared to its baseline, was about seven times greater than the population increase (35% vs. 5%). This finding confirms what has already been detected by the European Commission in terms of a deceleration in urbanization in last decades (i.e., European annual rate of built-up expansion halved in last 3 decades, passing from over 1000 km2/year of the 1990–2006 period to 539 km2/year in the 2012–2018 period; [56]). However, even if at a slower rate with respect to the 1990–2008 period, built-up areas still continued to increase between 2008–2016. The use of the 2008 time-step is important to better characterize and understand the trend of these changes over the entire investigated period. Moreover, the use of this reference year is interesting, being coincident with a dramatic economic (and building sector) crisis in Italy [57]. The expansion of built-up areas is inversely correlated to population density, with the highest relative increase in thinly and intermediately populated areas. This trend is also confirmed by the reduction of the annual rate of built-up area expansion from 1990–2008 to 2008–2016, which is particularly emphasized in densely populated areas (−75% compared to the annual expansion rate of the 1990–2008 period). Thus, the higher expansion of built-up areas in less populated areas seems to confirm the “sprinkling” model described by [39], which is related to a fragmented and scattered spread of built-up areas towards peri-urban and rural areas [58]. This expansion model is clearly related to a general higher decrease in ES supply than a more compact one, as described by [13] with particular regard to biodiversity conservation (i.e., connectivity of natural and semi-natural habitats) and by [46] for C sequestration. From a policy perspective, these results advocate appropriate recommendations from the Italian National Strategy on Urban Greenspaces, e.g., the implementation and maintenance of green belts around core urban zones [59]. Furthermore, greening actions located in the urban fringes ensure an important filtering function for rural/natural matrix around cities [60], reducing air pollution [61], acoustic noise [62], and soil contamination [63] produced by human settlements and industrial activities [64].
As for built-up areas, the permeability within these areas decreased from 1990 to 2016 nationwide, passing from 49.8% to 44.7%. This value is consistent with that estimated by [43] (45.2%) and with that of other European countries (i.e., Germany = 52%; [65]). It is also in line with available information on soil sealing in Europe, ranging between 23% and 78% [65]. In contrast to built-up area expansion, soil sealing is relatively more emphasized following the population density gradient. Hence, in relative terms, densely populated areas lost about 26.5% of their permeability in 2016 compared to 1990. The residual permeability of these areas is currently less than a quarter of the total area (22.8%). The scarcity of such spaces should be critically reflected within the urban planning arena considering that in densely populated areas (i) direct beneficiaries of ES are higher than in thinly populated ones, thus maximizing their return in terms of human wellbeing and capacity to face multiple urban challenges [66], and (ii) the lower the availability of permeable spaces where implementing NBS (e.g., scarcity), the higher their relative value in strategic terms. These concepts are now particularly evident in policy and planning discourses in Italy [58], where envisaged policies promote and finance NBS implementation in densely populated areas of the country to enhance human wellbeing and sustainability while mitigating climate change impacts [67]. However, the availability of these areas in such densely populated contexts is limited, thus needing particular attention within planning instruments. It is important to underline that although densely populated areas occupy only 28% of the surface (672,801 ha), they host about 50% of the Italian population (29.9 million inhabitants).
Fortunately, the decrease of permeable spaces in densely populated areas seems to have already inverted in the 2008–2016 period with respect to the former. Accordingly, the permeability raised from 20.3% in 2008 to 22.8% in 2016 (Figure 4). Permeable spaces without trees (i.e., PnfSB) represent most of the permeable spaces in built-up areas (82.1%), but their availability decreases following the population density gradient. Indeed, PnfSB only occupies 69.2% of permeable spaces in densely populated areas in 2016, decreasing by 12.9% compared to 2008 (−3640 ha). Again, the scarcity of these spaces should be carefully considered when assigning residual vacant lots to new buildings and grey infrastructure, especially in densely populated areas. Hence, despite their current low ecological value, they are de facto available to “re-create”, implement, and enhance greenspaces and NBS in general [68]. Considering recent national funding initiatives [67], i.e., about €330 million for tree planting projects in 14 Italian metropolitan cities with expected 6600 ha of new urban forests [69,70], PnfSB in densely populated areas represent a great resource for interventions that avoid expensive de-sealing options. In this regard, the value of forested greenspaces from the standpoint of urban planning is consistent with the potential value of brownfields regeneration (e.g., [18]), which represents important resources for sustainable urban development through NBS implementation [71] (e.g., conversion to urban forests). This is also pointed out by [16], where restoration and regeneration of open greenspaces in parallel with the expansion of higher-density housing appear to offer the greatest potential to foster population and economic growth at the least cost to nature.
The lower availability of PnfSB from 2008 to 2016 in densely populated areas is well compensated by the sensitive increases of forested greenspaces, both F-GSB and SW (+10,466 ha and +12,059 ha, respectively). Particularly, SW tripled their relative coverage with respect to permeable spaces in built-up areas from 2008 to 2016 (from 3.5% to 11.2%). The same trend is observed for SW in intermediate and thinly populated areas (from 1.5% to 5%, and from 0.6% to 1.9% with respect to their total permeable surfaces). In line with estimates in [43], the SW/F-GSB ratio increases from thinly to densely populated areas. Moreover, we clearly found that this ratio increased in all these domains from 2008 to 2016, when SW arrived to represent 14.2%, 26.9%, and 36.3% of the total built-up areas covered by trees in thinly, intermediately, and densely populated areas, respectively. Moreover, our results show that the average patch size of F-GSB decreases along the population density gradient (from 6.28 ha in thinly populated areas to 1.92 in densely populated ones), thus confirming the strategic role of maintaining small greenspaces within the urban mosaic, especially in densely populated contexts where there is a high demand of ES. Thus, especially in these contexts, the availability of small permeable spaces convertible to SW offers the opportunity to (i) hamper soil sealing processes, then represent a viable conservation strategy; (ii) create and reinforce a diffuse and pervasive green mosaic of small patches working together in terms of structure, ecological functionality, and ES supply [72]. Small GSB patches in densely populated areas play a very important role in enhancing their livability and quality of life, thus even increasing their attractiveness in the future [44]. For instance, the role of SW (often referred to as Trees Outside Forests) has proven to be more valuable in ameliorating aesthetic preferences when moving from rural to densely populated areas [73]. In addition, the expansion of F-GSB in densely populated areas from 2008 to 2016 is relevant (from 18,657 ha to 29,124 ha). Larger patches of F-GSB play a key role in preserving biodiversity [74], increasing cooling effects [75], and reducing nutrient leaching [76]. Large crowns and foliar biomass help sequester gaseous pollutants from the urban atmosphere. The concentration of particulate matter (PM1) was found to be lower in urban parks, and urban and peri-urban forests were found to abate up to 20% of the PM1 emitted from anthropogenic sources [77]. However, the reduction in average patch size of F-GSB in densely populated areas (about −0.37 ha) calls attention to their better inclusion in urban planning instruments and the adoption of effective protection initiatives against soil sealing. In fact, among other things, the fragmentation of greenspaces is recognized as a discriminatory variable affecting ES supply [78]. Contrarily to densely populated areas, the shrinking of F-GSB, especially in thinly populated areas (−28.2% of their coverage respect to 2008) requires in-depth analysis, especially regarding forest types more susceptible to this phenomenon and thus related impacts in terms of ecosystem functionality, biodiversity conservation, and ES supply. Indeed, as demonstrated by [13], applying different land-use changes scenario in Lazio Region (Italy), not only the magnitude but also the spatial arrangement of these “nature to urban” shifting has relevant impacts in terms of comprehensive ecological integrity and functionality of the landscape. In general terms, the increasing coverage and number of patches of both sealed and permeable spaces considered in this work, along with a generalized decrease in patch size, can be linked to the fragmentation effect related to the chaotic and dispersed model of urban sprawl in Italy [39,58]. Fragmentation, together with the loss of permeable soils due to soil sealing, might be carefully considered by future policy and planning initiatives at both national and local scales.
Lastly, in order to simplify the evaluation of GSB, with particular regard to their relevance for public health and wellbeing, numerous indicators that normalize the extent of greenspaces with respect to the number of inhabitants are adopted (e.g., per capita area in ISO 37120 Sustainable development of communities; [79]). From 2008 to 2016, the availability of greenspaces (i.e., F-GSB and SW) increased from 27.8 to 30.4 m2/inhabitant, with the greater increase in densely populated areas where, thanks to the expansion of such spaces, the availability of GSB more than doubled, passing from 8 to 18 m2/inhabitant. Accordingly, the per capita availability of GSB is, on average, beyond the 9–10 m2/inhabitant threshold suggested by the national legislation and the World Health Organization [80]. In thinly populated areas, due to the reduction of forested greenspaces (F-GSB and SW), the per capita availability of forested GSB decreased from 106 to 86 m2/inhabitant from 2008 to 2016. However, this data is balanced by greater availability of PnfSB from 2008 to 2016 (from 505 to 542 m2/inhabitant), usable for planting, and NBS initiatives supporting a greener and more sustainable landscape mosaic with widespread possible benefits even in much denser and more crowded urban contexts.

5. Conclusions

In this research, we found dissimilar trajectories and intensities both in time and space with regard to the expansion of Italian built-up areas, soil sealing and changes in coverage and abundance, and the average size of sealed and permeable spaces between 1990 and 2016. We can support the evidence of a deceleration in built-up areas’ expansion in Italy after 2008, as already shown in literature. Although to a lesser extent, the expansion of built-up areas still causes an overall reduction in the percentage of available permeable soil, resulting in further grey. Due to urban sprawl, soil sealing primarily affects intermediate and thinly populated built-up areas, leading to an increase in landscape fragmentation moving from core urban zones towards rural areas. We provided an in-depth observation regarding the dynamics of permeable spaces within Italian built-up areas. Our results highlighted that, on the one hand, forested spaces increased their overall percentage of coverage in the period 2008–2016, confirming how trees and forests can be considered one of the main constraints to urban expansion. On the other hand, permeable non-forested spaces showed greater changes, doubling in abundance and contracting in coverage and average size. Their higher vulnerability to soil sealing is probably due to an informal land use condition in urban areas (i.e., vacant lots) and their frequent overlap with low-value agricultural land close to settlements. Being residually permeable spaces, they represent an extended portion of territory and should be strongly considered and included in regeneration and restoration strategies, especially in densely populated contexts. Moreover, our findings advocate the importance of NBS implementation in intermediate and thinly populated areas, where greenspaces play key roles as stepping stones to link greenspaces in core zones to the rural/natural matrix. Furthermore, the enhancement of urban green infrastructures should be combined with conservation and regeneration actions for agricultural lands close to the urban fringe.

Supplementary Materials

The following supporting information can be downloaded at: https://www.mdpi.com/article/10.3390/f13121983/s1, Table S1: Coverage of sealed and permeable spaces in Italian built-up areas in 1990, 2008, and 2016 as a whole and according to different population densities.

Author Contributions

Conceptualization, L.S., B.L. and M.d.C.; methodology, L.S.; software, M.d.C. and E.D.P.; validation, L.S. and B.L.; formal analysis, M.d.C., L.S., E.D.P. and B.L.; resources, B.L. and M.M.; data curation, L.S., B.L., and M.O.; writing—original draft preparation, M.d.C. and L.S.; writing—review and editing, L.S., E.D.P., M.O., B.L. and M.M.; supervision, L.S., B.L. and M.M.; project administration, B.L.; funding acquisition, B.L. All authors have read and agreed to the published version of the manuscript.

Funding

This work has received funding from the research project “Establishing Urban FORest based solutions In Changing Cities” (EUFORICC), cod 20173RRN2S, funded by the PRIN 2017 program of the Italian Ministry of University and Research (project coordinator: C. Calfapietra). We thank the National Biodiversity Future Center funded by the Italian National Recovery and Resilience Plan, consistent with the priorities of the European research agenda and with the contents of the National Research Plan 2021–2027 for funding to carry out this work.

Institutional Review Board Statement

Not applicable.

Informed Consent Statement

Not applicable.

Data Availability Statement

Not applicable.

Acknowledgments

Thanks to Marzia Panaccione for her useful comments to an early version of this work.

Conflicts of Interest

The authors declare no conflict of interest.

Abbreviations

DEGURBADegree of Urbanization
ESEcosystem Services
F-GSBForested Green Spaces in Built-up areas (more than 0.5 ha in coverage)
FSBForested Spaces in Built-up areas
GISGeographic Information System
GSBGreen Spaces in Built-up areas
HRLCopernicus High Resolution Layers
IUTILand Use Inventory of Italy
LULCCLand Use and Land Cover Changes
NBSNature-Based Solutions
PM1Particulate Matter (particles < 1 μm in size)
PnfSBPermeable non-forested Spaces in Built-up areas
PSBPermeable Spaces in Built-up areas
SSB Sealed Spaces in Built-up areas
SWSmall Woods in built-up areas (less than 0.5 ha in coverage)

References

  1. United Nations (UN). The World’s Cities in 2018; Department of Economic and Social Affairs-Population Division: New York, NY, USA, 2018; ISBN 978-92-1-151549-7. [Google Scholar]
  2. Angel, S.; Parent, J.; Civco, D.L.; Blei, A.; Potere, D. The Dimensions of Global Urban Expansion: Estimates and Projections for All Countries, 2000–2050. Prog. Plann. 2011, 75, 53–107. [Google Scholar] [CrossRef]
  3. Foley, J.A.; DeFries, R.; Asner, G.P.; Barford, C.; Bonan, G.; Carpenter, S.R.; Chapin, F.S.; Coe, M.T.; Daily, G.C.; Gibbs, H.K.; et al. Global Consequences of Land Use. Science 2005, 309, 570–574. [Google Scholar] [CrossRef] [Green Version]
  4. Haddad, N.M.; Brudvig, L.A.; Clobert, J.; Davies, K.F.; Gonzalez, A.; Holt, R.D.; Lovejoy, T.E.; Sexton, J.O.; Austin, M.P.; Collins, C.D.; et al. Habitat Fragmentation and Its Lasting Impact on Earth’s Ecosystems. Sci. Adv. 2015, 1, e1500052. [Google Scholar] [CrossRef] [Green Version]
  5. Shaker, R.R. The Well-Being of Nations: An Empirical Assessment of Sustainable Urbanization for Europe. Int. J. Sustain. Dev. World Ecol. 2015, 22, 375–387. [Google Scholar] [CrossRef]
  6. Barthel, S.; Isendahl, C.; Vis, B.N.; Drescher, A.; Evans, D.L.; van Timmeren, A. Global Urbanization and Food Production in Direct Competition for Land: Leverage Places to Mitigate Impacts on SDG2 and on the Earth System. Anthr. Rev. 2019, 6, 71–97. [Google Scholar] [CrossRef]
  7. Larondelle, N.; Haase, D. Urban Ecosystem Services Assessment along a Rural-Urban Gradient: A Cross-Analysis of European Cities. Ecol. Indic. 2013, 29, 179–190. [Google Scholar] [CrossRef]
  8. Ferrari, B.; Quatrini, V.; Barbati, A.; Corona, P.; Masini, E.; Russo, D. Conservation and Enhancement of the Green Infrastructure as a Nature-Based Solution for Rome’s Sustainable Development. Urban Ecosyst. 2019, 22, 865–878. [Google Scholar] [CrossRef]
  9. Mears, M.; Brindley, P.; Jorgensen, A.; Maheswaran, R. Population-Level Linkages between Urban Greenspace and Health Inequality: The Case for Using Multiple Indicators of Neighbourhood Greenspace. Health Place 2020, 62, 102284. [Google Scholar] [CrossRef]
  10. Barboza, E.P.; Cirach, M.; Khomenko, S.; Iungman, T.; Mueller, N.; Barrera-Gómez, J.; Rojas-Rueda, D.; Kondo, M.; Nieuwenhuijsen, M. Green Space and Mortality in European Cities: A Health Impact Assessment Study. Lancet Planet. Health 2021, 5, e718–e730. [Google Scholar] [CrossRef]
  11. Zepp, H.; Groß, L.; Inostroza, L. And the Winner is? Comparing Urban Green Space Provision and Accessibility in Eight European Metropolitan Areas Using a Spatially Explicit Approach. Urban For. Urban Green. 2020, 49, 126603. [Google Scholar] [CrossRef]
  12. Haase, A.; Bernt, M.; Großmann, K.; Mykhnenko, V.; Rink, D. Varieties of Shrinkage in European Cities. Eur. Urban Reg. Stud. 2016, 23, 86–102. [Google Scholar] [CrossRef]
  13. Di Pirro, E.; Sallustio, L.; Capotorti, G.; Marchetti, M.; Lasserre, B. A Scenario-Based Approach to Tackle Trade-Offs between Biodiversity Conservation and Land Use Pressure in Central Italy. Ecol. Modell. 2021, 448, 109533. [Google Scholar] [CrossRef]
  14. Martellozzo, F.; Amato, F.; Murgante, B.; Clarke, K.C. Modelling the Impact of Urban Growth on Agriculture and Natural Land in Italy to 2030. Appl. Geogr. 2018, 91, 156–167. [Google Scholar] [CrossRef] [Green Version]
  15. Rivieccio, R.; Sallustio, L.; Paolanti, M.; Vizzarri, M.; Marchetti, M. Where Land Use Changes Occur: Using Soil Features to Understand the Economic Trends in Agricultural Lands. Sustainability 2017, 9, 78. [Google Scholar] [CrossRef] [Green Version]
  16. Collas, L.; Green, R.E.; Ross, A.; Wastell, J.H.; Balmford, A. Urban Development, Land Sharing and Land Sparing: The Importance of Considering Restoration. J. Appl. Ecol. 2017, 54, 1865–1873. [Google Scholar] [CrossRef]
  17. Sun, C.; Wu, Z.F.; Lv, Z.Q.; Yao, N.; Wei, J.B. Quantifying Different Types of Urban Growth and the Change Dynamic in Guangzhou Using Multi-Temporal Remote Sensing Data. Int. J. Appl. Earth Obs. Geoinf. 2013, 21, 409–417. [Google Scholar] [CrossRef]
  18. Cortinovis, C.; Geneletti, D. Mapping and Assessing Ecosystem Services to Support Urban Planning: A Case Study on Brownfield Regeneration in Trento, Italy. One Ecosyst. 2018, 3, e25477. [Google Scholar] [CrossRef]
  19. Haase, D. Integrating Ecosystem Services, Green Infrastructure and Nature-Based Solutions—New Perspectives in Sustainable Urban Land Management. In Sustainable Land Management in a European Context; Weith, T., Barkmann, T., Gaasch, N., Rogga, S., Strauß, C., Zscheischler, J., Eds.; Springer Nature: Berlin/Heidelberg, Germany, 2021; pp. 305–318. ISBN 9783030508401. [Google Scholar]
  20. Crauderueff, R.; Margolis, S.; Tanikawa, S. Greening Vacant Lots: Planning and Implementation Strategies. A Report Prepared for the Nature Conservancy as Part of the NatLab Collaboration; The Nature Conservancy: New York, NY, USA, 2012. [Google Scholar]
  21. Gobster, P.H.; Hadavi, S.; Rigolon, A.; Stewart, W.P. Measuring Landscape Change, Lot by Lot: Greening Activity in Response to a Vacant Land Reuse Program. Landsc. Urban Plan. 2020, 196, 103729. [Google Scholar] [CrossRef]
  22. Hwang, S.W.; Lee, S.J. Unused, Underused, and Misused: An Examination of Theories on Urban Void Spaces. Urban Res. Pract. 2020, 13, 540–556. [Google Scholar] [CrossRef]
  23. Susca, T.; Gaffin, S.R.; Dell’Osso, G.R. Positive Effects of Vegetation: Urban Heat Island and Green Roofs. Environ. Pollut. 2011, 159, 2119–2126. [Google Scholar] [CrossRef] [PubMed]
  24. Dumitru, A.; Wendling, L. Evaluating the Impact of Nature-Based Solutions; Publications Office of the European Union: Luxembourg, 2021. [Google Scholar]
  25. Rey, E.; Laprise, M.; Lufkin, S. Neighbourhoods in Transition: Brownfield Regeneration in European Metropolitan Areas; Springer, Ed.; Springer: Lausanne, Switzerland, 2021; ISBN 9783030822071. [Google Scholar]
  26. Jenerette, D.G.; Harlan, S.L.; Stefanov, W.L.; Martin, C.A. Ecosystem Services and Urban Heat Riskscape Moderation: Water, Green Spaces, and Social Inequality in Phoenix, USA. Ecol. Appl. 2011, 21, 2637–2651. [Google Scholar] [CrossRef]
  27. Bratman, G.N.; Anderson, C.B.; Berman, M.G.; Cochran, B.; de Vries, S.; Flanders, J.; Folke, C.; Frumkin, H.; Gross, J.J.; Hartig, T.; et al. Nature and Mental Health: An Ecosystem Service Perspective. Sci. Adv. 2019, 5, eaax0903. [Google Scholar] [CrossRef] [Green Version]
  28. Quatrini, V.; Tomao, A.; Corona, P.; Ferrari, B.; Masini, E.; Agrimi, M. Is New Always Better than Old? Accessibility and Usability of the Urban Green Areas of the Municipality of Rome. Urban For. Urban Green. 2019, 37, 126–134. [Google Scholar] [CrossRef]
  29. Charoenkit, S.; Piyathamrongchai, K. A Review of Urban Green Spaces Multifunctionality Assessment: A Way Forward for a Standardized Assessment and Comparability. Ecol. Indic. 2019, 107, 105592. [Google Scholar] [CrossRef]
  30. Liu, Y.; Wang, R.; Lu, Y.; Li, Z.; Chen, H.; Cao, M.; Zhang, Y.; Song, Y. Natural Outdoor Environment, Neighbourhood Social Cohesion and Mental Health: Using Multilevel Structural Equation Modelling, Streetscape and Remote-Sensing Metrics. Urban For. Urban Green. 2020, 48, 126576. [Google Scholar] [CrossRef]
  31. Wolff, M.; Scheuer, S.; Haase, D. Looking beyond Boundaries: Revisiting the Rural-Urban Interface of Green Space Accessibility in Europe. Ecol. Indic. 2020, 113, 106245. [Google Scholar] [CrossRef]
  32. Gavrilidis, A.A.; Niță, M.R.; Onose, D.A.; Badiu, D.L.; Năstase, I.I. Methodological Framework for Urban Sprawl Control through Sustainable Planning of Urban Green Infrastructure. Ecol. Indic. 2019, 96, 67–78. [Google Scholar] [CrossRef]
  33. Taylor, L.; Hochuli, D.F. Defining Greenspace: Multiple Uses across Multiple Disciplines. Landsc. Urban Plan. 2017, 158, 25–38. [Google Scholar] [CrossRef] [Green Version]
  34. McIntyre, N.E.; Knowles-Yanez, K.; Hope, D. Urban Ecology as an Interdisciplinary Field: Differences in the Use of “Urban” between the Social and Natural Sciences. In Urban Ecology: An International Perspective on the Interaction between Humans and Nature; Kluwer Academic Publishers: Dordrecht, The Netherlands, 2008; pp. 49–65. ISBN 9780387734118. [Google Scholar]
  35. MacGregor-Fors, I. Misconceptions or Misunderstandings? On the Standardization of Basic Terms and Definitions in Urban Ecology. Landsc. Urban Plan. 2011, 100, 347–349. [Google Scholar] [CrossRef]
  36. European Commission (EU). Methodological Manual on Territorial Typologies, 2018 ed.; European Commission (EU): Luxembourg, 2018. [Google Scholar]
  37. van Vliet, J.; Verburg, P.H.; Grădinaru, S.R.; Hersperger, A.M. Beyond the Urban-Rural Dichotomy: Towards a More Nuanced Analysis of Changes in Built-up Land. Comput. Environ. Urban Syst. 2019, 74, 41–49. [Google Scholar] [CrossRef]
  38. Amato, F.; Maimone, B.A.; Martellozzo, F.; Nolé, G.; Murgante, B. The Effects of Urban Policies on the Development of Urban Areas. Sustainability 2016, 8, 297. [Google Scholar] [CrossRef] [Green Version]
  39. Romano, B.; Zullo, F.; Fiorini, L.; Ciabò, S.; Marucci, A. Sprinkling: An Approach to Describe Urbanization Dynamics in Italy. Sustainability 2017, 9, 97. [Google Scholar] [CrossRef] [Green Version]
  40. Vatseva, R.; Kopecka, M.; Otahel, J.; Rosina, K.; Kitev, A.; Genchev, S. 5th International Conference on Cartography and GIS. In Proceedings of the Cartography and Geoinformation, Riviera, Bulgaria, 15–20 June 2014; Temenoujka, B., Milan, K., Eds.; Bulgarian Cartographic Association: Sofia, Bulgaria, 2015; Volume 13, pp. 569–578. [Google Scholar]
  41. Sallustio, L.; Munafò, M.; Riitano, N.; Lasserre, B.; Fattorini, L.; Marchetti, M. Integration of Land Use and Land Cover Inventories for Landscape Management and Planning in Italy. Environ. Monit. Assess. 2016, 188, 48. [Google Scholar] [CrossRef]
  42. Frantzeskaki, N.; McPhearson, T.; Collier, M.J.; Kendal, D.; Bulkeley, H.; Dumitru, A.; Walsh, C.; Noble, K.; Van Wyk, E.; Ordóñez, C.; et al. Nature-Based Solutions for Urban Climate Change Adaptation: Linking Science, Policy, and Practice Communities for Evidence-Based Decision-Making. Bioscience 2019, 69, 455–466. [Google Scholar] [CrossRef] [Green Version]
  43. Sallustio, L.; Perone, A.; Vizzarri, M.; Corona, P.; Fares, S.; Cocozza, C.; Tognetti, R.; Lasserre, B.; Marchetti, M. The Green Side of the Grey: Assessing Greenspaces in Built-up Areas of Italy. Urban For. Urban Green. 2019, 37, 147–153. [Google Scholar] [CrossRef]
  44. Nilsson, K.; Nielsen, T.S.; Aalbers, C.; Bell, S.; Boitier, B.; Chery, J.P.; Fertner, C.; Groschowski, M.; Haase, D.; Loibl, W.; et al. Strategies for Sustainable Urban Development and Urban-Rural Linkages, Research brief. Eur. J. Spat. Dev. 2014, 25p. [Google Scholar]
  45. Istituto Nazionale di Statistica (ISTAT). Ricostruzione Della Popolazione Residente per Età e Sesso Nei Comuni Italiani; Istituto Nazionale di Statistica (ISTAT): Rome, Italy, 2020. [Google Scholar]
  46. Sallustio, L.; Quatrini, V.; Geneletti, D.; Corona, P.; Marchetti, M. Assessing Land Take by Urban Development and Its Impact on Carbon Storage: Findings from Two Case Studies in Italy. Environ. Impact Assess. Rev. 2015, 54, 80–90. [Google Scholar] [CrossRef] [Green Version]
  47. Strollo, A.; Smiraglia, D.; Bruno, R.; Assennato, F.; Congedo, L.; De Fioravante, P.; Giuliani, C.; Marinosci, I.; Riitano, N.; Munafò, M. Land Consumption in Italy. J. Maps 2020, 16, 113–123. [Google Scholar] [CrossRef]
  48. Pagliarella, M.C.; Sallustio, L.; Capobianco, G.; Conte, E.; Corona, P.; Fattorini, L.; Marchetti, M. From One- to Two-Phase Sampling to Reduce Costs of Remote Sensing-Based Estimation of Land-Cover and Land-Use Proportions and Their Changes. Remote Sens. Environ. 2016, 184, 410–417. [Google Scholar] [CrossRef]
  49. Marchetti, M.; Bertani, R.; Corona, P.; Valentini, R. Changes of Forest Coverage and Land Uses as Assessed by the Inventory of Land Uses in Italy. For.-Riv. Di Selvic. Ed Ecol. For. 2012, 9, 170–184. [Google Scholar] [CrossRef] [Green Version]
  50. Corona, P.; Barbati, A.; Tomao, A.; Bertani, R.; Valentini, R.; Marchetti, M.; Fattorini, L.; Perugini, L. Land Use Inventory as Framework for Environmental Accounting: An Application in Italy. IForest 2012, 5, 204–209. [Google Scholar] [CrossRef]
  51. Intergovernmental Panel on Climate Change (IPCC). Good Practice Guidance for Land Use, Land-Use Change and Forestry; Penman, J., Gytarsky, M., Hiraishi, T., Krug, T., Kruger, D., Pipatti, R., Buendia, L., Miwa, K., Ngara, T., Tanabe, K., et al., Eds.; Institute for Global Environmental Strategies (IGES): Kanagawa, Japan, 2003; Volume 338, ISBN 4887880030. [Google Scholar]
  52. Florczyk, A.J.; Melchiorri, M.; Orbane, C.; Schiavina, M.; Maffenini, M.; Politis, P.; Sabo, S.; Freire, S.; Ehrlich, D.; Kemper, T.; et al. Description of the GHS Urban Centre Database 2015; European Union: Brussels, Belgium, 2019; ISBN 9789279997532. [Google Scholar]
  53. Dijkstra, L.; Florczyk, A.J.; Freire, S.; Kemper, T.; Melchiorri, M.; Pesaresi, M.; Schiavina, M. Applying the Degree of Urbanisation to the Globe: A New Harmonised Definition Reveals a Different Picture of Global Urbanisation. J. Urban Econ. 2021, 125, 103312. [Google Scholar] [CrossRef]
  54. Congedo, L.; Sallustio, L.; Munafò, M.; Ottaviano, M.; Tonti, D.; Marchetti, M. Copernicus High-Resolution Layers for Land Cover Classification in Italy. J. Maps 2016, 12, 1195–1205. [Google Scholar] [CrossRef] [Green Version]
  55. Baffetta, F.; Fattorini, L.; Corona, P. Estimation of Small Woodlot and Tree Row Attributes in Large-Scale Forest Inventories. Environ. Ecol. Stat. 2011, 18, 147–167. [Google Scholar] [CrossRef] [Green Version]
  56. European Environment Agency (EEA). The European Environment-State and Outlook 2020. Knowledge for Transition to a Sustainable Europe; European Environment Agency (EEA): Copenhagen, Danmark, 2019; ISBN 9789294800909. [Google Scholar]
  57. Piantanida, P.; Rebaudengo, M. The Construction Sector Crisis in Italy: Any Strategy for Small and Medium-Sized Builders? In Proceedings of the 4th International Multidisciplinary Scientific Conference on Social Sciences and Arts-SGEM 2017; SGEM Scientific eLibrary: Sofia, Bulgaria, 2017; pp. 759–766. [Google Scholar]
  58. Marchetti, M.; Vizzarri, M.; Sallustio, L. Towards Countryside Revival: Reducing Impacts of Urban Expansion on Land Benefits. In Agrourbanism; Springer: Cham, Switzerland, 2019; pp. 207–219. [Google Scholar]
  59. Ministero dell’Ambiente e della Tutela del Territorio e del Mare (MATTM). Strategia Nazionale Del Verde Urbano; Ministero dell’Ambiente e della Tutela del Territorio e del Mare (MATTM): Roma, Italy, 2018.
  60. Capotorti, G.; De Lazzari, V.; Ortí, M.A. Local Scale Prioritisation of Green Infrastructure for Enhancing Biodiversity in Peri-Urban Agroecosystems: A Multi-Step Process Applied in the Metropolitan City of Rome (Italy). Sustainability 2019, 11, 3322. [Google Scholar] [CrossRef] [Green Version]
  61. Islam, M.N.; Rahman, K.S.; Bahar, M.M.; Habib, M.A.; Ando, K.; Hattori, N. Pollution Attenuation by Roadside Greenbelt in and around Urban Areas. Urban For. Urban Green. 2012, 11, 460–464. [Google Scholar] [CrossRef]
  62. Rathoure, A.K.; Modi, J. Zero Noise Pollution: Green Belt Development. In Zero Waste, Management Practices for Environmental Sustainability; CRC Press: Boca Raton, FL, USA, 2019; pp. 25–50. ISBN 9780367180393. [Google Scholar]
  63. Liang, J.; Fang, H.L. Maintenance of Urban Organic Wastes on Ecological Function of Urban Green-Belt Soils. J. Zhejiang For. Coll. 2010, 27, 292–298. [Google Scholar]
  64. Semeraro, T.; Luvisi, A.; De Bellis, L.; Aretano, R.; Sacchelli, S.; Chirici, G.; Marchetti, M.; Cocozza, C. Dendrochemistry: Ecosystem Services Perspectives for Urban Biomonitoring. Front. Environ. Sci. 2020, 8, 558893. [Google Scholar] [CrossRef]
  65. European Environment Agency (EEA). Urban Soil Sealing in Europe; European Environment Agency (EEA): Copenhagen, Danmark, 2011. [Google Scholar]
  66. Di Pirro, E.; Sallustio, L.; Castellar, J.A.C.; Sgrigna, G.; Marchetti, M.; Lasserre, B. Facing Multiple Environmental Challenges through Maximizing the Co-Benefits of Nature-Based Solutions at a National Scale in Italy. Forests 2022, 13, 548. [Google Scholar] [CrossRef]
  67. Di Pirro, E.; Sallustio, L.; Sgrigna, G.; Marchetti, M.; Lasserre, B. Strengthening the Implementation of National Policy Agenda in Urban Areas to Face Multiple Environmental Stressors: Italy as a Case Study. Environ. Sci. Policy 2022, 129, 1–11. [Google Scholar] [CrossRef]
  68. Haase, D.; Haase, A.; Rink, D. Conceptualizing the Nexus between Urban Shrinkage and Ecosystem Services. Landsc. Urban Plan. 2014, 132, 159–169. [Google Scholar] [CrossRef]
  69. Salbitano, F.; Sanesi, G. Decree on Climate 2019. What Resources Support Forests and Silviculture in Our Cities? For.-Riv. Di Selvic. Ed Ecol. For. 2019, 16, 74–76. [Google Scholar] [CrossRef]
  70. Romano, R. National Recovery and Resilience Plan “Next Generation EU”: A Wasted Opportunity for Italian Forests. For.-Riv. Di Selvic. Ed Ecol. For. 2021, 18, 5–7. [Google Scholar] [CrossRef]
  71. Sessa, M.R.; Russo, A.; Sica, F. Opinion Paper on Green Deal for the Urban Regeneration of Industrial Brownfield Land in Europe. Land Use Policy 2022, 119, 106198. [Google Scholar] [CrossRef]
  72. Sallustio, L.; Lasserre, B.; Blasi, C.; Marchetti, M. Infrastrutture Verdi Contro Il Consumo Di Suolo. Reticula 2020, 25, 21–31. [Google Scholar]
  73. Di Cristofaro, M.; Sallustio, L.; Sitzia, T.; Marchetti, M.; Lasserre, B. Landscape Preference for Trees Outside Forests along an Urban–Rural–Natural Gradient. Forests 2020, 11, 728. [Google Scholar] [CrossRef]
  74. Gonzalez, M.; Ladet, S.; Deconchat, M.; Cabanettes, A.; Alard, D.; Balent, G. Relative Contribution of Edge and Interior Zones to Patch Size Effect on Species Richness: An Example for Woody Plants. For. Ecol. Manag. 2010, 259, 266–274. [Google Scholar] [CrossRef]
  75. Kong, F.; Yin, H.; James, P.; Hutyra, L.R.; He, H.S. Effects of Spatial Pattern of Greenspace on Urban Cooling in a Large Metropolitan Area of Eastern China. Landsc. Urban Plan. 2014, 128, 35–47. [Google Scholar] [CrossRef]
  76. Nidzgorski, D.A.; Hobbie, S.E. Urban Trees Reduce Nutrient Leaching to Groundwater. Ecol. Appl. 2016, 26, 1566–1580. [Google Scholar] [CrossRef]
  77. Fares, S.; Savi, F.; Fusaro, L.; Conte, A.; Salvatori, E.; Aromolo, R.; Manes, F. Particle Deposition in a Peri-Urban Mediterranean Forest. Environ. Pollut. 2016, 218, 1278–1286. [Google Scholar] [CrossRef] [PubMed]
  78. Chang, H.Y.; Lee, Y.F. Effects of Area Size, Heterogeneity, Isolation, and Disturbances on Urban Park Avifauna in a Highly Populated Tropical City. Urban Ecosyst. 2016, 19, 257–274. [Google Scholar] [CrossRef]
  79. ISO 37120; Sustainable Development of Communities: Indicators for City Services and Quality of Life. International Organization for Standardization: Geneva, Switzerland, 2018.
  80. World Health Organization (WHO). Health Indicators of Sustainable Cities. In Proceedings of the Rio+ 20 UN Conference on Sustainable Development, Rio de Janeiro, Brazil, 13 June 2012. [Google Scholar]
Figure 1. Classification framework adopted for the characterization of sealed and permeable spaces within Italian built-up areas.
Forests 13 01983 g001
Figure 2. Summary of the cartographic layers adopted in this work for the identification and characterization of sealed and permeable spaces within Italian built-up areas in 1990, 2008, and 2016. Source of IUTI 10% layers at 1990, 2008, and 2016: adapted from [48]; Source of Population Density layer at 1990 and 2015: [52] (available at https://data.jrc.ec.europa.eu/dataset/, accessed on 11 March 2021); Source of High Resolution aerial photos at 1990, 2012, and 2015: Italian Ministry of the Environment, Territory and Sea (available at https://wms.pcn.minambiente.it/ogc?map=/ms_ogc/WMS_v1.3/raster/, accessed on 20 April 2021); Source of High Resolution layer at 2012 and 2018: Copernicus High Resolution Layers (available at https://land.copernicus.eu/pan-european/high-resolution-layers, accessed on 19 February 2021).
Forests 13 01983 g002
Figure 3. Coverage (ha) of Italian built-up areas in 1990, 2008, and 2016 as a whole and according to different population density.
Forests 13 01983 g003
Figure 4. Permeable/built-up ratio (%) in Italy in 1990, 2008, and 2016 as a whole and according to different population densities.
Forests 13 01983 g004
Table 1. Coverage (A), abundance (N), and average size (a) of sealed and permeable spaces within Italian built-up areas in 2008 and 2016 and their relative change with respect to the baseline (%). Below each estimate, the corresponding standard error in percentage is reported. The significance of changes are referred as extremely significant (•), very significant (*), significant (**), poor significant (***), and not significant(ns), with a p-value < 0.001, p-value < 0.01, p-value < 0.05, p-value < 0.1, and p-value > 0.1, respectively.
20082016Change 2008–2016 (%)
A (ha)Na (ha)A (ha)Na (ha)ANa
Thinly populated areasSBS203,638424,2960.48238,677572,1450.4217.2%34.8%−13.1%
3.32.310.03.12.07.7******ns
PnfSB407,504152,2202.68437,310341,6841.287.3%124.5%−52.2%
2.33.918.12.32.612.3******
F-GSB82,36511,8116.9759,15794156.28−28.2%−20.3%−9.9%
5.213.912.86.215.514.0***nsns
SW318535,6870.099784151,6840.06207.1%325.0%−27.7%
26.78.023.515.23.913.6****ns
Intermediately populated areasSBS476,672379,5621.26510,802372,2581.377.2%−1.9%9.3%
2.22.411.72.12.510.6*nsns
PnfSB296,697305,2250.97290,781504,0540.58−2.0%65.1%−40.7%
2.82.712.12.82.19.4ns*****
F-GSB51,19499845.1348,23612,1403.97−5.8%21.6%−22.5%
6.715.112.96.913.712.3nsnsns
SW523372,1640.0717,747247,7300.07239.1%243.3%−1.2%
20.85.619.011.33.010.6*****ns
Densely populated areasSBS510,57492,1485.54502,15678,5786.39−1.6%−14.7%15.3%
2.15.024.02.15.420.1ns*ns
PnfSB106,483240,4320.44102,843441,3270.23−3.4%83.6%−47.4%
4.63.113.44.72.39.9ns*****
F-GSB18,65781282.3029,12415,1561.9256.1%86.5%−16.3%
11.016.713.98.812.29.4****ns
SW455152,6540.0916,610214,1910.08265.0%306.8%−10.3%
22.46.623.011.73.212.0*****ns
Overall Italian built-up areasSBS1,190,884896,0061.331,251,6351,022,9801.225.1%14.2%−7.9%
1.41.67.41.31.56.1*****ns
PnfSB810,684697,8761.16830,9341,287,0650.652.5%84.4%−44.4%
1.71.88.21.61.36.1ns******
F-GSB152,21729,9235.09136,51736,7113.72−10.3%22.7%−26.9%
3.98.77.84.17.96.9**
SW12,969160,5040.0844,141613,6050.07240.4%282.3%−11.0%
13.23.812.67.21.96.9******ns
Publisher’s Note: MDPI stays neutral with regard to jurisdictional claims in published maps and institutional affiliations.

