Abstract
Among the Saudi Vision 2030 programs is the Green Saudi Initiative, which aims to protect the environment, energy conversion, and sustainability projects to build a sustainable future. In the present paper, Green Infrastructures (GI) were assessed, analyzed, and mapped using GIS and Analytic Hierarchy Process-based-Multi-Criteria Decision-Making Method (AHP-MCDM). Ten criteria were selected to elaborate the GI suitability map (DEM, slope, topographic position index, rainfall, distance to the water lines, topographic wetness index, distance to the road, wind speed, housing income group high (high-income people) map, employment in the agricultural sector, and land use land change). The results revealed four classes of suitability: Poor, Fair, Good, and Excellent. The “Excellent” area for GI planning was estimated at 983 km2 (9%), whereas the “Good” area covered 36% (3987 km2). The excellent and good areas for GI were more localized in the central part of the Al Baha region in the areas of Al Bahah, Elmandaq, Alatawlah, and the central part of Buljurshi. According to the obtained results, the southern part of the study is not suitable for GI planning; this is explained by the large area of barren land and sand. The results obtained by this research may help managers and decision-makers in future planning for GI areas in the Al Baha region.
1. Introduction
In the last few decades, the effects of climate change and the increase in global temperatures and evapotranspiration have led to a shortage of water bodies and green spaces because of the direct and indirect impact of humans [1,2,3,4]. However, the latter still needs other spaces in order to develop his economic and social interests, such as building new cities and the following the basics of living, work, and luxury. According to the authors of [5], an increase will be observed worldwide in the percentage of people living in urban areas from 50% to nearly 70% between 2010 and 2050, respectively. This is why good urban planning has always been a challenge for the most recent studies [6].
Urban planning aims to assess rural and urban life and find engineering answers and keys to urban problems such as growth urban, traffic crises, slums, and organizing movement between services and residents. Recently, green spaces have become a necessary and distinctive element in the city in terms of form, function, and beauty. They are no longer limited to the responsibility of the agricultural engineer and have become a science of environmental architecture [7]. As it provides opportunities for the comfort and enjoyment of nature for city residents, one of the important aspects of urban planning is to work on creating many parks and public gardens by distributing them throughout the city in line with the requirements of residential neighborhoods.
Currently, developed and developing countries are making great efforts in creating urban green spaces (UGS) and Green Infrastructures (GI). According to the authors of [8], the design, planning, and management of UGS and GI are often prioritized by cultural ecosystem services such as aesthetics, recreation, and cultural heritage. The findings of the World Health Organization report [9] showed that UGS has health benefits, especially for economically deprived communities, pregnant women, children, and aged citizens, and this is why adequate access to green space is essential for all populations with a specific priority for disadvantaged communities. By measuring the UGS score using high-resolution satellite databases covering 179,168 km2 including 90 global cities in 60 developed countries with 230 million people, the authors of [10] found that the amount of UGS and Gross Domestic Product (GDP)was linked to the happiness level of the nations. The authors of [11] revealed the strength of the evidence of the relationship between cancer and UGS, even though this relationship is still weak due to the lack of research and the few studies in this framework. A systematic review by the authors of [12] found a consistent negative relationship between UGS exposure and heart rate, mortality, and violence, and a positive association with mood, attention, and physical activity. Despite that, the statistics of UGS in Africa have shown that it is reducing at an alarming level with GS now occupying small landmass areas in several urban areas [13]. In a special zone near to Oromia (Ethiopia), the authors of [14] assessed urban green infrastructure planning. The investigation results indicated that financial constraints, lack of awareness, poor public involvement, absence of collaboration, and insufficient professional knowledge are the most influential factors preventing the integration between urban development and green infrastructure planning principles. The review by the authors of [15] using RS of Landscape Pattern of UGS and Vegetation Fragmentation (VF) showed that VF studies were mostly for metropolises in North America, China, and Europe while metropolises in most parts of Asia, Eurasia, Africa, Oceania, and South America have not been comprehensively studied. On the other hand, an excellent question ‘‘How far have we come and how far do we still need to go?” was answered by the authors of [16] based on a review of twenty years of ecosystem services publications. The research concluded that the essential contributions of ecosystem services to the nature and sustainable well-being of humans must be at the core of the main change necessary in economic theory and practice to achieve a societal conversion to a sustainable and desirable future. The systematic review documented by the authors of [17] highlighted the relationship between UGS and Ecosystem services (ES) and well-being dimensions in Europe, China, the USA, and South Africa. The survey revealed that food security received the least attention, where good social relations and health (physical and mental) were the most investigated well-being dimensions. The use and perception of residential greenery in Berlin (Germany) and the example of the healthy green living room on one’s doorstep were suggested and examined by the authors of [18]. The results revealed that new houses with greenery areas are highly appreciated by residents. The residents benefit daily from the residential green spaces instead of visiting the parks once a week, which explains how residential greenery can be a social tissue, especially in so-called “disadvantaged” neighborhoods that increase the social belonging among neighbors. In Turin Neighborhoods (Italy), the authors of [19] assessed Green Areas, Ecosystem Services (ES), and Socio-Demographic Characteristics (SDC). Based on the species-specific Air Quality index, the results showed that the agricultural land used and the water bodies in the northern part were the reasons for the higher values of ES and SDC compared to the central-southern part, where improving the quality of green spaces in those neighborhoods could have great effects on liveability. The authors concluded that increasing citizens’ well-being is one of the future management and planning strategies through urban greening consideration
Due to the importance of UGS and GI in human life, several approaches, tools, and studies have been elaborated for UGS and GI assessment and better planning [20,21,22,23,24]. The results of a developed UGS quality assessment tool named “RECITAL” for assessing 149 UGS in Barcelona, Spain indicated overall good-to-excellent reliability, which may help decision-makers to design and management of UGS. Recently, the authors of [25] developed the InVEST 3.8.7 model to produce a heat mitigation index (HMI) based on a land cover map to estimate the cooling capacity of vegetation. The simulation indicated its suitability for urban design through the incorporation of water bodies and vegetation for the assessment of heat mitigation interventions into city plans at relevant scales. Using the Patch-Based Cellular Automata Model (CAM), the authors of [26] assessed how land use land change (LULC) impacted on regional ecosystem services (RES) in Ansan, South Korea with links to UGS policies. The findings indicated that urbanization negatively affected RES to a lesser extent than LUC, and UGS policies contributed to rising ES. In Kutahya (Turkey), the authors of [27] used GIS to assess UGS in terms of accessibility. The analysis indicated that parks in Kutahya covered an area of 614.272 m2, where the integrated system of UGS will allow the decision-makers to develop this natural potential in a sustainable way. In Hue City, Vietnam, the authors of [28] used GIS and AHP to select sustainable areas for UGS. According to the obtained results, 684 hectares were detected as suitable areas for UGS. The findings identified 684 hectares highly suitable for UGSs, which could help the needs of local residents by 2030. The authors of [29] assessed land suitability for GI Development in the Pendik District (Turkey) using fuzzy-AHP. The suitability map revealed that the main part of GI was located in the southern part, where more than 30% of the land has the potential for GS development. The authors of [30] used MCDM methods such as Order Preference by Similarity to Ideal Solution (TOPSIS), Additive Ratio Assessment (ARAS), Combinative Distance-based Assessment (CODAS), and Evaluation based on Distance from Average Solution (EDAS) to assess the existing and recommended shrubs and hedge species and the ecological potentials of trees in the parks of Rasht City (Iran) for UGS suitability. The used methods revealed sufficient information regarding trees, hedge plants, and shrubs that could help decision-makers and managers of UGS development. The authors of [31] used the AHP decision model based on a qualitative evaluation for prioritization of the UGS features in Ipoh parks, Malaysia. The findings showed that the most important attribute is the safety feature, followed by the other attributes (maintenance, accessibility, property value, e.g.). Furthermore, the results explained the significant role of the prioritized feature attributes in defining the relationship between the selected factors of UGS and residential living areas.
The Kingdom is one of the twenty most powerful economies in the world [32], but it aspires to be bigger, as it will seek to occupy a more advanced position by 2030, despite the global economic slowdown and its expected impact on the economy. This will require the Kingdom to invest in all its resources in order to diversify the economy and unleash the potential of promising economic sectors [33]. Vision 2030 aims to move Saudi Arabia into the post-oil era by diversifying sources of national income and getting rid of the dependence on black gold. The plan includes dozens of projects, most notably in infrastructure, tourism, and improving the performance of the private sector. Saudi Arabia is moving forward in supporting luxury methods, including infrastructure and others. Tourism in Saudi Arabia is one of the emerging sectors with rapid growth and represents the important goals of the Saudi Vision 2030. In addition to the historical and heritage treasures and the natural and cultural diversity of Saudi Arabia, its land is considered the cradle of the Islamic religion, which makes it a tourist attraction. Despite this, the studies in the framework of tourism, green space, and green infrastructure assessment and development in Saudi Arabia are very few, and almost non-existent, especially in GI. In the present paper, various topographic, morphologic, climatic, and land use land change maps were implanted on GIS and combined with AHP to identify and assess GI suitability at the scale of the Al Baha region (Saudi Arabia).
2. Study Area
Al Bahah is a very small province in the southwest of Saudi Arabia, near the Red Sea, It is localized between longitude 41/42 east and between two latitudes 19/20 north (Figure 1 and Figure 2a), 220 km south-east of Mecca, landlocked between its two neighbors, the provinces of Mecca and Asir. Its capital is Al Bahah city.
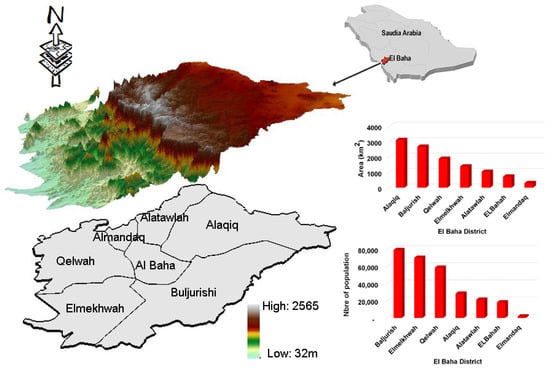
Figure 1.
Digital elevation model in 3D and geographic location of the study area and an overview of the number of population and area of each district of the study region.
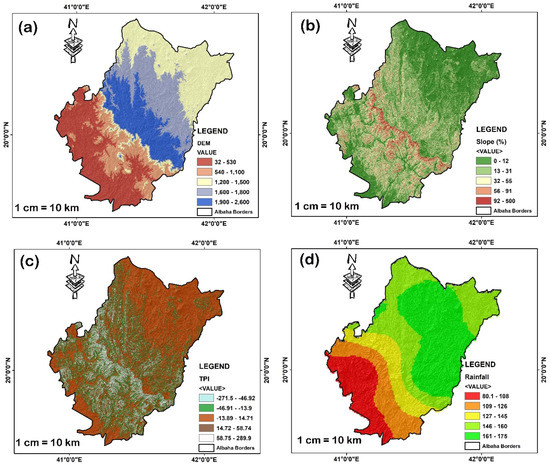
Figure 2.
Representation of (a) DEM, (b) slope, (c) topographic position index, (d) rainfall.
Al-Baha region is considered the smallest region and one of the thirteen administrative regions of the Kingdom of Saudi Arabia, with an area of 10,362 km2. Al-Baha is the largest city and its regional center. Its population is distributed over about 1200 villages. The area is characterized by its topography, parks, and forests, which contain a variety of natural plants. The population of the Al-Baha region is about 412,000 people, 348,636 of whom are Saudis and 63,252 are non-Saudis. This is according to the last population census in 2010. As for the indigenous people, half of them live in the region and the other half are outside it.
The region is characterized by an arid continental climate with rainfall throughout the year, as well as by the abundance of fog in the region, especially in Sarat, and by low temperatures in summer and winter. The topography of the region is mostly volcanic mountains known as (Al-Hijaz, and Al-Sarat). The mountainous areas are covered almost entirely by local coniferous trees called juniper, in addition to many types of fruit trees or bush and forest trees. The Al-Baha region occupies great importance on the tourism map in Saudi Arabia, as it is considered halfway between the city of Taif and the tourist city of Abha. Among the most important tourist attractions in the regionare Raghadan Forest, Al-Qamah Park, Al-Shukran Park, and Shahba Forest, in addition to the ancient villages of Dhi Ain, Wadi Al-Khaitan, and Wadi Al-Ash [34].
3. Materials and Methods
3.1. Preparation of Databases
In the framework of this study, nine criteria as GIS maps were selected to identify the suitability area for urban green space. The database used is presented below.
3.1.1. Digital Elevation Model
A Digital Elevation Model (DEM) is an illustration of the bare earth (bare ground) topographic of the Earth’s surface including buildings, trees, mountains, and any other surface objects. The Shuttle Radar Topography Mission (SRTM) databases with a resolution of ~30 m (1 arc-second) of the U.S. Geological Survey were downloaded from [35]. The elevation of the study area is between 32 and 2600 m above sea level. The Al Baha, central Buljurshi, southern Alaqiq, and Alatawlah districts are localized at high altitudes between 1500 and 2500 m, whereas Qelwah and Elmelkhwah districts are located between the elevations of 32 and 1070 m, where low altitudes of approximately 32 m (Figure 1 and Figure 2a) characterize their southern parts.
3.1.2. Slope Map
A slope map is a two-dimensional (2D) explanation of the inclination of the Earth’s surface. It illustrates how gentle or steep a slope is at each cell of a raster surface by degree and percentage magnitude. Slope maps can be applied to identify and help in the planning of civil engineering projects, and potential hazards management, e.g., they can be elaborated from DEM maps using GIS tools. The slope map represented in Figure 2b indicates that a high slope degree of more than 450% characterizes the Tihama Mountains that separate mountain ranges consisting of several mountains and peaks located in the Zahran and Al-Baha regions, the largest of which is Mount Shada, which is located in the southern part. Shada Al-Ala, a high rocky mountain, is the highest mountain in the Tihama plain, located approximately between the cities of Qilwah and Elmelkhwah. The slopes were estimated to be from 31 to 95 degrees. The terrain of the mountain is overtaken by smooth rocks, giving the mountain a faint blue color.
3.1.3. Topographic Position Index
The Topographic Position Index (TPI) compares the altitude of every cell in the DEM raster to the mean altitude of a specified neighborhood around that cell. It is a classification detecting lower, middle, and upper regions of the landscape. TPI is calculated by subtracting the average neighborhood altitude from the altitude of the central cell. Negative values will thus indicate depressions (valley bottoms), while positive values will map elevated areas such as hilltops and exposed ridges (Figure 2c). The TPI has been used in many recent research studies for landform analysis [36], building damage and earthquake characterization [37], and hydrology analysis [38]. The southern parts of Saudi Arabia receive more rainfall compared to the northern and central regions.
3.1.4. Rainfall Map
The rainfall map was elaborated using historical climate data based WorldClim version 2.1 which was released in January 2020 based on historical data for 1970–2000. The data were downloaded from the world climate website [39]. The annual rainfall in the Al Baha region is between 80 and 170 mm per year. There is a discrepancy in the amount of rain between the parts of the region, where the highlands receive more rainfall than the slopes (Figure 2d). The annual rate of rainfall in the highlands of the study area is within the limits. Most of the rain falls on the region as a result of the formation of cumulus clouds in the two transitional seasons, especially the spring season, and may be accompanied by strong winds, thunderstorms, hail, and large amounts of rain, resulting in some cases in torrential floods that may leave some negative effects on many sectors, especially the agricultural and grazing sector [40].
3.1.5. Distance to the Water Lines
The database of the water lines (river) and roads lines were obtained from the Global Map Saudi Arabia version 2 downloaded from [41]. The river networks (Figure 3a) explained by the Sarawat mountain range extend from the south to the north in the Al-Baha region and occupy a very large area. This mountain range is a major dividing line for water in the region, from which a number of valleys come, which generally go to the north-east towards the interior parts of the Kingdom, the largest of which are Wadi Turbah and its tributaries, such as Wadi Bathan (Baida), Wadi Amaq, and Wadi Kara. In addition, the upper valley of Rania starts from the Al-Baha region and its tributaries in the region: Wadi AlAqiq, Wadi Nagra, Wadi Abad, Wadi Tharad, Wadi Jerash, and Wadi Bani Kabir. At the same time, a number of valleys descend from the region, which generally move towards the west to flow into the Red Sea, including Wadi Alib, Wadi Duqa, Wadi Qarma, Wadi Naira, Wadi Nawan, and Wadi Al-Asab. The torrential waters flow into the valleys in the Al-Baha region, often during the rainy seasons, because the upper parts of its streams consist of poorly permeable rocks and are characterized by steep slopes [42].
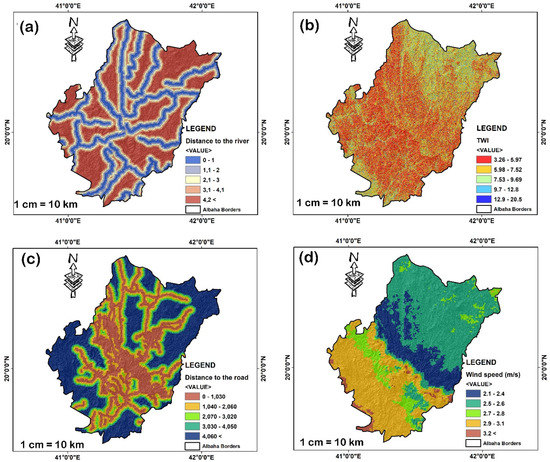
Figure 3.
Representation of (a) distance to the water lines, (b) topographic wetness index, (c) distance to the road, (d) wind speed.
3.1.6. Topographic Wetness Index
The Topographic Wetness Index (TWI) or Compound Topographic Index (CTI) was first introduced by Beven and Kirkby in 1979 in the framework of runoff TOP-MODEL. The TWI is used to quantify and assess topographic controls on hydrological processes. According to [43,44], the TWI is used for the characterization of biological processes including geochemical modeling, vegetation patterns (loss and gains), and forest site quality. It can also be used as a proxy for soil moisture [45,46], mapping soil organic matter [47], and household malaria risk [48]. TWI is defined by the following equation:
where α is the local upslope area draining through a certain point per unit contour length and explains the local slope in radian.
The TWI of the study area is characterized by the dominance of low TWI values between 3.27 and 7.52 (areas that have less “wetness”) in the red and orange color, whereas the high values of TWI are localized in water bodies area as dams in blue color, while the sky blue indicates increasing “wetness” but not a body of water. The TWI results reflect the dry nature of the study area (Figure 3b).
3.1.7. Distance to the Roads
The Al-Baha region constitutes a unique model in the construction of a modern road network of more than 1897 km, traversing the region’s mountains and valleys (Figure 3c), with a total value of about 4.3 billion riyals. These roads constitute one of the most important projects in the region in linking its center to its edges. One of the most famous roads is the Al Baha–Taif Tourist Road which is 60.40 km long and 7.60 m wide with asphalt shoulders. It is a two-way road separated by a central island. It serves a number of population centers in the countries of Zahran, Bani Malik, Belharith, and Bani Saad, and its cost amounted to 426,012,514 riyals. The Al Baha–Al-Aqiq road is 47 km long and 7.60 m wide. It was executed in a double direction with a length of 6 km towards the city of Al-Baha. This road connects the city of Al-Baha with the Al-Baha Airport located in the Al-Aqiq Governorate, and branch roads serve a large number of residential communities [49].
3.1.8. Wind Speed
Figure 3h explains the spatial distribution of wind speed across the Al Baha region, which indicates that it increases from the north to south, blowing from the east and northeast, while it decreases with altitude explaining the reverse relationship when altitude increases the wind speed. The wind speed reaches its maximum in the southern part by more than 3.2 m/s and a minimum at the high-altitude mountains by 2 m/s (Figure 3d).
3.1.9. Global Exposure Datasets
In this study, the global exposure database was used, which is based on a top-down methodology, where it includes statistical information such as building types, socio-economic values, and capital stock at a national level. The databases were saved onto the grids of 1 × 1 km spatial resolution in the coastal areas or 5 × 5 km everywhere else on the globe using the geographic distribution of the gross domestic product (GDP) and population data as proxies (residential construction type and number of residents, industrial and commercial buildings, as well as schools and hospitals) [50]. Furthermore, the datasets were used to approximately identify high-risk areas at the global level. Some areas may have been overestimated or underestimated. The GAR Global Exposure Dataset contains four principal criteria and each one includes more than 15 sub-criterions. Detailed information can be found in [51,52]. The housing high-income group and employment in the agriculture sector in reference to the rural population are presented in Figure 4a,b, respectively. Low and high incomes and seasonality of work can reflect the important risks of social exclusion and poverty or riches. Furthermore, they can be significant elements in the intergenerational transmission of poverty or riches, particularly among agricultural workers.
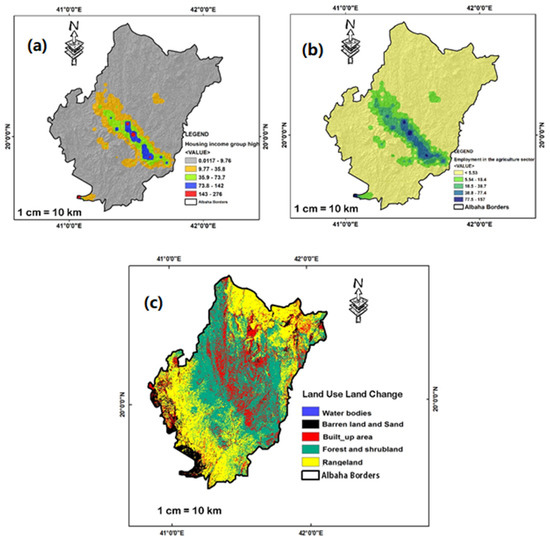
Figure 4.
Representation of (a) housing high-income group map, (b) employment in the agriculture sector, and (c) land use land change.
3.1.10. Landsat Imagery for LULC
In many countries, especially the United States of America, Russia, France, Canada, Japan, India, and others, there are many global programs dedicated to collecting visual information either on land resources, weather, and pollution through automatic satellites in a comprehensive, continuous, and periodic manner. Among them are, the American Landsat program, the French Spot program, Cartosat-3 and RISAT-2BR1 Indian program, and the Canadian Radarsat program.
On 11 February 2013, Vandenberg Air Force Base (California), launched Landsat 8. The Landsat 8 satellite payload involves two science instruments—the Thermal Infrared Sensor (TIRSand) the Operational Land Imager (OLI). These two sensors or instruments offer seasonal reporting of the global landmass at 30 m spatial resolution. Landsat 8 was realized as a scientific collaboration between the U.S. Geological Survey (USGS) and NASA. The latter led the construction, launch, design, and on-orbit calibration phases since the satellite was called LDCM (Landsat Data Continuity Mission).
In the present study, land use land change (LULC) was analyzed using combined Landsat 8 OLI, NDIVI, and maximum likelihood classification (MLC) based on ENVI and GIS technology. Table 1 explains the Landsat database information downloaded from U.S. Geological Survey. For more detail regarding the NDVI calculation and MLC application, the reader is cordially invited to consult the studies in [53,54,55].

Table 1.
Landsat database information.
The analysis of the current situation of LULC in the study area using MLC indicated five classes as follows: water bodies, rangeland, forest and shrubland, barren land and sand, and built-up areas (Figure 4c). The latter included houses, banks, roads, shops, administration, airports, and military buildings. The LULC map analysis for the year 2021 (Figure 4c) indicatesd that the water bodies areas in the Al Baha region were around 3.5 km2 (0.03%). As a result of the continuous increase in the population of the region, as well as the improvement in their standard of living, as is the case in the rest of the Kingdom’s regions, the demand for water is increasing, which shows that the current situation of water resources is not sufficient, especially since most of the Al-Baha region is located within the Arabian Shield, which consists of igneous and metamorphic rocks, and rainwater drains into them in a large number of relatively large valleys; therefore, the region contains only renewable groundwater in shallow water reservoirs (shallow aquifers) with valley sediments and the permeable rocks beneath them, which has driven decision-makers to make their plans for better future planning of water resources. The rangeland in the Al Baha region was estimated at 4002 km2 (36%) (Figure 4c), where the barren land and sand area was approximately equal to 639 km2 (5.76%).
According to [56,57,58], the Saudi rangeland is generally poor, and large areas of it are in most years almost devoid of plants, other areas have little vegetation cover, and large areas have witnessed a reduction in their vegetation cover, soil, and biological diversity as a result of intensive exploitation and agricultural and urban expansion at the expense of the best pastoral areas, and the frequent occurrence of long drought cycles [59]. On the other hand, the forest and shrubland area in the study area is very large and is estimated at 4476 km2 (40.3%), where its mountainous nature and beautiful forests make it a natural and heritage tourist destination in all seasons of the year. The LULC map analysis revealed that the built-up area explained 17.85% of the study area, approximately 1982 km2. For example, the Alaqiq district has an area of 3100 km2 (Figure 4c), where the built-up area is approximately 661 km2 and is considered the most urbanized district, followed by Baljurish with a built-up area of 491 km2. The study by the authors of [60] showed the civil dominance of the center of the region over the rest of the city due to the concentration of governmental and administrative institutions, commercial companies, and others in it. Furthermore, it showed a high rate of poverty among the Saudi population in the Al-Baha region, and a decrease in their participation in economic and professional activities, with a continued low percentage of workers in agricultural activity and their rise in service areas, especially the government sector. The latter results are confirmed by the results presented in Figure 4a,b.
3.2. The Hierarchical Multicriteria Process
Many multi-criteria decision-making aid methods exist: their objective is to help decision-makers to formalize a problem and explain the decision-making context before proceeding with the evaluation and comparison of solutions [61,62,63]. The hierarchical multicriteria process (AHP) is among the simplest to implement. It is used to calculate a summary score (value between 0 and 1) aggregated on the basis of a ranking and weighting of all the criteria taken into account in the decision [64].
According to the author of [65], AHP compares the relative importance of all the elements belonging to the same level of the hierarchy taken two by two, compared to the element of the level immediately above, where, for each comparison, one must choose the most important criterion and express one’s judgment as to its importance. The measure to determine the relative importance can be expressed by a scale from 1 to 9 (Table 2).
Table 2.
Scale of comparison.
The AHP method offers the possibility of knowing the degree of consistency in the pairwise comparison of SAATY [28,66], which begins with the multiplication of the input data matrix by the final relative priorities resulting from the last step of the extraction of eigenvectors. Then, the total values for each row of the matrix are calculated. Then, these total values are divided by the value of the eigenvector associated with it. The last step is oriented towards the calculation of the average of the values obtained in the previous step [67]. According to [68], the greater the consistency index becomes, the more the judgments that have been expressed in the comparison matrix are inconsistent and vice versa. The coherence index (CI) is defined by the equation below:
where n is the number of criteria compared and RC is the coherence ratio is the division between CI on the random coherence index (CA).
Table 3 presents the index CA, for the different number of criteria forming the calculation matrix. A consistency ratio of less than 0.10 was considered acceptable for this case study. For more detail about AHP implantation, the reader is invited to read the studies in [28,69].
Table 3.
Values of the random consistency (CR) according to the order of the matrix (Saaty’s CR values).
For the identification of the GI area, four classes were proposed based on the implantation of the equation below on the ArcGIS:
where explains the normalized weight of the parameter, refers to the weight of the i class of the parameter, m is the number of parameters, and n is the number of classes within a specific parameter. The was calculated for each grid
The flowchart presented in Figure 5 was used for GI analysis, where the different stages are summarized in the following points:
- The first step is to download the Landsat, SRTM imageries, Global Exposure Datasets, Worldclim V.2 databases, road, and river lines.;
- Use ENVI 5.1 software for atmospheric correction Landsat imagery using Fast Line-of-sight Atmospheric Analysis of Spectral Hypercubes (Flaash) for correct wavelengths in the visible through NIR and shortwave infrared areas;
- Apply the maximum likelihood classification method (MLC) for producing the LULC results, which have been exported to ArcGIS for improving the mapping process;
- Exploit Worldclim V.2 databases for elaborate rainfall and wind speed maps using ArcGIS;
- The exploitation of Global Exposure Datasets to elaborate the housing high-income group and employment in the agriculture sector maps using ArcGIS;
- Use STRM imagery, road, river lines, and ArcGIS modeler to elaborate the DEM map, slope map, TPI map, TWI map, distance to river map, and distance to the road map;
- After data processing and preparation, compute the pairwise comparison and standardize the matrix based on Table 2;
- Compute and verify the admissibility condition of random consistency;
- Finally, after verifying the random consistency (Table 3), the suitability map can be obtained after applying weighted overlay analysis to the reclassified maps.

Figure 5.
Flowchart used in this study.
Figure 5.
Flowchart used in this study.

4. Results
The results of the pairwise comparison matrix and their standardized matrix for the weight computing of each criterion are shown in Table 4 and Table 5 and in Figure 6. Furthermore, the calculation of CI, CR, and the significance of AHP parameters are shown in Table 6 and Table 7. The weight computing revealed that the diverse criteria had different levels of importance in relation to possible selections for GI. According to Table 7, the CR was equal to 0.098 (less than 0.1), which explains the reasonable consistency of the sample data. LULC, distance to the road, and employment in the agriculture sector (rural population) were the three most influential criteria at 19.7, 14, and 12.7%, where employment in the agriculture sector criteria had an approximately equal contribution to rainfall. These choices were defined after a discussion with participants and experts because it is considered that land use for forest and shrubland class is very suitable for GI, and the same thing applies to the employment in the agriculture sector. The latter can use them as workers in the province and the development of green spaces by benefiting from their expertise because they are located in a densely populated area, and thus the responsible institutions will be exempted from the costs of transportation, food, and housing for them. According to experts, the distance to the road is an important criterion for GI suitability. Most of the road lines are located in the central region of Al Baha (EL Baha Buljurshi, Elmandaq, Alaqiq), where more than 50% of the area with a distance is between 1 and 4 km.
Table 4.
Pairwise comparison matrix for the main criteria.
Table 5.
Standardized matrix for the main criteria.
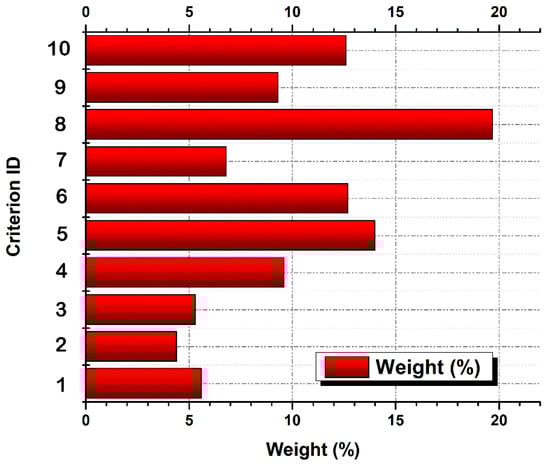
Figure 6.
Weight of the percentage for each criterion used for GI suitability.
Table 6.
The calculation of coherence index (CI) random consistency (CR).
Table 7.
Summary of the calculation of the AHP parameters.
According to the authors of [28], the criteria attributes scoring concerns an evaluation of each place for GI suitability. There were specific attributes for each criterion that could be assessed and scored based on the knowledge that was obtained individually. For slope class, the high score given for the slops was between 10% and20%. For TPI, the positive values 16–59 obtained a score of 2 from 5, while TWI obtained scores of 4 and 2 for the classes of 5.98–7.52 and 7.53–9.69, respectively (Table 8). The high scores for distance to the water lines were 2 and 3 for the distances 1–2.5 and 2.5–4 km2. These distances were chosen to avoid any accidents such as falling and drowning of children in valleys and wadis. For rainfall sub-criteria, when the rainfall increased between the classes the score increased. Conversely, in the wind speed sub-criteria, when the wind speed increased the score decreased. According to Table 8, all sub-criteria with scores equal to 1 explained an area not suitable for GI planning.
Table 8.
Characteristic of the main criteria and sub-criteria used for GI analysis.
The results of GI suitability are illustrated in Figure 7 and Figure 8, while Figure 7 explains in detail the area of different forms of suitability in the area and percentage for each district of the Al Baha region. The results revealed five classes of suitability and no suitability (poor, fair, good, and excellent), which are mapped in Figure 8. The first class was “poor suitability” which represented 12% (1322 km2) of the total area of the Al Baha region (11,104 km2), which was observed more in Qelwah and Elmelkhwah with an area of approximately 697 (37%) and 471 km2 (34%), followed by Buljurshi with a contribution area of 5% (132 km2) (Figure 7 and Figure 8). The other districts did not exceed a poor area of 12 km2. The second class “fair suitability” covered the largest part of the area; it explained 43% of the total area of the Al Baha region, which was equal to 4808 km2. A fair suitable area was detected in the Alaqiq, Qelwah, Elmelkhwah, and Buljurshi districts; it occupied large areas of 1766 (57%), 1051 (56%), 693 (50%), and 975 km2 (37%) (50%), respectively (Figure 7 and Figure 8). The fair area in Al Bahah, Alatawlah, and Elmandaq was between 19 and 91 km2. The third class corresponded to good suitability; it represented 36% (3987 km2) of the total area. The areas of “good suitability” were observed more at Buljurshi Alatawlah, El Bahah, and Elmandaq with areas of 1283 (48%), 692 (66%), 278 (38%), and 126 km2 (42%), respectively (Figure 5 and Figure 6). The fourth class illustrated the areas of “excellent suitability” and explained the lowest area estimated at 983 km2 (9%). The excellent suitability was observed more at Al Bahah and Elmandaq with areas of 355.9 (49%) and 152 km2 (49%), respectively (Figure 7 and Figure 8). This is why Al Bahah and Elmandaq are the most urbanized districts in Al Baha region. The western central part of Buljurshi also revealed a suitable area for GI of 260 km2 (10%). Conversely, Qelwah did not have a suitable area for GI due to its location in the mountains and in barren and sand areas.
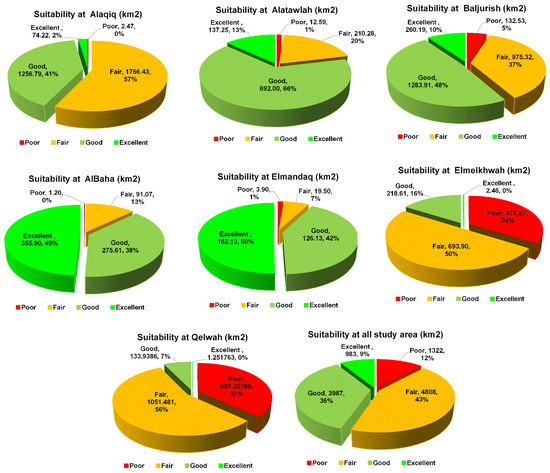
Figure 7.
Area (km2) and percentage (%) of the different classes of GI suitable areas in the Al Baha region and its seven districts.
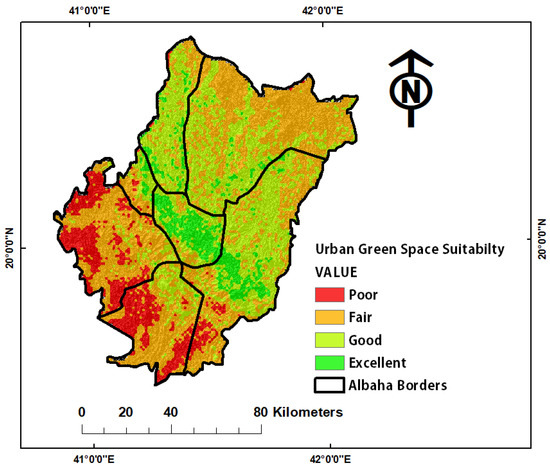
Figure 8.
Suitability map for GI of the Al Baha region.
5. Discussion
The results obtained by this study regarding GI suitability agreed with the current geographic location of green infrastructure in the Al Baha region, where the most excellent suitable areas for GI planning have been detected and suggested in the areas of Al Bahah, Elmandaq, and the western central part of Buljurshi, where these districts contain famous forests. Where the Al-Baha district sits between the Sarat mountain range and the Tihama plains, it resembles hanging cities, which make its atmosphere very wonderful. Al Baha forests constitute about 80% of the total area of the area, which is surrounded by many parks, gardens, and heritage villages. Its mountainous nature and unique forests make it a natural and heritage tourist destination in all seasons of the year. Raghadan Forest is located 5 km north of Al Baha. It is one of the most famous forests in Al-Baha, which is characterized by a moderate climate throughout the summer days, and the density of vegetation cover dominates the beauty of this forest, which is located in an area of more than 800 thousand square meters, interspersed with shaded areas for rest. Al-Habaka forests are distinguished by their location as they are adjacent to the main road linking the regions of Al-Baha and Asir through Al-Sarat, which makes it a tourist stop for travelers throughout the year and provides a great outlet for visitors. What increases the components of this park amid its various activities and services is the flow of its river throughout the year and the density of its wild trees such as mountain olive trees, juniper, acacia, and other trees, which make it a favorite destination for families [70]. The forests and parks of Al-Janabin valleys in the Buljurshi district contain evergreen trees such as olives, acacia, and juniper are abundant, which attract many families. Perhaps what distinguishes these forests and valleys and makes them a tourist destination is that they include archaeological inscriptions scattered on the sides of the valleys and traces of ancient villages, some of which date back more than a thousand years [70], in addition to the Alaqiq forest, which is located 40 km from El Bahah district. For this reason, the city of Al-Baha is considered one of the most attractive cities in the Kingdom of Saudi Arabia for tourists because of the charming nature of this wonderful region. These results of urban concentration explain the great contribution of GI and UGS to well-being, which agrees with the studies in [71,72,73,74,75]. A survey from 2001 to 17 for Melbourne (Australia) [71], reported that UGS access levels are associated with higher well-being levels, especially large UGS areas with green corridors. In the framework of the sustainable development of urban slum areas in northwestern Spain, the authors of [76] reported that the green economy policies are one of the good choices for improving the development of the population and quality of life. In relation to the spatial disparity patterns of buildings and green space (GS), the case of arid urban areas in Sohar wilayat (Oman) assessed by the authors of [77] indicated that the large numbers of GS areas in the majority of neighborhoods were linked with large population size. In the Heritage community park and the Huckleberry Trail and natural area in Blacksburg, Virginia, the authors of [78] examined the impact of GI on human health and well-being. The results showed that visitors that use green infrastructure have positive psychological benefits and attachment to the places with higher psychological and physical health benefits, especially for females. Regarding the relationship between GI and health, the author of [79] concluded that a larger GI has been related to reduced temperatures, air pollution, violence, and crime. On the other hand, although there is some evidence of decreased mortality and good health, this relationship is considered less so with health. A study was carried out between 2012 and 2014 regarding green infrastructure as life support. The study documented that green infrastructure has diverse benefits such as the modification of climatic conditions and temperature, improved well-being and human health, enhanced community liveability, increased economic prosperity, more extensive urban food production, and greater opportunity for biodiversity conservation [79].
The Green Middle East Initiative is considered one of the biggest efforts of the Kingdom of Saudi Arabia, which aims to increase reliance on clean energy, reduce the impact of carbon emissions, and address climate change through which the “Green Saudi Initiative” emerged. The latter seeks to restore the ecosystem such as forests, agricultural lands, wetlands, desert lands, seas, coasts, and mountains. tThe environmental aspect will lead to the planting of 10 billion trees throughout the Kingdom to transform the desert into green land and the rehabilitation of 40 million hectares of land during the coming decades, which is the cornerstone of the Green Saudi Initiative, as afforestation contributes to improving air quality, reducing sand storms, combating desertification, and reducing temperatures in the surrounding areas.
6. Conclusions
In this study, GIS and AHP-based-MCDM were used for GI assessment in the Al Baha region (Saudi Arabia) based on ten criteria (DEM, Slope, TPI, rainfall, distance to the Water Lines, TWI, distance to the road, wind speed, housing high-income group map, employment in the agriculture sector, and LULC). The results revealed four classes of suitability: Poor, Fair, Good, and Excellent. The “Excellent” area for GI planning was estimated at 983 km2 (9%), whereas the “Good” area covered 36% (3987 km2). The excellent and good areas for GI were more localized in the central part of the Al Baha region in the areas of Al Bahah, Elmandaq, Alatawlah, and the central part of Buljurshi. According to the obtained results, the southern part of the study is not suitable for GI planning; this can be explained by the large area of barren land and sand. The findings found in this paper may provide good information for decision-makers of Saudi Vision 2030 to help them to make well-organized practices for the future management and planning of GI. The main strength of this research is the lack of reports and decision tools for GI at the scale of the study area. On the other hand, one of the limitations of this study is the application of one scenario for criteria selection, which opens the door for future planners and researchers to elaborate new studies on GI to improve future management, especially when the GI projects are included in the framework of sustainable development goals (SDGs). Thus, one of the future aims and scope of this research is the investigation of future UGS and urban growth based on the Cellular Automata and Markov Chain (CA-Markov) model.
Author Contributions
R.S. and A.M. conceived the framework of this research, processed data, designed the experiments, plots, and map preparation, validated the processing results, and wrote the manuscript. B.M. and A.A.A. gave feedback on the written manuscript and helped to analyze and edit the manuscript for proper English language, grammar, punctuation, spelling, and technical improvements. All authors have read and agreed to the published version of the manuscript.
Funding
There was a fund of 200,000 Saudi Riyal. This research was funded by Ministry of High education and Al-Baha University (Kingdom of Saudi Arabia). The contract number is MOE-BU-11-2020.
Data Availability Statement
The data that support the findings of this study are available from the corresponding author, [RS], upon reasonable request.
Acknowledgments
We would like to thank the Ministry of High Education and Al-Baha University (Kingdom of Saudi Arabia) for supporting this research which is a part of the research agreement of the Institutional Funding Program for Research and Development conducted in 2022 under the project title of Developing Digital Mapping for Al-Baha Region Using information systems (GIS).
Conflicts of Interest
The authors declare no conflict of interest.
References
- Elbeltagi, A.; Salam, R.; Pal, S.C.; Zerouali, B.; Shahid, S.; Mallick, J.; Islam, M.S.; Islam, A.R.M.T. Groundwater Level Estimation in Northern Region of Bangladesh Using Hybrid Locally Weighted Linear Regression and Gaussian Process Regression Modeling. Theor. Appl. Clim. 2022, 149, 131–151. [Google Scholar] [CrossRef]
- Zerouali, B.; Elbeltagi, A.; Al-Ansari, N.; Abda, Z.; Chettih, M.; Santos, C.A.G.; Boukhari, S.; Araibia, A.S. Improving the Visualization of Rainfall Trends Using Various Innovative Trend Methodologies with Time–Frequency-Based Methods. Appl. Water Sci. 2022, 12, 207. [Google Scholar] [CrossRef]
- Zerouali, B.; Chettih, M.; Abda, Z.; Mesbah, M.; Santos, C.A.G.; Brasil Neto, R.M. A New Regionalization of Rainfall Patterns Based on Wavelet Transform Information and Hierarchical Cluster Analysis in Northeastern Algeria. Theor. Appl. Clim. 2022, 147, 1489–1510. [Google Scholar] [CrossRef]
- El-kenawy, E.S.M.; Zerouali, B.; Bailek, N.; Bouchouich, K.; Hassan, M.A.; Almorox, J.; Kuriqi, A.; Eid, M.; Ibrahim, A. Improved weighted ensemble learning for predicting the daily reference evapotranspiration under the semi-arid climate conditions. Environ. Sci. Pollut Res. 2022, 29, 81279–81299. [Google Scholar] [CrossRef]
- United Nations (UN). Sustainable Development Changes. World Economic and Social Survey 2013. Department of Economic and Social Affairs. United Nations Publications. 2013. Available online: http://www.un.org/en/development/desa/policy/wess/wess_current/wess2013/WESS2013 (accessed on 19 September 2022).
- Shrahily, R.Y.; Alsharif, M.A.; Mobarak, B.A.; Alzandi, A.A. Land Cover Mapping Using GIS and Remote Sensing Databases for Al Baha Region Saudi Arabia. Appl. Sci. 2022, 12, 8115. [Google Scholar] [CrossRef]
- Bedlaoui, D. The Foundations of Designing and Planning Green Spaces and their Impact on the Structuring of the Urban Space, a Case Study of Tellilan Adrar. Master’s Thesis, M’sila University, M’sila, Algeria, 2017; 96p. [Google Scholar]
- Haaland, C.; van den Bosch, C.K. Challenges and Strategies for Urban Green-Space Planning in Cities Undergoing Densification: A Review. Urban For. Urban Green 2015, 14, 760–771. [Google Scholar] [CrossRef]
- Urban Green Spaces and Health; WHO Regional Office for Europe: Copenhagen, Denmark, 2016.
- Kwon, O.H.; Hong, I.; Yang, J.; Wohn, D.Y.; Jung, W.S.; Cha, M. Urban green space and happiness in developed countries. EPJ Data Sci. 2021, 10, 28. [Google Scholar] [CrossRef]
- Porcherie, M.; Linn, N.; Le Gall, A.R.; Thomas, M.-F.; Faure, E.; Rican, S.; Simos, J.; Cantoreggi, N.; Vaillant, Z.; Cambon, L.; et al. Relationship between Urban Green Spaces and Cancer: A Scoping Review. Int. J. Environ. Res. Public Health 2021, 18, 1751. [Google Scholar] [CrossRef] [PubMed]
- Kondo, M.; Fluehr, J.; McKeon, T.; Branas, C. Urban Green Space and Its Impact on Human Health. Int. J. Environ. Res. Public Health 2018, 15, 445. [Google Scholar] [CrossRef] [PubMed]
- Mensah, C.A. Urban green spaces in Africa: Nature and challenges. Int. J. Ecosyst. 2014, 4, 1–11. [Google Scholar] [CrossRef]
- Girma, Y.; Terefe, H.; Pauleit, S.; Kindu, M. Urban Green Infrastructure Planning: The Case of Emerging Towns of. J. Urban Manag. 2019, 8, 75–88. [Google Scholar] [CrossRef]
- Kowe, P.; Mutanga, O.; Dube, T. Advancements in the Remote Sensing of Landscape Pattern of Urban Green Spaces and Vegetation Fragmentation. Int. J. Remote Sens. 2021, 42, 3797–3832. [Google Scholar] [CrossRef]
- Costanza, R.; de Groot, R.; Braat, L.; Kubiszewski, I.; Fioramonti, L.; Sutton, P.; Farber, S.; Grasso, M. Twenty Years of Ecosystem Services: How Far Have We Come and How Far Do We Still Need to Go? Ecosyst. Serv. 2017, 28, 1–16. [Google Scholar] [CrossRef]
- Pinto, L.V.; Inácio, M.; Ferreira, C.S.S.; Ferreira, A.D.; Pereira, P. Ecosystem Services and Well-Being Dimensions Related to Urban Green Spaces—A Systematic Review. Sustain. Cities Soc. 2022, 85, 104072. [Google Scholar] [CrossRef]
- Säumel, I.; Hogrefe, J.; Battisti, L.; Wachtel, T.; Larcher, F. The Healthy Green Living Room at One’s Doorstep? Use and Perception of Residential Greenery in Berlin, Germany. Urban For. Urban Green 2021, 58, 126949. [Google Scholar] [CrossRef]
- Battisti, L.; Pomatto, E.; Larcher, F. Assessment and Mapping Green Areas Ecosystem Services and Socio-Demographic Characteristics in Turin Neighborhoods (Italy). Forests 2019, 11, 25. [Google Scholar] [CrossRef]
- Dasgupta, R.; Basu, M.; Hashimoto, S.; Estoque, R.C.; Kumar, P.; Johnson, B.A.; Mitra, B.K.; Mitra, P. Residents’ Place Attachment to Urban Green Spaces in Greater Tokyo Region: An Empirical Assessment of Dimensionality and Influencing Socio-Demographic Factors. Urban For. Urban Green 2022, 67, 127438. [Google Scholar] [CrossRef]
- Stessens, P.; Canters, F.; Huysmans, M.; Khan, A.Z. Urban Green Space Qualities: An Integrated Approach towards GIS-Based Assessment Reflecting User Perception. Land Use Policy 2020, 91, 104319. [Google Scholar] [CrossRef]
- Song, P.; Kim, G.; Mayer, A.; He, R.; Tian, G. Assessing the Ecosystem Services of Various Types of Urban Green Spaces Based on I-Tree Eco. Sustainability 2020, 12, 1630. [Google Scholar] [CrossRef]
- Chen, H.; Qiu, L.; Gao, T. Application of the Eight Perceived Sensory Dimensions as a Tool for Urban Green Space Assessment and Planning in China. Urban For. Urban Green 2019, 40, 224–235. [Google Scholar] [CrossRef]
- Knobel, P.; Dadvand, P.; Alonso, L.; Costa, L.; Español, M.; Maneja, R. Development of the Urban Green Space Quality Assessment Tool (RECITAL). Urban For. Urban Green 2021, 57, 126895. [Google Scholar] [CrossRef]
- Zawadzka, J.E.; Harris, J.A.; Corstanje, R. Assessment of Heat Mitigation Capacity of Urban Greenspaces with the Use of InVEST Urban Cooling Model, Verified with Day-Time Land Surface Temperature Data. Landsc. Urban Plan. 2021, 214, 104163. [Google Scholar] [CrossRef]
- Kim, I.; Kwon, H. Assessing the Impacts of Urban Land Use Changes on Regional Ecosystem Services according to Urban Green Space Policies via the Patch-Based Cellular Automata Model. Environ. Manag. 2020, 67, 192–204. [Google Scholar] [CrossRef] [PubMed]
- Cetin, M. Using GIS Analysis to Assess Urban Green Space in Terms of Accessibility: Case Study in Kutahya. Int. J. Sustain. Dev. 2015, 420–424. [Google Scholar] [CrossRef]
- Linh, N.H.K.; Tung, P.G.; Chuong, H.V.; Ngoc, N.B.; Phuong, T.T. The Application of Geographical Information Systems and the Analytic Hierarchy Process in Selecting Sustainable Areas for Urban Green Spaces: A Case Study in Hue City, Vietnam. Climate 2022, 10, 82. [Google Scholar] [CrossRef]
- Ustaoglu, E.; Aydınoglu, A.C. Land Suitability Assessment of Green Infrastructure Development. TeMA—J. Land Use Mobil. Environ. 2019, 12, 165–178. [Google Scholar] [CrossRef]
- Ghafari, S.; Kaviani, B.; Sedaghathoor, S.; Allahyari, M.S. Ecological Potentials of Trees, Shrubs and Hedge Species for Urban Green Spaces by Multi Criteria Decision Making. Urban For. Urban Green 2020, 55, 126824. [Google Scholar] [CrossRef]
- Ahamad, M.S.S.; Ahmad, R.; Matori, A.N. Preference Assessment and Prioritization of the Urban Green Space Features Using Qualitative Evaluation and AHP Decision Model. In Proceedings of the AWAM International Conference on Civil Engineering 2019 (AICCE’19), Penang, Malaysia, 21–22 August 2019; pp. 47–69. [Google Scholar] [CrossRef]
- Fichtner, J.; Heemskerk, E.M. The New Permanent Universal Owners: Index Funds, Patient Capital, and the Distinction between Feeble and Forceful Stewardship. Econ. Soc. 2020, 49, 493–515. [Google Scholar] [CrossRef]
- Saudi Vision 2030. Available online: https://www.my.gov.sa/wps/portal/snp/content/saudivision (accessed on 29 July 2022).
- What Do You Know about Al Baha? Available online: https://sites.google.com/site/ksabaha1434/madha-trf-n-albahte (accessed on 25 July 2022).
- USGS. United States Geological Survey. Available online: https://earthexplorer.usgs.gov/ (accessed on 1 March 2022).
- Skentos, A. Topographic Position Index based Landform Analysis of Messaria (Ikaria Island, Greece). Acta Geobalcanica 2017, 4, 7–15. [Google Scholar] [CrossRef]
- Karimzadeh, S.; Matsuoka, M. Building Damage Characterization for the 2016 Amatrice Earthquake Using Ascending–Descending COSMO-SkyMed Data and Topographic Position Index. IEEE J. Sel. Top. Appl. Earth Obs. Remote Sens. 2018, 11, 2668–2682. [Google Scholar] [CrossRef]
- Barbedo, R.; Siqueira, V.; Collischonn, W. Topographic Position-Based Stream Definition (TPS): A Simple Method to Address Spatial Variability of Drainage Density in Stream Networks. Hydrol. Sci. J. 2022, 67, 858–869. [Google Scholar] [CrossRef]
- World Climate Databases. Available online: https://www.worldclim.org/data/worldclim21.html (accessed on 25 May 2022).
- The Climate in Al Baha Region in Saudi Arabia. Available online: https://ainpedia.com/article/Climate-in-the-al-Baha-in-the-kingdom-of-SaudiArabia (accessed on 1 June 2022).
- Geodata Bases. Available online: https://geodata.mit.edu/catalog/ (accessed on 25 May 2022).
- Water Resources in the Al-Baha Region in the Kingdom of Saudi Arabia. Available online: https://ain-m3rfa.com/article/Water-resources-in-the-Al-Baha-region-in-the-Kingdom-of-Saudi-Arabia (accessed on 12 June 2022).
- Beven, K.J.; Kirkby, M.J. A Physically Based, Variable Contributing Area Model of Basin Hydrology / Un Modèle à Base Physique de Zone d’Appel Variable de l’Hydrologie Du Bassin Versant. Hydrol. Sci. J. 1979, 24, 43–69. [Google Scholar] [CrossRef]
- Sørensen, R.; Zinko, U.; Seibert, J. On the Calculation of the Topographic Wetness Index: Evaluation of Different Methods Based on Field Observations. Hydrol. Earth Syst. Sci. Discuss. 2005, 2, 1807–1834. [Google Scholar] [CrossRef]
- Kopecký, M.; Macek, M.; Wild, J. Topographic Wetness Index Calculation Guidelines Based on Measured Soil Moisture and Plant Species Composition. Sci. Total Environ. 2021, 757, 143785. [Google Scholar] [CrossRef]
- Riihimäki, H.; Kemppinen, J.; Kopecký, M.; Luoto, M. Topographic Wetness Index as a Proxy for Soil Moisture: The Importance of Flow-Routing Algorithm and Grid Resolution. Water Resour. Res. 2021, 57, e2021WR029871. [Google Scholar] [CrossRef]
- Pei, T.; Qin, C.-Z.; Zhu, A.-X.; Yang, L.; Luo, M.; Li, B.; Zhou, C. Mapping Soil Organic Matter Using the Topographic Wetness Index: A Comparative Study Based on Different Flow-Direction Algorithms and Kriging Methods. Ecol. Indic. 2010, 10, 610–619. [Google Scholar] [CrossRef]
- Cohen, J.M.; Ernst, K.C.; Lindblade, K.A.; Vulule, J.M.; John, C.C.; Wilson, M.L. Local Topographic Wetness Indices Predict Household Malaria Risk Better than Land-Use and Land-Cover in the Western Kenya Highlands. Malar. J. 2010, 9, 328. [Google Scholar] [CrossRef]
- Learn about the Road Network in Al Baha Region in the Kingdom of Saudi Arabia. Available online: https://ksaency.com/article/Learn-about-the-road-network-in-Al-Baha-region-in-the-Kingdom-of-Saudi-Arabia (accessed on 19 July 2022).
- United Nations Office for Disaster Risk Reduction. United Nations Office for Disaster Risk Reduction and Global Resource Information Database. 2015. GAR15 Global Exposure Dataset for Saudi Arabia. Available online: http://purl.stanford.edu/bb434sw7474 (accessed on 19 July 2022).
- De Bono, A.; Chatenoux, B. A Global Exposure Model for GAR 2015; UNEP-GRID, Global Assessment Report: Geneva, Switzerland, 2015. [Google Scholar]
- Pesaresi, M.; Ehrlich, D.; Ferri, S.; Florczyk, A.; Freire, S.; Haag, F.; Soille, P. Global human settlement analysis for disaster risk reduction. In Proceedings of the International Archives of the Photogrammetry, Remote Sensing & Spatial Information Sciences, Berlin, Germany, 11–15 May 2015. [Google Scholar]
- Tucker, C.J. Red and Photographic Infrared Linear Combinations for Monitoring Vegetation. Remote Sens. Environ. 1979, 8, 127–150. [Google Scholar] [CrossRef]
- Sisodia, P.S.; Tiwari, V.; Kumar, A. Analysis of supervised maximum likelihood classification for remote sensing image. In Proceedings of the International Conference on Recent Advances and Innovations in Engineering (ICRAIE, IEEE), Jaipur, India, 9–11 May 2014; pp. 1–4. [Google Scholar]
- Richards, J. Remote Sensing Digital Image Analysis; Springer: Berlin/Heidelberg, Germany, 1999; 240p. [Google Scholar]
- Anon. The State of the Environment in the Kingdom of Saudi Arabia. In Pat II. The Terrestrial Environment. Meteorological and Environmental Protection Administration, Jeddah, Saudi Arabia; Unpublished Report. 1985. Available online: https://wedocs.unep.org/20.500.11822/29897 (accessed on 19 September 2022).
- Kingery, C.E. Report to the Government of Saudi Arabia on Proposals for Expanding and Improving Range, Pasture and Fodder Development and Management Program; Food and Agriculture Organization: Rome, Italy, 1971; 26p. [Google Scholar]
- Al-Rowaily, S.R.; Assaeed, A.M.; Al-Khateeb, S.A.; Al-Qarawi, A.A.; Al Arifi, F.S. Vegetation and Condition of Arid Rangeland Ecosystem in Central Saudi Arabia. Saudi J. Biol. Sci. 2018, 25, 1022–1026. [Google Scholar] [CrossRef]
- 28% of the Kingdom’s Pastures Are without Vegetation, and Urban Expansion has Reduced Forests. Available online: https://www.alwatan.com.sa/article/336225 (accessed on 29 July 2022).
- Kaddour, O. Current Population Problems in ALBAHA Area. Damascus Univ. J.-Al-Mujamd. 2016, 32, 1530. [Google Scholar]
- Achu, A.L.; Thomas, J.; Reghunath, R. Multi-Criteria Decision Analysis for Delineation of Groundwater Potential Zones in a Tropical River Basin Using Remote Sensing, GIS and Analytical Hierarchy Process (AHP). Groundw. Sustain. Dev. 2020, 10, 100365. [Google Scholar] [CrossRef]
- Piton, G.; Philippe, F.; Tacnet, J.-M.; Gourhand, A. Aide à La Décision Par l’Application de La Méthode AHP (Analytic Hierarchy Process) à l’Analyse Multicritère Des Stratégies d’Aménagement Du Grand Büech à La Faurie. Sci. Eaux. Territ. 2018, 26, 54–57. [Google Scholar] [CrossRef]
- Rahman, M.R.; Shi, Z.H.; Chongfa, C. Assessing Regional Environmental Quality by Integrated Use of Remote Sensing, GIS, and Spatial Multi-Criteria Evaluation for Prioritization of Environmental Restoration. Environ. Monit. Assess. 2014, 186, 6993–7009. [Google Scholar] [CrossRef]
- Saaty, T. The Analytic Hierarchy Process (AHP) for Decision Making; International Symposium on the Analytic: Kobe, Japan, 1980; pp. 1–69. [Google Scholar]
- Rakotoarivelo, J.B. Analyse Comparative de Méthodes Multicritères d’aide à la Décision pour le Secteur Financier. Ph.D. Thesis, Institut en Recherche Informatique de Toulouse, Toulouse, France, 2015. [Google Scholar]
- Ustaoglu, E.; Aydınoglu, A.C. Site Suitability Analysis for Green Space Development of Pendik District (Turkey). Urban For. Urban Green 2020, 47, 126542. [Google Scholar] [CrossRef]
- Nourani, A.; Kaci, F.; Bouaziz, M. Using a Hierarchical Multi-Criteria Analysis to Evaluate Elevators for Server the Date Palm Crown. Agriculture 2016, 7, 04–11. [Google Scholar]
- El-Amraoui Sidi, M.; Rouchdi, M.; Bouziani, M.; El Idrissi, A. Integration du SIG et de l’analyse hierarchique multicritere pour l’aide dans la planification urbaine: Etude de cas de la province de Khemisset, Maroc. Pap. Geogr. 2017, 63, 71–90. [Google Scholar] [CrossRef]
- Uslu, B.; Eren, T.; Gür, Ş.; Özcan, E. Evaluation of the Difficulties in the Internet of Things (IoT) with Multi-Criteria Decision-Making. Processes 2019, 7, 164. [Google Scholar] [CrossRef]
- Learn about the Most Famous Al-Baha Forests. Available online: https://www.wafyapp.com/ar/article/the-most-famous-forests-in-al-baha (accessed on 25 August 2022).
- Sharifi, F.; Nygaard, A.; Stone, W.M. Heterogeneity in the Subjective Well-Being Impact of Access to Urban Green Space. Sustain. Cities Soc. 2021, 74, 103244. [Google Scholar] [CrossRef]
- Reyes-Riveros, R.; Altamirano, A.; De La Barrera, F.; Rozas, D.; Vieli, L.; Meli, P. Linking Public Urban Green Spaces and Human Well-Being: A Systematic Review. Urban For. Urban Green 2021, 61, 127105. [Google Scholar] [CrossRef]
- Nath, T.K.; Zhe Han, S.S.; Lechner, A.M. Urban Green Space and Well-Being in Kuala Lumpur, Malaysia. Urban For. Urban Green 2018, 36, 34–41. [Google Scholar] [CrossRef]
- Kothencz, G.; Kolcsár, R.; Cabrera-Barona, P.; Szilassi, P. Urban Green Space Perception and Its Contribution to Well-Being. Int. J. Environ. Res. Public Health 2017, 14, 766. [Google Scholar] [CrossRef] [PubMed]
- Bertram, C.; Rehdanz, K. The Role of Urban Green Space for Human Well-Being. Ecol. Econ. 2015, 120, 139–152. [Google Scholar] [CrossRef]
- Gago-Cortés, C.; Novo-Corti, I. Sustainable Development of Urban Slum Areas in Northwestern Spain. Manag. Environ. Qual. 2015, 26, 891–908. [Google Scholar] [CrossRef]
- Mansour, S.; Al Nasiri, N.; Abulibdeh, A.; Ramadan, E. Spatial Disparity Patterns of Green Spaces and Buildings in Arid Urban Areas. Build. Environ. 2022, 208, 108588. [Google Scholar] [CrossRef]
- Kim, G.; Miller, P.A. The Impact of Green Infrastructure on Human Health and Well-Being: The Example of the Huckleberry Trail and the Heritage Community Park and Natural Area in Blacksburg, Virginia. Sustain. Cities Soc. 2019, 48, 101562. [Google Scholar] [CrossRef]
- Nieuwenhuijsen, M.J. Green Infrastructure and Health. Annu. Rev. Public Health 2020, 42, 317–328. [Google Scholar] [CrossRef] [PubMed]


Publisher’s Note: MDPI stays neutral with regard to jurisdictional claims in published maps and institutional affiliations. |
© 2022 by the authors. Licensee MDPI, Basel, Switzerland. This article is an open access article distributed under the terms and conditions of the Creative Commons Attribution (CC BY) license (https://creativecommons.org/licenses/by/4.0/).