Article

Partitioning of Ambrosia Beetle Diversity on Teak Plantations in Java, Sumbawa, and Sulawesi Islands

1
Department of Plant Pests and Diseases, Faculty of Agriculture, Universitas Brawijaya, Jl. Veteran, Malang 65145, Indonesia
2
Department of Plant Protection, College of Agriculture, Jiangxi Agricultural University, Nanchang 330045, China
3
Faculty of Agriculture, University of Miyazaki, 1-1, Gakuen Kibanadai Nishi, Miyazaki 889-2192, Japan
4
Department of Plant Pests and Diseases, Faculty of Agriculture, Universitas Hasanuddin, Jl. Perintis Kemerdekaan Km. 10, Makassar 90245, Indonesia
*
Author to whom correspondence should be addressed.
Forests 2022, 13(12), 2111; https://doi.org/10.3390/f13122111
Submission received: 31 October 2022 / Revised: 30 November 2022 / Accepted: 4 December 2022 / Published: 9 December 2022
(This article belongs to the Section Forest Ecology and Management)

Abstract

:
Ambrosia beetles are the largest group of beetles living mutualistically with ambrosia fungi. Increased global shipments of forest and agricultural products have expanded the distribution of some species of ambrosia beetle. We investigated the partitioning diversity of the ambrosia beetle community on teak plantations in Indonesia’s Java, Sumbawa, and Sulawesi Islands. The ambrosia beetles were collected on the twelve sites of teak plantations with different managements (un-thinned and thinned) in Java, Sulawesi, and Sumbawa Islands. Ambrosia beetles were collected ten times at 7-day intervals. The diversity of ambrosia beetles recorded in teak plantations across twelve sites in Java, Sumbawa, and Sulawesi Islands were 17 species and 6154 individuals. Xyleborus affinis (47.17%), Xylosandrus crassiusculus (27.64%), and Hypothenemus sp. (12.33%) were the three dominant species. The highest and lowest species richness were found in the teak plantations in Java and Sumbawa Islands, respectively. The highest and lowest populations of ambrosia beetles were in Sulawesi and Sumbawa islands, respectively. Three factors contribute to the species richness of ambrosia beetles, i.e., temperature, rainfall, and altitude. Stand age, temperature, rainfall, altitude, and teak management contribute to ambrosia beetle abundance. Ambrosia beetle communities among islands show differences between each group, as confirmed by analysis of variance based on homogeneity of multivariate dispersion (sig. 0.001) and permutation test for homogeneity of multivariate dispersions (sign. 0.001). For the group of teak managements, there are differences between both teak managements, as confirmed by analysis of variance based on homogeneity of multivariate dispersion (sig. 0.001) and permutation test for homogeneity of multivariate dispersions (sign. 0.01). Based on the eigenvalues for PCoA axes by the Bray–Curtis method, Sulawesi Island is separate from both Java, and Sumbawa islands. However, Java and Sumbawa islands overlap each other. For groups of teak managements (thinning and non-thinning), there are overlap with each other based on the eigenvalues for PCoA axes by the Bray–Curtis method. The β-1 (Within bottle trap/local scale) contributes the highest to γ-diversity (42.46%). The relative contribution of species replacement (β-sim) in multiple sites across Java, Sumbawa, and Sulawesi Islands (regional scale) provides a high contribution (85%) to overall beta diversity, and the relative contribution of β-nes to the β-sor among sites is 14.03%.

1. Introduction

Community ecology aims to explain the processes that affect patterns of abundance, diversity, distribution, and composition of a species at local and regional scales [1]. The most critical factors in species diversity and distribution are dispersal, speciation, and extinction. Dispersal is expected to reduce community differences, while speciation and extinction are expected to increase variability among distant communities [2]. Three main hypotheses are proposed to explain the origin of beta diversity: (1) the species composition may be stable over large areas, and biological interactions play an essential role, (2) the species composition varies in a random and autocorrelated way, emphasizing spatially limited dispersal, and (3) the species distribution is driven by environmental conditions [3]. Geographical barriers have been linked to speciation, extinction, and community differentiation [4]. On small geographic scales (less than tens of kilometers), populations are typically patchy, however, on larger scales, populations are more evenly distributed [5]. However, the species diversity of insects is influenced by biotic and abiotic factors that may affect species differently at different spatial scales [6,7]. The habitat and management type of forest ecosystem are also driving factors behind the diversity pattern of wood borer insects at a spatial scale [8,9]. Further, understanding the distribution patterns of insects that are the largest components in the ecosystem is necessary due to their impact on the forest, agriculture, and economics [10]. The study of the diversity pattern of wood boring insects in forest ecosystems will be valuable to agriculture management and conservation management [8,9].
Bark and wood-boring insects represent a diverse group of insects, including bark and ambrosia beetles [11]. Ambrosia beetles are the largest group of beetles living mutualistically with ambrosia fungi [12]. Ambrosia beetles are members of the Scolytinae and Platypodinae subfamilies, whereas bark beetles are members of the Scolytinae subfamily of Curculionidae [13]. These beetles are mainly found in tropical and subtropical regions [14]; additionally, increased global shipments of forest and agricultural products have expanded the distribution of some species of ambrosia beetles [15]. Some ambrosia beetle species are capable of rapid dispersal and establishment in new habitats and are among the most common invasive species [16]. For example, some Scolytinae species, such as Ips typographus (Linnaeus, 1758), can fly up to 50 km in a single day [17], and Dendroctonus ponderosae Hopkins, 1902, has been observed to travel hundreds of kilometers in a single day [18]. The flight ability of the ambrosia beetle has been used effectively in finding its host plants over a wide area [19].
Teak (Tectona grandis L. f.) has a discontinuous natural distribution across Myanmar, Laos, Thailand, and India [20]. This species has been widely planted in 70 tropical countries because of the utility and value of its wood and is the most important tropical hardwood tree in the international market [21]. This species was first introduced to Indonesia over 100 years ago on Java Island [20]. It is now naturalized and occurs over an extensive area in Java Island, Muna Island, and Southeast Sulawesi, and large plantations covering 1.2 million ha can be found on Java [21]. Most teak plants in Indonesia appear to be closely linked to Central Laos [21]. The ambrosia beetle communities in the teak of Indonesia are moderately well-known. No ecological studies of ambrosia beetle communities in teak plantations have previously been carried out in Indonesia. Previous research provides a checklist of species associated with teak plantations in East Java [22,23].
Silvicultural thinning to manage inter-tree competition is an essential component of intensive teak plantation management for high-quality timber production [24]. Thinning is advised in young teak plantations to increase the growth rate of young trees [25]. Thinning treatments have been recommended to reduce insect populations and prevent bark beetle infestations [26]. Previous research reported that the silviculture thinning of Pinus taeda L. plantations in central Alabama and Georgia during the summer and winter increases the abundance of black pine bark beetles, Hylastes spp. (Coleoptera: Scolytinae) [27]. Thinning has also been used as a control strategy for the outbreak of Dendroctonus frontalis Zimmermann, 1868 (Coleoptera: Scolytinae), in the Southeastern United States [28]. Thus, in this study, we investigated the factors influencing the beta diversity of ambrosia beetles, including geographical distance and environmental factors, in Java, Sumbawa, and Sulawesi Islands.
Various concepts and methodologies exist in ecology to measure β-diversity, defined here as the variation in species composition between two sites caused by multiple factors, the relative importance of which can vary across spatial scales [29]. Whittaker [30] formalized the relationship between diversity and scale by defining local diversity (α-diversity), habitat diversity (β-diversity), and regional diversity (γ-diversity). Assessing diversity at multiple scales can be performed using the additive partitioning approach [31]. Additive partitioning is a promising method for understanding regional diversity patterns by calculating the sum (γ-diversity) of the mean diversity within an assemblage (α-diversity) and the diversity among the assemblages (β-diversity) [32]. True spatial turnover (β-turn-diversity) and nestedness (β-nest-diversity) are two components of β-diversity, which are the result of two opposing processes, i.e., replacement and species loss [33]. Beta diversity connects local and regional diversity, and understanding the mechanisms underlying its patterns aids in identifying processes driving species diversity patterns at multiple spatial scales [34].
The diversity of beetles with critical functional roles is most strongly influenced at the spatial scales, allowing us to improve management strategies and maintain the health of forest ecosystems [35]. The spatial scales, i.e., forest stands and sites, have more substantial effects on beetle diversity because of diversity in tree communities and management history [35]. Davies et al. [36] also reported that beetle communities may be 10% similar between sites separated by 20 km. The specific objectives of this study are: (1) to investigate the abundance and the species composition of the ambrosia beetles on teak plantations in different sites (within the island) in Indonesia, (2) to discuss the effect of environmental gradient on abundance and species composition of ambrosia beetles in teak plantation, (3) to investigate the effect of silviculture thinning of teak plantation on abundance and species composition of ambrosia beetles, and (4) to clarify the partitioning diversity of ambrosia beetles at a local and regional scale.

2. Materials and Methods

2.1. Study Area

Our study was conducted on teak plantations in the tropical islands of Indonesia, i.e., Java, Sumbawa, and Sulawesi (Figure 1). Twelve sites of teak plantations were used to set up ethanol bait traps, including four sites at an altitude of 136–378 m.a.s.l. on Java Island, four sites at an altitude of 78–184 m.a.s.l. on Sumbawa Island, and four sites at an altitude of 8–27 m.a.s.l. on Sulawesi Island. Teak on the plantations ranged from 3 to 15 years old and are managed under silviculture of thinning and un-thinned (Table 1). Climatic factors such as temperature, humidity, and rainfall were also recorded on each site (Table 1).

2.2. Sampling and Identification of Ambrosia Beetles

At each sampling site, ambrosia beetles were obtained from 20 bottle traps containing 95% ethanol as bait. The bottle trap was made from a transparent polyethylene terephthalate (PET) plastic bottle (with a height of 30 cm, a diameter of 7 cm, and a volume of 1.5 L) [8]. The bottle was modified in the below section as a specimen container (water-containing soap solution), and one window was cut on the side. The bottle traps were deployed along a line transecting the teak forest edges and spaced about 20 m from one another. We replaced baits every five days based on a volume and an average release rate of 3.8 g per day at 25 °C for ethanol [37]. Ambrosia beetles were collected 10 times at 7-day intervals, after which the bait was replenished. In this study, ambrosia beetles were collected in the rainy season from March to April 2022.
All ambrosia beetles trapped in a specimen container were collected and stored in 75% ethanol. Ambrosia beetles were identified at the Plant Pest Laboratory, Department of Plant Pests and Diseases, Faculty of Agriculture, Universitas Brawijaya. The ambrosia beetles were identified based on morphological characters at the species level. The Olympus SZ51 stereomicroscope (Olympus Optical Co., Ltd., Tokyo, Japan) was used to determine the ambrosia beetle species according to the available literature and Southeast Asian Ambrosia Beetle ID [38].

2.3. Data Analyses

To estimate β diversity on each site, we used the additive partitioning approach (γ = α + β) [39]. We considered the mean of ambrosia beetle species per bottle trap as the local diversity (α-diversity), β-1 and β-2 represented the partitioning of γ-diversity at local (bottle trap) and site, respectively. The sum of local α-diversity (within bottle trap), β-1 (among bottle traps), and β-2 (among sites) gives the γ-diversity for the teak plantation on each island. The overall beta diversity (Sørensen dissimilarity; β-sor) was additively partitioned into two components, i.e., the spatial turnover in species composition (Simpson dissimilarity; β-sim) and the variation in species composition because of nestedness (nestedness-driven dissimilarity; β-nes).
Alpha diversity was measured by the iNEXT package [40,41] to estimate the species richness from a rarefaction and extrapolation curves-based sample size. The analysis of variance (ANOVA) and Tukey HSD were applied to analyze the differences in species richness and abundance of ambrosia beetles between each site and island. To achieve normal distribution, data of species richness and abundance of ambrosia beetles were transformed to log (x + 1). The effects of environmental factors on species richness and abundance of ambrosia beetles were analyzed by fitting a generalized linear model (GLM) without interactions [42] and using a quasiPoisson distribution to account for overdispersion. Explanatory variables included stand age, altitude, temperature, rainfall, and teak management. Betadisper and Permutest were adopted to evaluate the homogeneity of multivariate dispersions and permutation test for homogeneity of multivariate dispersions between the determined groups, such as islands and teak management. The β-diversity was analyzed based on the presence or absence of species. The additive partitioning of β-diversity into β-turn and β-nest components was performed by the Betapart package [43]. In addition, ggplot2, Agricolae, and Vegan packages were also applied to run related diversity analyses [44]. All analyses were conducted using R Studio statistical software [45].

3. Results

3.1. Diversity and Composition of Ambrosia Beetles

The diversity of ambrosia beetles recorded in teak plantations across twelve sites in Java, Sumbawa, and Sulawesi Islands were 17 species and 6154 individuals (Table 2). Among the 17 species recorded, one was Platypodinae, and 16 were Scolytinae. Overall, five species with high relative abundance were Xyleborus affinis (Eichhof, 1868), Xylosandrus crassiusculus (Motschulsky, 1866), Hypothenemus sp., Xylosandrus compactus (Eichhoff, 1875), and Xyleborinus exiguus (Walker, 1986), which represented 47.17%, 27.64%, 12.33%, 3.41%, and 1.92% of total species collected, respectively (Table 2). Among the 17 ambrosia beetle species, Hypothenemus sp. was found on all sites in Java, Sumbawa, and Sulawesi Islands (Table 2). Xyleborus eupatorii (Eggers, 1940) was recorded only on Sulawesi Island. Ambrosiodmus asperatus (Wood, 1989), Diuncus quadrispinosulus (Eggers): Hulcr and Cognato, 2009, and Xyleborinus andrewesi (Blandford, 1896) were also recorded only in several sites on Sulawesi Island. Coptodryas sp. was found only on Sumbawa Island (SS1). In the same pattern, Euwallacea fornicatus (Eichhoff, 1868) was also found only on Java Island (JS4). Euplatypus parallelus (Fabricius, 1801), the only species representing subfamily Platypodinae, was found on Java, Sumbawa, and Sulawesi Islands (Table 2).
The Chao estimated species richness analysis showed that Java and Sulawesi Islands had the highest ambrosia beetle species richness (12 species), whereas Sumbawa Island had the lowest (11 species) (Figure 2). Related to the species richness, each site in Sumbawa Island provides younger stand age than others. Java and Sulawesi islands provide older stand age than Sumbawa Island (Figure 2).
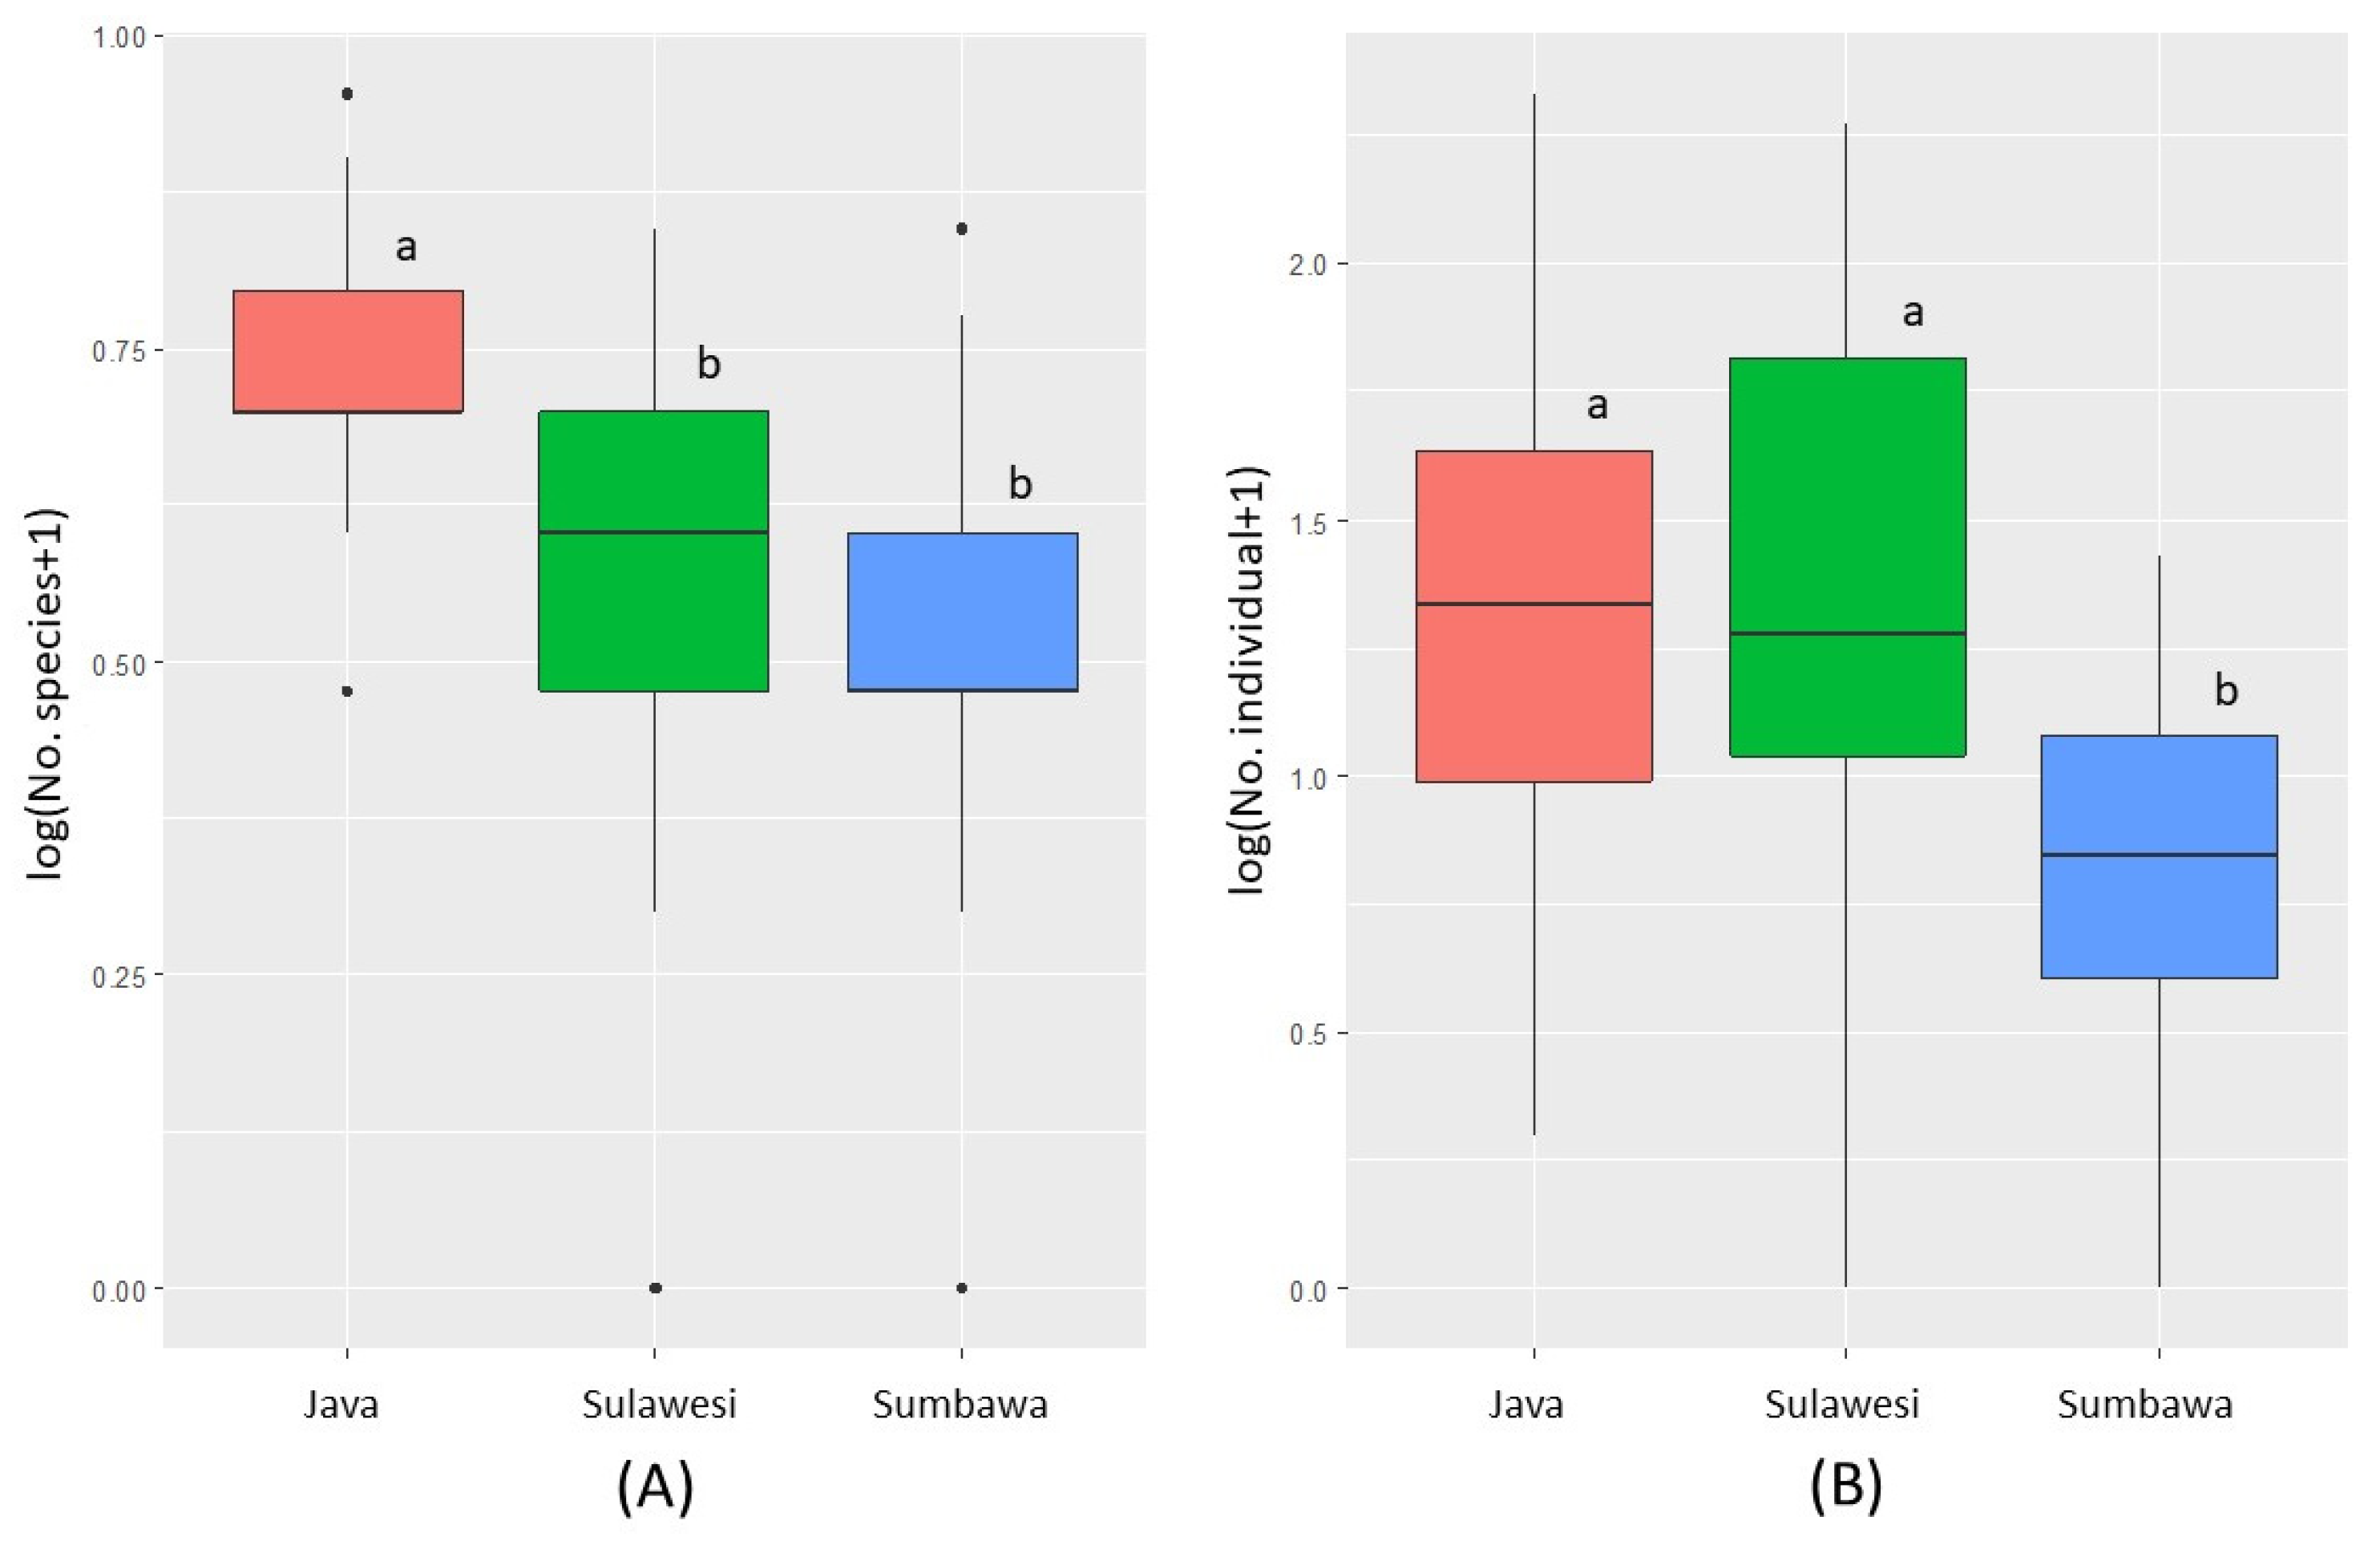
Concerning species richness of ambrosia beetles calculated in the teak plantations in Java, Sumbawa, and Sulawesi Islands (Figure 3), the highest species richness was found in Java Island (F = 15.14, p < 0.001). The abundance of ambrosia beetles was significantly different between the teak plantation in Java, Sumbawa, and Sulawesi Islands (F = 40.27, p < 0.001) (Figure 3). Java and Sulawesi Islands recorded significantly higher numbers than Sumbawa Island based on ambrosia beetle abundance.
The result of GLM showed that ambrosia beetle abundance was positively affected by rainfall (p < 0.001), altitude (p < 0.001), temperature (p = 0.001), stand age (p = 0.025), and teak management (p < 0.001) (Table 3). The species richness of ambrosia beetles was also positively affected by rainfall (p = 0.002), temperature (p = 0.043), and altitude (p < 0.001) (Table 4).
From three models proposed in this study for each variable (abundance and species richness of ambrosia beetles), analysis of deviance determined the differences between both variables. For abundance of ambrosia beetles, analysis of deviance provides a result indicating that there are differences between model 3 and the two other models (p = 2 × 10⁻¹⁶) (Table 3). Regarding species richness, there is no differences between all models (Table 4).
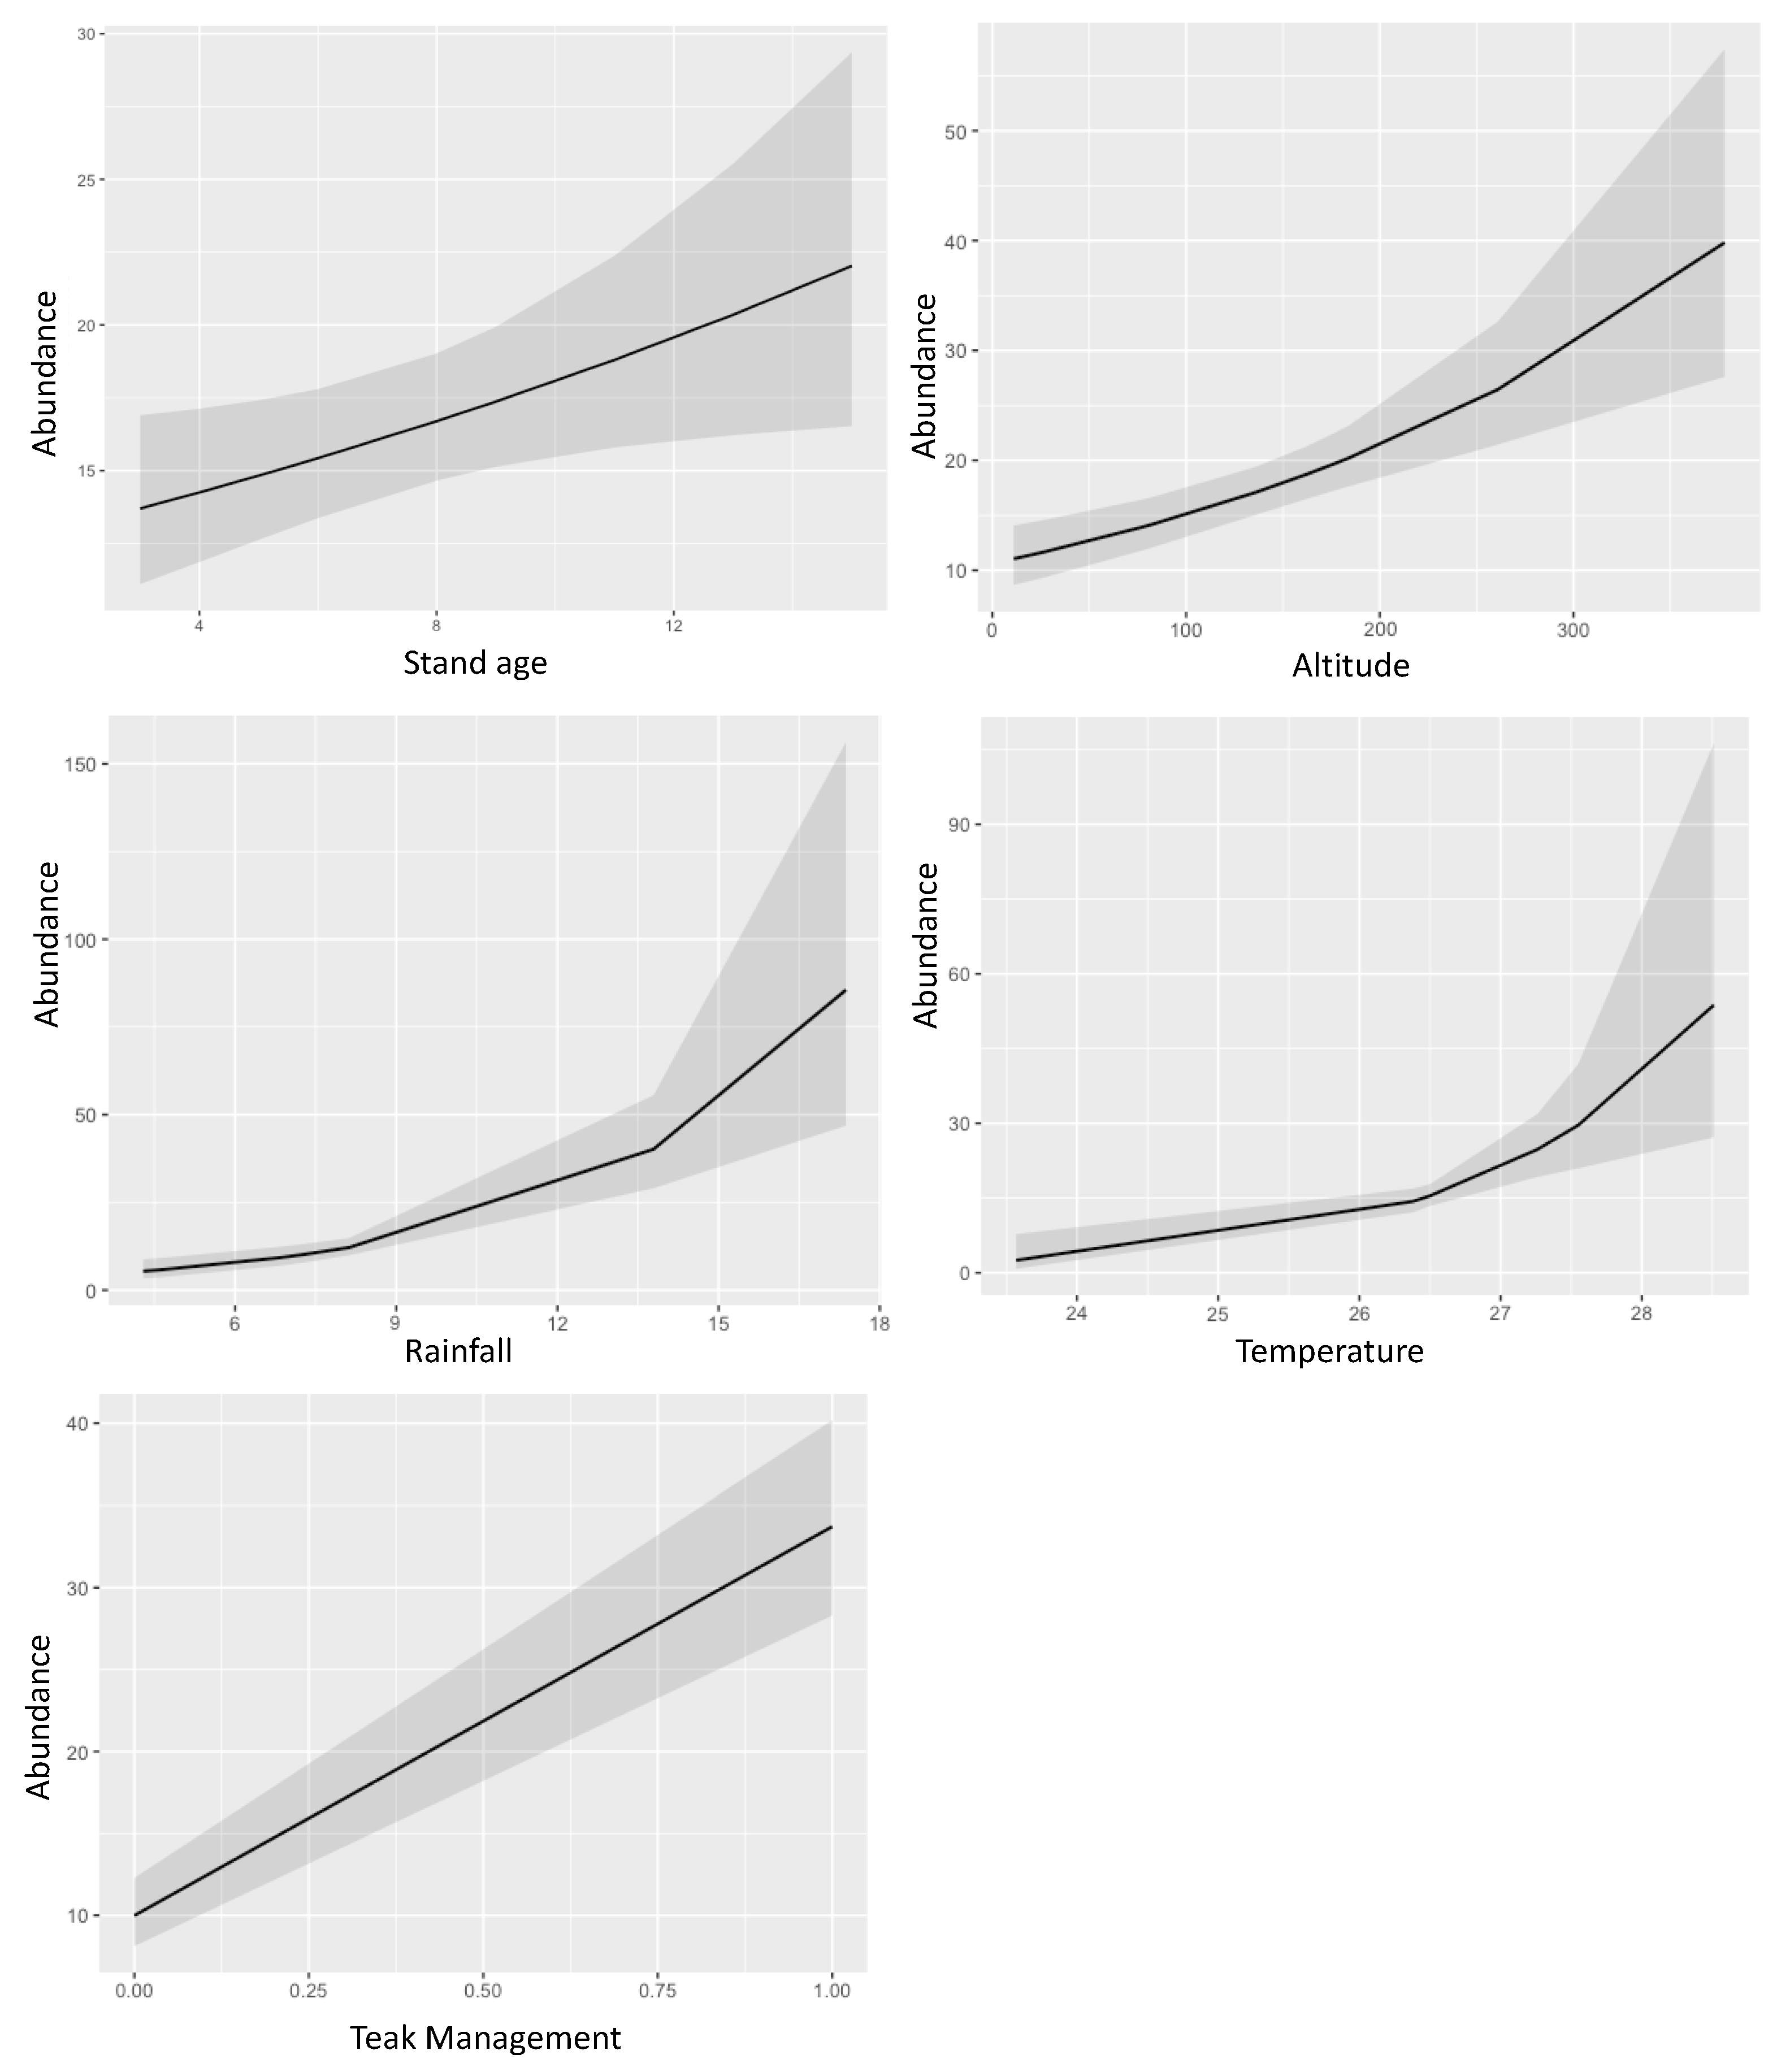
Related to the predicted count of ambrosia beetle abundance, the contribution of each predictor, that is, stand age, temperature, rainfall, altitude, and teak management, are 1.570, 3.908, 5.380, 2.230, and 1.677. A linearity relationship is described by stand age and teak management. The rest of the predictors are close to be logistic curves, as shown in Figure 4.
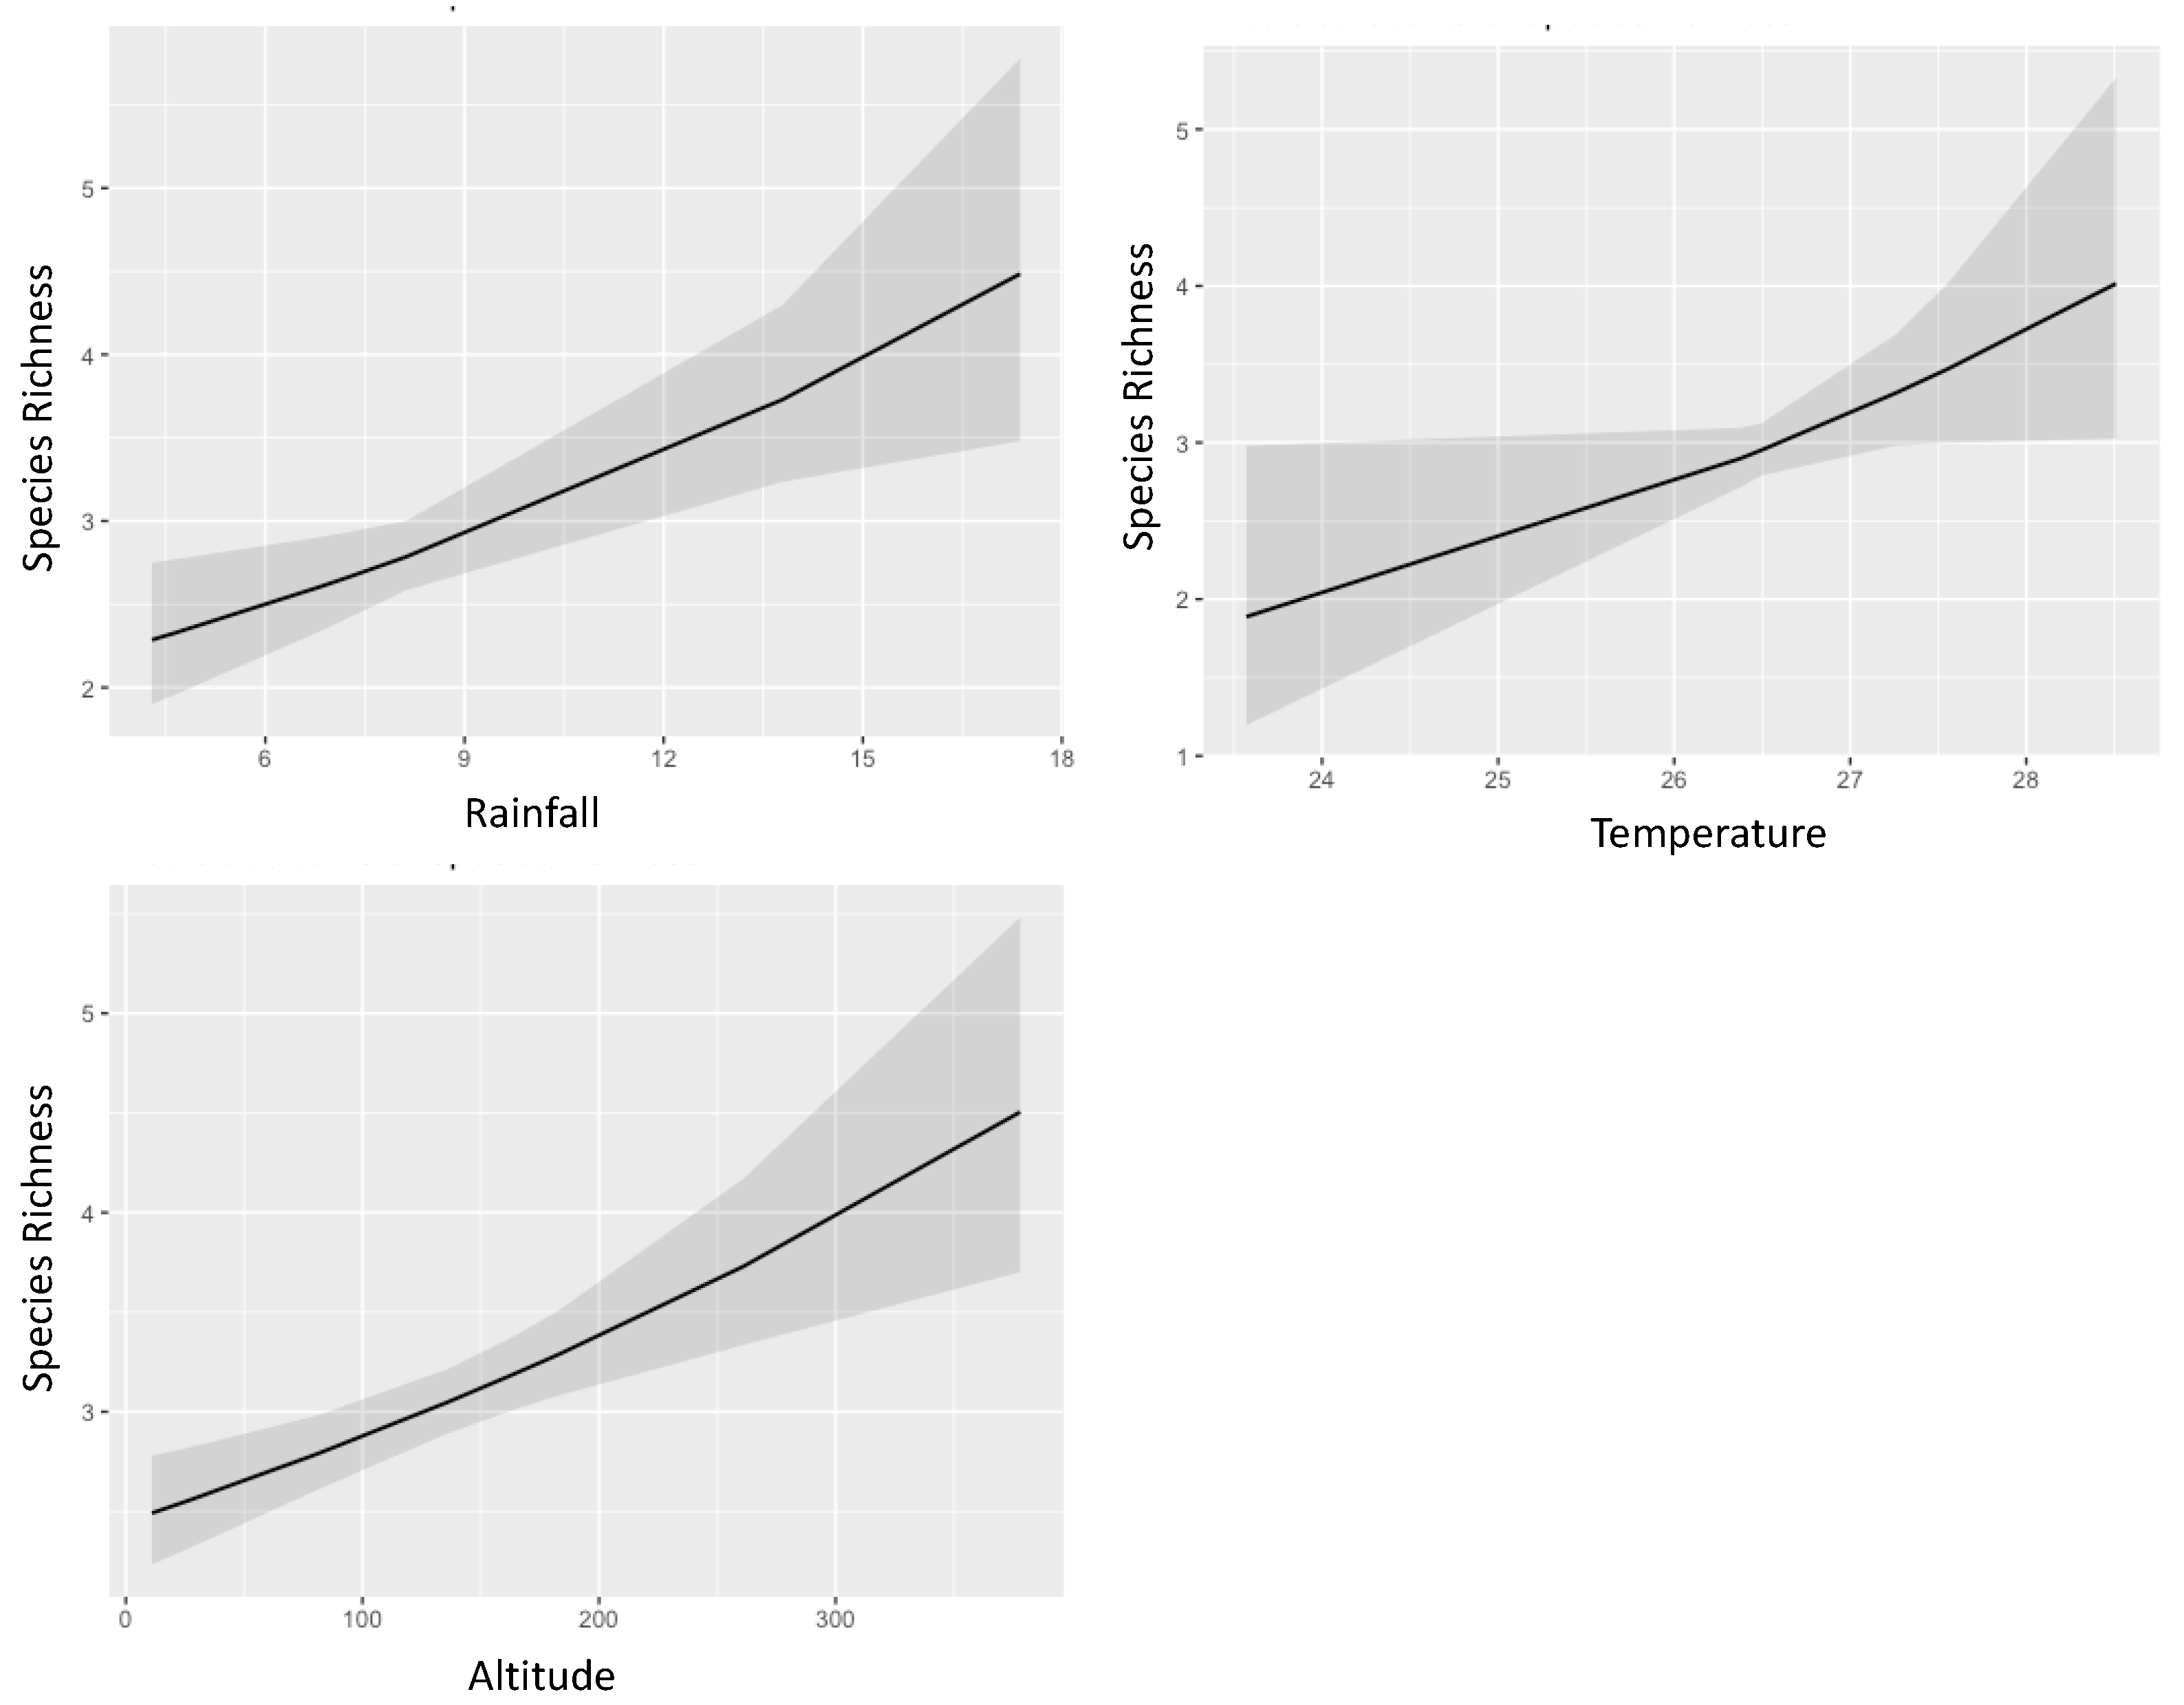
The predicted count of the ambrosia beetle’s species richness describes a linearity relationship to the three factors of rainfall, temperature, and altitude (Figure 5). Validation of Inflation Factor (VIF) for the significant model (model 3) of ambrosia beetle abundance was confirmed with each predictor. Three factors contribute to the species richness of ambrosia beetles. Regarding species richness of ambrosia beetles, the VIF value for the contributing predictors of temperature, rainfall, and altitude are 2.552, 3.221, and 1.495, respectively.
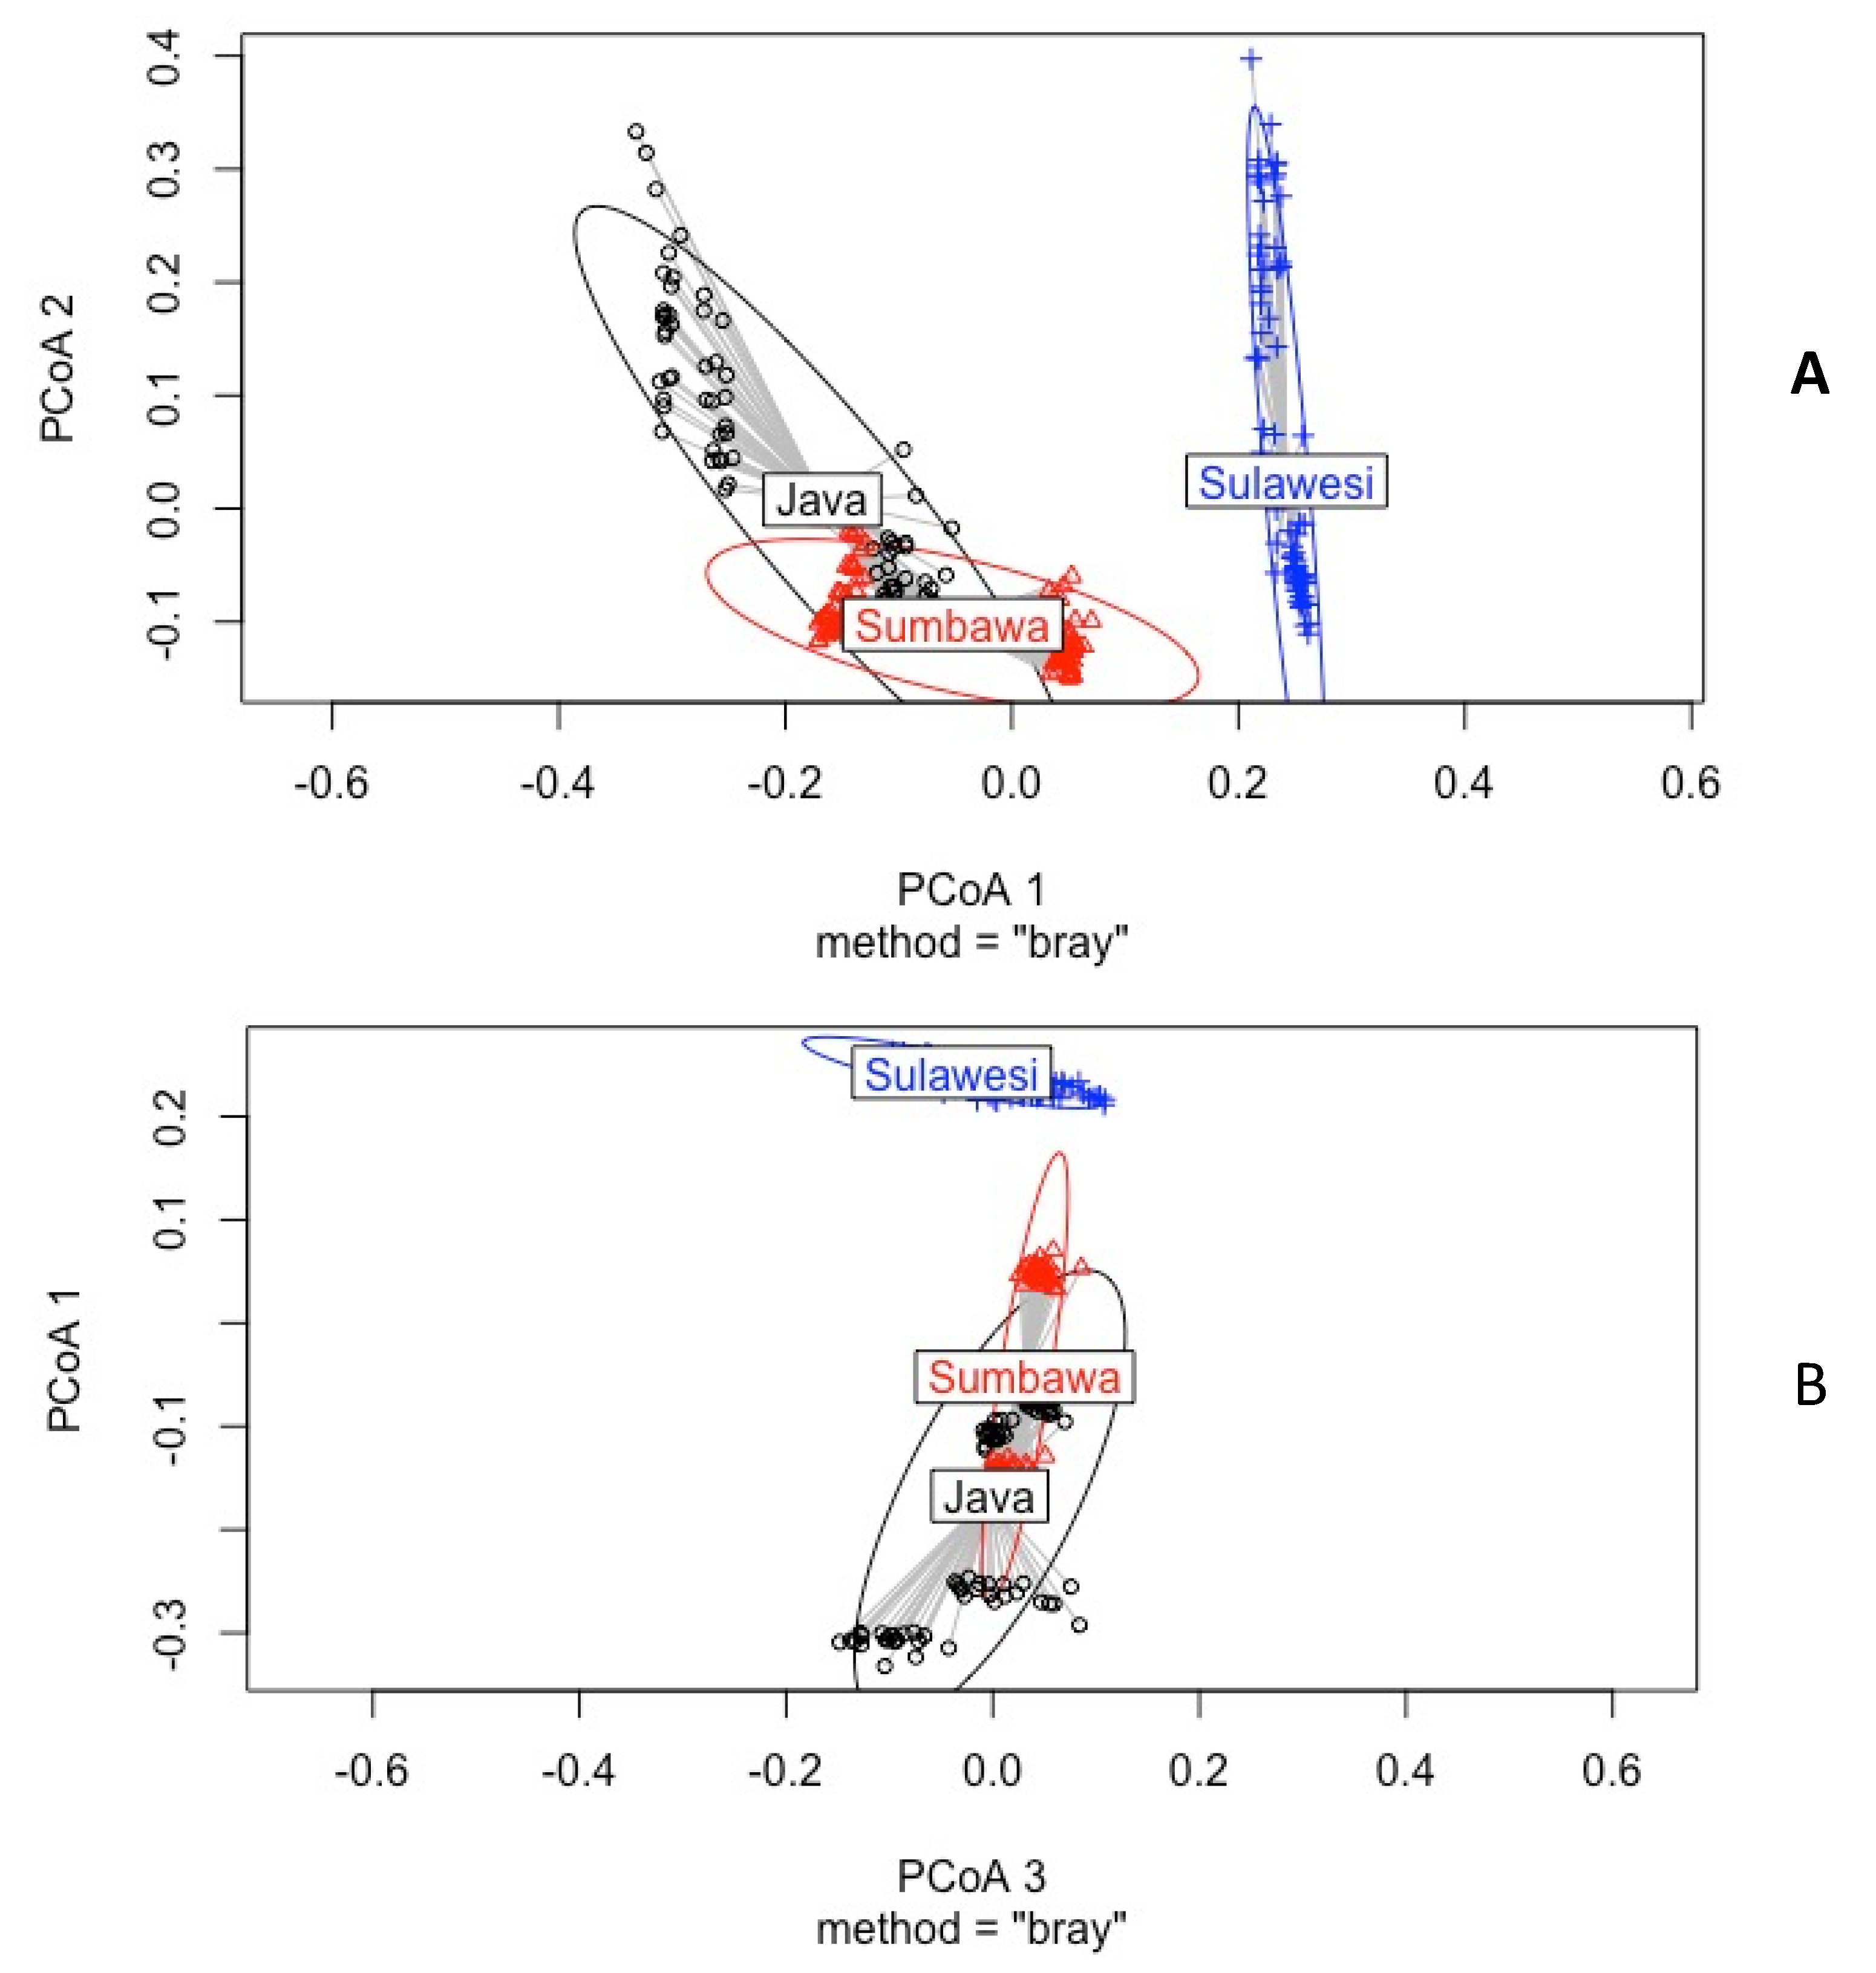
Ambrosia beetle communities among the islands were significantly different, as confirmed by analysis of variance based on homogeneity of multivariate dispersion (sig. 0.001) and permutation test for homogeneity of multivariate dispersions (sig. 0.001). Based on the eigenvalues for PCoA axes, plots of the groups are visualized as shown in Figure 6. Sulawesi island differs from both Java, and Sumbawa islands in Figure 6A (based on PCoA1 and PCoA2). The same tendency is also described in Figure 6B (PCoA1 and PCoA3).
Ambrosia beetle communities between teak managements were different between both teak managements, as confirmed by analysis of variance based on homogeneity of multivariate dispersion (sig. 0.001) and permutation test for homogeneity of multivariate dispersions (sig. 0.01). Based on the eigenvalues for PCoA axes, plots of the groups of teak managements are visualized as shown in Figure 7. Both teak managements (thinning and non-thinning) overlap each other, as is shown in Figure 7A (based on PCoA1 and PCoA2). The same tendency is also described in Figure 7B (PCoA1 and PCoA3).

3.2. Ambrosia Beetles Diversity Partitioning on Teak Plantation

Based on diversity partitioning of species richness, the results showed a substantial contribution of α-diversity at the local scale and β-diversity (β-1 and β-2) to γ-diversity (Figure 8). The contribution of α-diversity at the local scale (within the bottle trap) to γ-diversity was the highest on Java island (27.50%) and the lowest on Sulawesi Island (18.43%). The contribution of β-diversity to γ-diversity among bottle traps (local scale) (β-1) was the highest on Sulawesi Island (56.57%) and the lowest on Java Island (50.23%). Among sites (landscape scale) (β-2), the highest contribution was found on Java Island (27.27%), and the lowest was on Sumbawa Island (23.40%) (Figure 8). We also analyzed diversity partitioning among island scales, and the results showed that β-1 (within bottle trap/local scale) provided the highest contribution to γ-diversity.

3.3. Partitioning the Beta Diversity and Its Components

The results showed that the overall beta diversities (Sørensen dissimilarity-β-sor) among sites on each island (landscape scale) ranged from 0.35 to 0.47. In this study, the relative contribution of species replacement (β-sim) to overall beta diversity was the highest on Java Island (92.97%) and lowest on Sulawesi Island (44.44%) (Table 5). The contribution of β-nes (nestedness) to overall beta diversity was highest on Sulawesi Island (55.56%) and lowest on Java Island (7.03%) (Table 5). As shown in Table 5, the relative contribution of species replacement (β-sim) in multiple sites across Java, Sumbawa, and Sulawesi Islands (regional scale) had a high contribution (85%) to overall beta diversity and the relative contribution of β-nes to the β-sor among sites was 14.03%.

4. Discussion

In the present study, the ambrosia beetle species in teak plantations varied among sites in Java, Sumbawa, and Sulawesi Islands. The highest values of species richness in the teak plantations were on Java Island, and the highest abundance of ambrosia beetles was found on Sulawesi Island. Teak was reportedly firstly introduced into Indonesia on Java Island [20]. The ambrosia beetle, Xyleborus spp., have been reported to attack the living teak trees on Java Island since 1953 [46]. Our study showed that one genus of Xyleborus was collected in all studied islands, namely X. affinis, and it is the most dominant species in all sites of teak plantations. Xyleborus affinis is polyphagous, with a known host range of 248 angiosperms and gymnosperms, and the species can be of economic importance due to its abundance and broad host range [47]. Distribution of this species has also been reported in several countries with a natural distribution of teak, namely India, Myanmar, Laos, and Thailand [48]. This indicates that this genus is well adapted to, and has been established in, the teak forests of Java, and it can spread in a wide range of geographical areas in the tropical region of Indonesia.
The second dominant species is Xylosandrus crassiusculus, most likely native to tropical and subtropical Asia and becoming one of the most common ambrosia beetles [49]. In Indonesia, this species is native to Java and Sulawesi Islands, and it associates with the teak plant [14,46]. The species can attack almost any broad-leaved tree or sapling [50]. On the other hand, X. crassiusculus has also been reported on conifers in East Java, namely on pine trees (Pinus merkusii Jungh et de Vriese) [8]. Xylosandrus crassiusculus occurs in a wide variety of host plants, such as Clove (Syzygium aromaticum), Mahagony (Swietenia mahagoni), and Albizia (Paraserianthes falcataria) in East Java [23]. This indicates that this species is a polyphagous ambrosia beetle [51].
Among the species collected in this study, Hypothenemus sp. is found in all teak plantation sites and is the third dominant species. Our study on the un-thinned teak plantation found no weed control (shrubs) and provided several shrub species. This indicates that Hypothenemus can also be associated with other host plants such as shrubs. Hypothenemus is one of the most diverse Scolytinae genera in all tropical and subtropical regions [47]. The majority of Hypothenemus species are very small (<2 mm long), poorly described, and challenging to differentiate [52]. Several species have a global distribution, which is undoubtedly aided by human activity [52].
We also collected Euplatypus parallelus on all studied islands. This species is the most common species of the subfamily Platypodinae, collected in several studies, including in a Brazilian tropical dry forest [53], Hainan tropical island [54], rubber forests in Brazil [55], a pine forest in East Java [8], a national park in Thailand [56], and an urban tree (Pterocarpus indicus) in East Java [57]. This species has various types of host plants and higher adaptability than other species in this subfamily. Euplatypus parallelus is a highly polyphagous insect that attacks over 82 host-tree species from 25 different families, the majority of which are coniferous or broad-leaved trees [58]. These beetles are widely regarded as the most destructive and most invasive species of all the Platypodinae species, it penetrates the xylem and oviposits in the host tree, thereby weakening the trunk causing it to wither (leaves fall) and die in extreme conditions [14,59].
This study observed differences in selected environmental variables between teak plantations in Java, Sumbawa, and Sulawesi Islands. We found that altitude positively affected abundance and species richness of ambrosia beetles. Our finding suggests that the location of host stands can influence ambrosia beetle species and abundance. Hauptman et al. [60] reported that at the highest altitudes, conditions are the most extreme, and the vertical spread of the species of ambrosia beetles is certainly limited in different forest stands in central Slovenia i.e., Common Silver Fir (Abies alba), Cornish oak (Quercus petraea), and European beech (Fagus sylvatica). Hauptman et al. [60] also reported that the collected species of Scolytinae i.e., X. germanus, Trypodendron domesticum, and T. signatum, in the black cross-vane panel trap at the highest altitude were the most abundant. In Slovakia, X. germanus also was found to attack spruce logs at the highest altitude [61].
Stand age affected the abundance of ambrosia beetles. Due to the increased age of teak trees, the architecture, such as tree diameter, height, and canopy, also changed. This may increase the availability of nesting sites and microhabitats for ambrosia beetles. Reed and Muzika [9] reported that the abundance and species composition of ambrosia beetles of exotic and native species are influenced by stand characteristics such as stand age and forest structure. A high percentage of canopy closure indicates a stable and humid environment suitable for the growth of ambrosia fungi, which are required to develop ambrosia and bark beetles [62]. Canopy closure was significantly associated with ambrosia beetle composition in oak forests [63].
We also found that abundance and species richness of ambrosia beetles are affected by temperature and rainfall. Previous studies reported that temperature and rainfall are key predictors of the number and shape of ambrosia beetle communities [64,65]. Rassati et al. [66] also reported that the species number and the activity density of trapped non-native species ambrosia beetles was positively affected by temperature in deciduous temperate forests, with cold temperatures limiting beetle spread in high-elevation forests. The negative effect of low temperatures can affect the development of ambrosia beetles and their symbiotic fungi, decreasing their metabolic activity with decreasing temperature, and reducing the period of flight and adult beetle activity [67,68,69].
Our research was conducted during the rainy season; this may directly affect the flying activity of ambrosia beetles. Menocal et al. [70] reported that five species of ambrosia beetles, X. crassiusculus, X. affinis, Xyleborus volvulus (Fabricius, 1775), Xyleborus bispinatus Eichhoff, 1868, and X. saxesenii, decreased their flight activities during the rainy season. Precipitation hampers the flight of these tiny beetles by inflicting pressure on their bodies and wings. However, high ambrosia beetle activity has been reported during rainy seasons [71]. Many wood-boring insects, including Scolytinae, have been reported to stay in their host trees until the weather becomes preferable [72,73]. This may not affect the flying activity of the ambrosia beetle. In addition, high rainfall may affect the increase of wood moisture and prevent the desiccation of teak wood. Ambrosia beetles feed on fungi cultivated on the gallery surface, and this is affected by wood moisture as an essential factor. Rainfall prolongs host plant conditions suitable for immature stages of both bark and ambrosia beetles [74].
We found that the abundance of ambrosia beetles was positively affected by teak management. Our study also showed that communities of ambrosia beetles are significantly homogeneous in thinning plots based on teak management groups. Wider spacing of teak plantations promotes greater stem diameter than un-thinned teak plantations (narrow spacing). Teak plantations with thinning demonstrate substantial increases in diameter [75]. Scolytinae beetle abundance can be influenced by tree size and stem density within stands [76]. Tarno et al. [77] reported that ambrosia beetles preferred to attack larger sizes of stem diameter. Stems with larger diameters tend to provide a greater volume of sapwood, which provides enough space to create galleries and cultivate fungi for breeding. The ambrosia beetle fungus has an important role in determining the abundance of the ambrosia beetle. Peltonen and Heliövaara [78] reported that the abundance of the ambrosia beetle T. lineatum was influenced by the ambrosia fungus that formed colonies on the host wood. Sousa and Inacio [79] also stated that ambrosia fungi create a favorable environment for strong development and induce the aggregation pheromones production of ambrosia beetles.
In this study, the greatest β diversity was found among bottle traps (β-1), rather than among sites (landscape and region scale) (β-2). Both β diversities, β-1 and β-2, were higher than α diversity (within the bottle trap); this indicated that each bottle trap in Java, Sumbawa, and Sulawesi Islands represented only a small part of the total γ-diversity on the landscape and regional scale. Ferreira et al. [80] reported that the taxonomic and functional composition of aquatic insect assemblages in neotropical savanna streams is determined by local scale (among streams). Besides species richness, one of the most commonly used indicators for biodiversity assessments is β diversity, which is the key to scaling up to the regional scale. The turnover component (β-sim) leads to driving the temporal dissimilarity at each site in the landscape (each island) during the sampling period. We also found that the component of turnover (β-sim) was higher than nestedness (β-nes) on a regional scale (among islands). Our study indicates that fewer species are shared among landscape sites because of the differences in climate and teak plantation management in the Java, Sumbawa, and Sulawesi sites. The highest contribution of β-sim suggests that the mechanisms involved in site-level ecological filtering promote relatively stronger species replacement than species loss/gain among sites within the same landscape [81]. Rassati et al. [82] also stated that the greater geographical distance between two states, or the difference in mean annual temperature, mean annual rainfall, and forest vegetation, causes the highest differences in the species composition of Scolytinae communities. Hulcr et al. [83] also reported that the similarity of ambrosia beetle communities is not related to their geographical distance in the lowland rainforests of Papua New Guinea. Our findings are in good accordance with their conclusions.

5. Conclusions

Our research describes three factors that contribute to the species richness of ambrosia beetles, i.e., temperature, rainfall, and altitude. Stand age, temperature, rainfall, altitude, and teak management contribute to ambrosia beetle abundance. Based on the eigenvalues for PCoA axes by the Bray–Curtis method, Sulawesi Island is separate from both Java, and Sumbawa islands. However, Java and Sumbawa islands overlap each other. Groups of teak managements (thinning and non-thinning) overlap each other based on the eigenvalues for PCoA axes by the Bray–Curtis method. Xyleborus affinis is the most abundant species in teak plantations in Java, Sumbawa, and Sulawesi Islands. The species composition of ambrosia beetles is primarily determined by differences in species richness, rather than species replacement, indicating that the lowest species number contribute to teak plantation sites at landscape and regional scales. The diversity of ambrosia in teak plantations is provided by the differences between landscape and regional scales.

Author Contributions

Conceptualization, H.T., J.W., S.I. and Y.S.; methodology, H.T. and J.W.; software, Y.S. and H.T.; validation, H.T., J.W. and S.I.; formal analysis, H.T. and S.I.; investigation, M.B.M., T.K., M.S., A.A.A., N.I.S., M.A.A. and Y.S.; data curation, Y.S., H.T. and J.W.; writing—original draft preparation, Y.S. and H.T.; writing—review and editing, H.T., J.W. and S.I.; visualization, Y.S. and H.T.; supervision, J.W. and H.T.; project administration, H.T. and J.W. All authors have read and agreed to the published version of the manuscript.

Funding

This research was funded by One Belt One Road: Innovative Talents Foreign Experts Program with Project, ID: DL2022022001L from 2022 to 2023, People’s Republic of China.

Institutional Review Board Statement

Not applicable.

Informed Consent Statement

Not applicable.

Data Availability Statement

The data presented in this study are available upon request from the corresponding author.

Acknowledgments

This research was supported by the One Belt One Road: Innovative Talents Foreign Experts Program with Project ID: DL2022022001L from 2022 to 2023, People’s Republic of China. In addition, Faculty of Agriculture, Universitas Brawijaya also provided laboratorial facilities to conduct this research. We thank Kazuyoshi Futai for the valuable comments.

Conflicts of Interest

The authors declare no conflict of interest.

References

  1. Ricklefs, R.E. Disintegration of the Ecological Community. Am. Nat. 2008, 172, 741–750. [Google Scholar] [CrossRef] [PubMed]
  2. Soininen, J.; McDonald, R.; Hillebrand, H. The Distance Decay of Similarity in Ecological Communities. Ecography 2007, 30, 3–12. [Google Scholar] [CrossRef]
  3. Legendre, P.; Borcard, D.; Peres-Neto, P.R. Analyzing Beta Diversity: Partitioning the Spatial Variation of Community Composition Data. Ecol. Monogr. 2005, 75, 435–450. [Google Scholar] [CrossRef]
  4. Brooks, D.; Mclennan, D. The Nature of Diversity: An Evolutionary Voyage of Discovery; University of Chicago Press: Chicago, IL, USA, 2002. [Google Scholar] [CrossRef]
  5. Koleff, P.; Gaston, K.J. The Relationships between Local and Regional Species Richness and Spatial Turnover. Glob. Ecol. Biogeogr. 2002, 11, 363–375. [Google Scholar] [CrossRef]
  6. Tack, A.J.M.; Ovaskainen, O.; Harrison, P.J.; Roslin, T. Competition as a Structuring Force in Leaf Miner Communities. Oikos 2009, 118, 809–818. [Google Scholar] [CrossRef]
  7. Wilson, D.S. Complex Interactions in Metacommunities, with Implications for Biodiversity and Higher Levels of Selection. Ecology 1992, 73, 1984–2000. [Google Scholar] [CrossRef]
  8. Tarno, H.; Setiawan, Y.; Putri, R.A.A.; Nardo, A.; Tsamarah, F.G.; Asri, J.; Wang, J. Effect of Pine Forest Management on the Diversity of Ambrosia Beetles (Curculionidae: Platypodinae and Scolytinae) in East Java, Indonesia. Diversity 2022, 14, 484. [Google Scholar] [CrossRef]
  9. Reed, S.; Muzika, R.-M. The Influence of Forest Stand and Site Characteristics on the Composition of Exotic Dominated Ambrosia Beetle Communities (Coleoptera: Curculionidae: Scolytinae). Environ. Entomol. 2010, 39, 1482–1491. [Google Scholar] [CrossRef] [Green Version]
  10. Yotkham, S.; Suttiprapan, P.; Likhitrakarn, N.; Sulin, C.; Srisuka, W. Biodiversity and Spatiotemporal Variation of Longhorn Beetles (Coleoptera: Cerambycidae) in Tropical Forest of Thailand. Insects 2021, 12, 45. [Google Scholar] [CrossRef]
  11. Avtzis, D.N.; Lakatos, F. Bark and Wood Boring Insects-Past, Present, and the Future Knowledge We Need. Insects 2021, 12, 28. [Google Scholar] [CrossRef]
  12. Farrell, B.D.; Sequeira, A.S.; O’Meara, B.C.; Normark, B.B.; Chung, J.H.; Jordal, B.H. The Evolution of Agriculture in Beetles (Curculionidae: Scolytinae and Platypodinae). Evolution 2001, 55, 2011–2027. [Google Scholar] [CrossRef] [PubMed]
  13. Kirkendall, L.R.; Biedermann, P.H.W.; Jordal, B.H. Evolution and Diversity of Bark and Ambrosia Beetles; Elsevier: Amsterdam, The Netherlands, 2015. [Google Scholar] [CrossRef]
  14. Wood, S.L.; Bright, D.E. A Catalog of Scolytidae and Platypodidae (Coleoptera), Part 2: Taxonomic Index. Volume B. Gt. Basin Nat. Mem. 1992, 13, 835–1557. [Google Scholar]
  15. Haack, R.A. Exotic Bark- and Wood-Boring Coleoptera in the United States: Recent Establishments and Interceptions. Can. J. For. Res. 2006, 36, 269–288. [Google Scholar] [CrossRef]
  16. Allen, E.A.; Humble, L.M. Nonindigenous Species Introductions: A Threat to Canada’s Forests and Forest Economy. Can. J. Plant Pathol. 2002, 24, 103–110. [Google Scholar] [CrossRef]
  17. Forsse, E.; Solbreck, C. Migration in the Bark Beetle Ips typographus L.: Duration, Timing and Height of Flight. Z. Angew. Entomol. 2009, 100, 47–57. [Google Scholar] [CrossRef]
  18. Safranyik, L.; Carroll, A.L.; Régnière, J.; Langor, D.W.; Riel, W.G.; Shore, T.L.; Peter, B.; Cooke, B.J.; Nealis, V.G.; Taylor, S.W. Potential for Range Expansion of Mountain Pine Beetle into the Boreal Forest of North America. Can. Entomol. 2010, 142, 415–442. [Google Scholar] [CrossRef]
  19. Sallé, A.; Arthofer, W.; Lieutier, F.; Stauffer, C.; Kerdelhué, C. Phylogeography of a Host-Specific Insect: Genetic Structure of Ips Typographus in Europe Does Not Reflect Past Fragmentation of Its Host. Biol. J. Linn. Soc. 2007, 90, 239–246. [Google Scholar] [CrossRef]
  20. Verhaegen, D.; Fofana, I.; Logossa, Z.; Ofori, D. What Is the Genetic Origin of Teak (Tectona grandis L.) Introduced in Africa and in Indonesia? Tree Genet. Genomes 2010, 6, 717–733. [Google Scholar] [CrossRef] [Green Version]
  21. Prasetyo, E.; Widiyatno, W.; Indrioko, S.; Na’iem, M.; Matsui, T.; Matsuo, A.; Suyama, Y.; Tsumura, Y. Genetic Diversity and the Origin of Commercial Plantation of Indonesian Teak on Java Island. Tree Genet. Genomes 2020, 16, 34. [Google Scholar] [CrossRef]
  22. Setiawan, Y.; Rachmawati, R.; Tarno, H. Diversity of Ambrosia Beetles (Coleoptera: Scolytidae) on Teak Forest in Malang District, East Java, Indonesia. J. Biol. Divers. 2018, 19, 1783–1790. [Google Scholar] [CrossRef]
  23. Tarno, H.; Setiawan, Y.; Kusuma, C.B.; Fitriyah, M.; Hudan, A.N.; Yawandika, A.P.; Nasution, H.A.; Saragih, R.; Bagasta, A.P.Y.; Wang, Z.; et al. Diversity and Species Composition of Bark and Ambrosia Beetles Captured Using Ethanol Baited Traps on Different Hosts in East Java, Indonesia. Zool. Stud. 2021, 60, 1–9. [Google Scholar] [CrossRef]
  24. Pachas, A.N.A.; Sakanphet, S.; Midgley, S.; Dieters, M. Teak (Tectona grandis) Silviculture and Research: Applications for Smallholders in Lao PDR. Aust. For. 2019, 82 (Suppl. S1), 94–105. [Google Scholar] [CrossRef] [Green Version]
  25. Ugalde Arias, L.A. Teak: New Trends in Silviculture, Commercialization and Wood Utilization; International Forestry and Agroforestry: Bogor, Indonesia, 2013; ISBN 9968-47-716-8. [Google Scholar]
  26. Fettig, C.J.; Klepzig, K.D.; Billings, R.F.; Munson, A.S.; Nebeker, T.E.; Negrón, J.F.; Nowak, J.T. The Effectiveness of Vegetation Management Practices for Prevention and Control of Bark Beetle Infestations in Coniferous Forests of the Western and Southern United States. For. Ecol. Manage. 2007, 238, 24–53. [Google Scholar] [CrossRef]
  27. Zeng, Y.; Kidd, K.; Eckhardt, L. The Effect of Thinning and Clear-Cut on Changes in the Relative Abundance of Root-Feeding Beetle (Coleoptera:Curculionidae) in Pinus Taeda Plantations in Central Alabama and Georgia. Pest Manag. Sci. 2014, 70, 915–921. [Google Scholar] [CrossRef]
  28. Mitchell, R.G.; Waring, R.H.; Pitman, G.B. Thinning Lodgepole Pine Increases Tree Vigor and Resistance to Mountain Pine Beetle. For. Sci. 1983, 29, 204–211. [Google Scholar]
  29. Declerck, S.A.J.; Coronel, J.S.; Legendre, P.; Brendonck, L. Scale Dependency of Processes Structuring Metacommunities of Cladocerans in Temporary Pools of High-Andes Wetlands. Ecography 2011, 34, 296–305. [Google Scholar]
  30. Whittaker, R.H. Vegetation of the Siskiyou Mountains, Oregon and California. Ecol. Monogr. 1960, 30, 279–338. [Google Scholar] [CrossRef]
  31. Lande, R. Statistics and Partitioning of Species Diversity, and Similarity among Multiple Communities. Oikos 1996, 76, 5–13. [Google Scholar] [CrossRef]
  32. Veech, J.; Summerville, K.; Crist, T.; Gering, J. The Additive Partitioning of Species Diversity: Recent Revival of an Old Idea. Oikos 2002, 99, 3–9. [Google Scholar] [CrossRef] [Green Version]
  33. Baselga, A.; Lobo, J.M.; Svenning, J.-C.; Araújo, M.B. Global Patterns in the Shape of Species Geographical Ranges Reveal Range Determinants. J. Biogeogr. 2012, 39, 760–771. [Google Scholar] [CrossRef]
  34. Bush, A.; Harwood, T.; Hoskins, A.; Mokany, K.; Ferrier, S. Current Uses of Beta-Diversity in Biodiversity Conservation: A Response to Socolar et Al. Trends Ecol. Evol. 2016, 31, 337–338. [Google Scholar] [CrossRef]
  35. Gering, J.; Crist, T.; Veech, J. Additive Partitioning of Species Diversity across Multiple Spatial Scales: Implications for Regional Conservation of Biodiversity. Conserv. Biol. 2003, 17, 488–499. [Google Scholar] [CrossRef]
  36. Davies, J.G.; Stork, N.E.; Brendell, M.J.D.; Hine, S.J. Beetle Species Diversity and Faunal Similarity in Venezuelan Rainforest Tree Canopies. In Canopy Arthropods; Stork, N.E., Adis, J., Didham, R.K., Eds.; Chapman & Hall: London, UK, 1997; pp. 85–103. [Google Scholar]
  37. Gorzlancyk, A.; Held, D.; Ranger, C.; Barwary, Z.; Kim, D.-J. Capture of Cnestus mutilatus, Xylosandrus crassiusculus, and Other Scolytinae (Coleoptera: Curculionidae) in Response to Green Light Emitting Diodes, Ethanol, and Conophthorin. Fla. Entomol. 2014, 97, 301–303. [Google Scholar] [CrossRef]
  38. Smith, S.M.; Beaver, R.A.; Cognato, A.I.; Hulcr, J.; Redford, A.J. Southeast Asian Ambrosia Beetle ID. Available online: http://idtools.org/id/wbb/sea-ambrosia/about_index.php (accessed on 7 May 2022).
  39. Crist, T.O.; Veech, J.A.; Gering, J.C.; Summerville, K.S. Partitioning Species Diversity across Landscapes and Regions: A Hierarchical Analysis of Alpha, Beta, and Gamma Diversity. Am. Nat. 2003, 162, 734–743. [Google Scholar] [CrossRef] [PubMed] [Green Version]
  40. Chao, A.; Gotelli, N.J.; Hsieh, T.C.; Sander, E.L.; Ma, K.H.; Colwell, R.K.; Ellison, A.M. Rarefaction and extrapolation with Hill numbers: A framework for sampling and estimation in species diversity studies. Ecol. Monogr. 2014, 84, 45–67. [Google Scholar]
  41. Hsieh, T.C.; Ma, K.H.; Chao, A. iNEXT: Interpolation and Extrapolation for Species Diversity. 2020. Available online: https://cran.r-project.org/web/packages/iNEXT/iNEXT.pdf (accessed on 8 November 2022).
  42. Zuur, A.; Ieno, E.; Walker, N.; Saveliev, A.; Smith, G. Mixed Effects Models and Extensions in Ecology with R; Springer: New York, NY, USA, 2009. [Google Scholar]
  43. Baselga, A.; Orme, D.; Villeger, S.; Bortoli, D.; Leprieur, F. Betapart: Partitioning Beta Diversity Into Turnover and Nestedness Components. R Package Version 1.3. Available online: https://cran.r-project.org/web/packages/betapart/index.html (accessed on 24 July 2022).
  44. Oksanen, J.; Blanchet, F.G.; Friendly, M.; Kindt, R.; Legendre, P.; McGlinn, D.; Minchin, P.R.; O’Hara, R.B.; Simpson, G.L.; Solymos, P.; et al. Vegan: Community Ecology Package, R Package Version 2.5-3. 2018. Available online: https://cran.r-project.org/web/packages/vegan/index.html (accessed on 8 November 2022).
  45. R Core Development Team. R: A Language and Environment for Statistical Computing; Springer: Berlin/Heidelberg, Germany, 2018; Volume 2. [Google Scholar] [CrossRef] [Green Version]
  46. Kalshoven, L.G.E. Studies on the Biology of Indonesian Scolytoidea. Tijdschr. Voor Entomol. 1958, 101, 157–180. [Google Scholar]
  47. Wood, S.L. The Bark and Ambrosia Beetles of North and Central America (Coleoptera: Scolytidae), a Taxonomic Monograph. Gt. Basin Nat. Mem. 1982, 6, 1–1359. [Google Scholar]
  48. Smith, S.M.; Beaver, R.A.; Cognato, A.I. A Monograph of the Xyleborini (Coleoptera, Curculionidae, Scolytinae) of the Indochinese Peninsula (except Malaysia) and China. Zookeys 2020, 983, 1–442. [Google Scholar] [CrossRef]
  49. Urvois, T.; Auger-Rozenberg, M.A.; Roques, A.; Rossi, J.P.; Kerdelhue, C. Climate Change Impact on the Potential Geographical Distribution of Two Invading Xylosandrus Ambrosia Beetles. Sci. Rep. 2021, 11, 1339. [Google Scholar] [CrossRef]
  50. Atkinson, T.H.; Foltz, J.L.; Wilkinson, R.C.; Mizell, R.F. Granulate Ambrosia Beetle, Xylosandrus Crassiusculus (Motschulsky) (Insecta: Coleoptera: Curculionidae: Scolytinae). IFAS Extention 2011, 2011, 2–5. [Google Scholar] [CrossRef]
  51. Kirkendall, L.R.; Faccoli, M. Bark Beetles and Pinhole Borers (Curculionidae, Scolytinae, Platypodinae) Alien to Europe. Zookeys 2010, 56, 227–251. [Google Scholar] [CrossRef] [Green Version]
  52. Vega, F.; Infante, F.; Johnson, A. The Genus Hypothenemus, with Emphasis on H. Hampei, the Coffee Berry Borer. In Bark Beetles: Biology and Ecology of Native and Invasive Species; Elsevier: Amsterdam, The Netherlands, 2015; pp. 427–497. [Google Scholar] [CrossRef]
  53. Macedo-Reis, L.; Novais, S.; Monteiro, G.; Flechtmann, C.; Neves, F. Spatio-Temporal Distribution of Bark and Ambrosia Beetles in a Brazilian Tropical Dry Forest. J. Insect Sci. 2016, 16, 48. [Google Scholar] [CrossRef]
  54. Li, Y.; Zhou, X.; Lai, S.; Yin, T.; Ji, Y.; Wang, S.; Wang, J.; Hulcr, J. First Record of Euplatypus parallelus (Coleoptera: Curculionidae) in China. Fla. Entomol. 2018, 101, 141–143. [Google Scholar] [CrossRef] [Green Version]
  55. Tiago Neto, L.J.; Pereira, J.M.; Rodrigues, O.D.; Lima, N.L.; Froio, L.D.L.; Flechtmann, C.A.H. Diversity of Scolytinae, Platypodinae (Curculionidae) and Bostrichidae in Hevea brasiliensis (Willd. Ex A.Juss.) in the State of Goiás, Brazil. Cienc. Florest. 2022, 32, 493–503. [Google Scholar] [CrossRef]
  56. Beaver, R. The Invasive Neotropical Ambrosia Betle Euplatypus parallelus (Fabricus, 1801) in the Oriental Region and Its Pest Status (Coleoptera:Curculionidae, Platypodinae). Entomol. Mon. Mag. 2013, 149, 143–154. [Google Scholar]
  57. Tarno, H.; Setiawan, Y.; Rahardjo, B.T.; Wang, J. Evaluation of the Ambrosia Beetles Traps on Pterocarpus indicus in Indonesia. J. Biol. Divers. 2021, 22, 1332–1339. [Google Scholar] [CrossRef]
  58. Gümüş, M.; Ergün, A. Report of a Pest Risk Analysis for Platypus Parallelus (Fabricus, 1801) for Turkey. EPPO Bull. 2015, 45, 112–118. [Google Scholar] [CrossRef]
  59. Tarno, H.; Suprapto, H.; Himawan, T. New Record of the Ambrosia Beetle, Treptoplatypus micrurus Schedl. Attack on Sonokembang (Pterocarpus indicus Willd.) in Batu, Indonesia. Agrivita 2015, 37, 220–225. [Google Scholar]
  60. Hauptman, T.; Pavlin, R.; Grošelj, P.; Jurc, M. Distribution and abundance of the alien Xylosandrus germanus and other ambrosia beetles (Coleoptera: Curculionidae, Scolytinae) in different forest stands in central Slovenia. iForest 2019, 12, 451–458. [Google Scholar] [CrossRef] [Green Version]
  61. Galko, J.; Dzurenko, M.; Ranger, C.M.; Kulfan, J.; Kula, E.; Nikolov, C.; Zubrik, M.; Zach, P. Distribution, habitat preference, and management of the invasive ambrosia beetle Xylosandrus germanus (Coleoptera: Curculionidae, Scolytinae) in European forests with an emphasis on the West Carpathians. Forests 2019, 10, 10. [Google Scholar] [CrossRef] [Green Version]
  62. Flerchinger, G.; Reba, M.; Link, T.; Marks, D. Modeling Temperature and Humidity Profiles within Forest Canopies. Agric. For. Meteorol. 2015, 213, 251–262. [Google Scholar] [CrossRef]
  63. Holusa, J.; Fiala, T.; Foit, J. Ambrosia Beetles Prefer Closed Canopies: A Case Study in Oak Forests in Central Europe. Forests 2021, 12, 1223. [Google Scholar] [CrossRef]
  64. Marini, L.; Haack, R.A.; Rabaglia, R.J.; Petrucco, T.E.; Battisti, A.; Faccoli, M. Exploring associations between international trade and environmental factors with establishment patterns of alien Scolytinae. Biol. Invasions 2011, 13, 2275–2288. [Google Scholar]
  65. Reich, R.M.; Lundquist, J.E.; Acciavatti, R. Influence of climatic conditions and elevation on the spatial distribution and abundance of Trypodendron ambrosia beetles (Coleoptera: Curculionidae: Scolytinae) in Alaska. For. Sci. 2014, 60, 308–316. [Google Scholar] [CrossRef]
  66. Rassati, D.; Faccoli, M.; Battisti, A.; Marini, L. Habitat and climatic preferences drive invasions of non-native ambrosia beetles in deciduous temperate forests. Biol. Invasions 2016, 18, 2809–2821. [Google Scholar] [CrossRef]
  67. Hofstetter, R.W.; Dempsey, T.D.; Klepzig, K.D.; Ayres, M.P. Temperature-dependent effects on mutualistic, antagonistic, and commensalistic interactions among insects, fungi and mites. Community Ecol. 2007, 8, 47–56. [Google Scholar]
  68. Rice, A.V.; Thormann, M.N.; Langor, D.W. Mountain pine beetle-associated blue stain fungi are differentially adapted to boreal temperatures. For. Pathol. 2008, 38, 113–123. [Google Scholar] [CrossRef]
  69. Reding, M.E.; Ranger, C.M.; Oliver, J.B.; Schultz, P.B. Monitoring attack and flight activity of Xylosandrus spp. (Coleoptera: Scolytinae Curculionidae:): The influence of temperature on activity. J. Econ. Entomol. 2013, 106, 1780–1787. [Google Scholar] [CrossRef]
  70. Menocal, O.; Kendra, P.E.; Padilla, A.; Chagas, P.C.; Chagas, E.A.; Crane, J.H.; Carrillo, D. Influence of Canopy Cover and Meteorological Factors on the Abundance of Bark and Ambrosia Beetles (Coleoptera: Curculionidae) in Avocado Orchards Affected by Laurel Wilt. Agronomy 2022, 12, 547. [Google Scholar] [CrossRef]
  71. Martínez, M.; Cognato, A.I.; Guachambala, M.; Boivin, T. Bark and Ambrosia Beetle (Coleoptera: Curculionidae: Scolytinae) Diversity in Natural and Plantation Forests in Ecuador. Environ. Entomol. 2019, 48, 603–613. [Google Scholar] [CrossRef]
  72. Coulson, R.N.; Witter, J.A. Forest Entomology: Ecology and Management; John Wiley & Sons: Hoboken, NJ, USA, 1984. [Google Scholar]
  73. Raffa, K.F.; Grégoire, J.C.; Lindgren, B.S. Natural History and Ecology of Bark Beetles. In Bark Beetles: Biology and Ecology of Native and Invasive Species; Vega, F., Hofstetter, R., Eds.; Academic Press: Cambridge, MA, USA, 2015. [Google Scholar]
  74. Sanguansub, S.; Buranapanichpan, S.; Beaver, R.; Saowaphak, T.; Tanaka, N.; Kamata, N. Influence of Seasonality and Climate on Captures of Wood-Boring Coleoptera (Bostrichidae and Curculionidae (Scolytinae and Platypodinae) Using Ethanol-Baited Traps in a Seasonal Tropical Forest of Northern Thailand. J. For. Res. 2020, 25, 223–231. [Google Scholar] [CrossRef]
  75. Hindmarch, T.; Reid, M. Thinning of Mature Lodgepole Pine Stands Increases Scolytid Bark Beetle Abundance and Diversity. Can. J. For. Res. 2001, 31, 1502–1512. [Google Scholar] [CrossRef]
  76. Dieters, M.; Newby, J.; Cramb, R.; Sexton, G.; McNamara, S.; Johnson, M.M.; Sakanphet, M.S.; Sodarak, M.H.; Kikeo, M.; Savathvong, M.S. Enhancing On-Farm Incomes through Improved Silvicultural Management of Teak in Luang Prabang Province of Lao PDR; ACIAR: Canberra, Australia, 2014; pp. 1–121.
  77. Tarno, H.; Suprapto, H.; Himawan, T. First Record of Ambrosia Beetle (Euplatypus paralellus Fabricius) Infestation on Sonokembang (Pterocarpus Indicus Willd.) from Malang Indonesia. Agrivita 2014, 36, 189–200. [Google Scholar] [CrossRef] [Green Version]
  78. Peltonen, M.; Heliövaara, K. Attack Density and Breeding Success of Bark Beetles (Coleoptera, Scolytidae) at Different Distances from Forest-Clearcut Edge. Agric. For. Entomol. 1999, 1, 237–242. [Google Scholar] [CrossRef]
  79. Sousa, E.; Inacio, M.L. New Aspects of Platypus cylindrus Fab. (Coleoptera: Platypodidae) Life History on Cork Oak Stands in Portugal. In Mediterranean Forest Ecosystems; Lieutier, F., Ghaioule, D., Eds.; INRA Editions: Paris, France, 2005; pp. 147–168. [Google Scholar]
  80. Ferreira, W.; Hepp, L.; Ligeiro, R.; Macedo, D.; Hughes, R.; Kaufmann, P. Partitioning Taxonomic Diversity of Aquatic Insect Assemblages and Functional Feeding Groups in Neotropical Savanna Headwater Streams. Ecol. Indic. 2017, 72, 365–373. [Google Scholar] [CrossRef]
  81. Schmidt, M.H.; Roschewitz, I.; Thies, C.; Tscharntke, T. Differential Effects of Landscape and Management on Diversity and Density of Ground-Dwelling Farmland Spiders. J. Appl. Ecol. 2005, 42, 281–287. [Google Scholar] [CrossRef]
  82. Rassati, D.; Faccoli, M.; Haack, R.A.; Rabaglia, R.J.; Petrucco Toffolo, E.; Battisti, A.; Marini, L. Bark and Ambrosia Beetles Show Different Invasion Patterns in the USA. PLoS ONE 2016, 11, e0158519. [Google Scholar] [CrossRef] [Green Version]
  83. Hulcr, J.; Novotny, V.; Maurer, B.A.; Cognato, A.I. Low beta diversity of ambrosia beetles (Coleoptera: Curculionidae: Scolytinae and Platypodinae) in lowland rainforests of Papua New Guinea. Oikos 2008, 117, 214–222. [Google Scholar] [CrossRef]
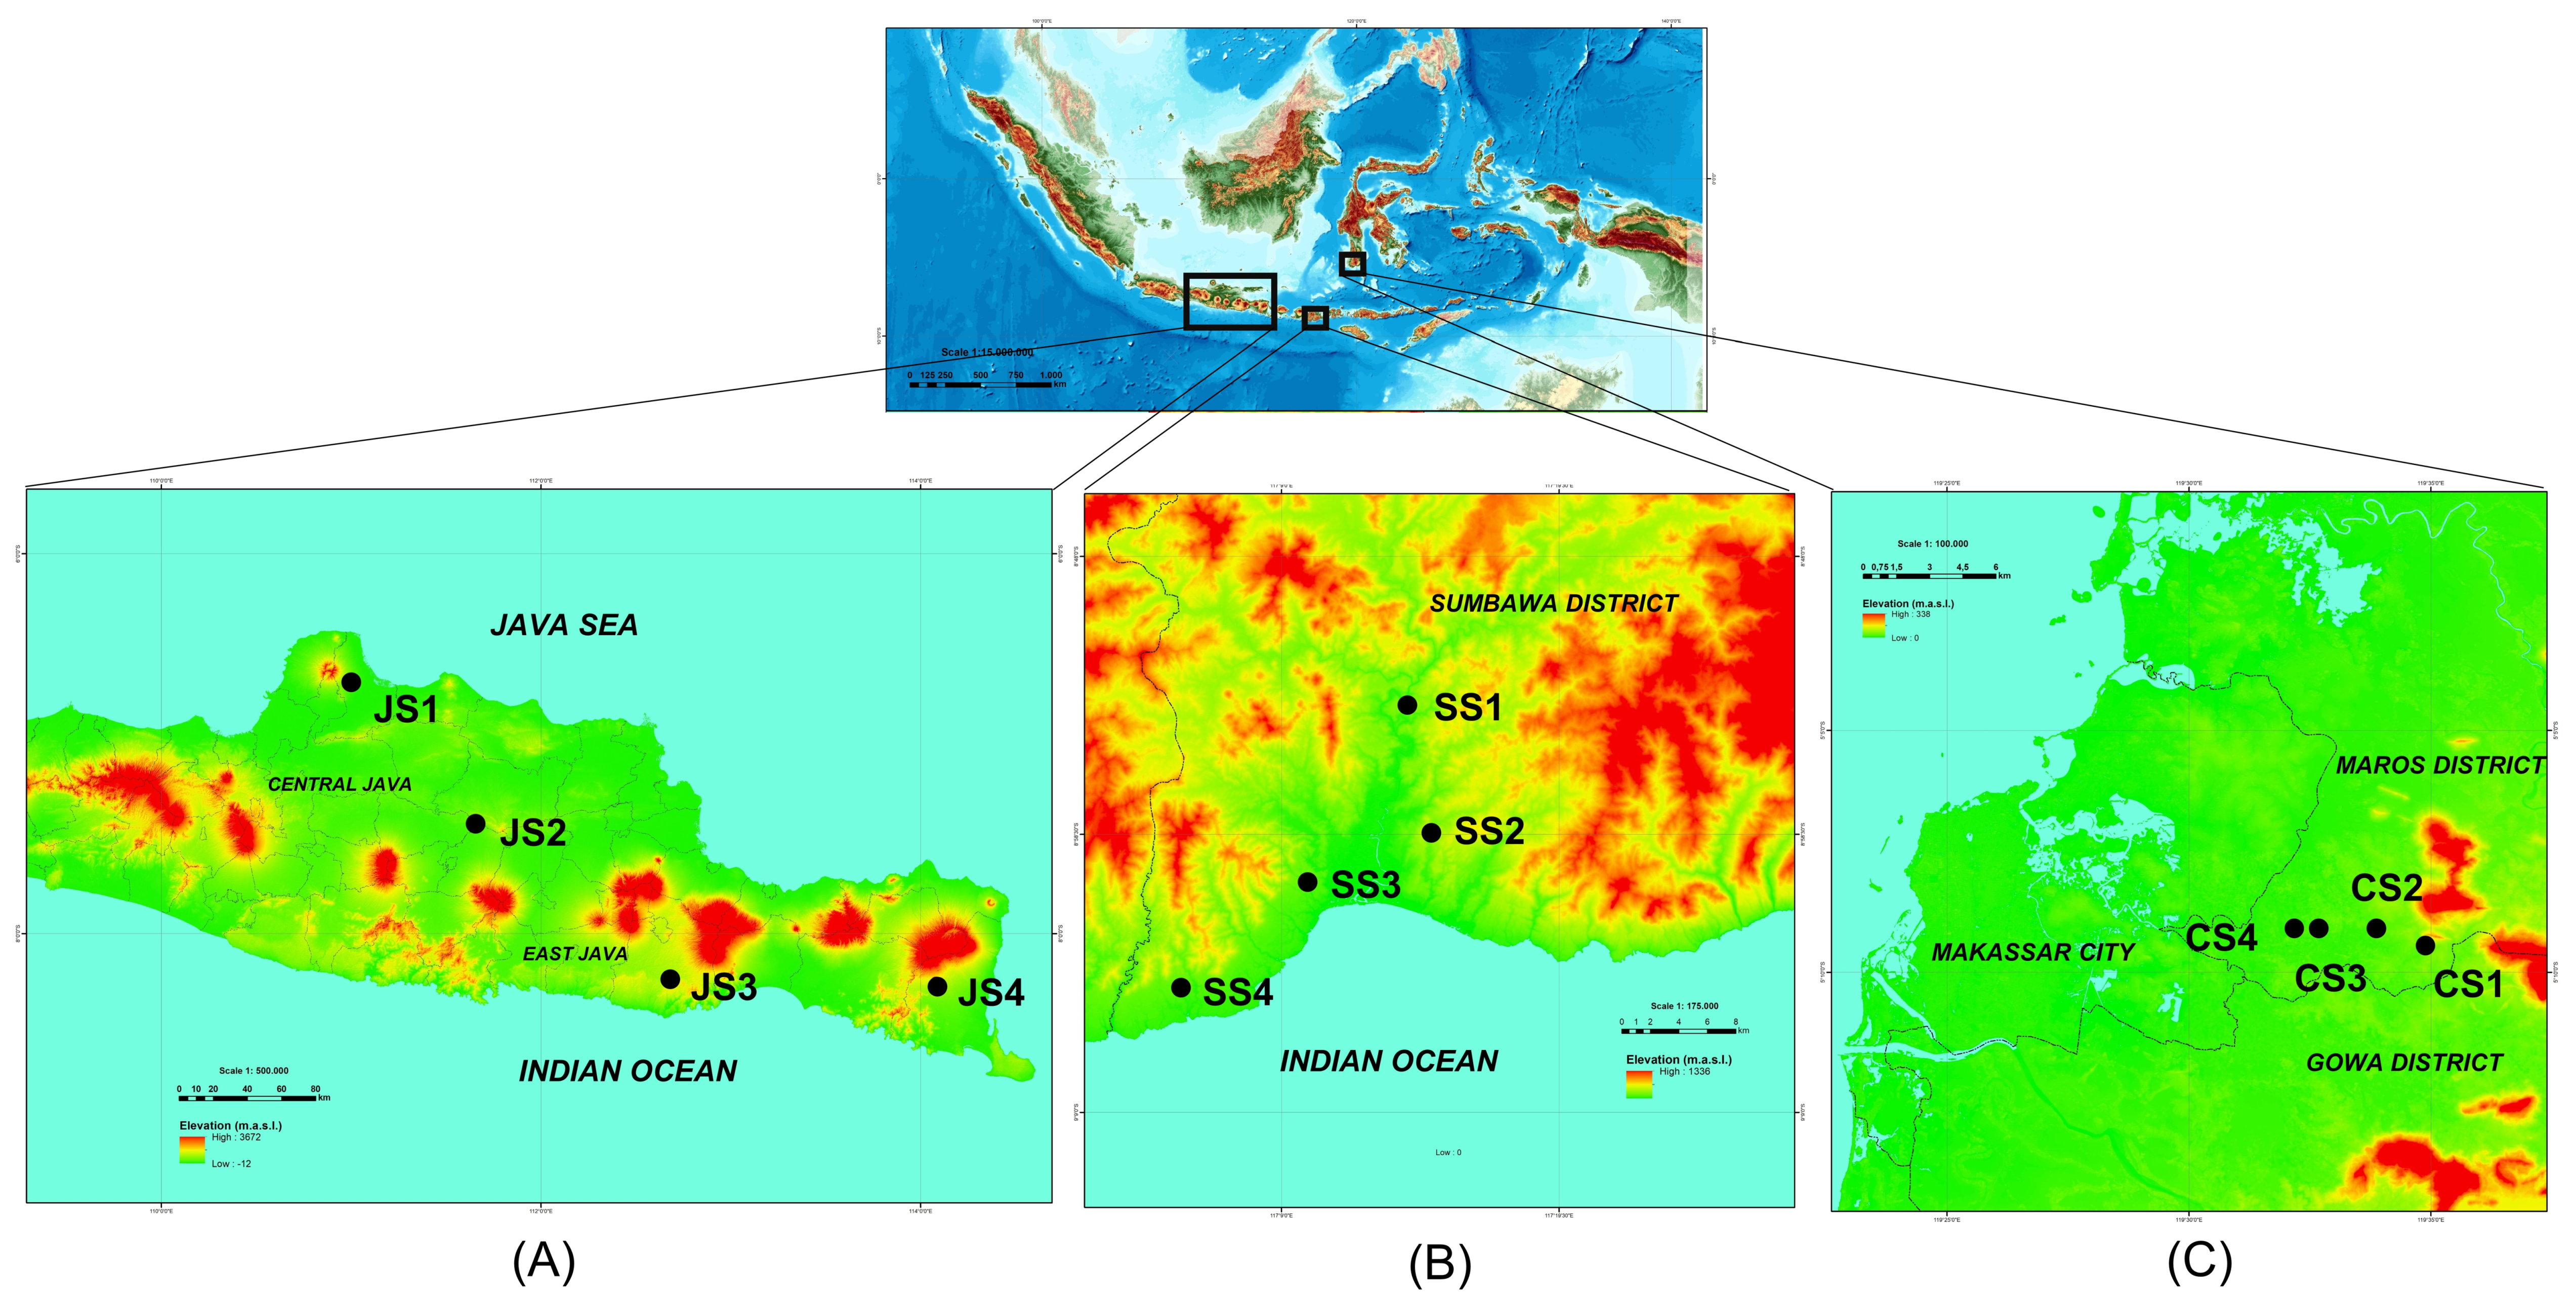
Figure 1. Map showing the twelve sites (black circles) in Indonesia’s Java (A), Sumbawa (B), and Sulawesi islands (C). The first and the second letters indicate the island and site (J = Java, S = Sumbawa, C = Sulawesi). The third letters are the number of sites on each island.
Forests 13 02111 g001
Figure 2. Comparison of the ambrosia beetle species richness on three observed Islands. Rarefaction (solid line segment) and extrapolation (dotted line segments) sampling curves at 95% confidence intervals (shaded areas). The solid dots/triangles represent the reference samples.
Forests 13 02111 g002
Figure 3. Species richness (A) and abundance (B) of ambrosia beetles between Java, Sumbawa, and Sulawesi islands. To achieve normal distribution, data of species richness and individual ambrosia beetle were transformed to log (x + 1). Above each box plot, different letters indicate significant differences (Tukey’s test, p < 0.05). Bars represent the interquartile range with the median value. Circles indicate outliers. Vertical solid lines indicate the minimum and maximum values.
Forests 13 02111 g003
Figure 4. Predicted count of ambrosia beetle abundance on each significant factor: stand age, rainfall, altitude, temperature, and teak management.
Forests 13 02111 g004
Figure 5. Predicted count of ambrosia beetle species richness on each significant factor, that is, rainfall, altitude, and temperature.
Forests 13 02111 g005
Figure 6. Plot of the groups and distances to centroids based on PCoA1 and PCoA2 (A) and based on PCoA3 and PCoA1 (B) between islands.
Forests 13 02111 g006
Figure 7. Plot of the groups and distances to centroids based on PCoA1 and PCoA2 (A) and based on PCoA2 and PCoA1 (B) between teak management.
Forests 13 02111 g007
Figure 8. Additive diversity partitioning for the species richness of ambrosia beetles in the teak plantations in Java, Sumbawa, and Sulawesi Islands.
Forests 13 02111 g008
Table 1. Habitat variable data on each site of teak plantation in Java, Sumbawa, and Sulawesi islands.
Island and
Sampled Site
Site
Code
Stand Age
(year)
Altitude
(m.a.s.l.)
Mean Temperature (°C)Mean
Humidity (%)
Mean Rainfall (mm)Teak
Management
Longitude; Latitude
Java Island
Pati DistrictJS11313627.5580.636.83Un-thinned6°40′43.6″ S; 110°59′36.7″ E
Ngawi DistrictJS2916223.5786.7517.37Un-thinned7°24′47.2″ S; 111°39′34.3″ E
Malang DistrictJS31137826.4683.778.12Thinned8°14′05.9″ S; 112°41′09.0″ E
Banyuwangi DistrictJS4626128.5179.304.63Thinned8°15′10.4″ S; 114°04′49.0″ E
Sumbawa Island
Sumbawa DistrictSS1518426.3887.817.27Un-thinned8°58′25.0″ S; 117°14′44.2″ E
Sumbawa DistrictSS2317627.2683.444.29Thinned8°53′38.5″ S; 117°13′48.2″ E
Sumbawa DistrictSS347826.3887.817.27Un-thinned9°00′20.8″ S; 117°10′02.0″ E
Sumbawa DistrictSS458327.2683.444.29Un-thinned9°04′23.1″ S; 117°05′06.9″ E
Sulawesi Island
Maros DistrictCS1152726.583.7513.79Thinned5°09′30″ S; 119°34′54″ E
Maros DistrictCS2112126.583.7513.79Thinned5°09′11″ S; 119°33′51″ E
Maros DistrictCS341126.583.7513.79Un-thinned5°09′09″ S; 119°32′36″ E
Maros DistrictCS48826.583.7513.79Un-thinned5°09′08″ S; 119°32′15″ E
Note: m.a.s.l. = meters above sea level.
Table 2. The ambrosia beetle species were collected on twelve sites of teak plantations in Java, Sumbawa, and Sulawesi Islands.
Subfamily and
Species
No. of Individual TotalOcc. (%)
Java IslandSumbawa IslandSulawesi Island
JS1JS2JS3JS4SS1SS2SS3SS4CS1CS2CS3CS4
Platypodinae
Euplatypus parallelus4301650304716261021.66
Scolytinae
Xylosandrus crassiusculus388410454404572980410170127.64
Xyleborus affinis61108140814431691171115114132290347.17
Xylosandrus morigerus1239320708622001081.75
Xylosandrus compactus260872427244000002103.41
Premnobius cavipennis0104800000000490.80
Eccoptopterus spinosus41101540601200430.70
Hypothenemus sp.1719111622368650123777213175912.33
Xyleborinus exiguus0019470040937111181.92
Euwallacea fornicatus0008400000000841.36
Arixyleborus sp.0030000000010310.50
Diuncus haberkorni00100000000010.02
Coptodryas sp.00006000000060.10
Xylosandrus eupatorii0000000071318290.47
Ambrosiodmus asperatus00000000040040.06
Diuncus quadrispinulosus00000000010010.02
Xyleborinus andrewesi00000000013150.08
Total1382711152899195146111173136012962241896154100.00
Note: First and second letters indicate island and site (J = Java, S = Sumbawa, C = Sulawesi). The third letters are the number of sites on each island.
Table 3. Generalized linear models relating abundance of ambrosia beetles to stand age, altitude, temperature, rainfall, humidity, and teak management.
Model 1Model 2 *Model 3
PredictorsIncidence Rate RatiosCIpIncidence Rate RatiosCIpIncidence Rate RatiosCIp
(Intercept)0.000.00–0.010.0130.000.00–0.01<0.0010.000.00–0.00<0.001
Stand age1.041.00–1.080.0271.041.00–1.080.0251.101.07–1.14<0.001
Temperature1.861.30–2.690.0011.501.23–1.84<0.0012.431.96–3.05<0.001
Humidity1.080.97–1.200.152------
Rainfall1.241.14–1.34<0.0011.201.12–1.29<0.0011.351.25–1.46<0.001
Altitude1.001.00–1.01<0.0011.001.00–1.00<0.0011.011.00–1.01<0.001
Teak management3.382.52–4.54<0.0013.512.65–4.70<0.001---
Observations240 240 240
R2 Nagelkerke1.000
Note: [*] Asterix describes as the chosen model. CI = confidence interval.
Table 4. Generalized linear models relating species richness of ambrosia beetles to stand age, altitude, temperature, rainfall, humidity, and teak management.
Model 1Model 2Model 3 *
PredictorsIncidence Rate RatiosCIpIncidence Rate RatiosCIpIncidence Rate RatiosCIp
(Intercept)0.090.00–148.650.5300.050.00–58.050.4160.010.00–0.07<0.001
Stand age1.000.98–1.010.603------
Temperature1.171.01–1.350.0431.181.03–1.350.0191.221.13–1.31<0.001
Humidity0.980.94–1.030.4860.990.95–1.030.565---
Rainfall1.051.02–1.090.0021.051.02–1.08<0.0011.061.03–1.08<0.001
Altitude1.001.00–1.00<0.0011.001.00–1.00<0.0011.001.00–1.00<0.001
Teak management1.030.89–1.180.728------
Observations240 240 240
R2 Nagelkerke0.200 0.199 0.198
Note: [*] Asterix describes as the chosen model. CI = confidence interval.
Table 5. Overall and beta diversity (β-sor) partitioning in its spatial turnover (β-sim) and nestedness (β-nes) components based on multiple sites across the landscape (among sites within the island) and regional/island (among twelve sites) scale.
Scaleβ-DiversityAbsolute ValuePercentage of Overall β
Landscape
Javaβ-sor0.47100.00
β-sim0.4492.97
β-nes0.037.03
Sumbawaβ-sor0.35100.00
β-sim0.0616.00
β-nes0.2983.04
Sulawesiβ-sor0.38100.00
β-sim0.1744.44
β-nes0.2155.56
Regionalβ-sor0.71100.00
β-sim0.6185.00
β-nes0.1014.03
Publisher’s Note: MDPI stays neutral with regard to jurisdictional claims in published maps and institutional affiliations.