
Different Modelling Approaches to Determine Suitable Areas for Conserving Egg-Cone Pine (Pinus oocarpa Schiede) Plus Trees in the Central Part of Mexico

Abstract
:1. Introduction
2. Materials and Methods
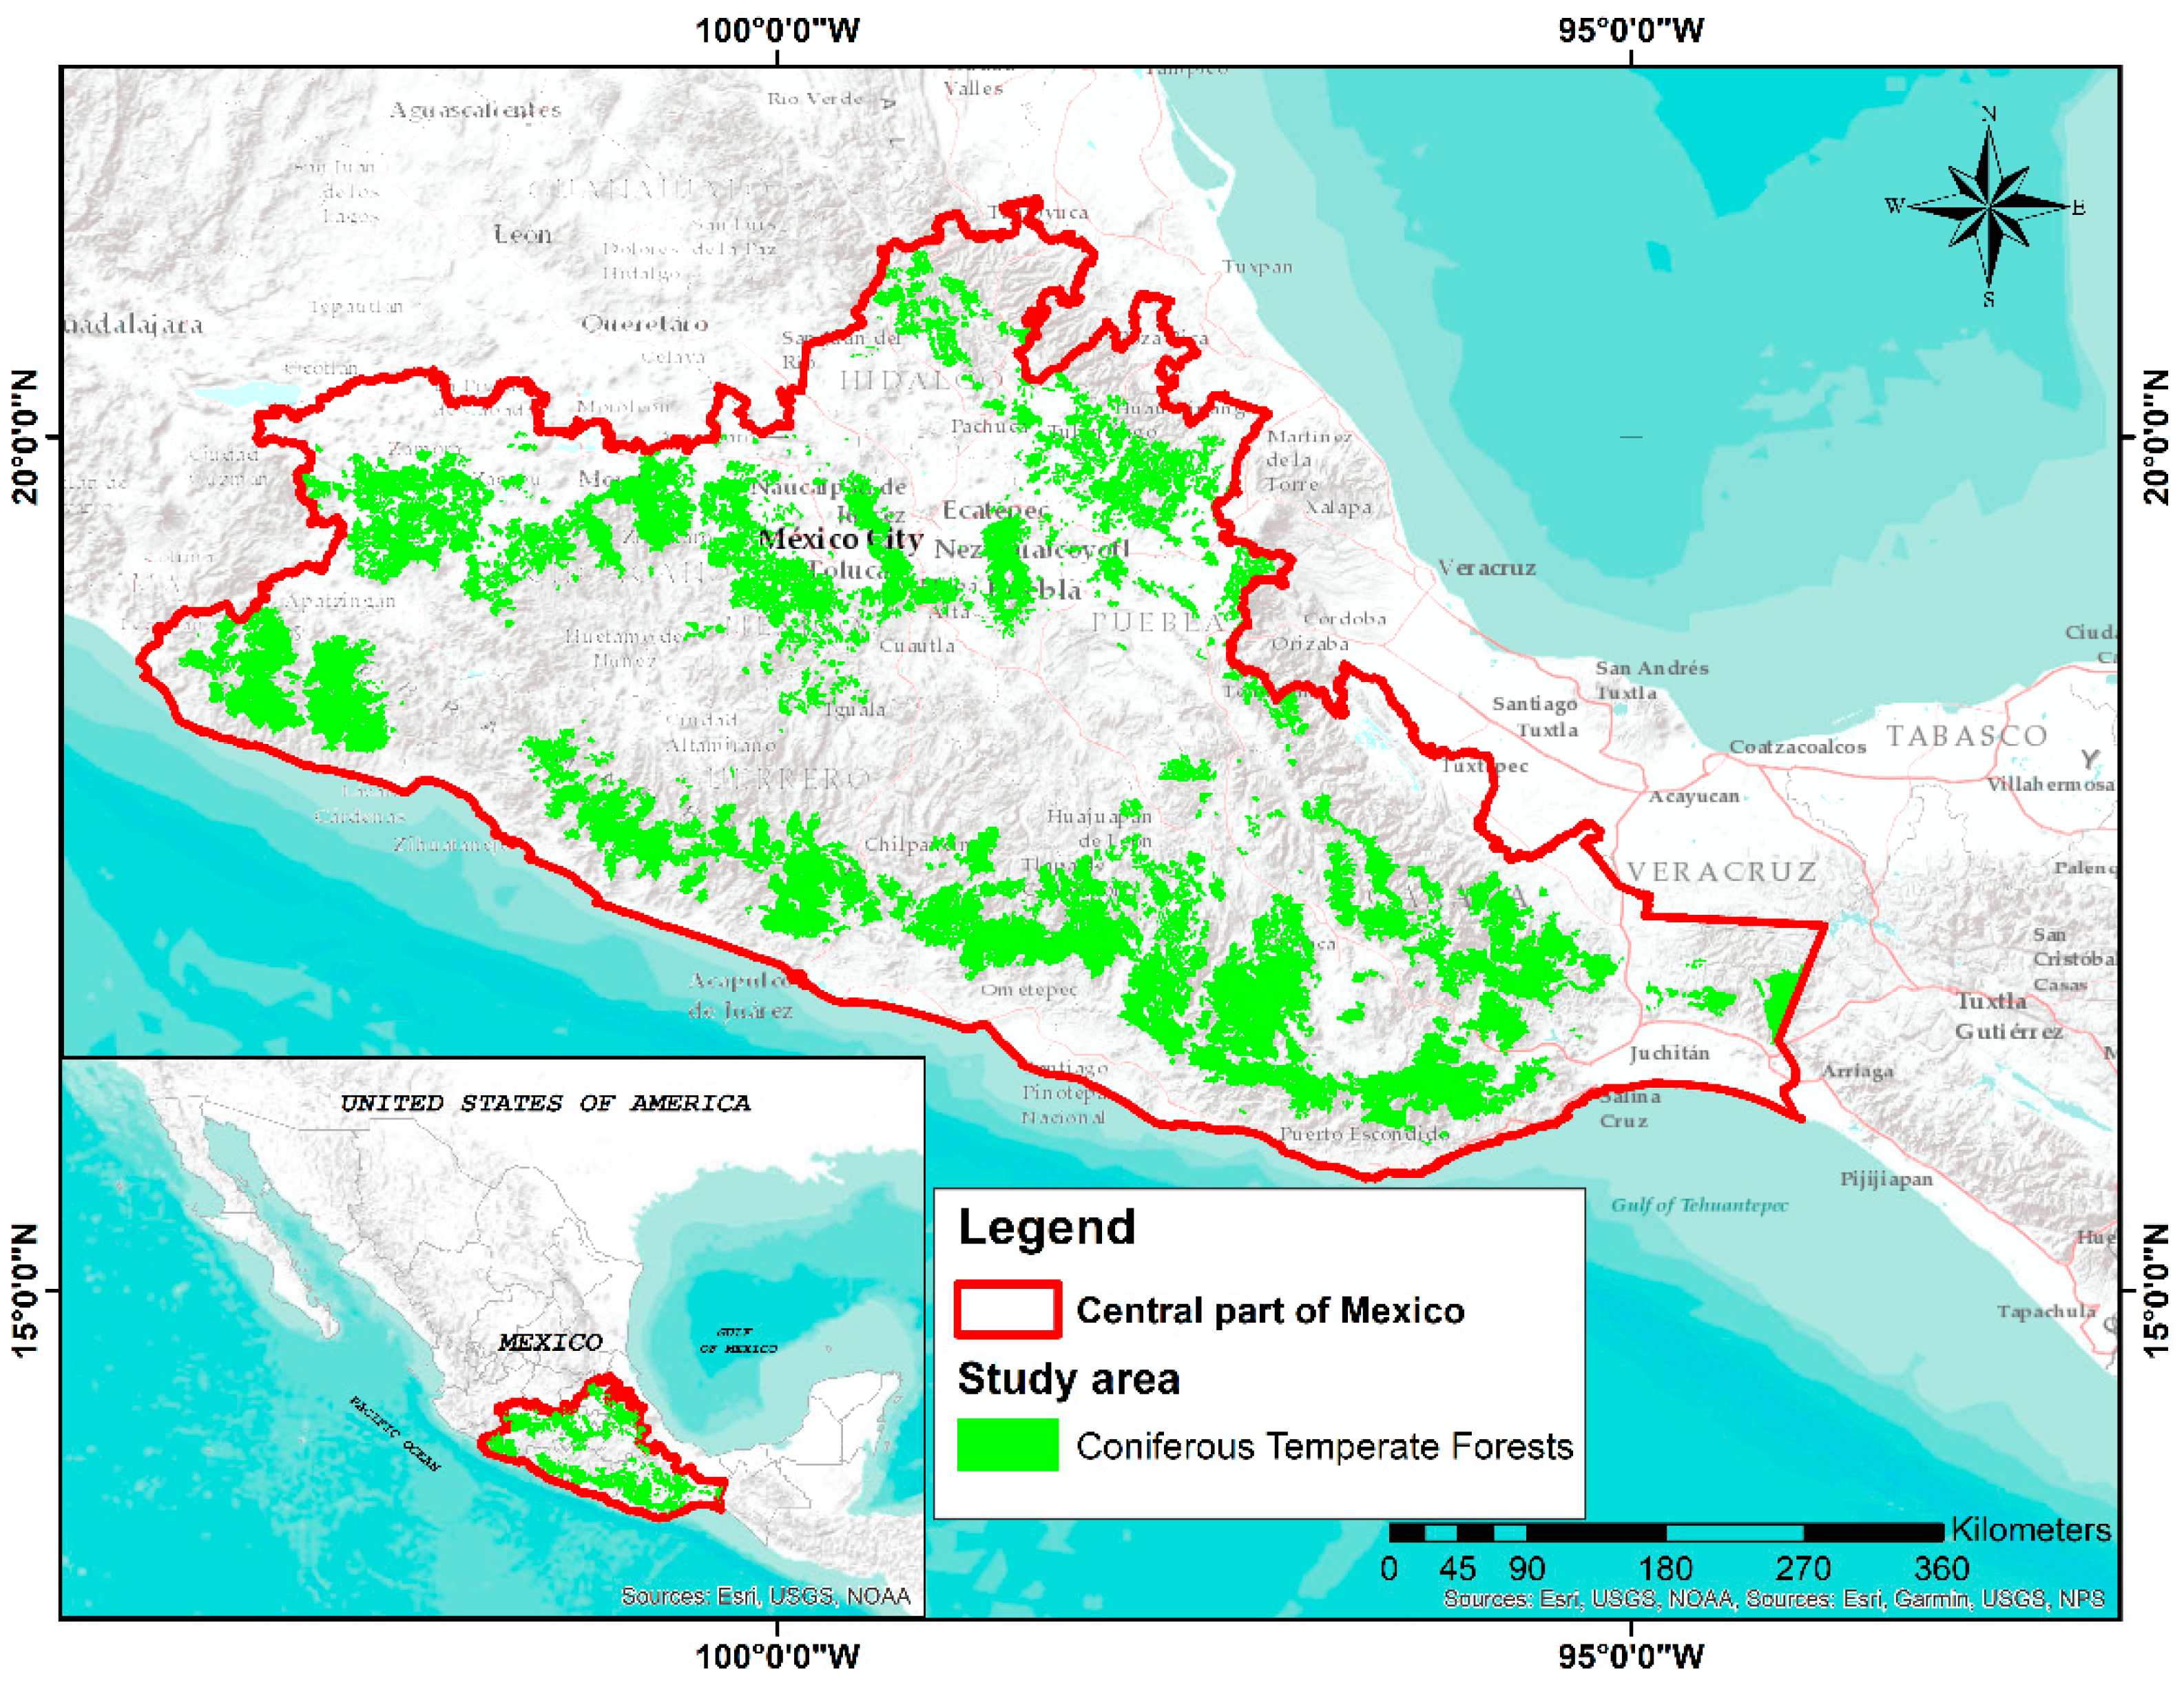
2.1. Study Area
2.2. Data
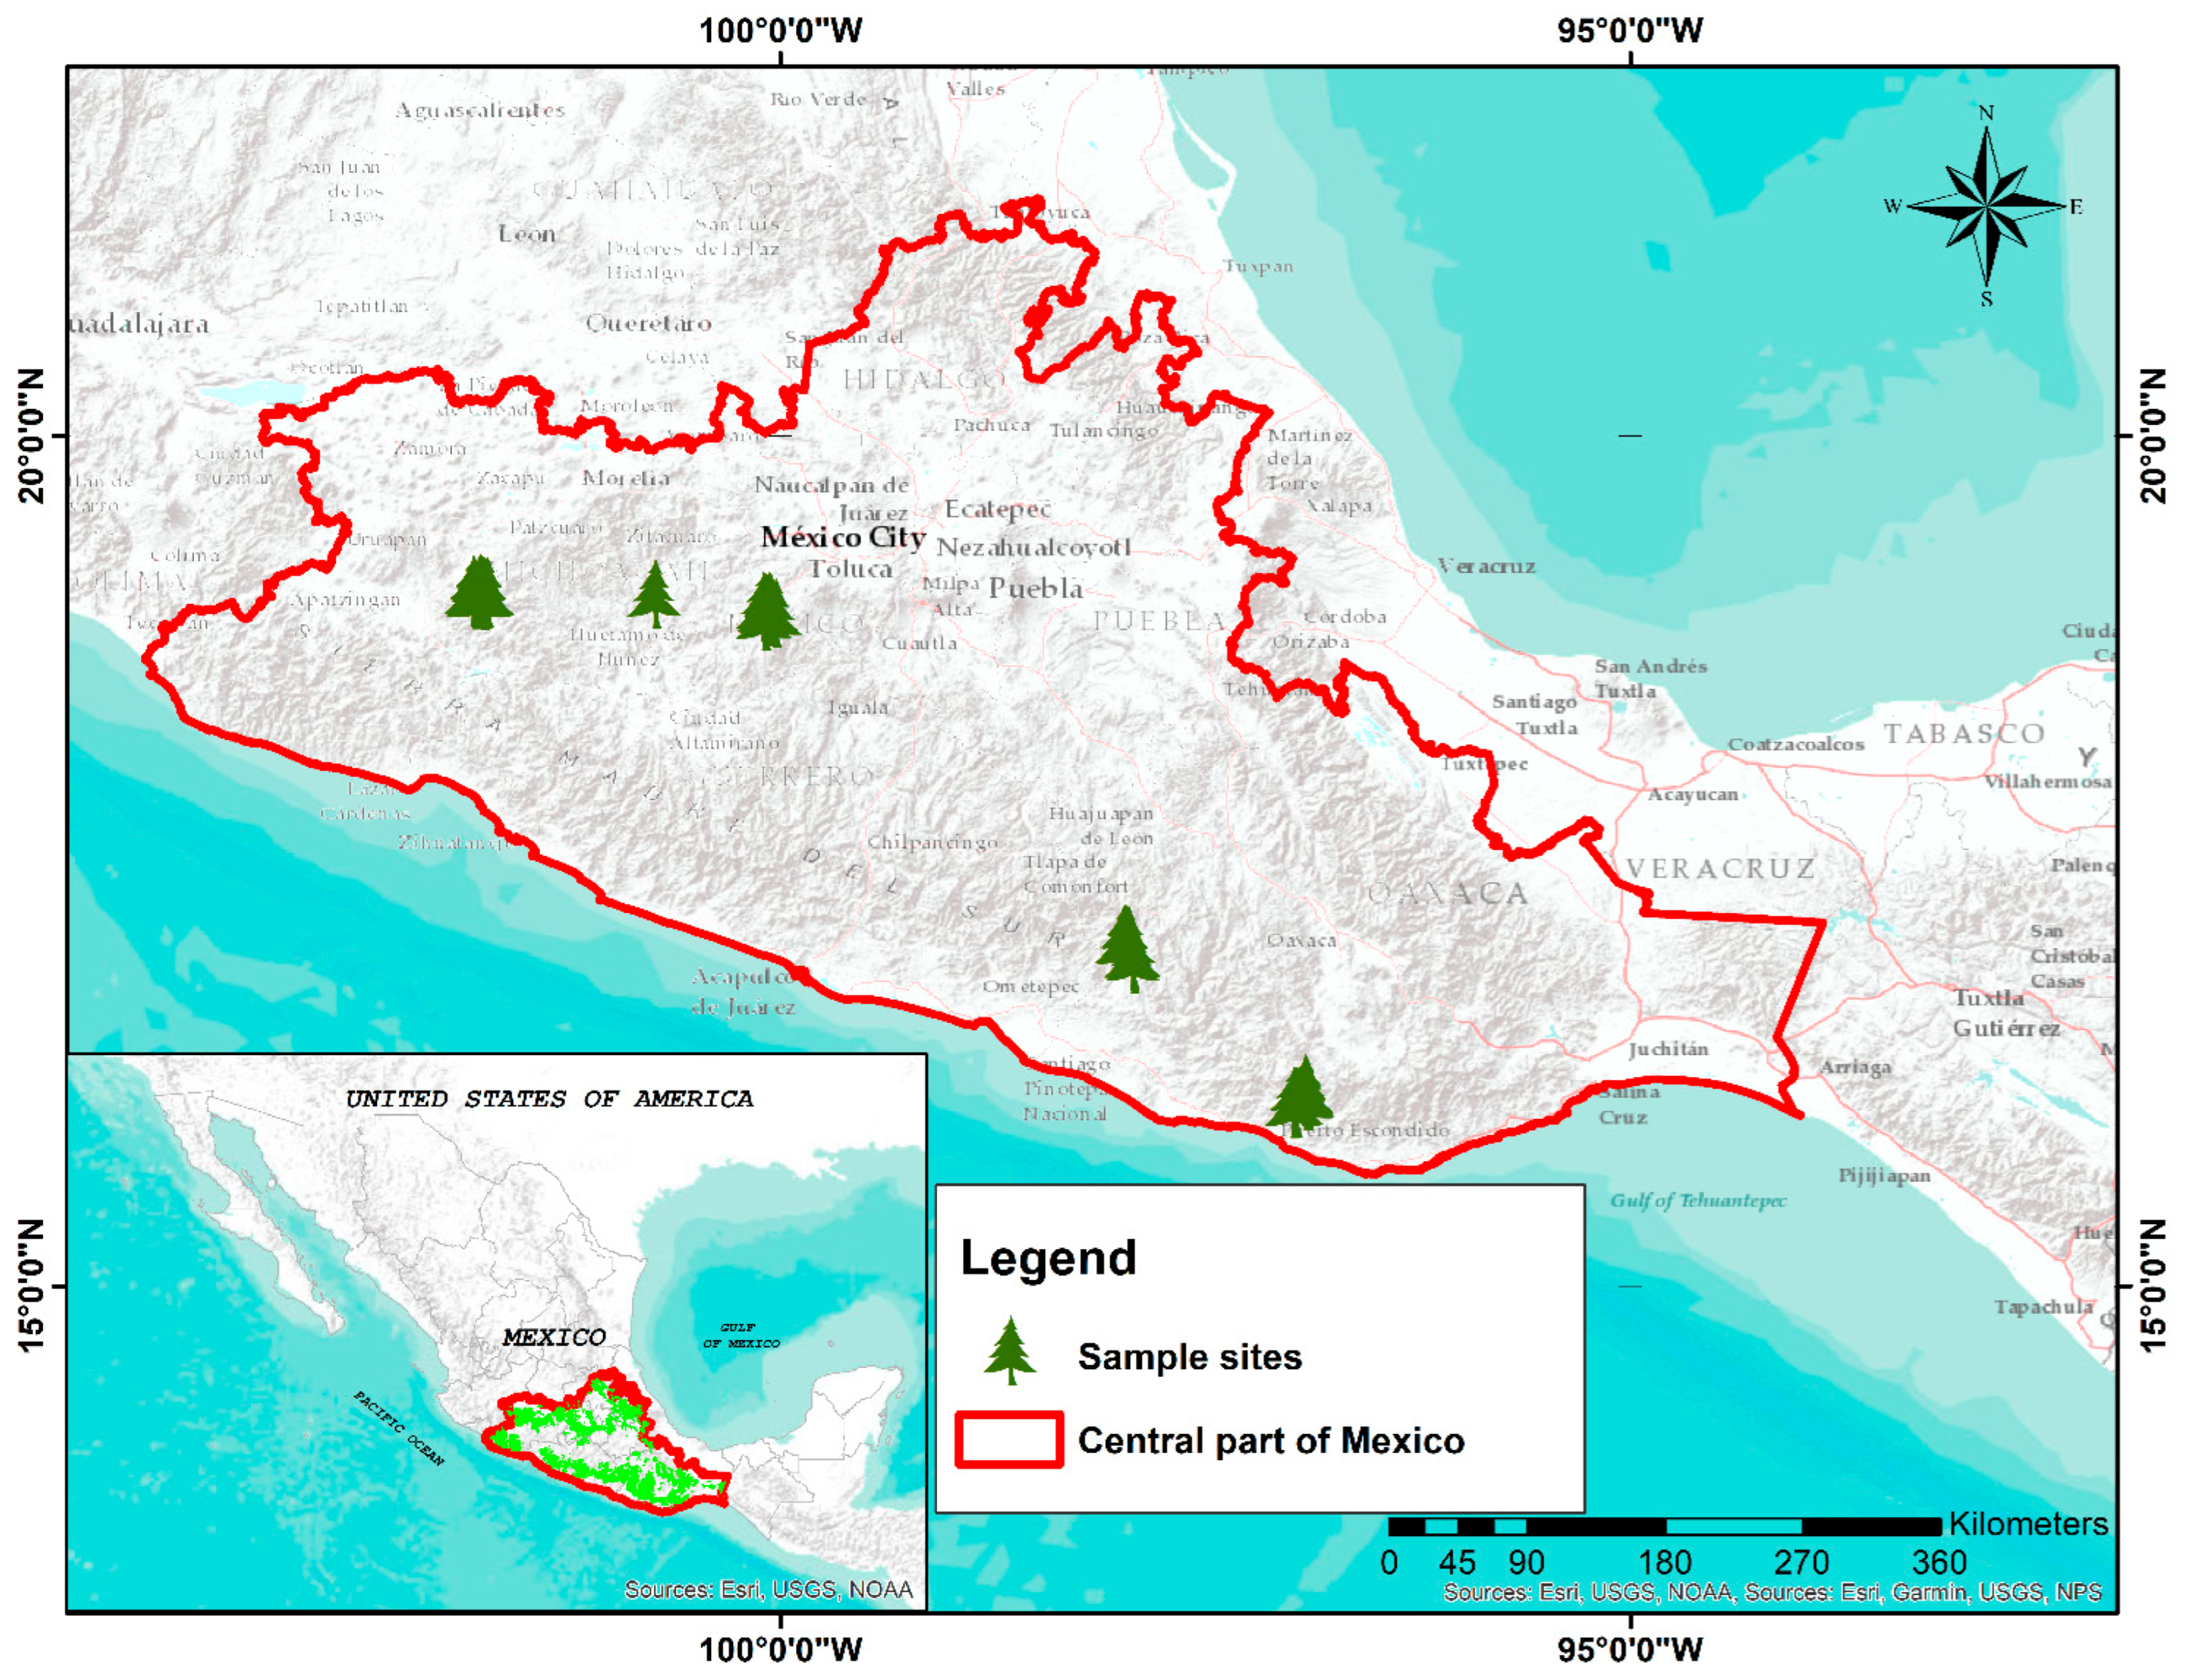
2.2.1. Field Data
2.2.2. Geographic Data
2.2.3. Climatic Layers
2.3. Description of the Models Used
2.3.1. Generalised Linear Model (GLM): Logistic Regression
2.3.2. Random Forest
2.3.3. MaxEnt
2.3.4. Model’s Validation
2.4. Identifying Areas for Conservation Purposes (Ex Situ) of the Species
3. Results
3.1. Generalised Linear Model (GLM) and Logistic Regression Modelling
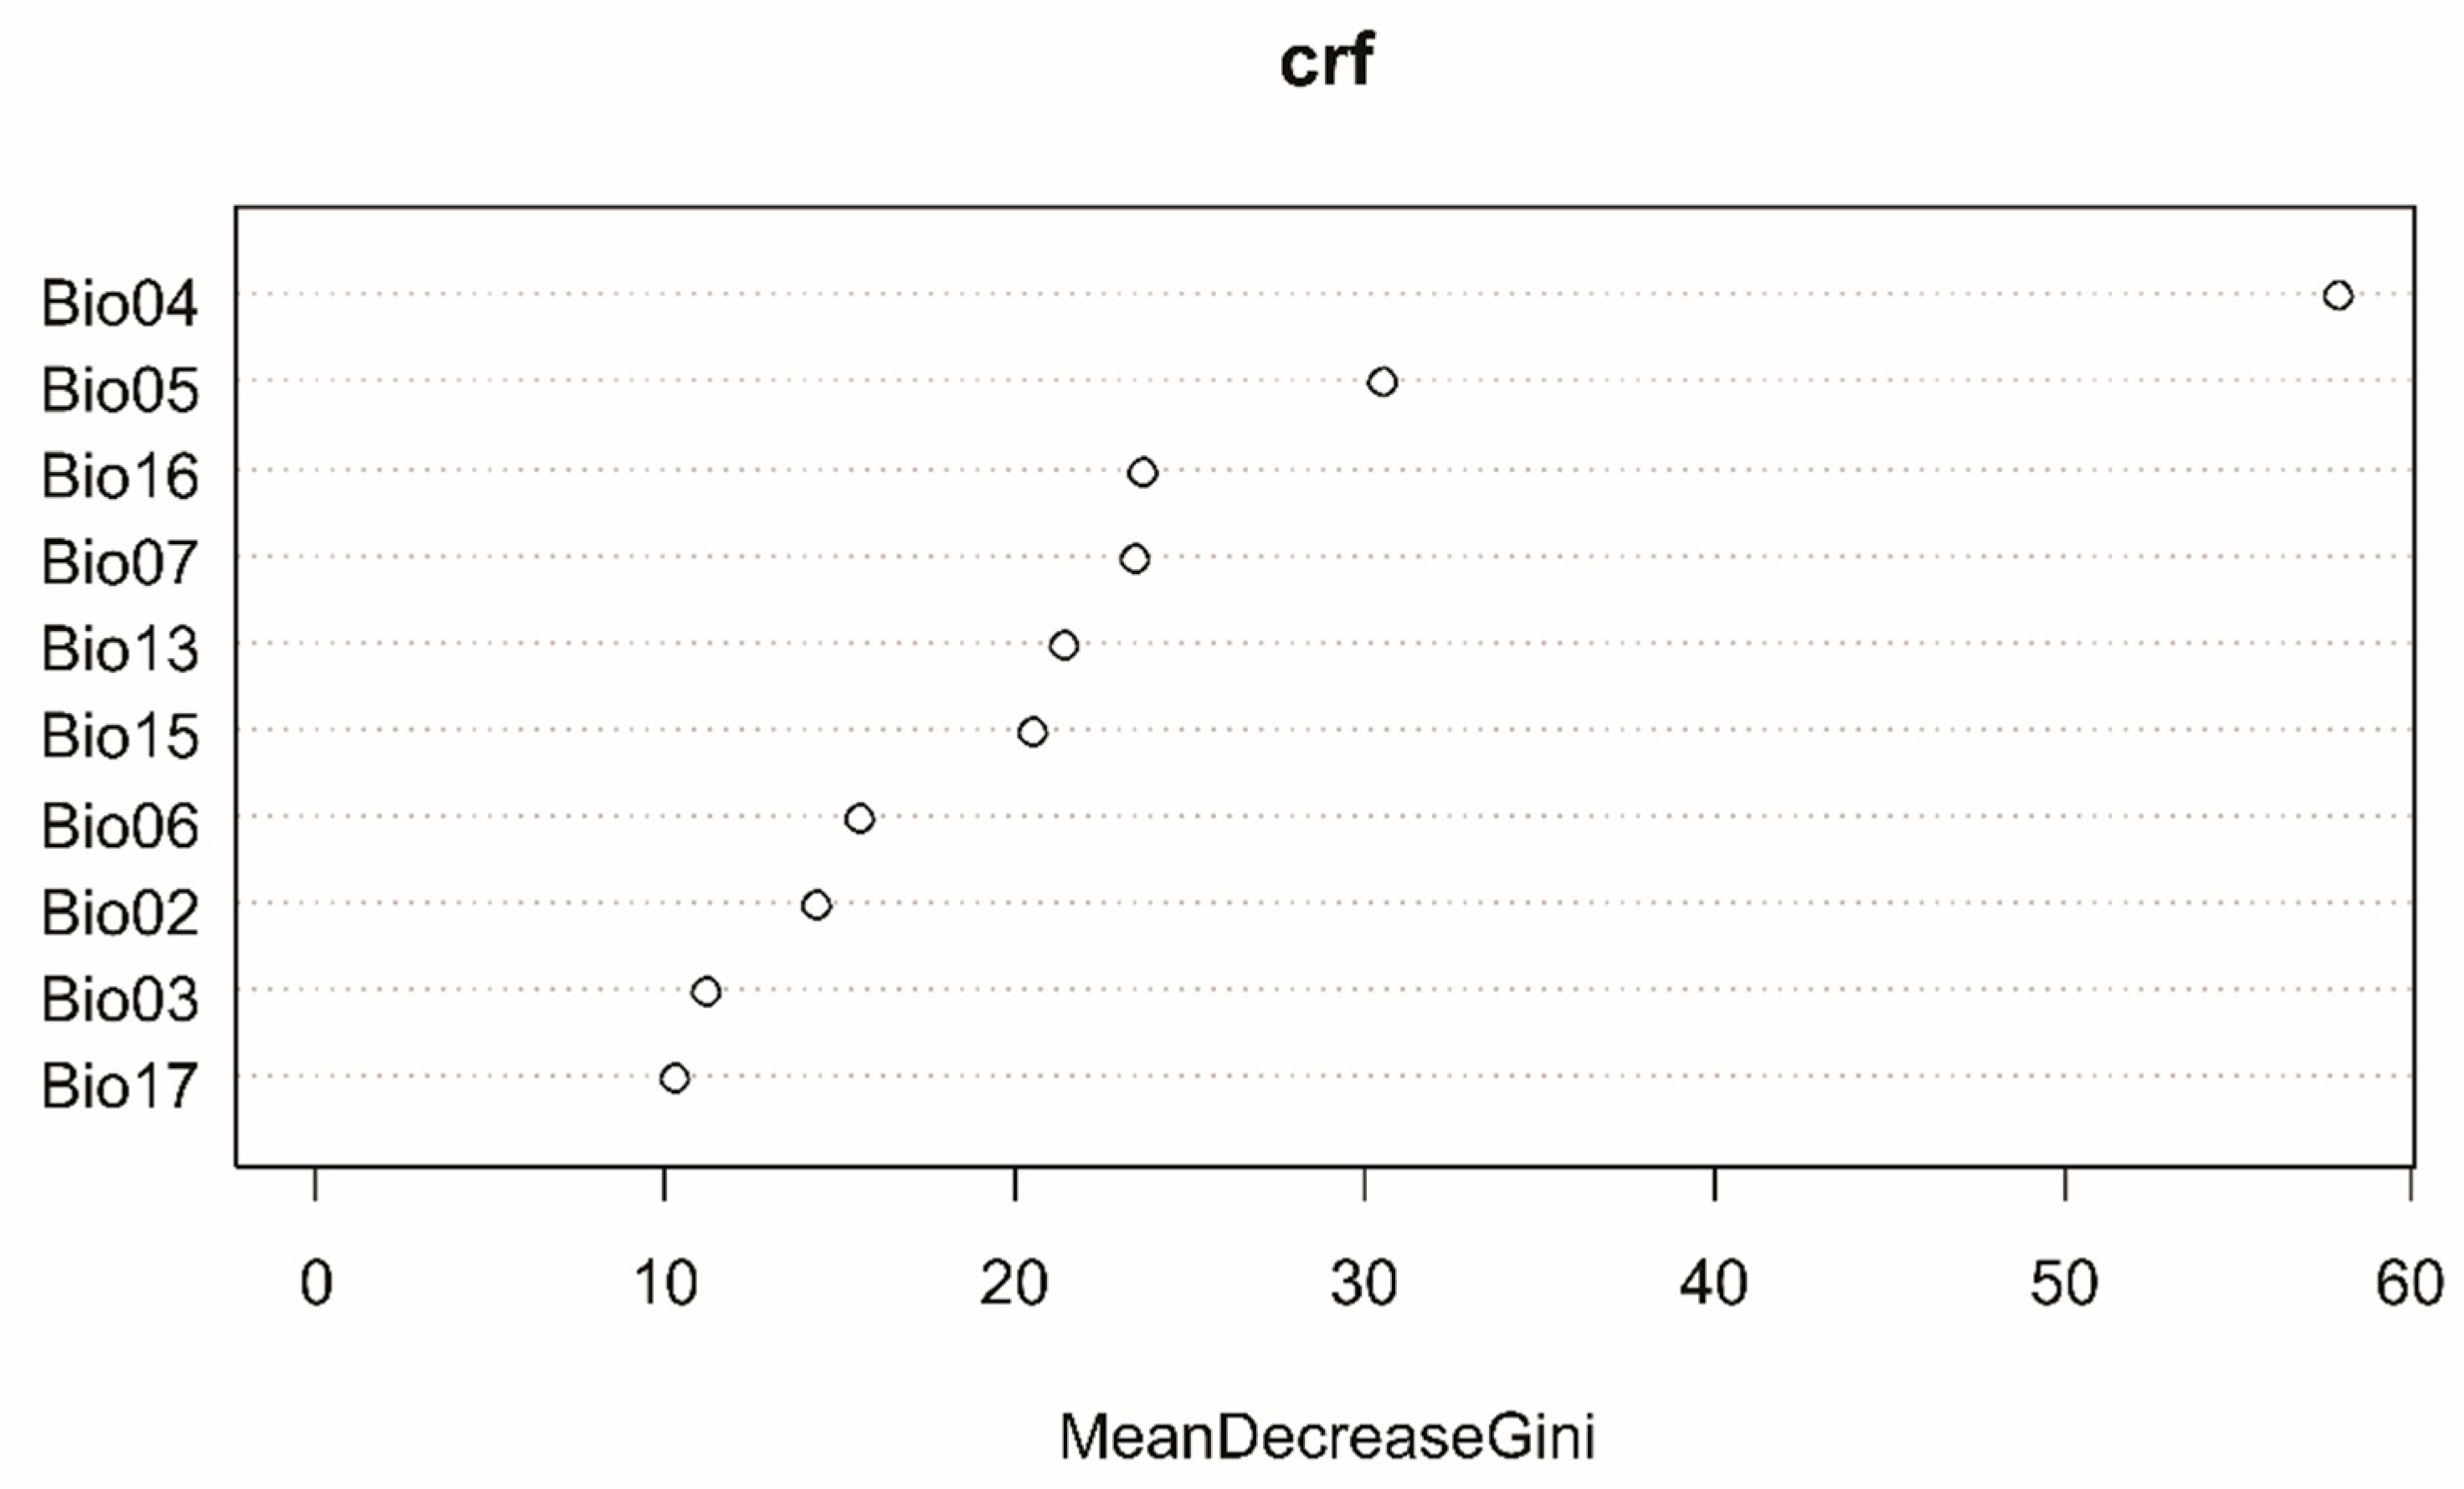
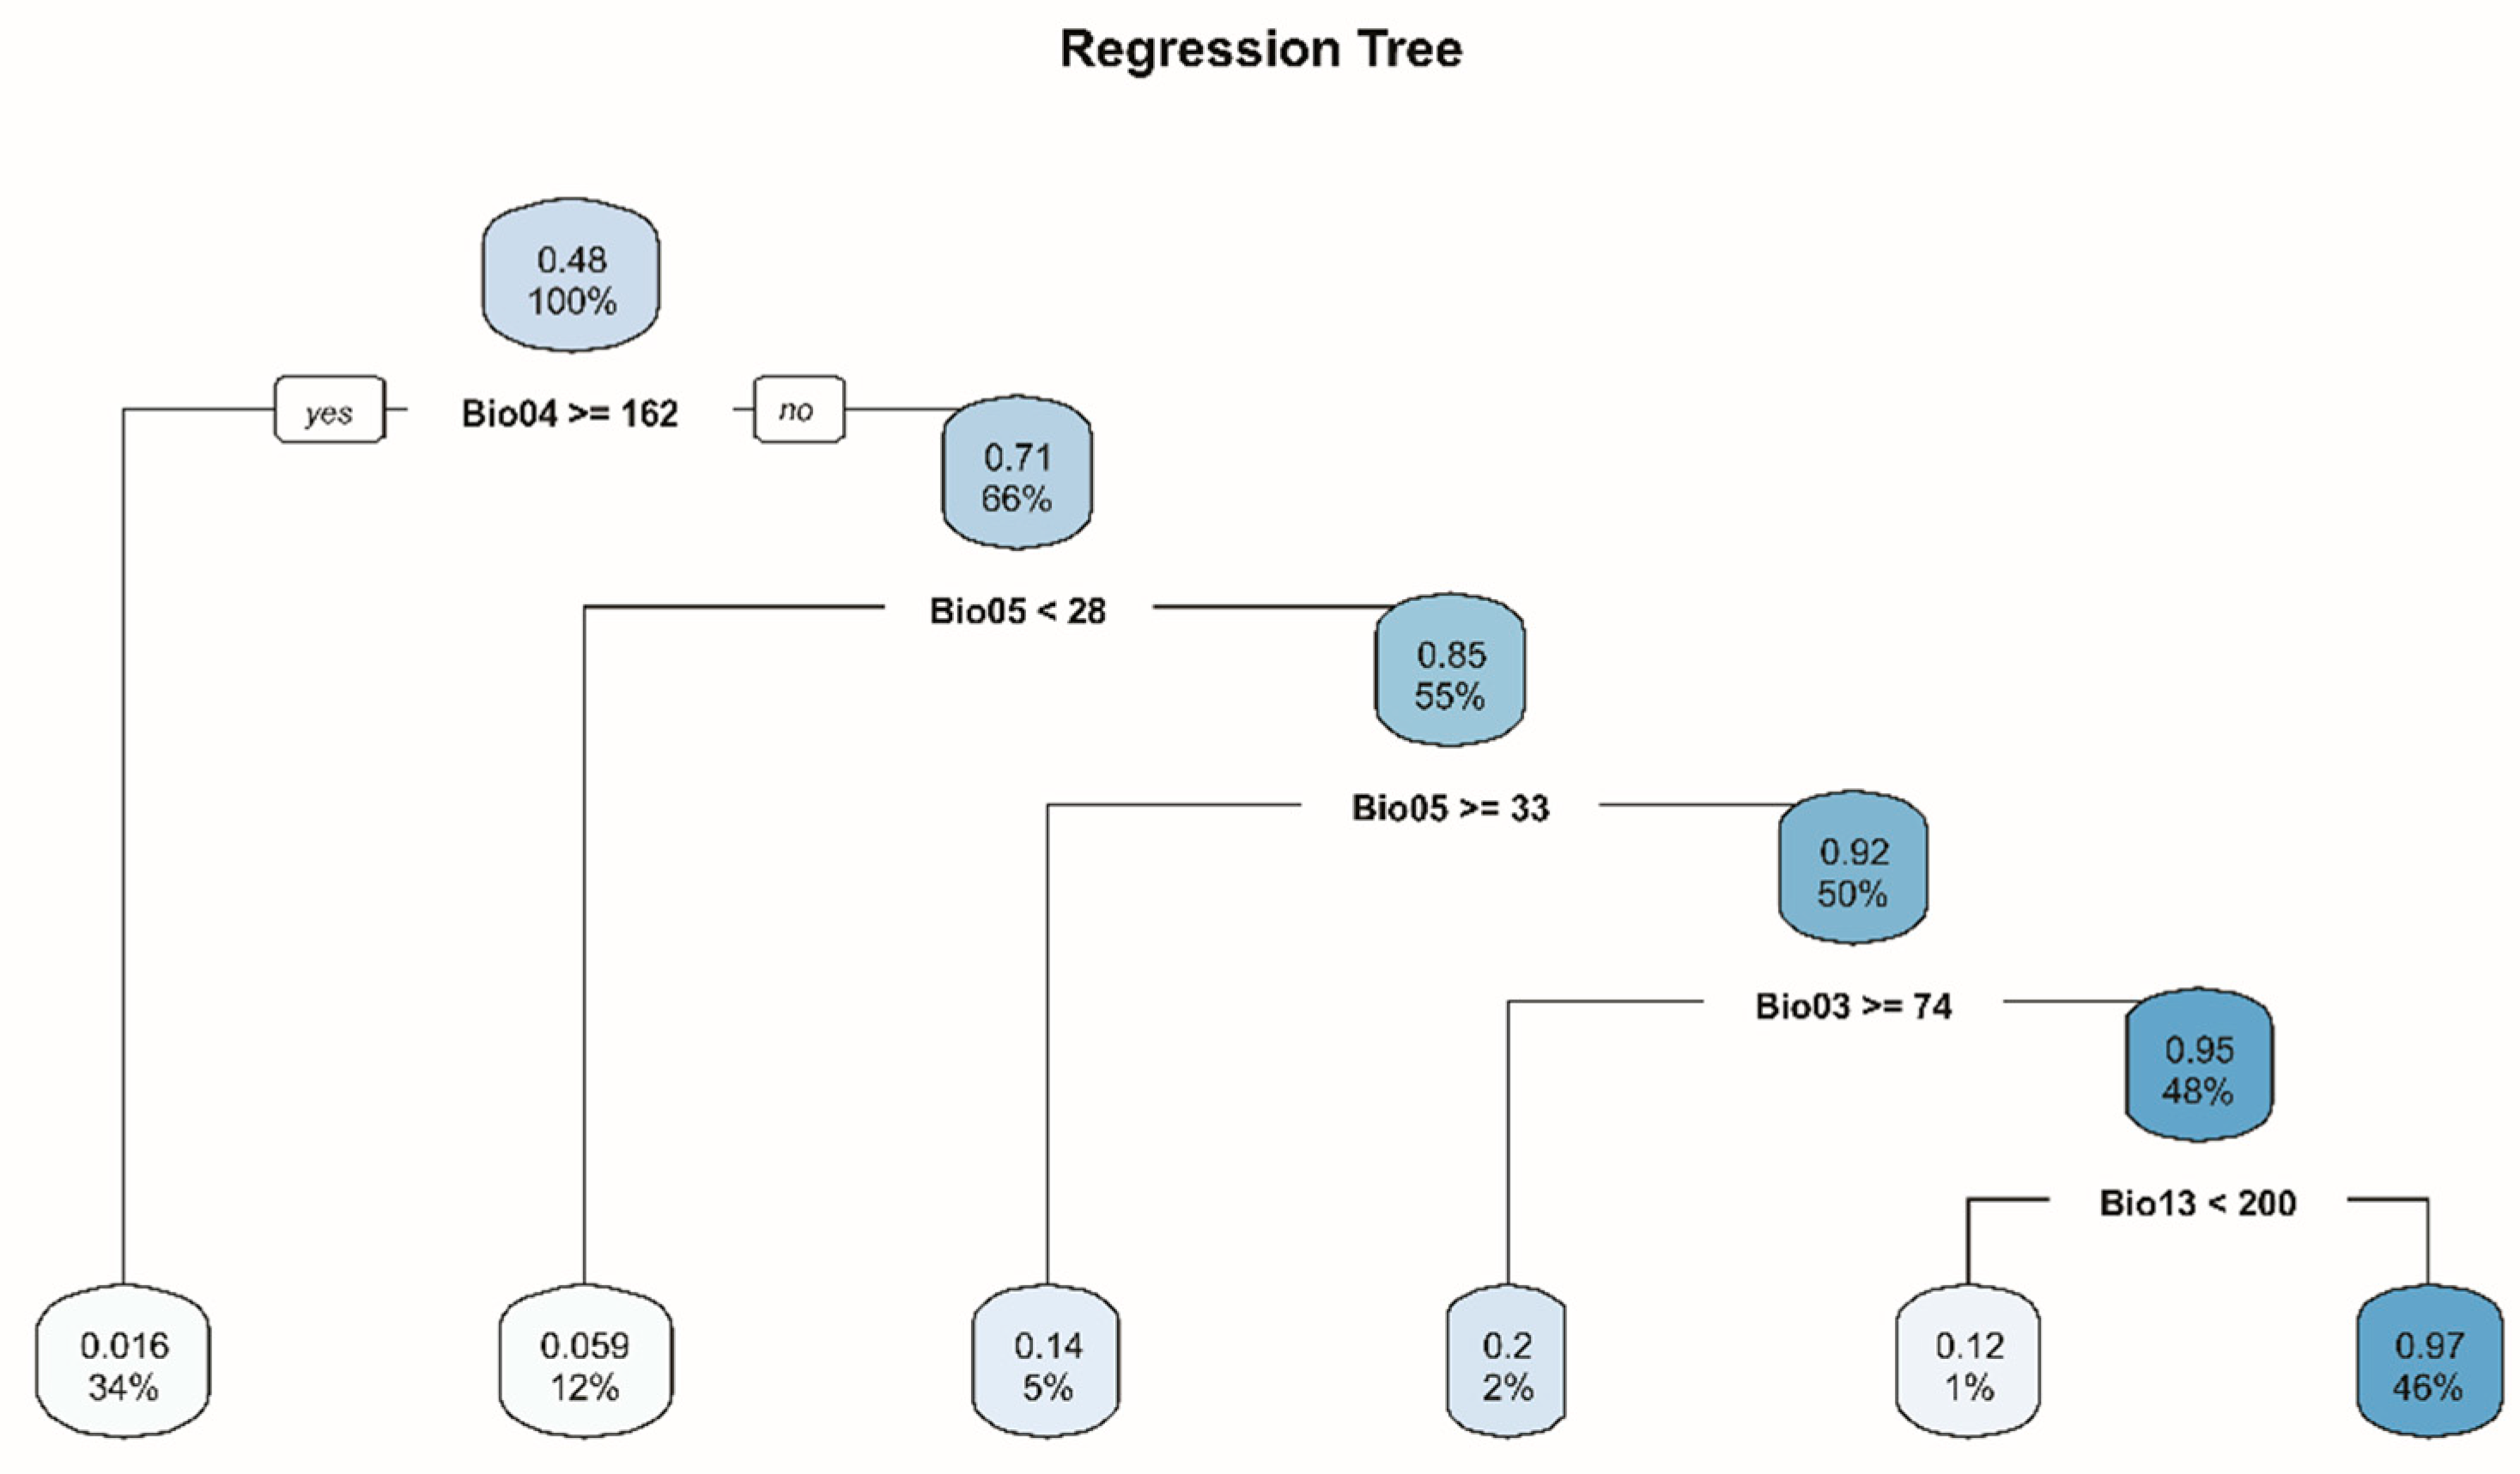
3.2. Random Forests
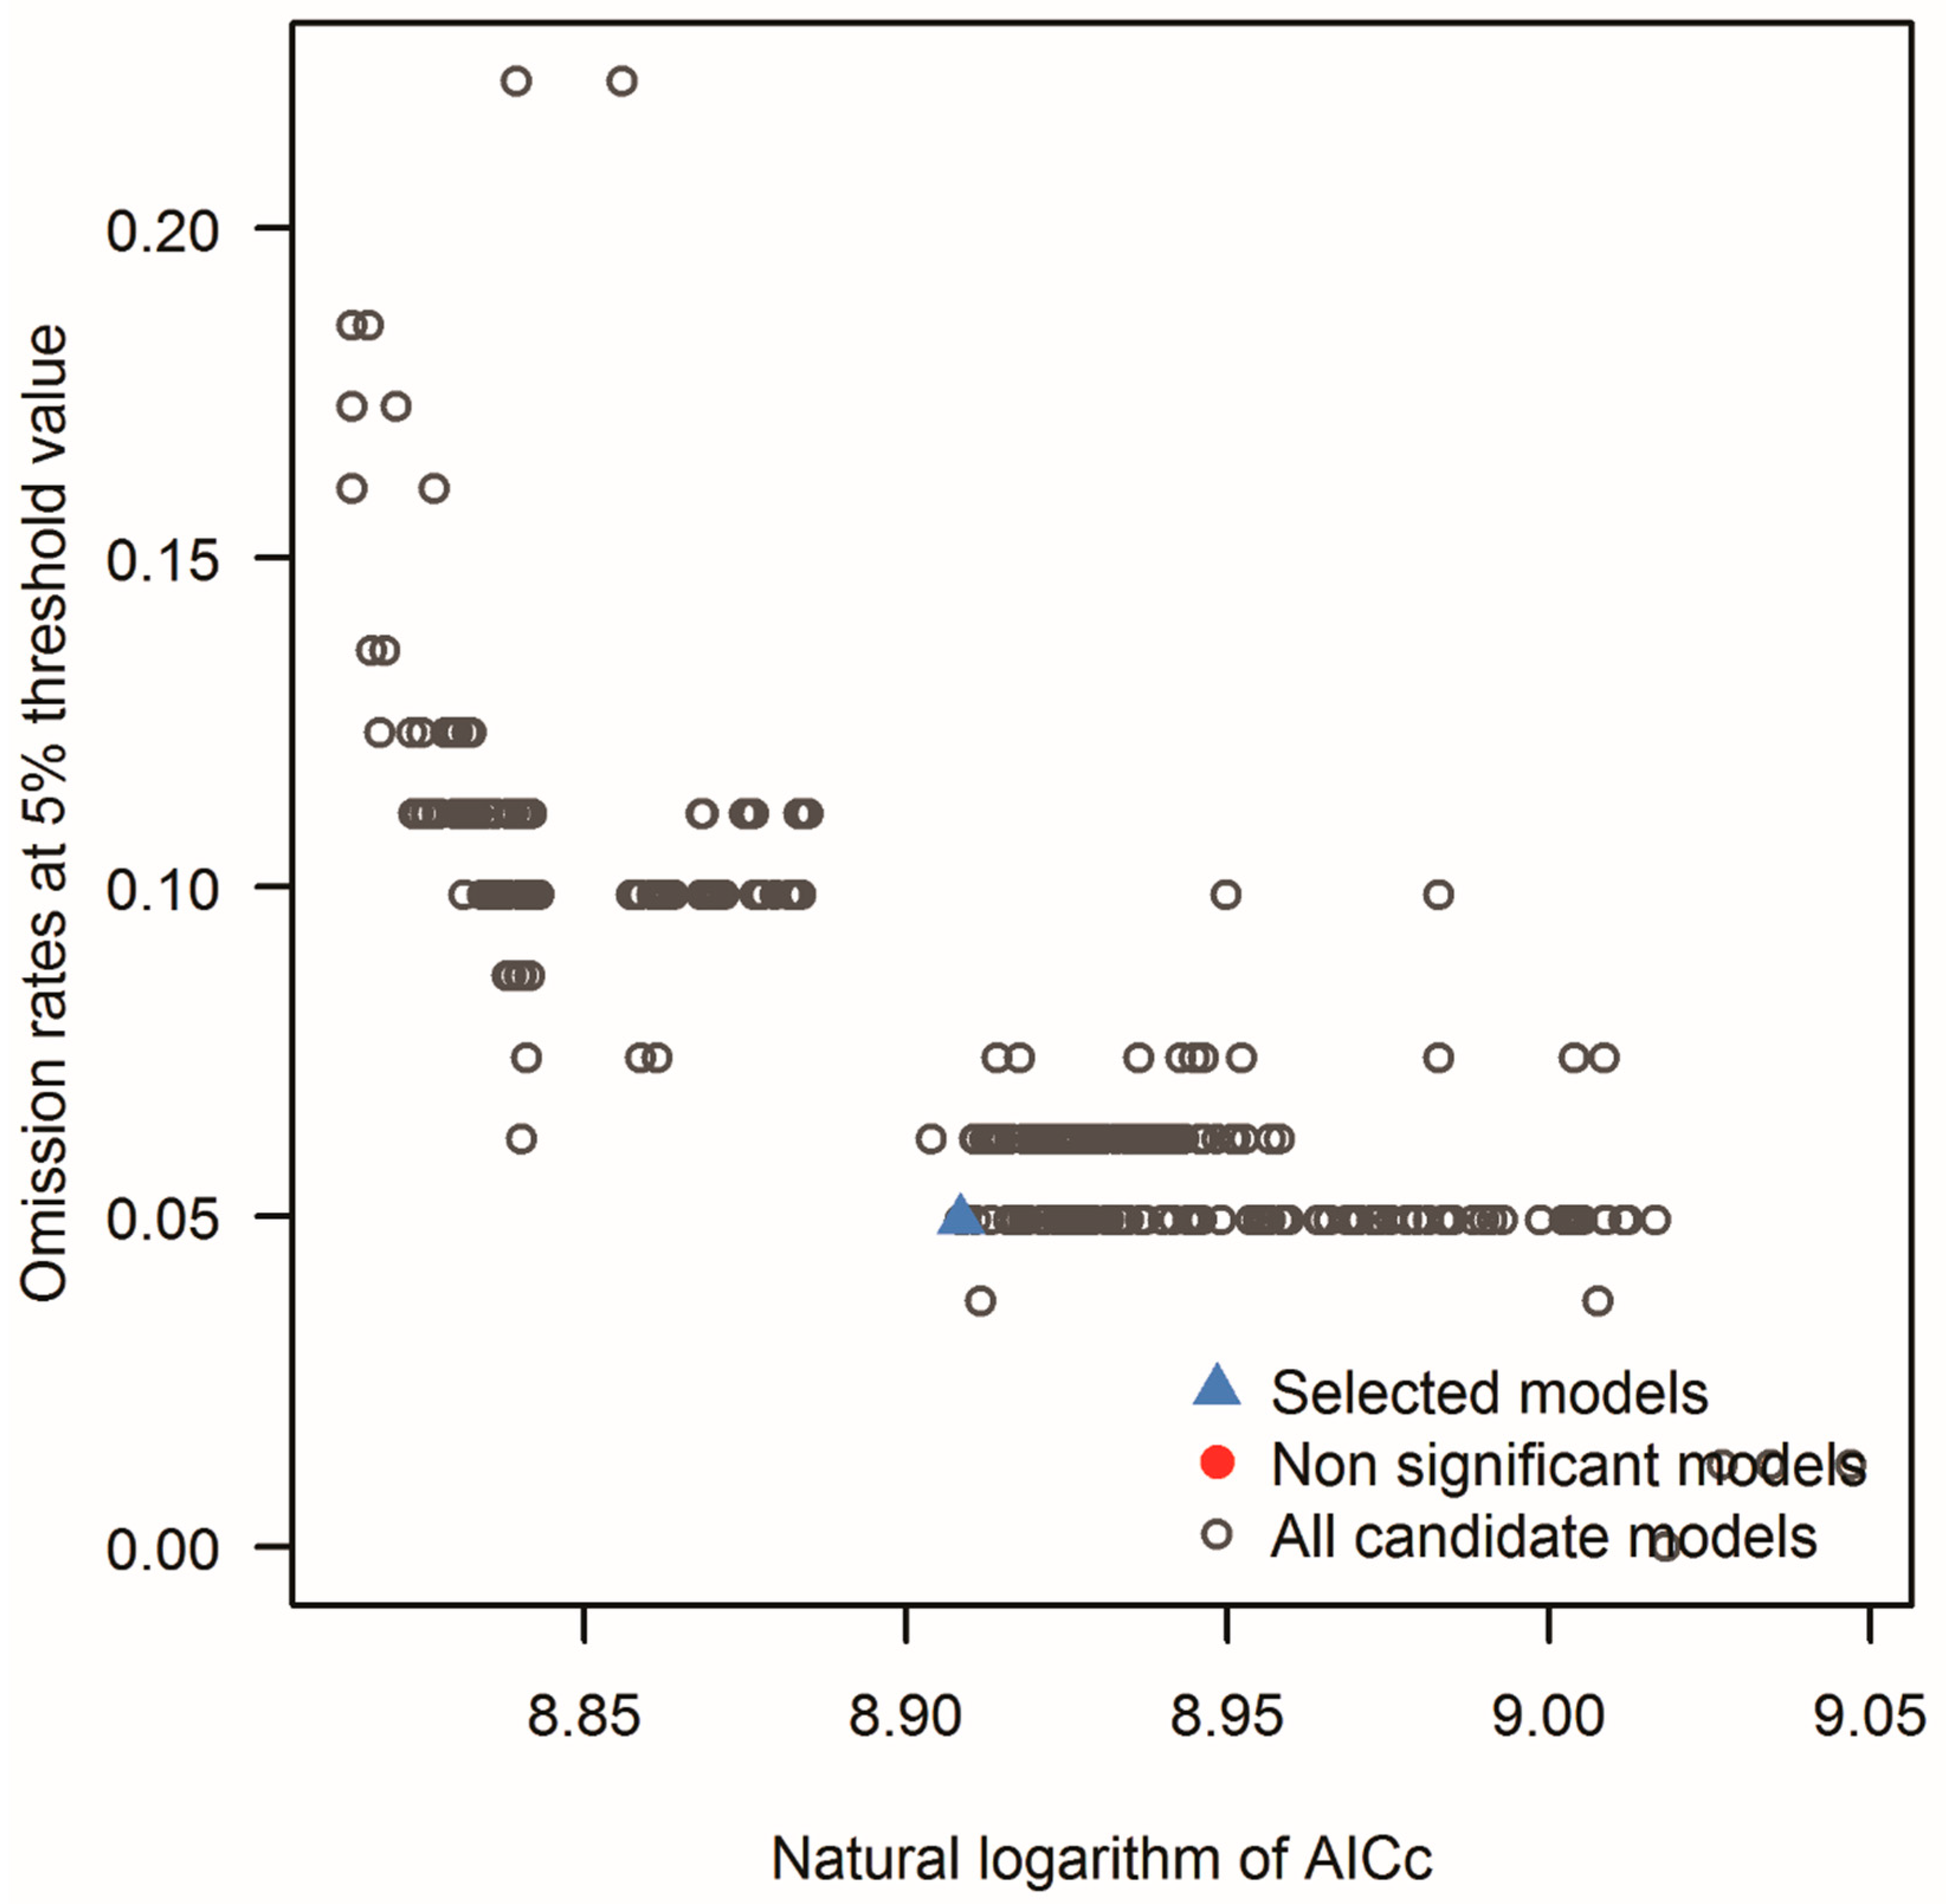
3.3. MaxEnt
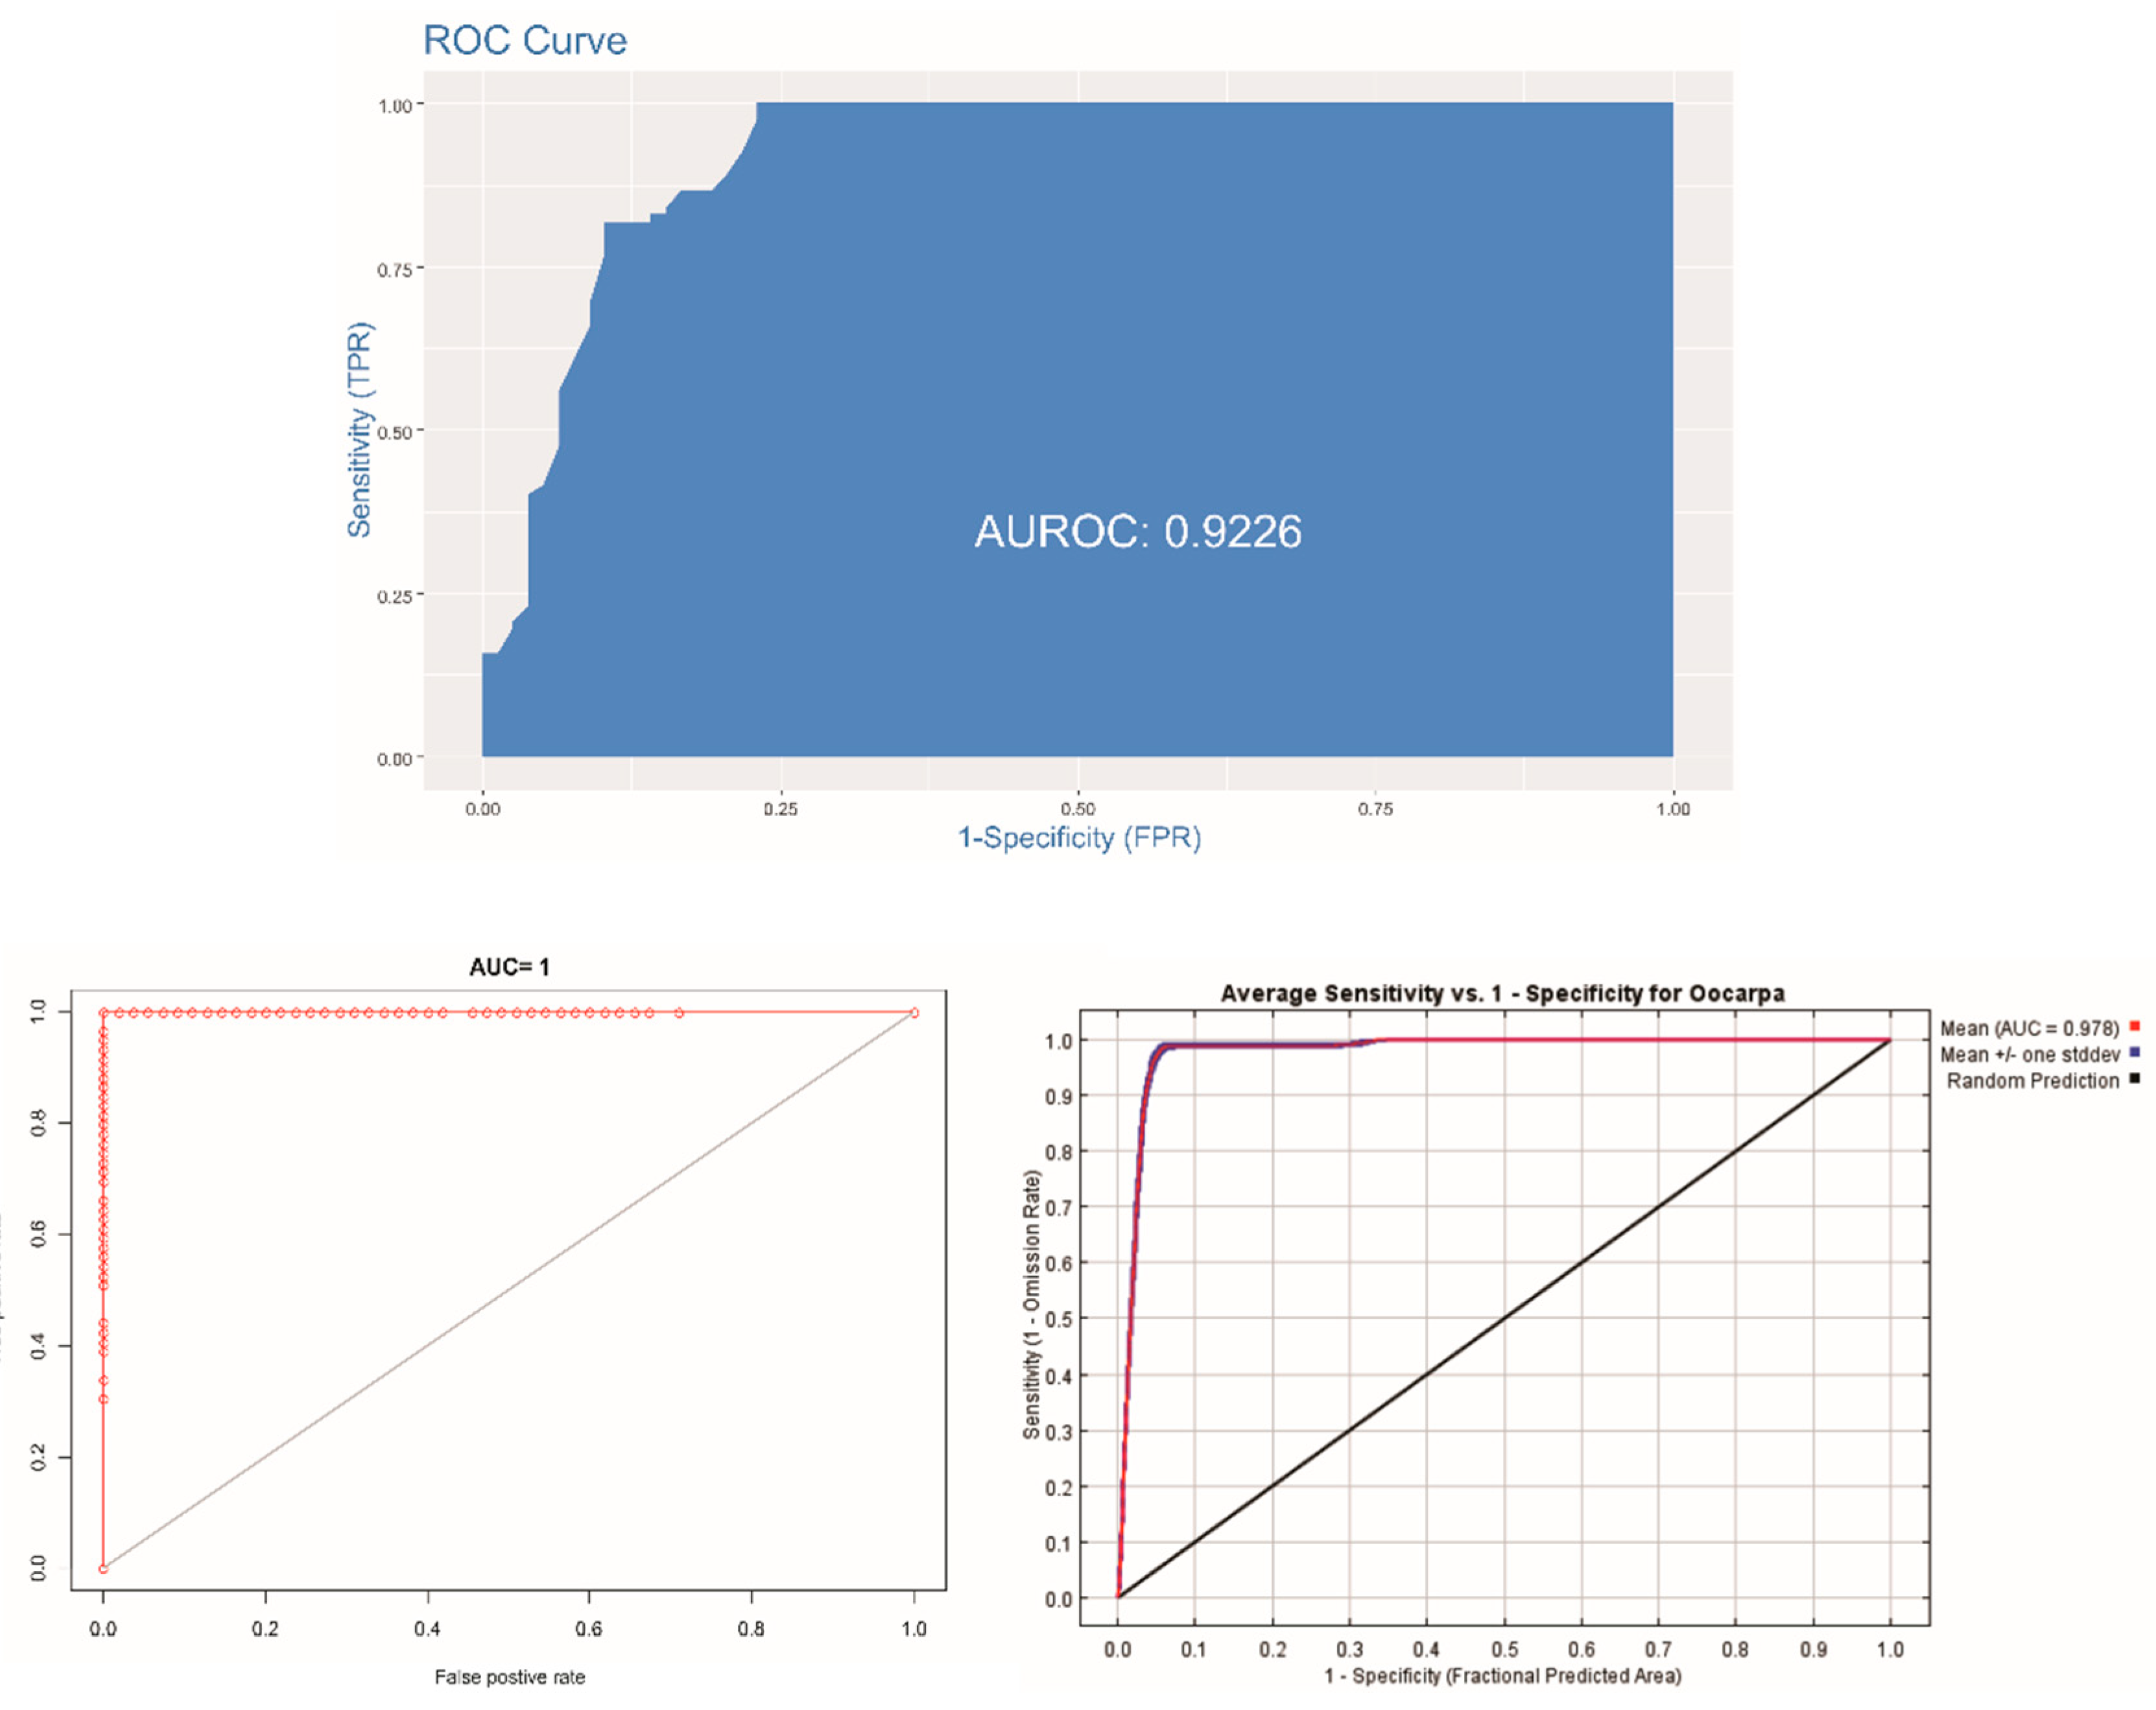
3.4. Validation of the Models
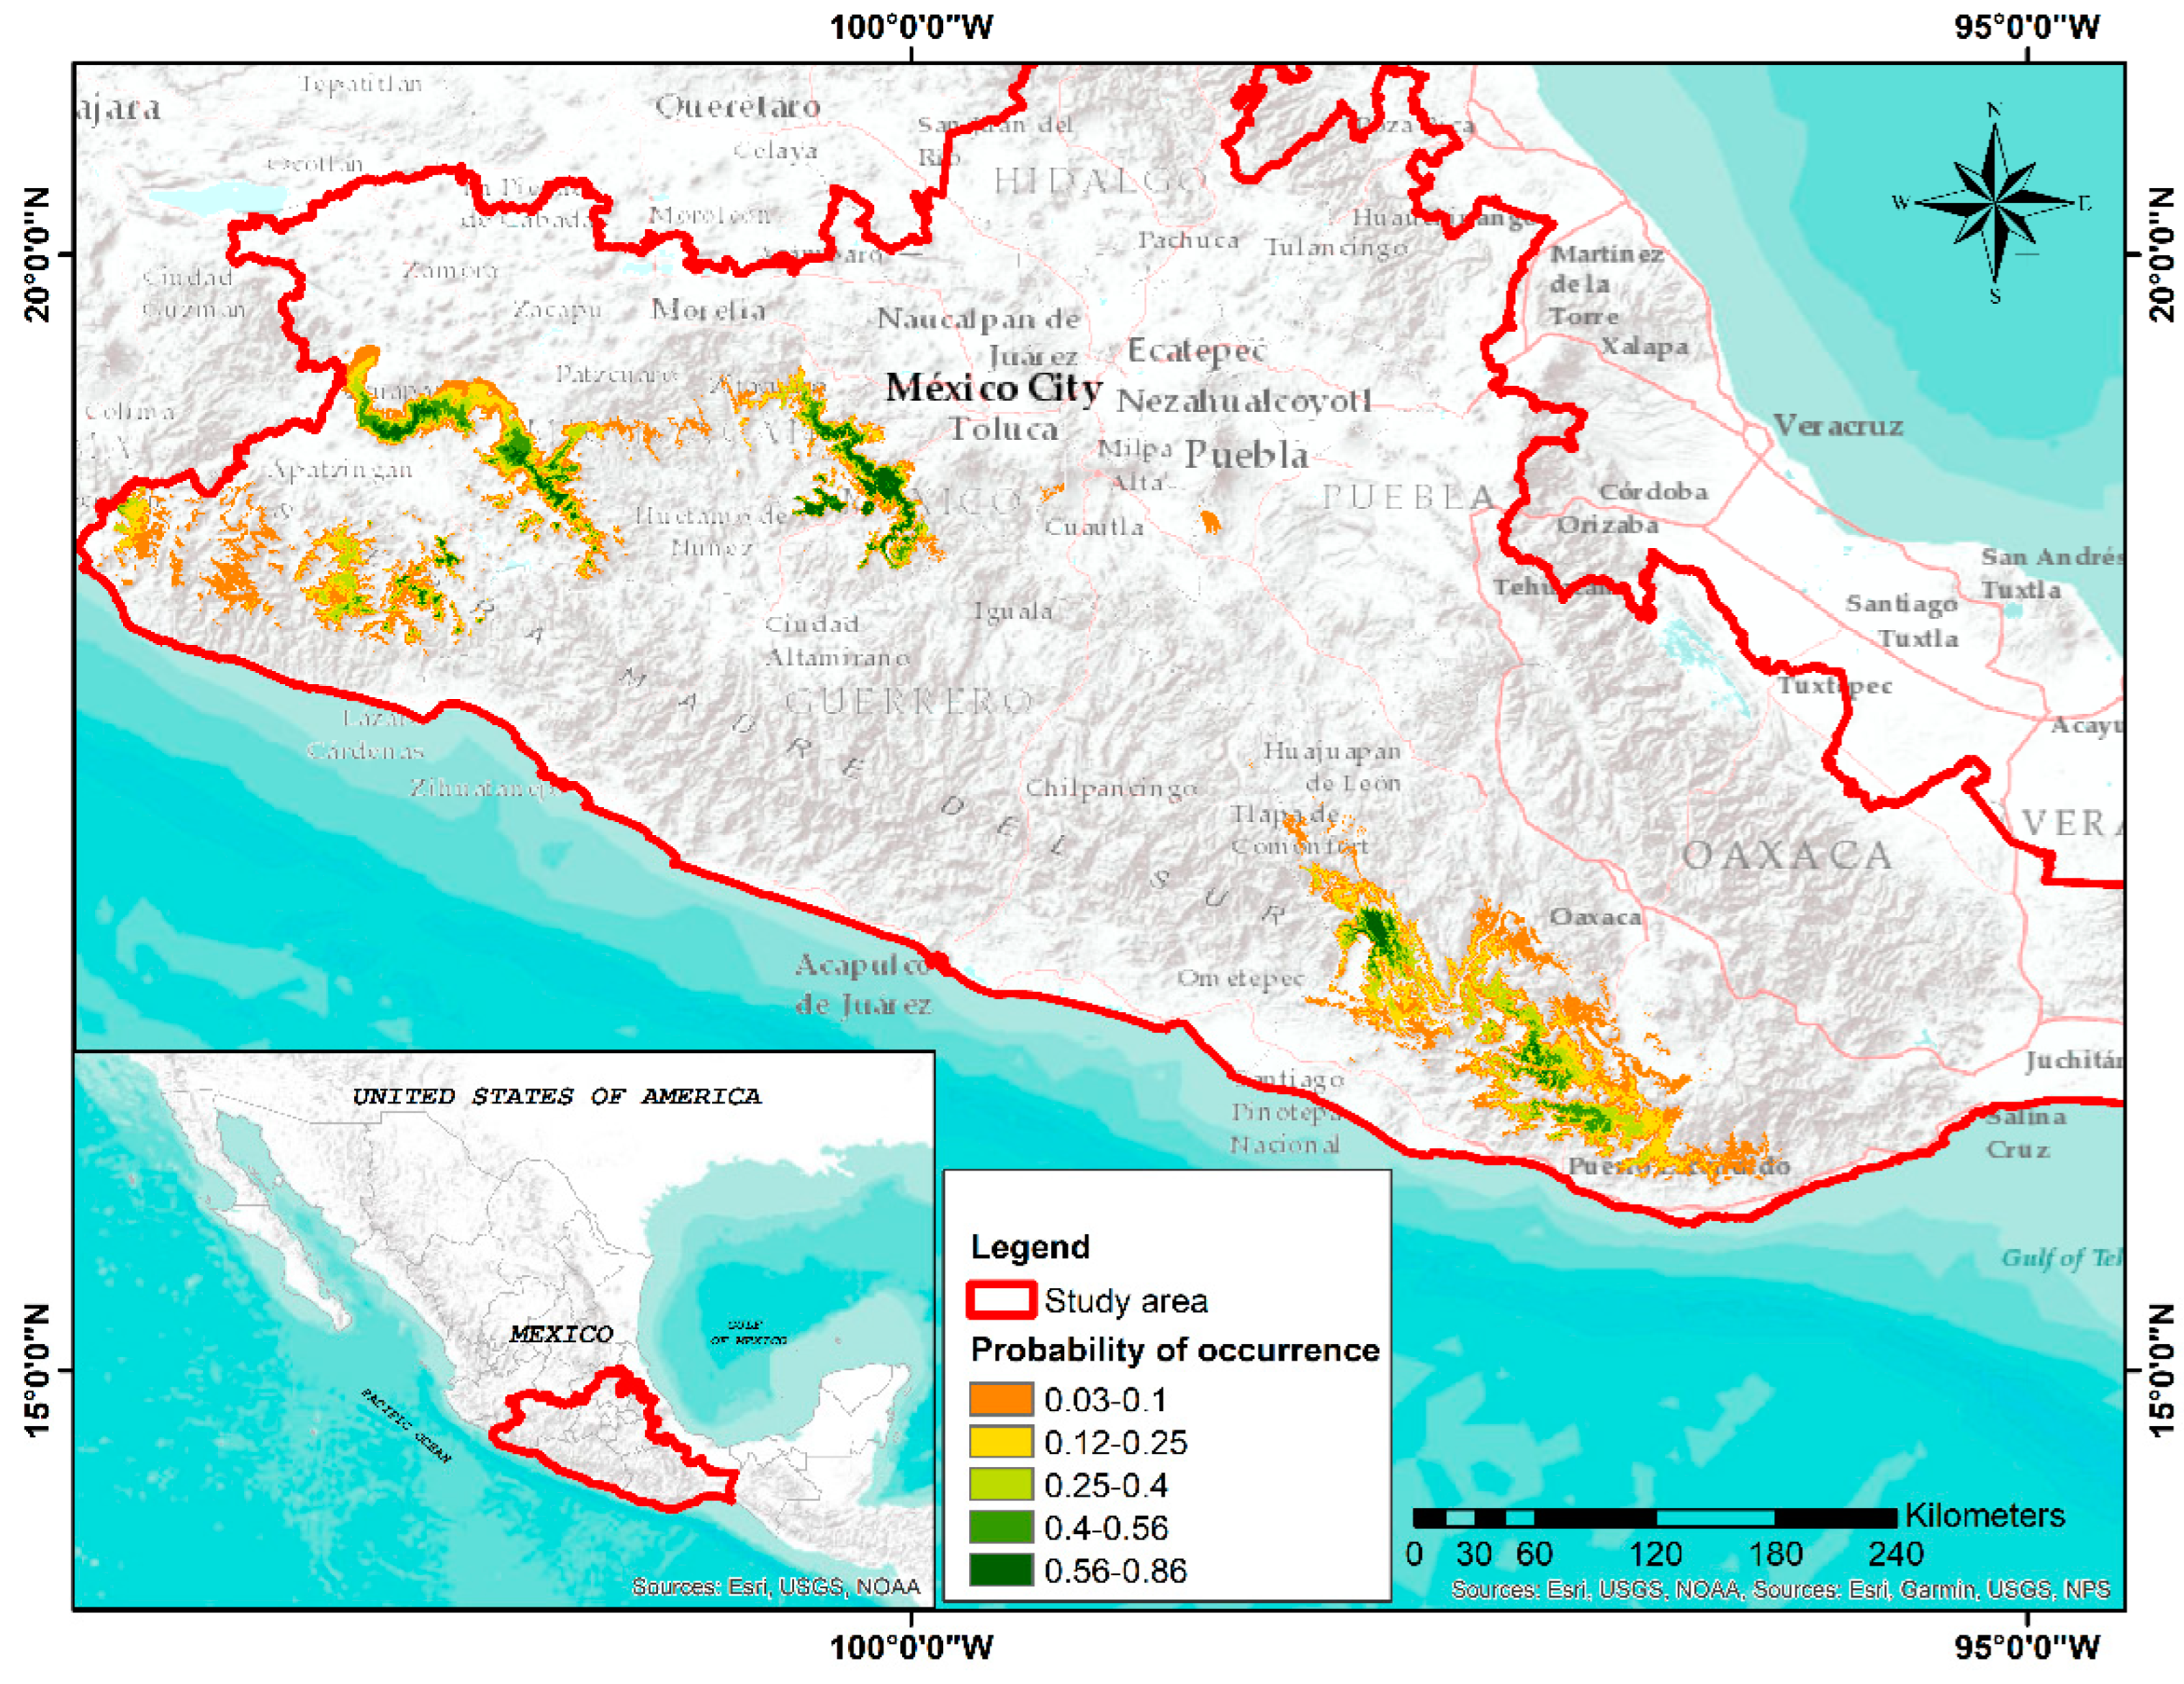
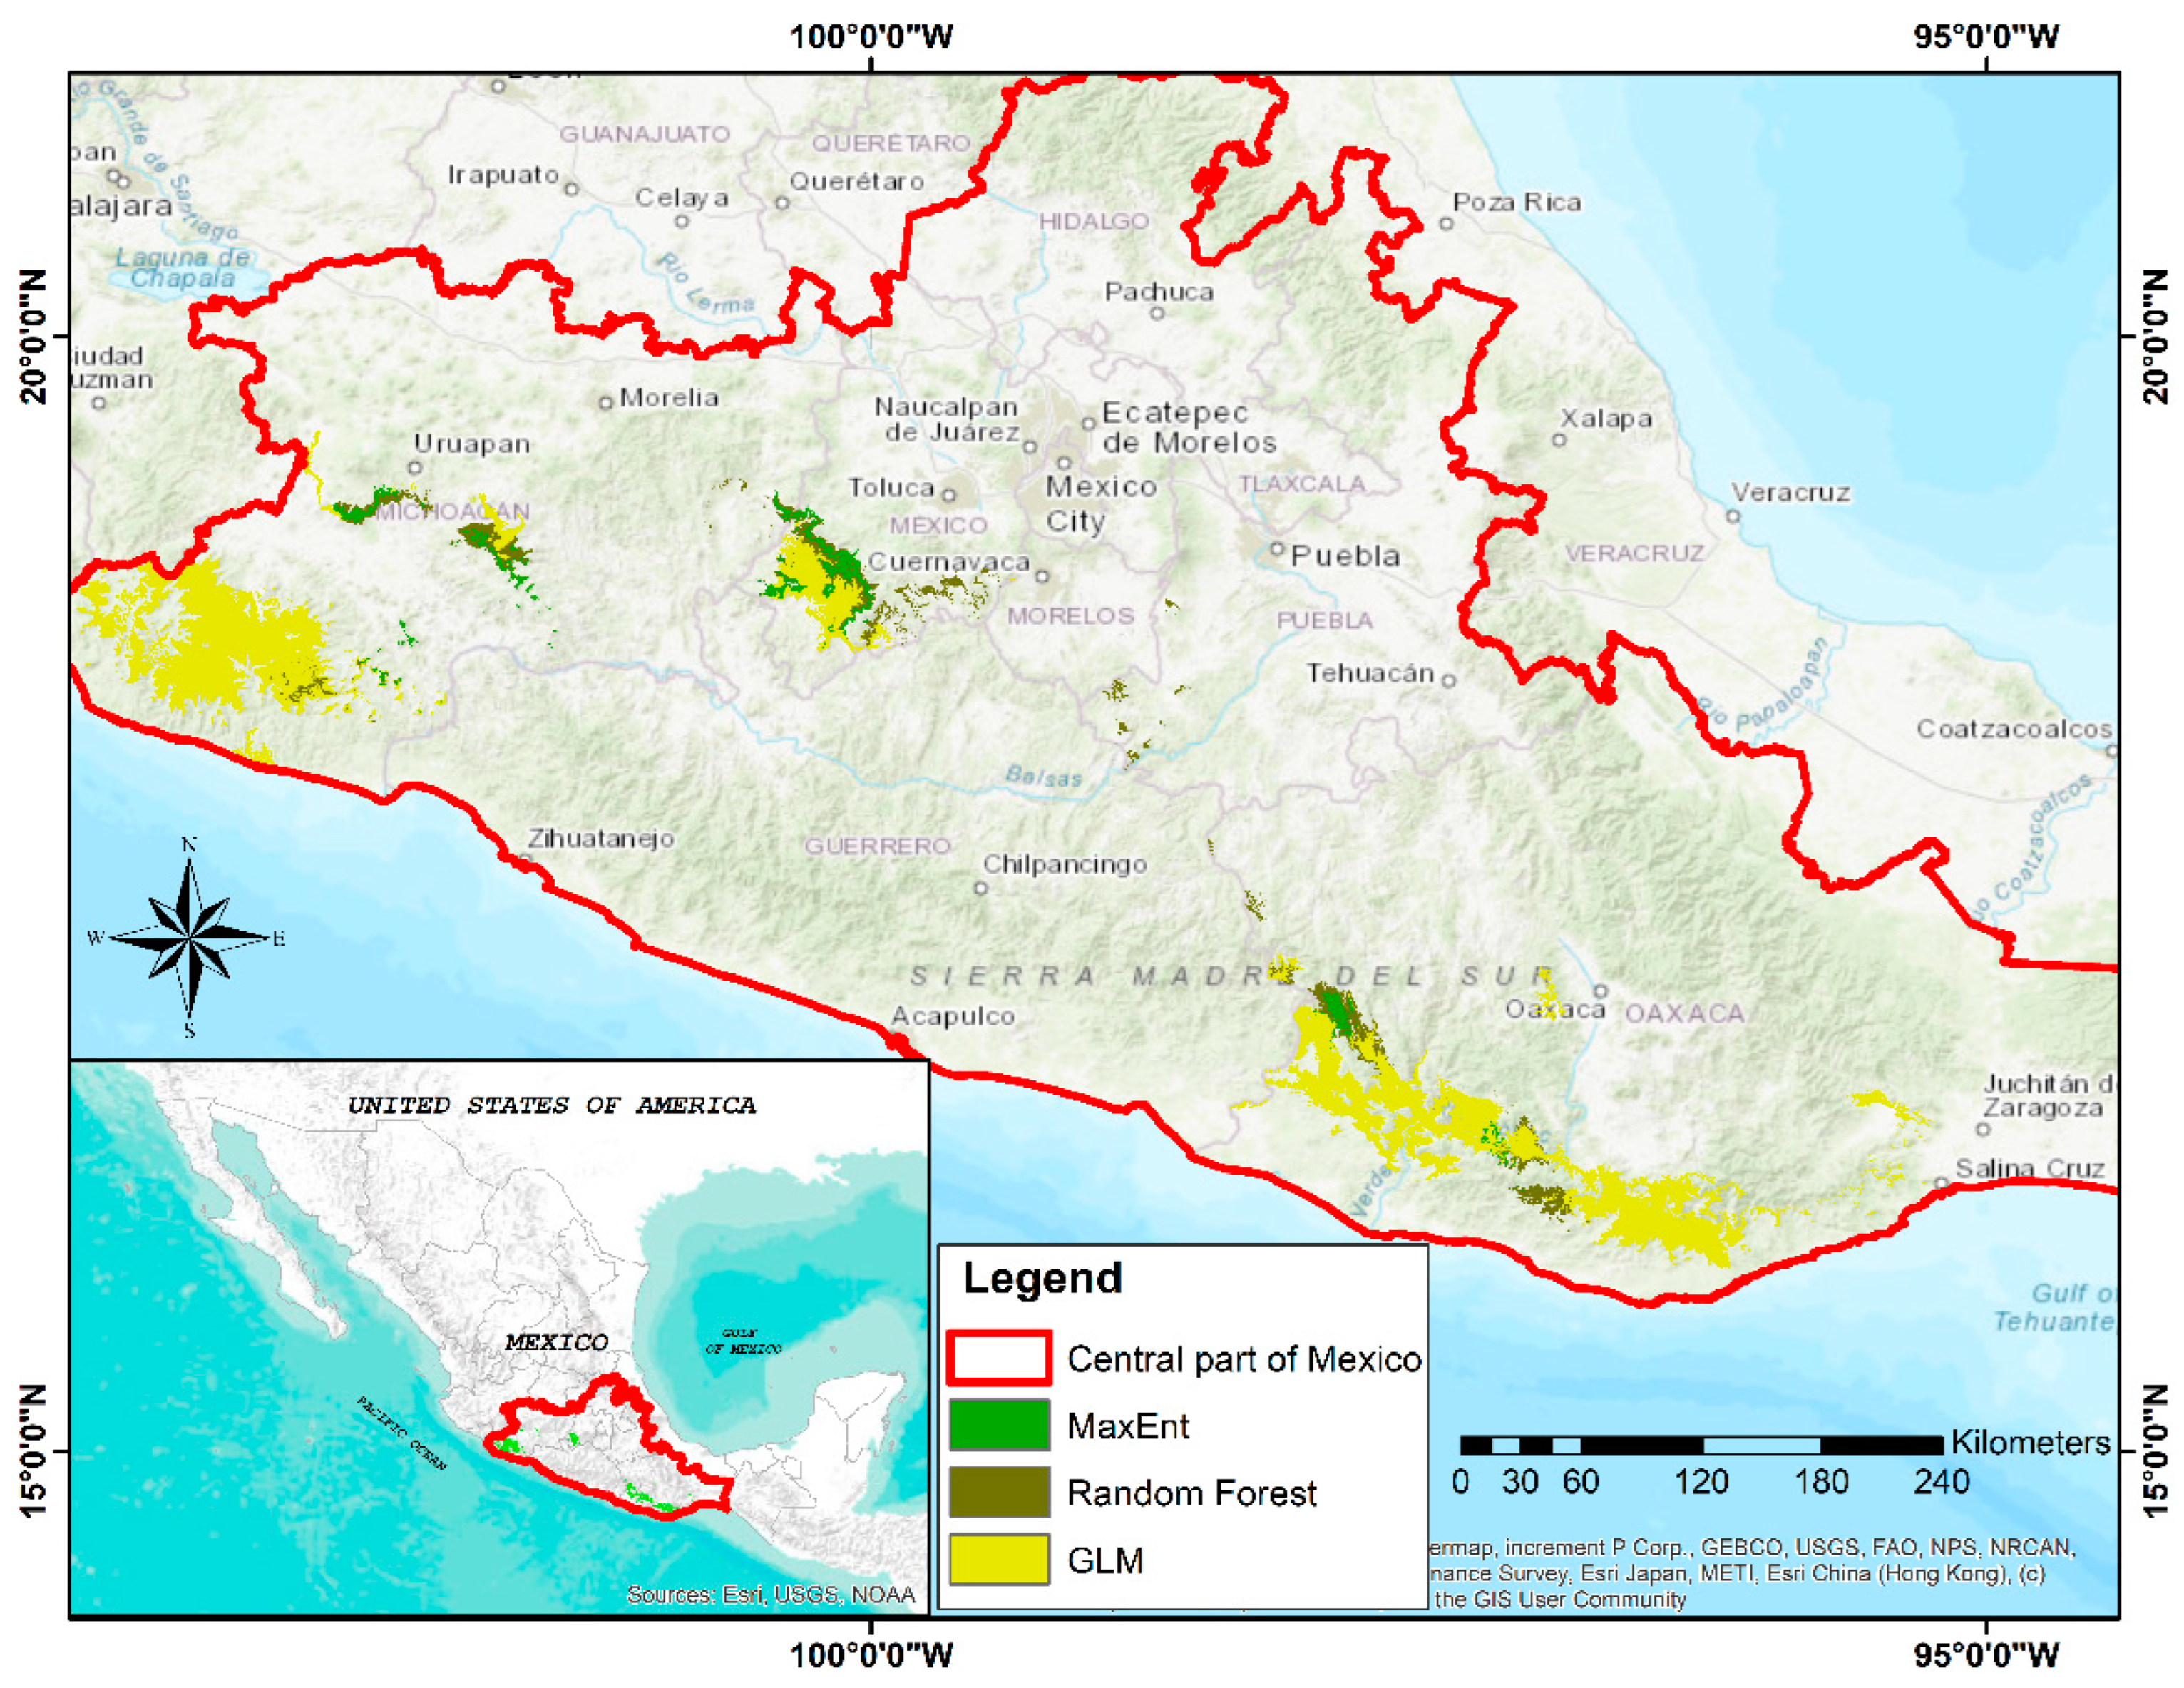
3.5. Identifying Areas for Conservation Purposes (Ex Situ) of the Species
4. Discussion
4.1. Implications and Conservation Strategies
4.2. Model Selection and Implications
4.3. Final Considerations
5. Conclusions
Author Contributions
Funding
Data Availability Statement
Acknowledgments
Conflicts of Interest
References
- Hein, J.; Guarin, A.; Frommé, E.; Pauw, P. Deforestation and the Paris climate agreement: An assessment of REDD + in the national climate action plans. For. Policy Econ. 2018, 90, 7–11. [Google Scholar] [CrossRef]
- Türkeş, M.; Musaoğlu, N.; Özcan, O. Assessing the vulnerability of a forest ecosystem to climate change and variability in the western Mediterranean sub-region of Turkey: Future evaluation. J. For. Res. 2018, 29, 1177–1186. [Google Scholar] [CrossRef]
- Choe, H.; Thorne, J.H. Integrating climate change and land use impacts to explore forest conservation policy. Forests 2017, 8, 321. [Google Scholar] [CrossRef] [Green Version]
- Cazorla, B.P.; Cabello, J.; Peñas, J.; Garcillán, P.P.; Reyes, A.; Alcaraz-Segura, D. Incorporating Ecosystem Functional Diversity into Geographic Conservation Priorities Using Remotely Sensed Ecosystem Functional Types. Ecosystems 2021, 24, 548–564. [Google Scholar] [CrossRef]
- Mendoza-Ponce, A.; Corona-Núñez, R.; Kraxner, F.; Leduc, S.; Patrizio, P. Identifying effects of land use cover changes and climate change on terrestrial ecosystems and carbon stocks in Mexico. Glob. Environ. Change 2018, 53, 12–23. [Google Scholar] [CrossRef] [Green Version]
- Gernandt, D.S.; Pérez-De La Rosa, J.A. Biodiversidad de Pinophyta (coníferas) en México. Rev. Mex. Biodivers. 2014, 85, 126–133. [Google Scholar] [CrossRef] [Green Version]
- Escobar-Flores, J.G.; Lopez-Sanchez, C.A.; Sandoval, S.; Marquez-Linares, M.A.; Wehenkel, C. Predicting Pinus monophylla forest cover in the Baja California Desert by remote sensing. PeerJ 2018, 6, e4603. [Google Scholar] [CrossRef] [Green Version]
- Rzedowski, J. Vegetacion de Mexico, 1st ed.; Comision Nacional para el Uso y Conocimiento de la Biodiversidad: Mexico City, Mexico, 2006. [Google Scholar]
- Sáenz-Romero, C.; Rehfeldt, G.E.; Duval, P.; Lindig-Cisneros, R.A. Abies religiosa habitat prediction in climatic change scenarios and implications for monarch butterfly conservation in Mexico. For. Ecol. Manag. 2012, 275, 98–106. [Google Scholar] [CrossRef]
- Matsui, T.; Nakao, K.; Higa, M.; Tsuyama, I.; Kominami, Y.; Yagihashi, T.; Koide, D.; Tanaka, N. Potential impact of climate change on canopy tree species composition of cool-temperate forests in Japan using a multivariate classification tree model. Ecol. Res. 2018, 33, 289–302. [Google Scholar] [CrossRef]
- CONAFOR. La Produccion de Resina de Pino en Mexico; Guadalajara, Mexico, 2013; Volume 14. [Google Scholar]
- Flores, A.; Climent, J.; Pando, V.; López-Upton, J.; Alía, R. Intraspecific Variation in Pines from the Trans-Mexican Volcanic Belt Grown under Two Watering Regimes: Implications for Management of Genetic Resources. Forests 2018, 9, 71. [Google Scholar] [CrossRef]
- Fabián-Plesníková, I.; Sáenz-Romero, C.; Cruz de León, J.; Martínez-Trujillo, M.; Sánchez Vargas, N.M. Parámetros genéticos de caracteres de crecimiento en un ensayo de progenies de Pinus oocarpa. Madera y Bosques 2020, 26, e2632014. [Google Scholar] [CrossRef]
- Reyes-Ramos, A.; de León, J.C.; Martínez-Palacios, A.; Lobit, P.C.M.; Ambríz-Parra, J.E.; Sánchez-Vargas, N.M. Ecological and dendrometric characters in which influence resin production of pinus oocarpa of michoacán, mexico. Madera y Bosques 2019, 25, e2511414. [Google Scholar] [CrossRef]
- Zobel, B.; Talbert, J. Applied Forest Tree Improvement; John Wiley & Sons, Ltd.: New York, NY, USA, 1988. [Google Scholar]
- White, T.; Adams, W.; Neale, D. Forest Genetics; CABI Publishiung Series: New York, NY, USA, 2007; ISBN 0851993486. [Google Scholar]
- Romero-Sanchez, M.; Perez-Miranda, R.; Gonzalez-Hernandez, A.; Velasco-Garcia, M.; Velasco-Bautista, E.; Flores, A. Current and Potential Spatial Distribution of Six Endangered Pine Species of Mexico: Towards a Conservation Strategy. Forests 2018, 9, 767. [Google Scholar] [CrossRef] [Green Version]
- Prieto-Amparán, J.A.; Villarreal-Guerrero, F.; Martínez-Salvador, M.; Manjarrez-Domínguez, C.; Vázquez-Quintero, G.; Pinedo-Alvarez, A. Spatial near future modeling of land use and land cover changes in the temperate forests of Mexico. PeerJ 2019, 2019, 6617. [Google Scholar] [CrossRef] [Green Version]
- Gebhardt, S.; Wehrmann, T.; Ruiz, M.; Maeda, P.; Bishop, J.; Schramm, M.; Kopeinig, R.; Cartus, O.; Kellndorfer, J.; Ressl, R.; et al. MAD-MEX: Automatic Wall-to-Wall Land Cover Monitoring for the Mexican REDD-MRV Program Using All Landsat Data. Remote Sens. 2014, 6, 3923–3943. [Google Scholar] [CrossRef] [Green Version]
- Naimi, B.; Araújo, M.B. sdm: A reproducible and extensible R platform for species distribution modelling. Ecography 2016, 39, 368–375. [Google Scholar] [CrossRef] [Green Version]
- R Core Team. R: A Languaje and Environment for Statistical Computing; R Foundation: Vienna, Austria, 2020. [Google Scholar]
- Barbet-Massin, M.; Jiguet, F.; Albert, C.H.; Thuiller, W. Selecting pseudo-absences for species distribution models: How, where and how many? Methods Ecol. Evol. 2012, 3, 327–338. [Google Scholar] [CrossRef]
- Renteria, J.L.; Darin, G.M.S.; Grosholz, E.D. Assessing the risk of plant species invasion under different climate change scenarios in California. Invasive Plant Sci. Manag. 2021, 14, 172–182. [Google Scholar] [CrossRef]
- Cuervo-Robayo, A.P.; Téllez-Valdés, O.; Gómez-Albores, M.A.; Venegas-Barrera, C.S.; Manjarrez, J.; Martínez-Meyer, E. An update of high-resolution monthly climate surfaces for Mexico. Int. J. Climatol. 2014, 34, 2427–2437. [Google Scholar] [CrossRef]
- Hallgren, W.; Santana, F.; Low-Choy, S.; Zhao, Y.; Mackey, B. Species distribution models can be highly sensitive to algorithm configuration. Ecol. Modell. 2019, 408, 108719. [Google Scholar] [CrossRef]
- Sillero, N.; dos Santos, R.; Teodoro, A.C.; Carretero, M.A. Ecological niche models improve home range estimations. J. Zool. 2021, 313, 145–157. [Google Scholar] [CrossRef]
- Saha, S.; Saha, M.; Mukherjee, K.; Arabameri, A.; Ngo, P.T.T.; Paul, G.C. Predicting the deforestation probability using the binary logistic regression, random forest, ensemble rotational forest, REPTree: A case study at the Gumani River Basin, India. Sci. Total Environ. 2020, 730, 139197. [Google Scholar] [CrossRef] [PubMed]
- Agresti, A. An Introduction to Categorical Data Analysis; JohnWiley & Sons, Inc.: Hoboken, NJ, USA, 2007. [Google Scholar]
- Quinn, G.P.; Keough, M.J. Experimental Design and Data Analysis for Biologists; Cambridge University Press: Cambridge, UK, 2002; ISBN 9780521811286. [Google Scholar]
- Valavi, R.; Guillera-Arroita, G.; Lahoz-Monfort, J.J.; Elith, J. Predictive performance of presence-only species distribution models: A benchmark study with reproducible code. Ecol. Monogr. 2022, 92, 1486. [Google Scholar] [CrossRef]
- Breiman, L. Random Forests. Mach. Learn. 2001, 45, 5–32. [Google Scholar] [CrossRef] [Green Version]
- Luan, J.; Zhang, C.; Xu, B.; Xue, Y.; Ren, Y. The predictive performances of random forest models with limited sample size and different species traits. Fish. Res. 2020, 227, 105534. [Google Scholar] [CrossRef]
- Liam, A.; Wiener, M. Classification and Regression by randomForest. R News 2002, 2, 18–22. [Google Scholar]
- Phillips, S.J.; Dudík, M. Modeling of species distribution with Maxent: New extensions and a comprehensive evalutation. Ecograpy 2008, 31, 161–175. [Google Scholar] [CrossRef]
- Cobos, M.E.; Townsend Peterson, A.; Barve, N.; Osorio-Olvera, L. Kuenm: An R package for detailed development of ecological niche models using Maxent. PeerJ 2019, 2019, 6281. [Google Scholar] [CrossRef] [Green Version]
- Mi, C.; Huettmann, F.; Guo, Y.; Han, X.; Wen, L. Why choose Random Forest to predict rare species distribution with few samples in large undersampled areas? Three Asian crane species models provide supporting evidence. PeerJ 2017, 5, e2849. [Google Scholar] [CrossRef] [Green Version]
- Hijmans, R.J.; Graham, C.H. The ability of climate envelope models to predict the effect of climate change on species distributions. Glob. Chang. Biol. 2006, 12, 2272–2281. [Google Scholar] [CrossRef]
- Allouche, O.; Tsoar, A.; Kadmon, R. Assessing the accuracy of species distribution models: Prevalence, kappa and the true skill statistic (TSS). J. Appl. Ecol. 2006, 43, 1223–1232. [Google Scholar] [CrossRef]
- Santini, L.; Benítez-López, A.; Maiorano, L.; Čengić, M.; Huijbregts, M.A.J. Assessing the reliability of species distribution projections in climate change research. Divers. Distrib. 2021, 27, 1035–1050. [Google Scholar] [CrossRef]
- Phillips, S.J.; Anderson, R.P.; Schapire, R.E. Maximum entropy modeling of species geographic distributions. Ecol. Modell. 2006, 190, 231–259. [Google Scholar] [CrossRef] [Green Version]
- Paquit, J.C.; Pampolina, N.M.; Tiburan, C.L.; Manalo, M.M.Q. Maxent modeling of the habitat distribution of the critically endangered Pterocarpus indicus Willd. forma indicus In Mindanao, Philippines. J. Biodivers. Environ. Sci. 2017, 10, 2222–3045. [Google Scholar]
- Ray, D.; Behera, M.D.; Jacob, J. Evaluating Ecological Niche Models: A Comparison Between Maxent and GARP for Predicting Distribution of Hevea brasiliensis in India. Proc. Natl. Acad. Sci. India Sect. B Biol. Sci. 2017, 88, 1337–1343. [Google Scholar] [CrossRef]
- Guisan, A.; Zimmermann, N.E. Predictive habitat distribution models in ecology. Ecol. Modell. 2000, 135, 147–186. [Google Scholar] [CrossRef]
- Cheng, Y.; Tjaden, N.B.; Jaeschke, A.; Thomas, S.M.; Beierkuhnlein, C. Using centroids of spatial units in ecological niche modelling: Effects on model performance in the context of environmental data grain size. Glob. Ecol. Biogeogr. 2021, 30, 611–621. [Google Scholar] [CrossRef]
- Martínez-Sifuentes, A.R.; Villanueva-Díaz, J.; Manzanilla-Quiñones, U.; Becerra-López, J.L.; Hernández-Herrera, J.A.; Estrada-ávalos, J.; Velázquez-Pérez, A.H. Spatial modeling of the ecological niche of pinus greggii engelm. (pinaceae): A species conservation proposal in mexico under climatic change scenarios. iForest 2020, 13, 426–434. [Google Scholar] [CrossRef]
- Lombardero, M.J.; Ayres, M.P.; Lorio, P.L., Jr.; Ruel, J.J. Environmental effects on constitutive and inducible resin defences of Pinus taeda. Ecol. Lett. 2000, 3, 329–339. [Google Scholar] [CrossRef] [Green Version]
- López-Hernández, M.I.; Cerano-Paredes, J.; Valencia-Manzo, S.; Cornejo-Oviedo, E.H.; Villanueva-Díaz, J.; Cervantes-Martínez, R.; Esquivel-Arriaga, G. Respuesta del crecimiento de Pinus oocarpa Schiede a variables climáticas en el noroeste de Lagunas de Montebello, Chiapas, México. Rev. Biol. Trop. 2018, 66, 1580–1596. [Google Scholar] [CrossRef] [Green Version]
- Egloff, P. Tapping Pinus Oocarpa. Assessing Drivers of Resin Yield in Natural Stands of Pinus Oocarpa. Master’s Thesis, Wageningen University & Research, Wageningen, The Netherlands, 2020; pp. 1–29. [Google Scholar]
- Ahmad, F.; Uddin, M.M.; Goparaju, L.; Dhyani, S.K.; Oli, B.N.; Rizvi, J. Tree suitability modeling and mapping in Nepal: A geospatial approach to scaling agroforestry. Model. Earth Syst. Environ. 2021, 7, 169–179. [Google Scholar] [CrossRef]
- Rattis, L.; Dobrovolski, R.; Talebi, M.; Loyola, R. Geographic range-scale assessment of species conservation status: A framework linking species and landscape features. Perspect. Ecol. Conserv. 2018, 16, 97–104. [Google Scholar] [CrossRef]
- Sáenz-Romero, C.; Guzmán-Reyna, R.R.; Rehfeldt, G.E. Altitudinal genetic variation among Pinus oocarpa populations in Michoacán, Mexico. Implications for seed zoning, conservation, tree breeding and global warming. For. Ecol. Manage. 2006, 229, 340–350. [Google Scholar] [CrossRef]
- de Waal, L.; Mitchell, R.G.; Hodge, G.R.; Chirwa, P.W. The use of field and artificial freezing studies to assess frost tolerance in natural populations of Pinus oocarpa. South. For. J. For. Sci. 2018, 80, 195–208. [Google Scholar] [CrossRef]
- Fabián-Plesníková, I.; Sáenz-Romero, C.; Cruz-De-León, J.; Martínez-Trujillo, M.; Sánchez-Vargas, N.M.; Terrazas, T. Heritability and characteristics of resin ducts in Pinus oocarpa stems in Michoacán, Mexico. IAWA J. 2021, 42, 258–278. [Google Scholar] [CrossRef]
- Gomez-Mendoza, L.; Arriaga, L. Modeling the Effect of Climate Change on the Distribution of Oak and Pine Species of Mexico. Conserv. Biol. 2007, 21, 1545–1555. [Google Scholar] [CrossRef]
- Pisanty, I.; Urquiza-Haas, E.; Vargas-Mena y Amezcua, A.; Ruiz-González, S.P.; Urquiza-Haas, T.; García-Méndez, G. Instrumentos de conservación in situ en México: Logros y retos. In Capital Natural de México; Sarukhán, J., Pisanty, I., Eds.; CONABIO: Mexico City, Mexico, 2016; pp. 245–302. ISBN 978-607-8328-69-7. [Google Scholar]
- Yang, R.C.; Yeh, F.C. 94Z/00002 Genetic consequences of in situ and ex situ conservation of forest trees. Biol. Conserv. 1995, 71, 211. [Google Scholar] [CrossRef]
- Gutiérrez, J.A.; Duivenvoorden, J.F. Can we expect to protect threatened species in protected areas? A case study of the genus Pinus in Mexico. Rev. Mex. Biodivers. 2010, 81, 875–882. [Google Scholar]
- Dvorak, W.S.; Potter, K.M.; Hipkins, V.D.; Hodge, G.R. Genetic Diversity and Gene Exchange in Pinus oocarpa, a Mesoamerican Pine with Resistance to the Pitch Canker Fungus (Fusarium circinatum). Int. J. Plant Sci. 2009, 170, 609–626. [Google Scholar] [CrossRef] [Green Version]
- Sáenz-Romero, C.; Tapia-Olivares, B.L. Pinus oocarpa isoenzymatic variation along an altitudinal gradient in Michoacán, México. Silvae Genet. 2003, 52, 237–240. [Google Scholar]
- Sønstebø, J.H.; Tollefsrud, M.M.; Myking, T.; Steffenrem, A.; Nilsen, A.E.; Edvardsen, Ø.M.; Johnskås, O.R.; El-Kassaby, Y.A. Genetic diversity of Norway spruce (Picea abies (L.) Karst.) seed orchard crops: Effects of number of parents, seed year, and pollen contamination. For. Ecol. Manag. 2018, 411, 132–141. [Google Scholar] [CrossRef]
- Díaz, V.; Muñiz, L.M.; Ferrer, E. Random amplified polymorphic DNA and amplified fragment length polymorphism assessment of genetic variation in Nicaraguan populations of Pinus oocarpa. Mol. Ecol. 2001, 10, 2593–2603. [Google Scholar] [CrossRef] [PubMed] [Green Version]
- Joyce, D.G.; Rehfeldt, G.E. Climatic niche, ecological genetics, and impact of climate change on eastern white pine (Pinus strobus L.): Guidelines for land managers. For. Ecol. Manag. 2013, 295, 173–192. [Google Scholar] [CrossRef] [Green Version]
- González-Hernández, A.; Morales-Villafaña, R.; Romero-Sánchez, M.E.; Islas-Trejo, B.; Pérez-Miranda, R. Modelling potential distribution of a pine bark beetle in Mexican temperate forests using forecast data and spatial analysis tools. J. For. Res. 2020, 31, 649–659. [Google Scholar] [CrossRef]
- Melo-Merino, S.M.; Reyes-Bonilla, H.; Lira-Noriega, A. Ecological niche models and species distribution models in marine environments: A literature review and spatial analysis of evidence. Ecol. Modell. 2020, 415, 108837. [Google Scholar] [CrossRef]
- Zhang, L.; Huettmann, F.; Zhang, X.; Liu, S.; Sun, P.; Yu, Z.; Mi, C. The use of classification and regression algorithms using the random forests method with presence-only data to model species’ distribution. MethodsX 2019, 6, 2281–2292. [Google Scholar] [CrossRef]
- Talukdar, S.; Singha, P.; Mahato, S.; Pal, S.; Liou, Y.A.; Rahman, A. Land-use land-cover classification by machine learning classifiers for satellite observations-A review. Remote Sens. 2020, 12, 1135. [Google Scholar] [CrossRef] [Green Version]
- Evans, J.S.; Cushman, S.A. Gradient modeling of conifer species using random forests. Landsc. Ecol. 2009, 24, 673–683. [Google Scholar] [CrossRef]


| Height (m) | Diameter at Breast Height (cm) | Altitude (masl) | Temp (°C) | Precipitation (mm) |
|---|---|---|---|---|
| 12–18 | 40–75 | Min 1000 Max. 2400 Mean 1800 | Min. 3 Max. 35 Mean 19 | Min. 650 Max. 2600 Mean 1300 |
| Environmental Variables | Units | Variable Code |
|---|---|---|
| Annual mean temperature | °C | Bio1 |
| Mean diurnal range (mean of monthly (max temp–min temp)) | °C | Bio2 |
| Isothermality (BIO2/BIO7) (multiply by 100) | °C | Bio3 |
| Temperature seasonality (standard deviation multiplied by 100) | % | Bio4 |
| Max temperature of the warmer month | °C | Bio5 |
| Min temperature of the coldest month | °C | Bio6 |
| Temperature annual range (Bio5-Bio6) | °C | Bio7 |
| Mean temperature of wettest quarter | °C | Bio8 |
| Mean temperature of driest quarter | °C | Bio9 |
| Mean temperature of warmest quarter | °C | Bio10 |
| Mean temperature of coldest quarter | °C | Bio11 |
| Total precipitation | Mm | Bio12 |
| Precipitation of the wettest season | mm | Bio13 |
| Precipitation of the driest season | mm | Bio14 |
| Precipitation seasonality (coefficient of variation) | % | Bio15 |
| Precipitation of the wettest quarter | mm | Bio16 |
| Precipitation of the driest quarter | mm | Bio17 |
| Precipitation of warmer quarter | mm | Bio18 |
| Precipitation of the coldest quarter | mm | Bio19 |
| Altitude | masl | Altitude |
| Aspect | Degrees (°) | Aspect |
| Slope | Degrees (°) | Slope |
| Probability of Occurrence | Category | New Pixel Value |
|---|---|---|
| 0.0 to 0.1 | Non-suitable | 0 |
| 0.12 to 0.25 | Non-suitable | 0 |
| 0.26 to 0.40 | Non-suitable | 0 |
| 0.40 to 0.55 | Non-suitable | 0 |
| 0.56 to 1 | Suitable | 1 |
| Location | Mean Height (SD) | Mean Diameter at Breast Height (SD) | Age (SD) | Observations of Presence |
|---|---|---|---|---|
| Mexico State | 19.05 (4.98) | 44.68 (12.11) | 71 (20) | 100 |
| Michoacan | 21.19 (5.47) | 59.76 (15.75) | 62 (20) | 99 |
| Oaxaca | 19.86 (4.96) | 47.04 (10.33) | 63 (23) | 86 |
| Model | Estimates | Standard Error | p Value |
|---|---|---|---|
| 2.6049 0.0435 −0.1623 −0.3899 −0.2800 −0.6139 0.0138 0.0980 | 3.5611 0.0050 0.0195 0.0926 0.0640 0.2743 0.0110 0.02747 | 0.4644 <0.0001 <0.0001 <0.0001 <0.0001 0.025 0.2077 <0.0001 |
| Criteria | Number of Models |
|---|---|
| All candidate models | 434 |
| Statistically significant models | 434 |
| Models meeting omission rate criteria | 108 |
| Models meeting AICc criteria | 8 |
| Statistically significant models meeting omission rate criteria | 108 |
| Statistically significant models meeting AICc criteria | 8 |
| Statistically significant models meeting omission rate and AICc criteria | 1 |
| Model | Mean AUC Ratio | Partial ROC | Omission Rate at 5% | AICc | W_AICc | Parameters |
|---|---|---|---|---|---|---|
| Pinus oocarpa | 1.94 | 0 | 0.049 | 7394.212 | 0.947 | 24 |
| Predictor Variable | Contribution (%) |
|---|---|
| Temperature seasonality (Bio 4) | 20.50 |
| Min temperature of the coldest month (Bio 6) | 18.16 |
| Mean temperature of the driest quarter (Bio09) | 15.44 |
| Precipitation of wettest quarter (Bio16) | 13.21 |
| Precipitation seasonality (Bio 15) | 8.38 |
| Precipitation of the wettest season (Bio 13) | 5.60 |
| Model | AUC | TSS | Accuracy |
|---|---|---|---|
| Logistic | 0.93 | 0.67 | 0.83 |
| Random forest | 0.99 | 0.93 | 0.96 |
| MaxEnt | 0.97 | 0.76 | 0.81 |
| Suitable Area (ha) | |||
|---|---|---|---|
| Land Use | Logistic | Random Forest | Max Ent |
| Agriculture | 85,497.93 | 25,446.15 | 8689.68 |
| Grasslands | 139,452.8 | 29,205.36 | 12,729.15 |
| No vegetation | 220.32 | 150.66 | 0 |
| Secondary vegetation | 576,968.7 | 104,869.89 | 39,681.9 |
| Total | 802,139.8 | 159,672.06 | 61,100.73 |
Publisher’s Note: MDPI stays neutral with regard to jurisdictional claims in published maps and institutional affiliations. |
© 2022 by the authors. Licensee MDPI, Basel, Switzerland. This article is an open access article distributed under the terms and conditions of the Creative Commons Attribution (CC BY) license (https://creativecommons.org/licenses/by/4.0/).
Share and Cite
Romero-Sanchez, M.E.; Velasco-Garcia, M.V.; Perez-Miranda, R.; Velasco-Bautista, E.; Gonzalez-Hernandez, A. Different Modelling Approaches to Determine Suitable Areas for Conserving Egg-Cone Pine (Pinus oocarpa Schiede) Plus Trees in the Central Part of Mexico. Forests 2022, 13, 2112. https://doi.org/10.3390/f13122112
Romero-Sanchez ME, Velasco-Garcia MV, Perez-Miranda R, Velasco-Bautista E, Gonzalez-Hernandez A. Different Modelling Approaches to Determine Suitable Areas for Conserving Egg-Cone Pine (Pinus oocarpa Schiede) Plus Trees in the Central Part of Mexico. Forests. 2022; 13(12):2112. https://doi.org/10.3390/f13122112
Chicago/Turabian StyleRomero-Sanchez, Martin Enrique, Mario Valerio Velasco-Garcia, Ramiro Perez-Miranda, Efrain Velasco-Bautista, and Antonio Gonzalez-Hernandez. 2022. "Different Modelling Approaches to Determine Suitable Areas for Conserving Egg-Cone Pine (Pinus oocarpa Schiede) Plus Trees in the Central Part of Mexico" Forests 13, no. 12: 2112. https://doi.org/10.3390/f13122112