Article

Melaleuca alternifolia (Maiden & Betche) Cheel Residues Affect the Biomass and Soil Quality of Plantation

1
College of Forestry, Central South University of Forestry & Technology, Changsha 410004, China
2
Hunan Huarong Donghu National Wetland Park, Yueyang 414201, China
*
Author to whom correspondence should be addressed.
Forests 2022, 13(12), 2134; https://doi.org/10.3390/f13122134
Submission received: 13 November 2022 / Revised: 5 December 2022 / Accepted: 8 December 2022 / Published: 12 December 2022
(This article belongs to the Section Forest Soil)

Abstract

:
Long-term unreasonable management has led to the continuous decline of soil quality in Melaleuca alternifolia planting areas in southern China, and there is no effective way to improve its soil quality at present. In this study, residues of tea tree oil extraction were returned to the forest to explore its influence on soil quality. Therefore, four test groups (RT, residues were tiled; RS, residues were stacked; RDT, residues were decomposed and tiled; RDS, residues were decomposed and stacked) and one control group (CK, nothing was changed) were designed. We used one-way ANOVA and Pearson correlation analysis to detect 22 physical, chemical, and biological indicators of soil, and then used minimum data set (MDS) and principal component analysis (PCA) to evaluate soil quality. The results show that compared with the CK, BD and pH in the test groups decreases, while CP, TTP, SOM, AN, NN, AP, AK, CEC, MBC, MBN, MBP, catalase, urease, sucrase, and ACP increase or strengthen in different degrees, and the biomass increases by 5.3%~12.8%. The soil quality indexes (SQI) are RDT (0.616) > RT (0.546) > RDS (0.525) > RS (0.452) > CK (0.291). Significant correlation between SQI and biomass indicates that the indicators have high biological significance for the planting areas of Melaleuca alternifolia in the red soil region in southern China. These results show that residues could improve soil quality, and that the soil quality is different among different test groups. This study provides a new path for the management of Melaleuca alternifolia plantation.

1. Introduction

Melaleuca alternifolia is an aromatic tree of the genus Melaleuca in Myrtaceae from Australia. Tea tree oil is extracted from branches and leaves of Melaleuca alternifolia, and has high economic value. It is widely used in the fields of biomedicine [1], food preservation [2], and cosmetics [3]. It also has good prospects in resisting germs and tumors [4,5]. In the 1990s, Melaleuca alternifolia was introduced and planted in the red soil region of southern China. After more than 30 years of development, its scale reached thousands of hectares. However, with the expansion of the area and the increase in time, soil erosion is aggravated [6], soil quality is gradually decreasing [7], and operating cost is obviously increasing in the planting area. In addition, a large amount of waste residues produced in the extraction of tea tree oil were randomly dumped or buried, which occupied space and wasted a lot of resources.
The influence of forest residues on the physical and chemical characteristics of soil is not absolute. Some studies show that the nutrients released by the residues are not enough to change the contents of soil nutrients such as C, N, P, and K, because the nutrients contained in the residues are insignificant compared with the soil nutrient bank [8,9]. For example, Sankaran et al. (2005) showed that there was 9–16 t ha−1 of total N at sample plots (to 1 m depth) in Kerala, and 50–150 kg N ha−1 in the harvest residues, representing around 1% or less of the soil [10]. However, more studies proved that residues could improve soil structure, soil permeability, organic carbon content, and available N, P, and K content in surface soil, especially in tropical forests and plantations [11,12,13].
Soil quality evaluation is a decision-making tool that combines a variety of soil information for quantitative analysis and guides sustainable land management [14]. Currently, there is no unified quantitative system and tools to evaluate soil quality. How to choose simple, sensitive, and representative indicators is the premise and key to studying soil quality. Indicators generally consist of soil physical indicators, chemical indicators, and biological indicators [15]. Soil quality index (SQI) is an effective tool to evaluate soil quality, and it is usually combined with analytic hierarchy process (AHP) [16], principal component analysis (PCA) [17], geographical information system (GIS) [18], and other methods or techniques to determine the indicators system and weight. SQI is widely used in soil quality evaluation of agriculture, grasslands, forests, and other ecosystems, and has good effects.
In this study, we tried to return residues of tea tree oil extraction to the forest to explore its influence on the plantation soil quality. Then, four test groups (RT, residues were tiled; RS, residues were stacked; RDT, residues were decomposed and tiled; RDS, residues were decomposed and stacked) and a CK were designed in this study. On the basis of measuring 22 indicators of soil physics, chemistry, and biology, the differences in these indicators between the four test groups and the CK were evaluated, and the SQIs of the five treatments were calculated. Therefore, three hypotheses were put forward in this study: (1) applying residues has a significant impact on some physical, chemical, and biological properties of soil. (2) The effects of residues on soil physical, chemical, and biological properties are different among the four test groups. (3) Residues can improve the soil quality index of Melaleuca alternifolia plantation. The purpose of this paper is to construct the minimum data set (MDS) suitable for this type of research, and to find the best residue treatment method to improve soil quality, and explore the relationship between soil quality and plantation biomass, so as to provide scientific basis for increasing the biomass of Melaleuca alternifolia.

2. Materials and Methods
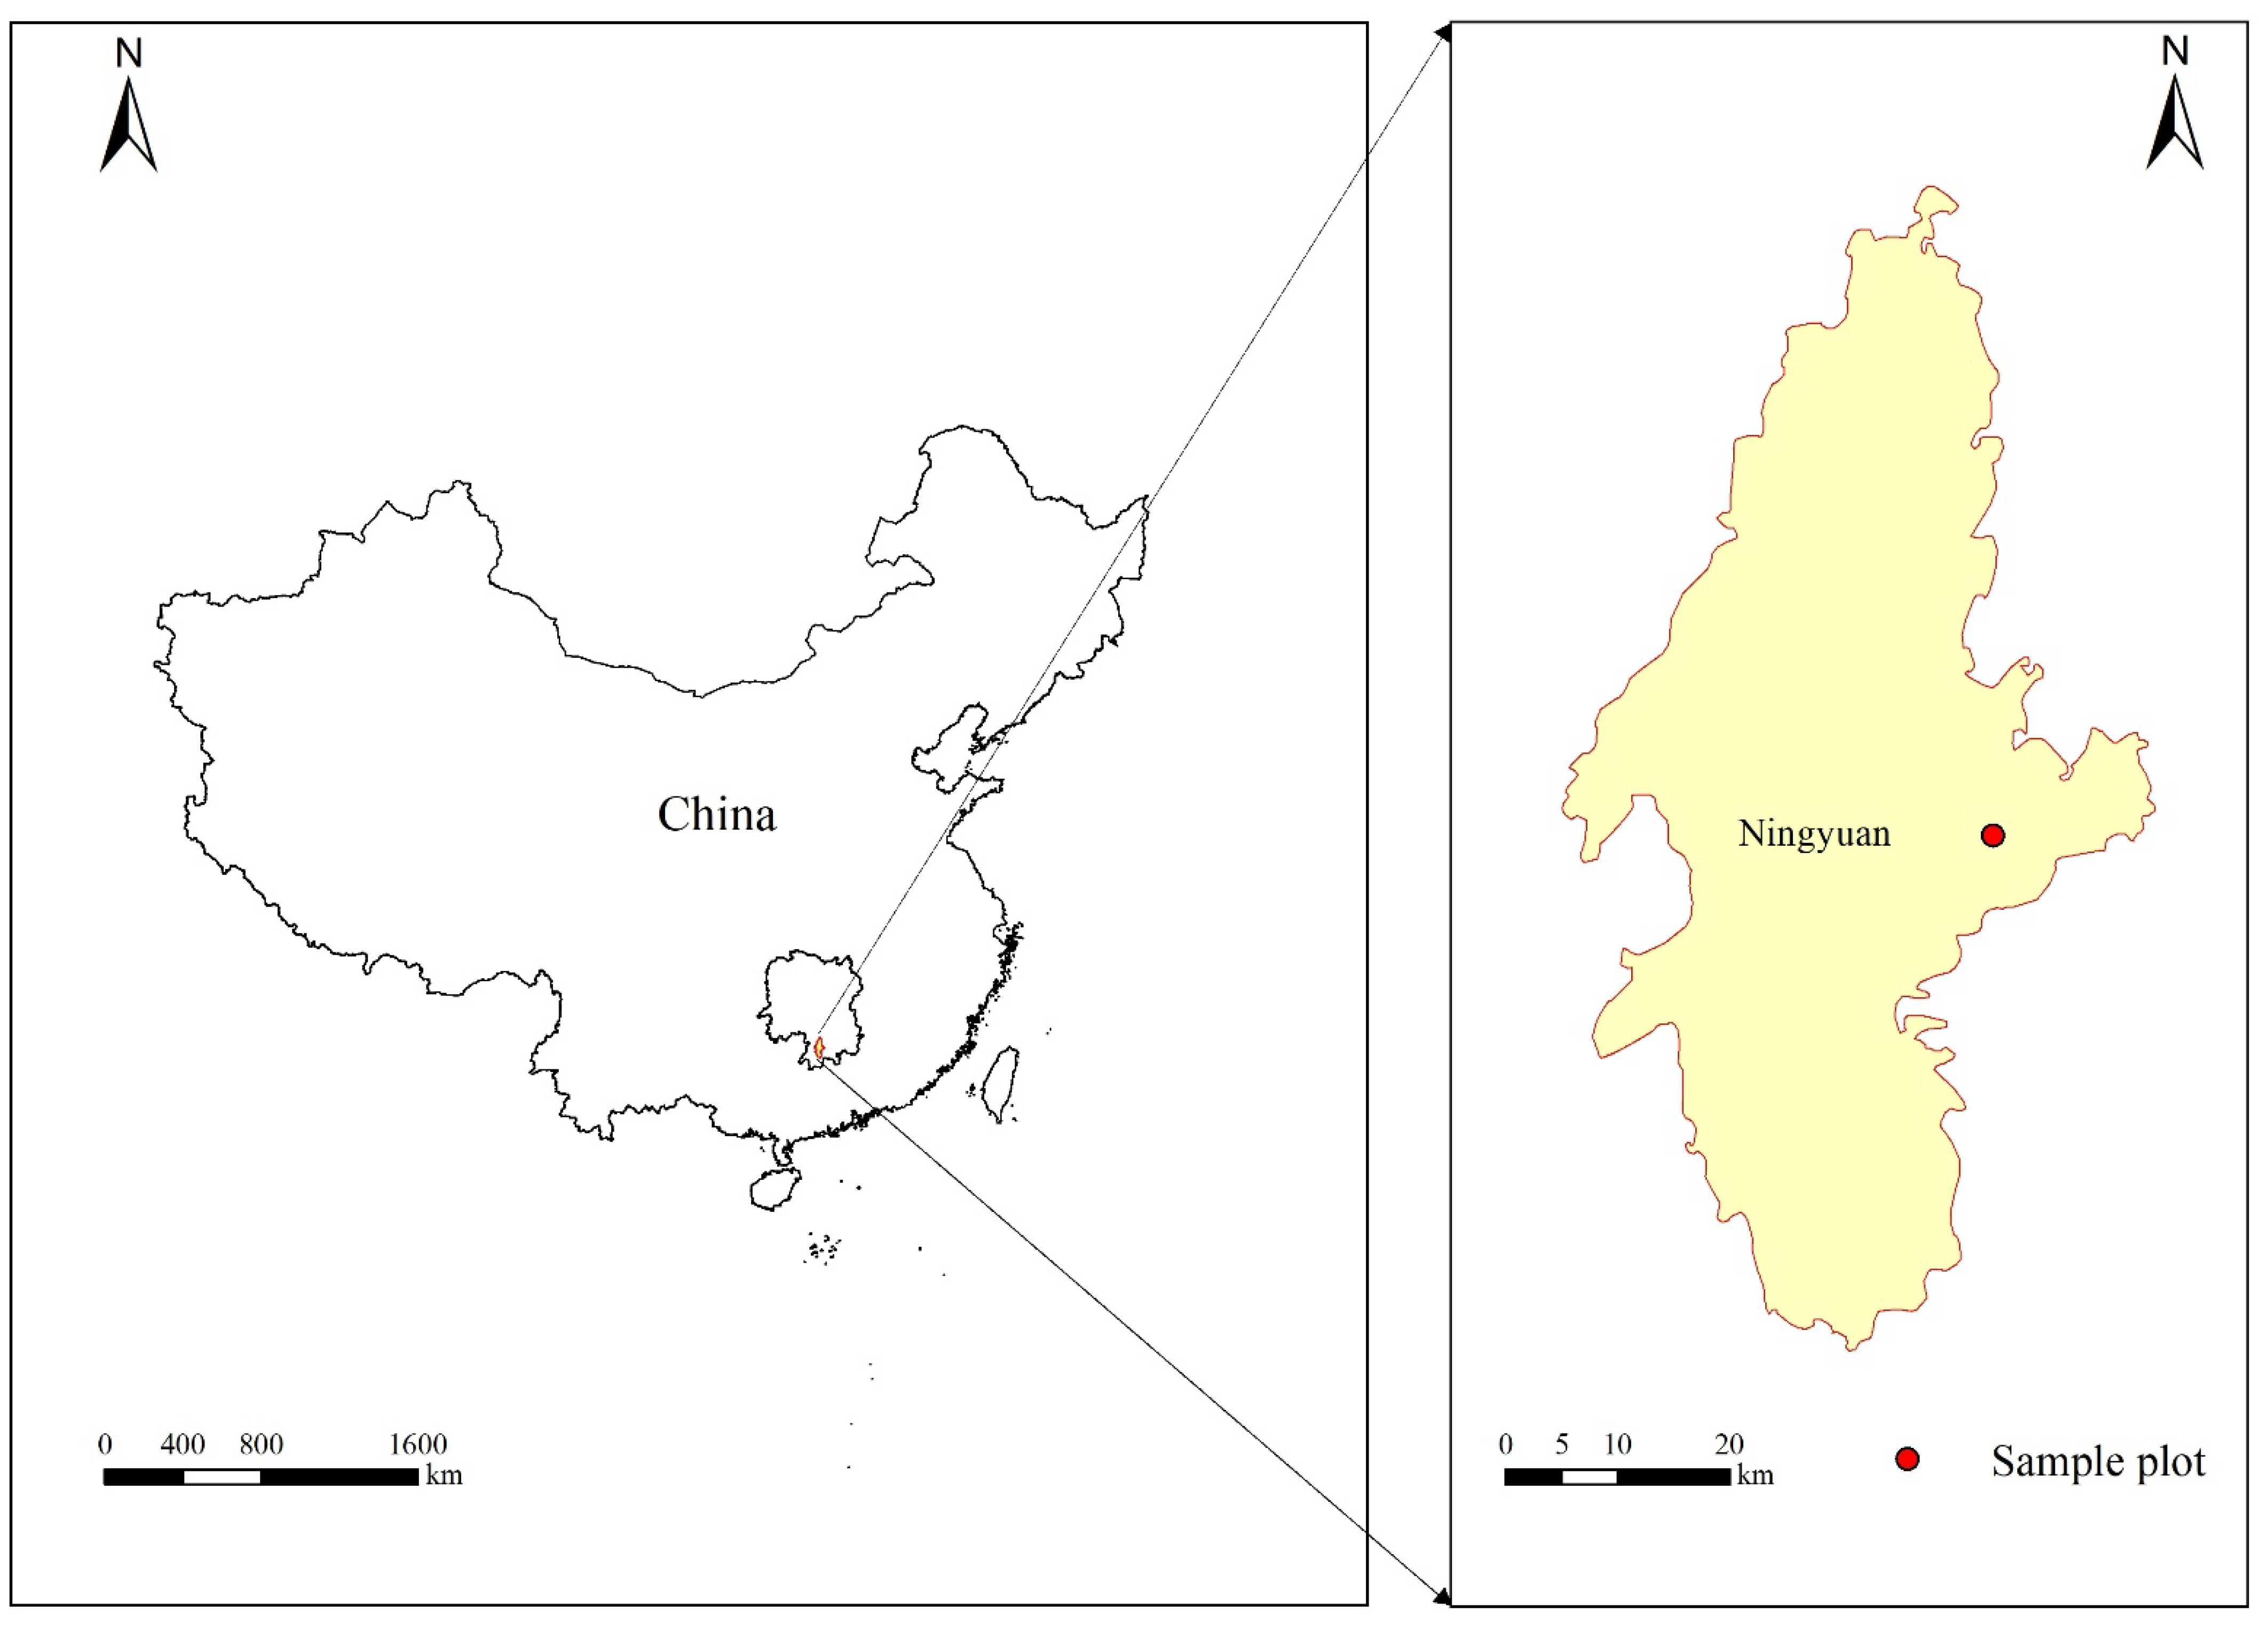
2.1. Study Area

The sampling site was located in Melaleuca alternifolia plantation in Ningyuan county, Yongzhou City, southern Hunan Province, China (112°12′17″~112°13′21″ E, 25°39′27″~25°40′09″ N) (Figure 1). This region is characterized by a subtropical monsoon climate, with annual average sunshine of 1440 h, annual average temperature of 18.4 °C, annual average precipitation of 1400 mm, and an annual average frost-free period of >300 d. Forestland is located on hilly areas with a mean slope of <10° and altitude of <300 m above sea level. Except for Melaleuca alternifolia, undergrowth vegetation mainly includes Abutilon theophrasti, Trifolium Trifolii, Artemisia annua, Sonchus oleraceus, Panicum repens, Rumex acetosa, etc. The zonal soil is mainly red soil, accompanied by a small amount of carbonate debris, with a thickness of 0.5~1.0 m.

2.2. Sample Plot Setting

In October 2019, Melaleuca alternifolia plantation (tree ages of 2 yr, planting density of 1.0 m × 1.2 m) with flat terrain and uniform seedling growth was selected as the test area in Ningyuan county. We designed five treatments, with a total of 15 sample plots of 20 m × 20 m, and red lines and signboards were using to separate these sample plots. Treatments: CK, nothing was changed; RT, residues were evenly tiled on the surface of forestland; RS, residues were stacked in strips; RDT, residues were decomposed by degradation agent and tiled; and RDS, residues were decomposed by degradation agent and stacked in strips. The strips were 1 m wide and 1 m apart. The degradation agent was named EM compost bacteria and made in Shandong, China, and mass ratio of degradation agent to residue was 1:1000. The mass of residues used in each group was 4 kg·m−2. Table 1 indicates the contents of part nutrient elements in Melaleuca alternifolia residues used in this study.

2.3. Biomass Measurement

In October 2021, Melaleuca alternifolia was harvested in the test area on continuous sunny days. The height of the stump was 3–5 cm. Biomasses were counted according to sample plot.

2.4. Soil Sampling and Analysis

Soil samples were collected after Melaleuca alternifolia was harvested in sample plots. In view of the fact that the soil surface layer is a nutrient-rich area, only soils of 0–20 cm were collected in this study. Five sampling points were selected along the diagonal of each sample plot (the sampling points were more than 3 m away from the edge of the sample plots). After the litters and residues on the soil surface were removed, one core soil sample (100 cm3) and one mixed soil sample (500 g) were collected from each sampling point, totaling 75 core soil samples and 75 mixed soil samples. Core soil samples were used to determine soil physical properties, some mixed soil samples were air-dried at room temperature for chemical analysis, and the remaining mixed soil samples were stored at 4 °C for biological analysis and other chemical analysis. Table 2 shows the determination method for each selected indicator.

2.5. Soil Quality Evaluation Method

Firstly, Pearson correlation analysis between biomass of Melaleuca alternifolia and the various soil properties was used to identify potential soil quality indicators. Then, PCA was used to group the indicators into appropriate soil quality factors, i.e., the MDS was constructed. Finally, the SQI of Melaleuca alternifolia plantation with five treatments was calculated.

2.5.1. Construct MDS

A total of 22 measured soil indicators (Table 2) were selected to construct the total data set (TDS), and the soil indicators with significant relationships with the biomass of Melaleuca alternifolia (p < 0.05) were selected to construct the important data set (IDS). PCA was employed as a data-reduction tool to select the most appropriate indicators, through which the number of independent variables could be reduced and problems related to multi-collinearity could be eliminated. According to the MDS selection procedure described by Li Ping et al. (2012), only the principal component (PC) with eigenvalue > 1 was considered for identifying the MDS; during the analysis, a VARIMAX rotation was performed to enhance interpretability of the uncorrelated components. Within each PC, indicators receiving weighted loading values within 10% of the highest weighted loading were selected for MDS [20]. When one indicator was retained within a PC, it was selected for MDS. When more than one indicator was in a PC, the correlations among those indicators were examined; if the correlation coefficient was less than 0.7, all indicators were selected for MDS. If the correlation coefficient was greater than 0.7, the indicator with the largest correlation coefficient sum was selected for MDS [21].

2.5.2. Weights of Indicators

After the final indicators for MDS were determined, according to method of calculating the weights of indicators by Li Ping (2012), the weight of each indicator was equal to the ratio of its communality with the sum of communalities of all indicators in the MDS [20].

2.5.3. Indicators Scores

Fuzzy membership function (FMF) can eliminate the effects of dimensions of different indicator units [22]. Therefore, we used FMF to standardize indicators in MDS. Then, the equation type was determined according to the positive and negative effects of each indicator on soil quality (Equations (1) and (2)).
F X i = X i j X i   m i n / X i   m a x X i   m i n
F X i = X i   m a x X i j / X i   m a x X i   m i n
In these two equations, Xij is the average value of the jth indicator of the ith treatment, Ximax and Ximin are the maximum and minimum values of all measured values of the jth indicator, respectively.

2.5.4. Calculating the SQI

SQI was calculated by Equation (3).
S Q I = i = 1 n W i F X i
In this equation, Wi is the weight of indicators, F(Xi) is the indicator scores, and n is the number of indicators in MDS.

2.6. Statistical Analysis

All data were statistically analyzed by SPSS 22.0 and Origin 2021b. Significant differences among different treatments (RT, RS, RDT, RDS, and CK) for each indicator (22 soil physical, chemical, and biological properties, Table 2) were analyzed by a one-way ANOVA, and the significance level was p = 0.05. Pearson analysis was used to check the correlation between 22 indicators and the correlation between these indicators and biomass (p = 0.05, p = 0.01). PCA was conducted to select soil indicators to assess soil quality. A biomass model in relation to soil quality was constructed by linear function.

3. Results

3.1. Soil Physical, Chemical, and Biological Properties of Different Treatments

The soil physical property results show that CP and TTP are significantly higher in test groups then in CK, increasing by 11.5%~15.9% and 6.6%~10.5%, respectively (Table 3), while BD is significantly lower in test groups then in CK, decreasing by 5.3%~8.5%. In addition, there is no significant difference in MWC or NCP among different treatments. In summary, applying residues could change parts of soil physical properties, such as reducing BD and increasing CP and TTP. However, there are no significant differences in all soil physical properties among the four test groups. In addition, the Pearson correlation coefficient among five soil physical indicators ranges from −0.434 to 0.912 (Figure 2), There are significant negative correlations between BD and CP (−0.434) and TTP (−0.419); significant positive correlations between TTP and CP (0.912) and NCP (0.579); and there are no significant correlations (p > 0.05) between MWC and the other four indicators.
The soil chemical property results show that TN and TK are slightly higher in test groups then in CK, but there are no significant differences between them (Table 4). There are different degrees of differences in the other eight chemical indicators between the test groups and the CK. Among them, the pH is significantly lower in RT than in CK, with a difference of 4.2%. Then, SOM, AN, NN, and CEC are significantly higher in test groups then in CK, increasing by 16.3%~41.1%, 17.4%~26.0%, 10.5%~17.9%, and 21.2%~32.1%, respectively. In addition, AP and AK are significantly higher in RDT or RDS then in CK, RT, or RS. In summary, applying residues could effectively increase CEC and contents of available N, P, and K in soil.
In addition, the Pearson correlation coefficient among the ten soil chemical indicators ranges from −0.511 to 0.692 (Figure 2). There is a significant negative correlation between pH and AN (−0.511); significant positive correlations between SOM and AN (0.537), NN (0.521), AP (0.574), AK (0.639), and CEC (0.692); significant positive correlations between AN and NN (0.510) and CEC (0.434); significant positive correlations between NN and AP (0.387), AK (0.383), and CEC (0.596); significant positive correlations between AP and AK (0.497) and CEC (0.610); and significant positive correlation between AK and CEC (0.581). However, there are no significant correlations (p > 0.05) between TN or TP and the other nine indicators.
The soil biological property results show that, except for ACP and urease, the other six indicators are significantly higher in test groups then in CK, among which MBC, MBN, and MBP are higher by 18.7%~33.1%, 27.1%~43.1%, and 14.4%~18.4%, respectively, and catalase and sucrase are higher by 21.3%~39.6% and 11.3%~28.7%, respectively (Table 5). In addition, the MBC, MBN, MBP, and catalase of RT are higher than those of other treatment groups. The ACP, sucrase, and urease of RDT are the highest compared to other treatment groups. In summary, applying residues could effectively improve the microbial biomasses and its activities in surface soil. In addition, there are obvious correlations among seven soil biological indicators, and their Pearson correlation coefficients range from 0.206 to 0.684 (Figure 2). There are significant positive correlations between MBC and MBN (0.367), MBP (0.504), urease (0.369), and sucrase (0.406); significant positive correlations between MBN and MBP (0.597), catalase (0.684), urease (0.534), sucrase (0.524), and ACP (0.437); significant positive correlations between MBP and catalase (0.618), urease (0.408), and sucrase (0.486); significant positive correlations between catalase and sucrase (0.471); and significant positive correlations between urease and sucrase (0.683).

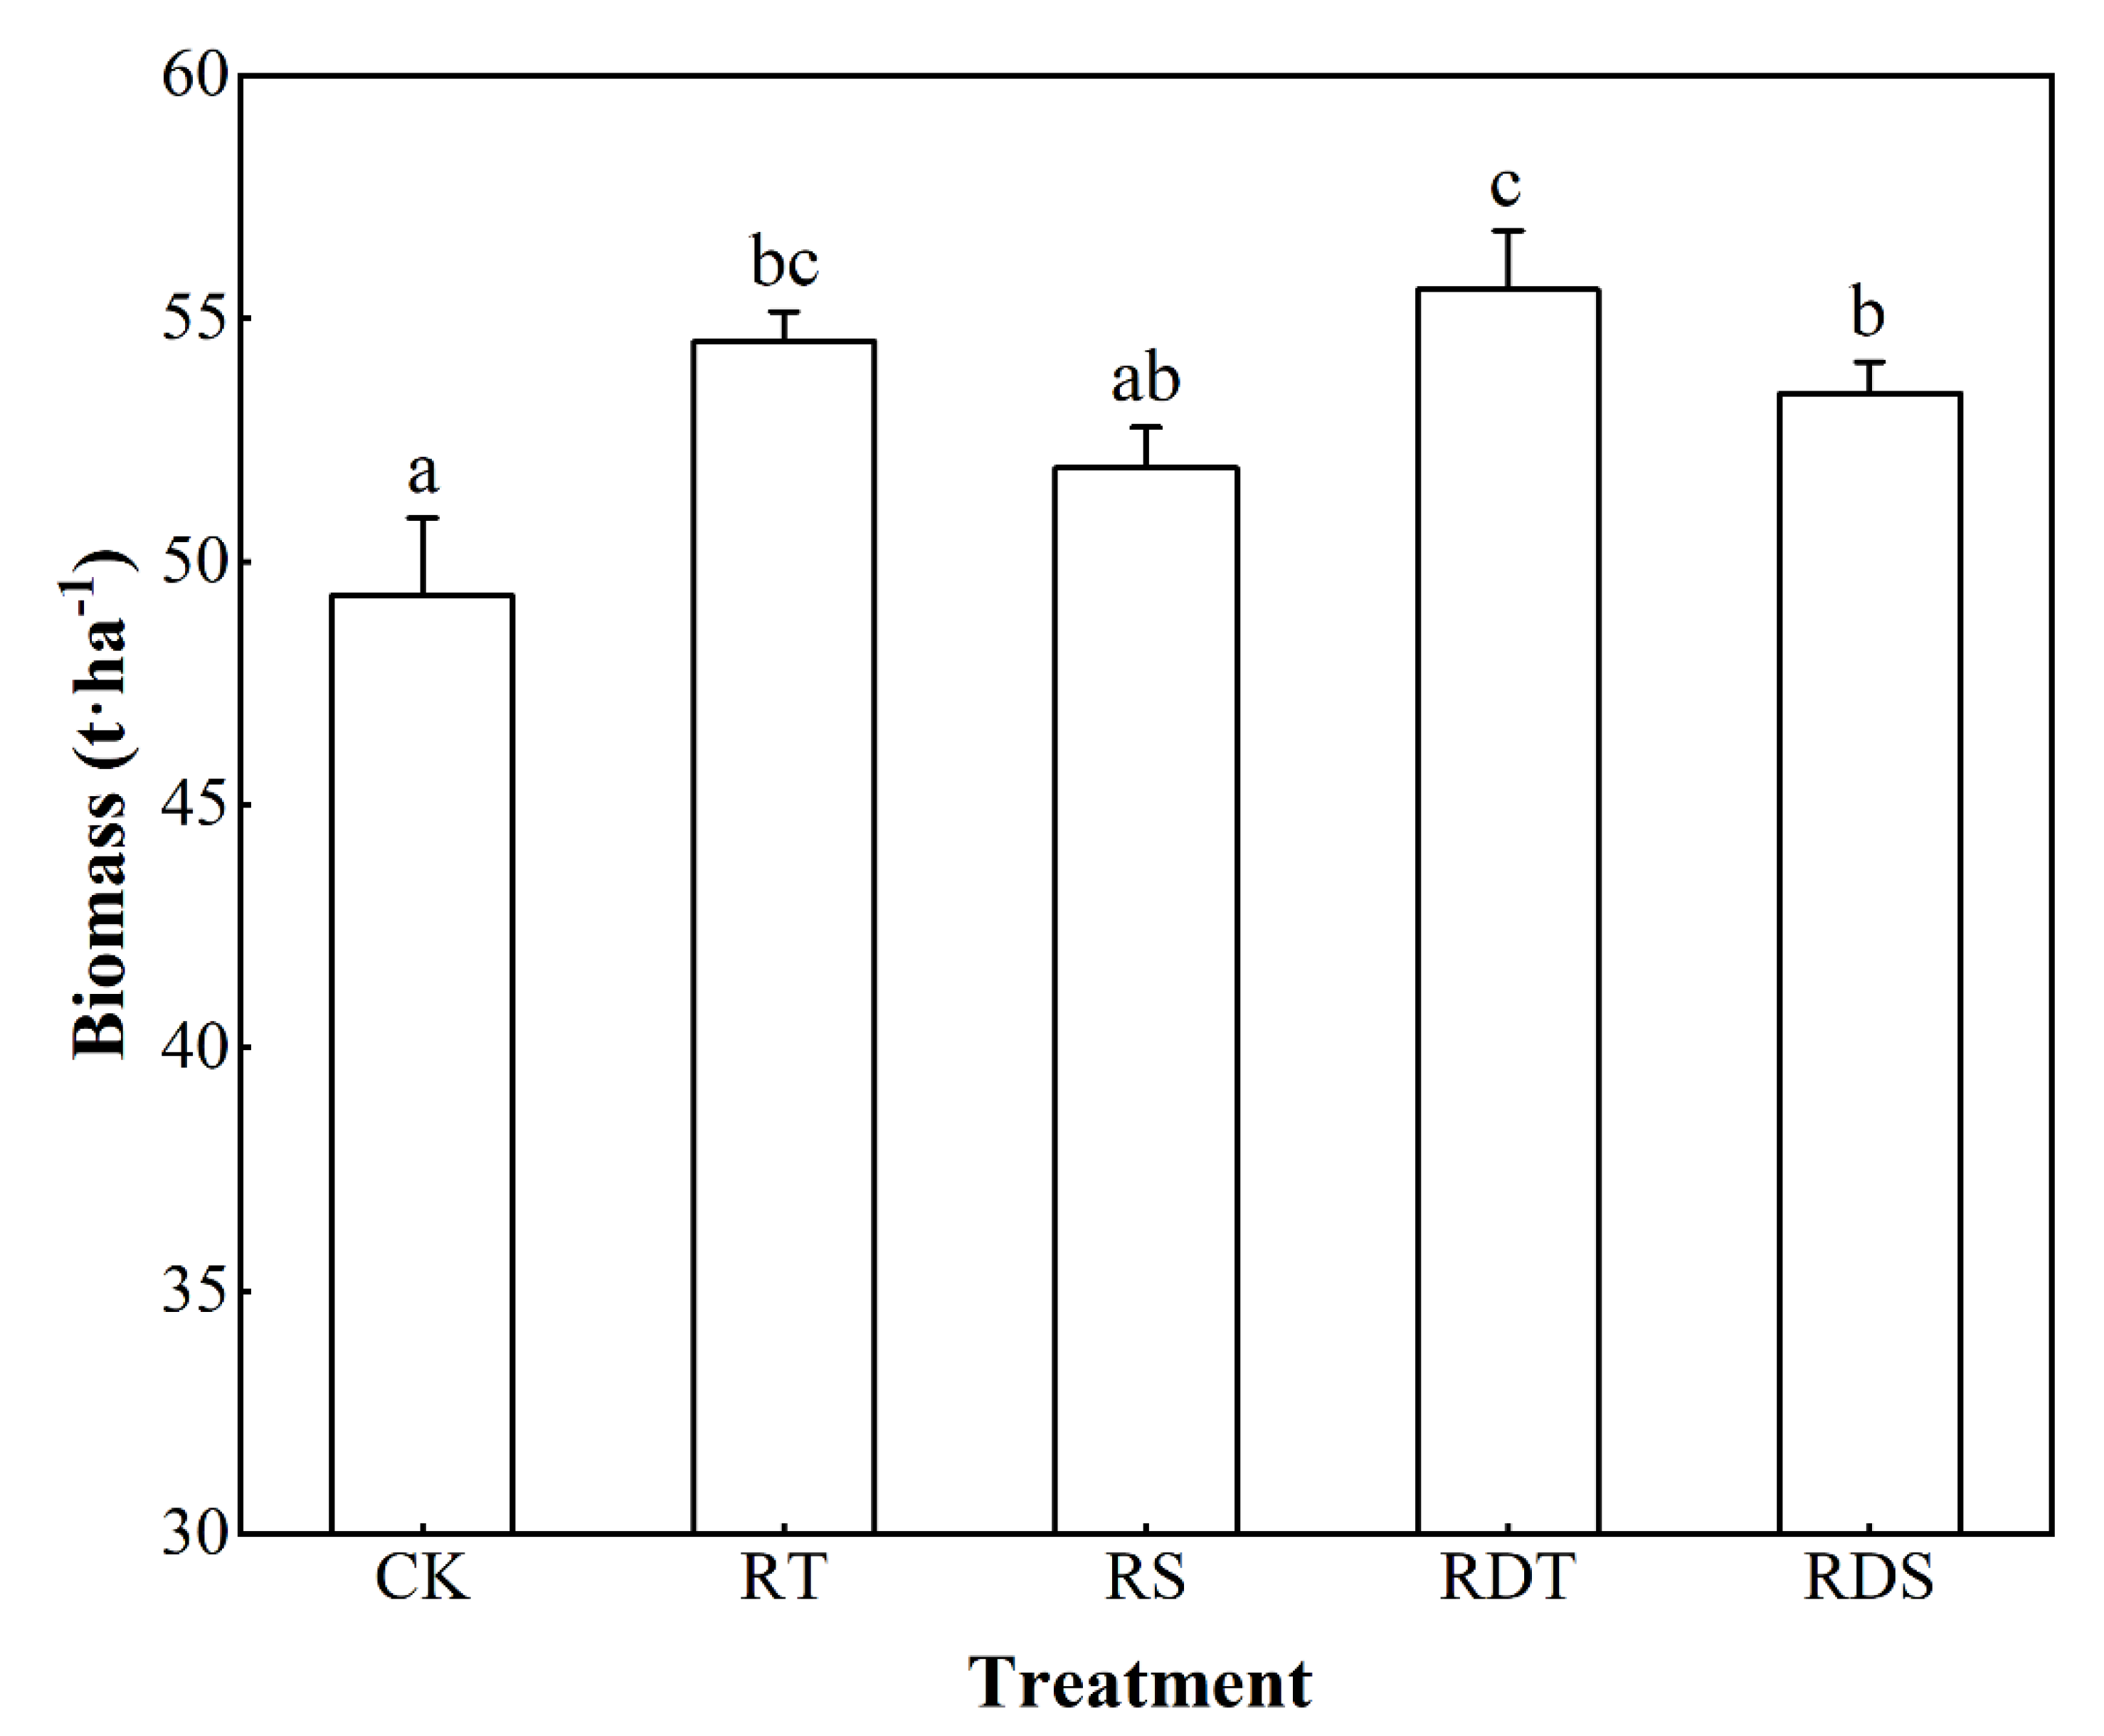
3.2. Biomasses of Melaleuca alternifolia of Different Treatments

The biomasses of Melaleuca alternifolia in four test groups are RDT (55.60 t·ha−1) > RT (54.53 t·ha−1) > RDS (53.47 t·ha−1) > RS (51.93 t·ha−1), and the biomass of CK is 49.31 t·ha−1 (Figure 3). Biomasses are significantly higher in RDT, RT, and RDS then in CK. To sum up, applying residues could increase the biomasses of Melaleuca alternifolia in different degrees in the test groups compared to the CK, and the increase range is from 5.3% to 12.8%.

3.3. Soil Quality Evaluation

3.3.1. Determining Indicators for IDS

According to the Pearson correlation coefficients between Melaleuca alternifolia biomass and all soil indicators (Figure 2), variables MWC, NCP, TN, TP, and TK are eliminated because they are not well-correlated with biomass, suggesting that the range of values for these indicators is insufficient to result in substantial differences in Melaleuca alternifolia growth. Based on the results of correlation analysis, we established an important data set (IDS) for soil quality evaluation, included BD, CP, TTP, pH, SOM, AN, NN, AP, AK, CEC, MBC, MBN, MBP, catalase, urease, sucrase, and ACP.

3.3.2. Determining Indicators for MDS

According to the PCA results of 17 indicators in IDS, 2 PCs are identified with eigenvalues > 1, and their cumulative variance contribution percent is 94.86% (Table 6). PC1 has three high-load indicators, including MBC, BD, and AN, which are highly correlated with each other, but their absolute values of correlation coefficients are all less than 0.7 (Figure 2), so MBC, BD, and AN are all selected for MDS. Similarly, PC2 has three high-load indicators, including AP, AK, and sucrase, which are highly correlated with each other, but their absolute values of correlation coefficients are all less than 0.7 (Figure 3), so AP, AK, and sucrase are all selected for MDS.

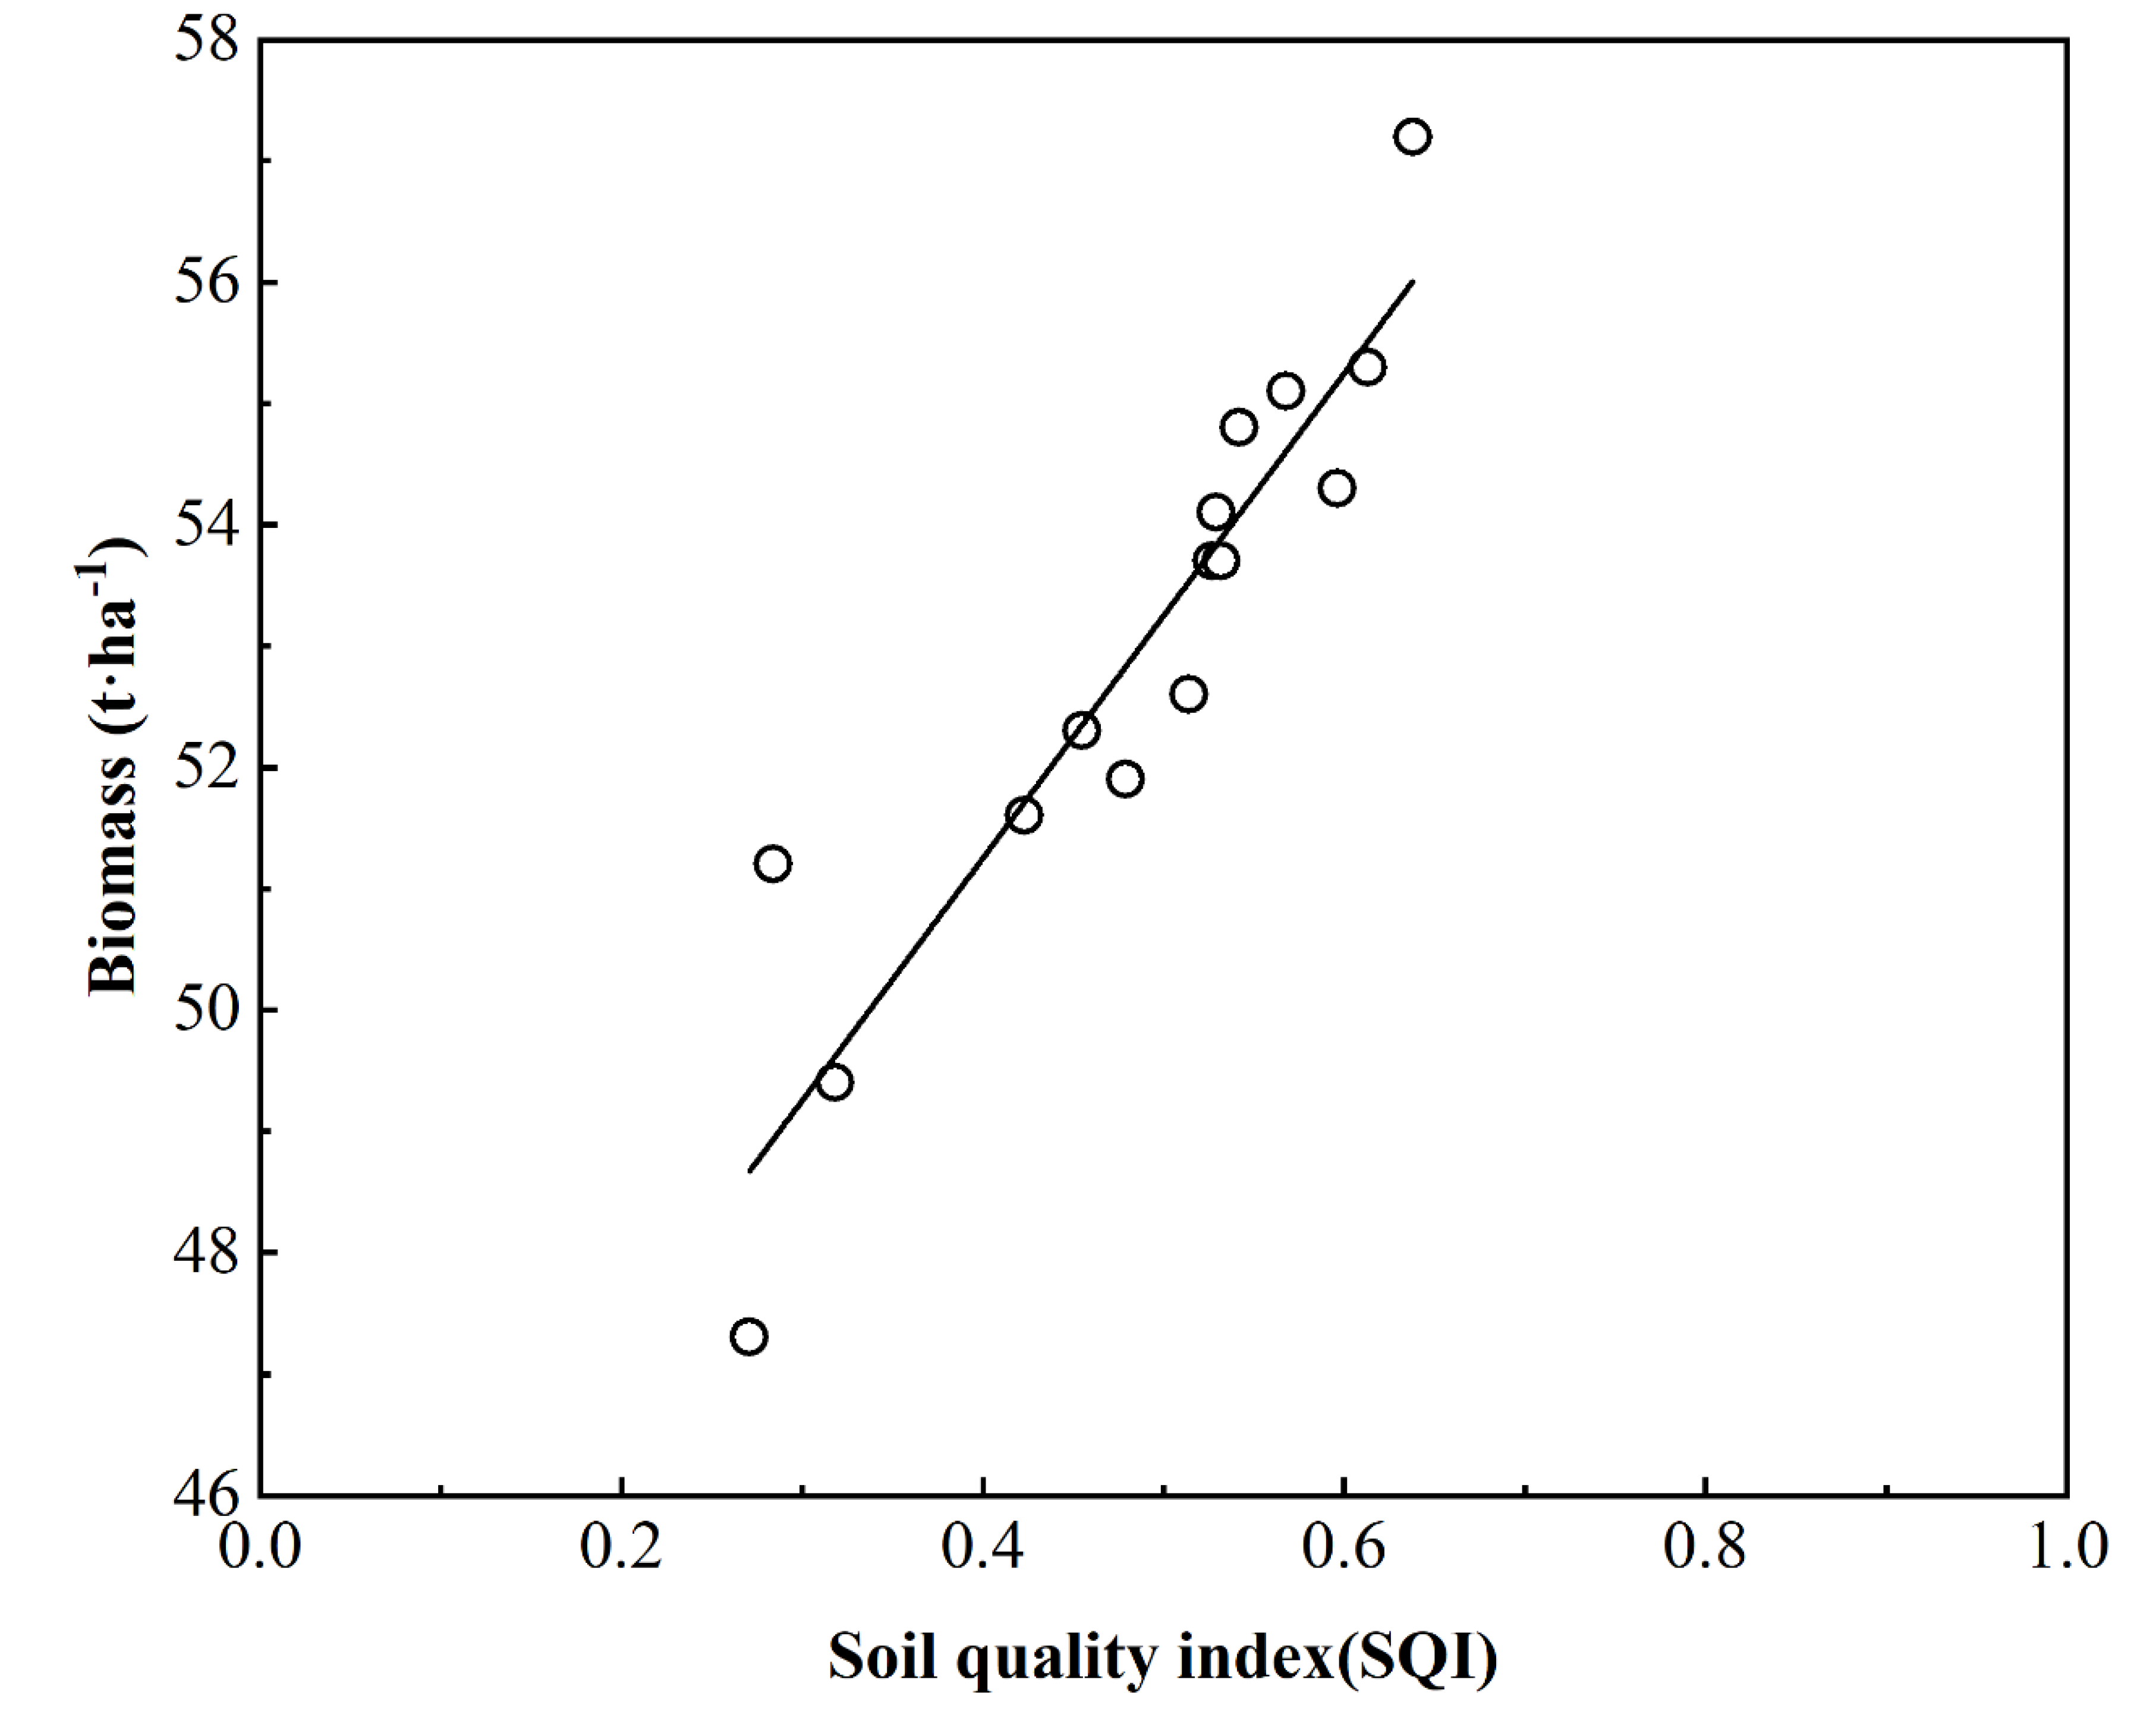
3.3.3. Calculating the SQI

Firstly, we performed another PCA with the indicators selected for MDS (MBC, BD, AN, AP, AK, and sucrase), and the communalities of these indicators are shown in Table 7. The weight of each indicator is equal to the ratio of its communality with the sum of communalities of all indicators in the MDS. The weights of these indicators are 0.173 (MBC), 0.157 (BD), 0.148 (AN), 0.172 (AP), 0.155 (AK), and 0.194 (sucrase) (Table 7).
Secondly, we used FMF to calculate the scores of indicators in MDS, in which BD was calculated by Equation (2) and other indicators were calculated by Equation (1).
Finally, the soil quality index was calculated by Equation (3). The soil quality index of 15 sample plots calculated in this study ranges from 0.271 to 0.638, with an average of 0.486 and a coefficient of variation of 23.0% (Figure 4). The soil quality indexes of the five treatments are RDT (0.616 ± 0.017) > RT (0.546 ± 0.017) > RDS (0.525 ± 0.008) > RS (0.452 ± 0.023) > CK (0.291 ± 0.020). Correlation analysis results show that soil quality index is significantly correlated with biomass, and this correlation can be described by the following linear equation (Equation (4)), and the biomass of Melaleuca alternifolia increases with the increase in soil quality index:
Y = 43.254 + 19.896X (n = 15, r = 0.864, p < 0.01)
where Y represents biomass of Melaleuca alternifolia (t·ha−1) and X represents SQI.

4. Discussion

In forest ecosystems without human interference, forest residues play an important role in maintaining the stability of forestland ecosystems and nutrient circulation [23]. However, eliminating forest residues reduces the quantity and quality of soil organic carbon [24], thus, changing soil properties, such as reducing soil water-holding capacity, microbial activity, CEC, and nutrient availability [23]. In this study, Melaleuca alternifolia residues provide carbon source for forest soil. The organic carbon in the surface soil increases by 16.3%~41.1%, while the microbial biomass carbon increases by 18.7%~33.1%. Long-term studies show that eliminating forest residues affects the nutrient supply, and at the same time, affects the growth of trees [25,26]. However, this effect may not be obvious in a short time. For example, at an Acacia mangium site in Sumatra, the removal of above-ground biomass reduced volume production by 18%~20%, compared to retaining them [27]. Similar results have been found with Acacia auriculiformis in south Vietnam [28]. In this study, the biomass of Melaleuca alternifolia increases by 5.3%~12.8% by applying residues (4 kg m−2). This is similar to the above research results.
A large amount of organic matter was taken away from Melaleuca alternifolia in the process of harvesting and management, which destroyed nutrient circulation and the stability of the plantation ecosystem, and resulted in the continuous decline in soil quality. Forest residues can reduce rainfall erosion and water soil loss when they are covered on the surface of the forestland soil [29,30]. Residues can also provide material and space for soil microbial reproduction [31], which is shown by the increase in MBC and MBN and the enhancement of sucrase and ureases activities, and the activities of microorganisms further promote the increase in available N, P, and K in soil. In this study, compared with CK, MBN of surface soil increases by 27.1%~43.1%, and AN, NN, AP, and AK increase by 17.4%~26.0%, 10.5%~17.9%, 7.0%~24.3%, and 2.3%~13.2%, respectively. In the process of forest residue decomposition, acidic organic matters are leached into the soil, which increases soil acidity and strengthens soil nitrification [32]. In this study, the pH decreases by 2.1%~4.2% in test groups compared to CK. All these are confirmed in this study.
The application modes of residues also has a certain influence on soil physical, chemical, and biological properties and soil quality. In this study, there are obvious differences between RT and RS, compared with RS. Contents of available nutrients (N, P, K), and microbial biomass and activity in RT increases. For example, AN, NN, AK, MBC, MBN, catalase, urease, and sucrase increase by 7.4%, 4.2%, 5.0%, 5.3%, 12.6%, 15.1%, 8.6%, and 8.2%, respectively. Studies show that RT could increase the contact area between residues and soil, which is beneficial to the reproduction of microorganisms and a series of biological and chemical processes [33]. However, with the decomposition of residues, the difference between RT and RS gradually narrows. Contents of available nutrients (N, P, K) are higher, and biomass and activity of microorganisms are lower in RDT than in RT; for example, NN, AP, and AK increase by 0.6%, 1.61%, and 5.1%, respectively, but MBC, MBN, and catalase reduce by 9.5%, 2.3%, and 3.6%, respectively. This is related to the decomposition process of residues. The decomposition rate of residues added with degradants is obviously accelerated in forestland environment [34]. Sun et al. showed that at the end of the 6 month tests, the degradation rate of cellulose by the mixed degradants of Peniophoraintranata and Sarocladiumstrictum reached 14.71%~21.68%, much higher than that of CK′s 5.02% [35]. At the time of soil property determination, the number of microorganisms had decreased, but available nutrients (N, P, K) were stored in surface soil.
There is no recognized indicator system for soil quality evaluation in China and abroad, and different indicator systems lead to different evaluation results [36]. We paid attention to the microorganism indicators especially, because they play an important role in the decomposition of residues. Therefore, five physical indicators, eleven chemical indicators, and seven biological indicators were selected for TDS, which restored the factors affecting soil quality as much as possible. By Pearson correlation analysis, five indicators that had no significant correlation (p > 0.05) with the biomass of Melaleuca alternifolia were excluded. Then, we further reduced the number of indicators by PCA, and only MBC, BD, AN, AP, AK, and sucrase were selected for MDS. We calculated scores of each indicator by FMF, and ignored the upper and lower thresholds of them, which had certain effects on the integrated score of each treatment, but had no effects on the final evaluation result, unless a non-linear function was used to calculate the scores of each indicator [21]. The correlation analysis between the integrated score and the biomass of Melaleuca alternifolia was a verification of the soil quality evaluation results.
Few studies reveal the relationship between forest biomass and forest soil quality, because trees have a long growth cycle. Some studies revealed the influence of land-use change on soil quality. For example, Islam et al. (2000) showed that the soil quality decreased by 44% after the tropical rain forest was converted into cultivated land, and the soil porosity, available N, labile C, and microbial biomass decreased significantly [37]. However, crop yield with short harvest cycle is easily related to soil quality. D′ Hose et al. (2014) show that crop yield is positively correlated with soil quality under fertilization conditions [38]. The cutting cycle of Melaleuca alternifolia is 3–5 years, and its management mode is more similar to that of crops. In this study, there is a significant linear relationship (r = 0.864, p < 0.01) between the biomass of Melaleuca alternifolia and the soil quality index, which also shows that increasing the biomass of Melaleuca alternifolia by improving the soil quality is an important idea in management.

5. Conclusions

Under the background of soil degradation caused by long-term planting of Melaleuca alternifolia, our research is an important attempt at further clarification. Under the test conditions, applying residues affects several physical and chemical properties, all biological properties, and soil quality index of Melaleuca alternifolia plantation. Compared with the CK, BD in the test groups decreases by 5.3%~8.5%; CP and TTP increase by 11.5%~15.9% and 6.6%~10.5%, respectively; SOM, AN, NN, and CEC increase by 16.3%~41.1%, 17.4%~26.0%, 10.5%~17.9%, and 21.2%~32.1% respectively. MBC, MBN, MBP, catalase, and sucrase increase by 18.7%~33.1%, 27.1%~43.1%, 14.4%~18.4%, 21.3%~39.6%, and 11.3%~28.7%, respectively, and the biomass increases by 5.3%~12.8%. Different treatment methods of residues have certain effects on soil quality and Melaleuca alternifolia biomass, tiling residues can make them fully contact with soil, and degradation agents can accelerate the decomposition of residues. Finally, the SQI of RDT is the highest (0.616), and there is a significant positive correlation between the biomass of Melaleuca alternifolia and soil quality index (r = 0.864, p < 0.01). During practical management, we should consider the cost, cutting cycle, and other factors comprehensively, and then choose treatment methods of residues reasonably, so as to promote the growth of Melaleuca alternifolia and maintain soil fertility.

Author Contributions

Research ideas and methods, H.L., J.C. and J.H.; experiments and data analysis, H.L. and J.C.; visualization, H.L. and J.C.; writing—original draft preparation, H.L.; writing—review and editing, J.H. and W.K. All authors have read and agreed to the published version of the manuscript.

Funding

This study was supported by the Key Projects of Hunan Science and Technology Department (grant number 2019NK3031).

Data Availability Statement

The datasets of this study are available from corresponding author.

Acknowledgments

We thank the other workers who helped this research from Central South University of Forestry and Technology.

Conflicts of Interest

The authors declare no conflict of interest.

References

  1. Carson, C.F.; Hammer, K.A.; Riley, T.V. Melaleuca alternifolia (tea tree) oil: A review of antimicrobial and other medicinal properties. Clin. Microbiol. Rev. 2006, 19, 50–62. [Google Scholar] [CrossRef] [PubMed] [Green Version]
  2. De Sá Silva, C.; De Figueiredo, H.M.; Stamford, T.L.M.; Da Silva, L.H.M. Inhibition of Listeria monocytogenes by Melaleuca alternifolia (tea tree) essential oil in ground beef. Int. J. Food Microbiol. 2019, 293, 79–86. [Google Scholar] [CrossRef] [PubMed]
  3. Aburjai, T.; Natsheh, F.M. Plants used in cosmetics. Phytother. Res. 2003, 17, 987–1000. [Google Scholar] [CrossRef] [PubMed]
  4. Garozzo, A.; Timpanaro, R.; Stivala, A.; Bisignano, G.; Castro, A. Activity of Melaleuca alternifolia (tea tree) oil on Influenza virus A/PR/8: Study on the mechanism of action. Antivir. Res. 2011, 89, 83–88. [Google Scholar] [CrossRef]
  5. Di Martile, M.; Garzoli, S.; Sabatino, M.; Valentini, E.; D’Aguanno, S.; Ragno, R.; Del Bufalo, D. Antitumor effect of Melaleuca alternifolia essential oil and its main component terpinen-4-ol in combination with target therapy in melanoma models. Cell Death Discov. 2021, 7, 127. [Google Scholar] [CrossRef]
  6. Zheng, H.; Ouyang, Z.Y.; Wang, X.K.; Miao, H.; Zhao, T.Q.; Peng, T.B. How different reforestation approaches affect red soil properties in southern China. Land Degrad. Dev. 2005, 16, 387–396. [Google Scholar] [CrossRef] [Green Version]
  7. Yu, K.; Yao, X.; Deng, Y.; Lai, Z.; Lin, L.; Liu, J. Effects of stand age on soil respiration in Pinus massoniana plantations in the hilly red soil region of Southern China. CATENA 2019, 178, 313–321. [Google Scholar] [CrossRef]
  8. Kumaraswamy, S.; Mendham, D.S.; Grove, T.S.; O’Connell, A.M.; Sankaran, K.V.; Rance, S.J. Harvest residue effects on soil organic matter, nutrients and microbial biomass in eucalypt plantations in Kerala, India. For. Ecol. Manag. 2014, 328, 140–149. [Google Scholar] [CrossRef]
  9. Mendham, D.S.; O’connell, A.M.; Grove, T.S.; Rance, S.J. Residue management effects on soil carbon and nutrient contents and growth of second rotation eucalypts. For. Ecol. Manag. 2003, 181, 357–372. [Google Scholar] [CrossRef]
  10. Sankaran, K.V.; Grove, T.S.; Kumaraswamy, S.; Manju, V.S.; Mendham, D.S.; Os’connell, A.M. Export of nutrients in plant biomass following harvest of eucalypt plantations in Kerala, India. J. Sustain. For. 2005, 20, 15–36. [Google Scholar] [CrossRef]
  11. Palviainen, M.; Finér, L.; Kurka, A.M.; Mannerkoski, H.; Piirainen, S.; Starr, M. Decomposition and nutrient release from logging residues after clear-cutting of mixed boreal forest. Plant Soil 2004, 263, 53–67. [Google Scholar] [CrossRef]
  12. Bargali, S.S.; Shukla, K.; Singh, L.; Ghosh, L.; Lakhera, M.L. Leaf litter decomposition and nutrient dynamics in four tree species of dry deciduous forest. Trop. Ecol. 2015, 56, 191–200. [Google Scholar]
  13. Hernández, J.; Del Pino, A.; Hitta, M.; Lorenzo, M. Management of forest harvest residues affects soil nutrient availability during reforestation of Eucalyptus grandis. Nutr. Cycl. Agroecosyst. 2016, 105, 141–155. [Google Scholar] [CrossRef]
  14. Nakajima, T.; Lal, R.; Jiang, S. Soil quality index of a crosby silt loam in central Ohio. Soil Tillage Res. 2015, 146, 323–328. [Google Scholar] [CrossRef]
  15. Muñoz-Rojas, M. Soil quality indicators: Critical tools in ecosystem restoration. Curr. Opin. Environ. Sci. Health 2018, 5, 47–52. [Google Scholar] [CrossRef]
  16. Kumar, N.; Singh, S.K.; Mishra, V.N.; Reddy, G.P.; Bajpai, R.K. Soil quality ranking of a small sample size using AHP. J. Soil Water Conserv. 2017, 16, 339–346. [Google Scholar] [CrossRef]
  17. Paul, G.C.; Saha, S.; Ghosh, K.G. Assessing the soil quality of Bansloi river basin, eastern India using soil-quality indices (SQIs) and Random Forest machine learning technique. Ecol. Indic. 2020, 118, 106804. [Google Scholar] [CrossRef]
  18. Şenol, H.; Alaboz, P.; Demir, S.; Dengiz, O. Computational intelligence applied to soil quality index using GIS and geostatistical approaches in semiarid ecosystem. Arab. J. Geosci. 2020, 13, 1235. [Google Scholar] [CrossRef]
  19. Liu, J.; Wu, L.; Chen, D.; Li, M.; Wei, C. Soil quality assessment of different Camellia oleifera stands in mid-subtropical China. Appl. Soil Ecol. 2017, 113, 29–35. [Google Scholar] [CrossRef]
  20. Li, P.; Zhang, T.; Wang, X.; Yu, D. Development of biological soil quality indicator system for subtropical China. Soil Tillage Res. 2013, 126, 112–118. [Google Scholar] [CrossRef]
  21. Chang, X.; Qiu, X.; Liu, X.; Peng, D.; Cheng, S. Soil fertility quality evaluation of pure and mixed Larix principis-rupprechtii forests in Saihanba, Hebei Province of northern China. J. Beijing For. Univ. 2021, 43, 50–59. [Google Scholar] [CrossRef]
  22. Pang, S.; Ou, Z.; Shen, W.; Hou, Y.; Huang, X.; Zheng, W. Edaphic characteristics of different regeneration patterns in karst mountainous areas of Guangxi. J. Cent. South Univ. For. Technol. 2016, 36, 60–66. [Google Scholar] [CrossRef]
  23. Rocha, J.H.T.; de Moraes Goncalves, J.L.; Brandani, C.B.; de Vicente Ferraz, A.; Franci, A.F.; Marques, E.R.G.; Junior, J.C.A.; Hubner, A. Forest residue removal decreases soil quality and affects wood productivity even with high rates of fertilizer application. For. Ecol. Manag. 2018, 430, 188–195. [Google Scholar] [CrossRef]
  24. Nambiar, E.K.S.; Harwood, C.E. Productivity of acacia and eucalypt plantations in Southeast Asia. 1. Bio-physical determinants of production: Opportunities and challenges. Int. For. Rev. 2014, 16, 225–248. [Google Scholar] [CrossRef]
  25. Achat, D.L.; Deleuze, C.; Landmann, G.; Pousse, N.; Ranger, J.; Augusto, L. Quantifying consequences of removing harvesting residues on forest soils and tree growth-A meta-analysis. For. Ecol. Manag. 2015, 348, 124–141. [Google Scholar] [CrossRef]
  26. Rocha, J.H.T.; de Moraes Gonçalves, J.L.; Gava, J.L.; de Oliveira Godinho, T.; Melo, E.A.; Bazani, J.H.; Hubner, A.; Junior, J.C.A.; Wichert, M.P. Forest residue maintenance increased the wood productivity of a Eucalyptus plantation over two short rotations. For. Ecol. Manag. 2016, 379, 1–10. [Google Scholar] [CrossRef]
  27. Hardiyanto, E.B.; Sadanandan Nambiar, E.K. Productivity of successive rotations of Acacia mangium plantations in Sumatra, Indonesia: Impacts of harvest and inter-rotation site management. New For. 2014, 45, 557–575. [Google Scholar] [CrossRef]
  28. Huong, V.D.; Nambiar, E.K.S.; Hai, N.X.; Ha, K.M.; Dang, N.V. Sustainable management of Acacia auriculiformis plantations for wood production over four successive rotations in South Vietnam. Forests 2020, 11, 550. [Google Scholar] [CrossRef]
  29. Prats, S.A.; Abrantes, J.R.; Crema, I.P.; Keizer, J.J.; de Lima, J.L. Runoff and soil erosion mitigation with sieved forest residue mulch strips under controlled laboratory conditions. For. Ecol. Manag. 2017, 396, 102–112. [Google Scholar] [CrossRef]
  30. Zhao, Y.; Cheng, J.; Wan, H.; Hu, X. Review of research on hydrological characteristics of forest litter. Sci. Soil Water Conserv. 2007, 5, 130–134. [Google Scholar] [CrossRef]
  31. Shao, S.; Zhao, Y.; Zhang, W.; Hu, G.; Xie, H.; Yan, J.; Han, S.; He, H.; Zhang, X. Linkage of microbial residue dynamics with soil organic carbon accumulation during subtropical forest succession. Soil Biol. Biochem. 2017, 114, 114–120. [Google Scholar] [CrossRef]
  32. He, Z.; Yu, Z.; Huang, Z.; Davis, M.; Yang, Y. Litter decomposition, residue chemistry and microbial community structure under two subtropical forest plantations: A reciprocal litter transplant study. Appl. Soil Ecol. 2016, 101, 84–92. [Google Scholar] [CrossRef]
  33. Maier, C.A.; Johnsen, K.H.; Dougherty, P.; McInnis, D.; Anderson, P.; Patterson, S. Effect of harvest residue management on tree productivity and carbon pools during early stand development in a loblolly pine plantation. For. Sci. 2012, 58, 430–445. [Google Scholar] [CrossRef]
  34. Wang, X.; Liu, Y.; Zhou, Y.; Wang, L.; Si, R.; Lu, J.; Jia, Z. Effects of different treatments on decomposition of Larix principis-rupprechtii tending residue. J. Beijing For. Univ. 2021, 43, 15–23. [Google Scholar] [CrossRef]
  35. Sun, S.; Fan, X.; Ning, J.; Di, X.; Yang, G. Forest surface fuel degradation by efficient cellulose-degrading fungi in field. J. Northeast For. Univ. 2020, 48, 61–65. [Google Scholar] [CrossRef]
  36. Qiu, X.; Peng, D.; Wang, H.; Wang, Z.; Cheng, S. Minimum data set for evaluation of stand density effects on soil quality in Larix principis-rupprechtii plantations in North China. Ecol. Indic. 2019, 103, 236–247. [Google Scholar] [CrossRef]
  37. Islam, K.R.; Weil, R.R. Land use effects on soil quality in a tropical forest ecosystem of Bangladesh. Agric. Ecosyst. Environ. 2000, 79, 9–16. [Google Scholar] [CrossRef]
  38. D’Hose, T.; Cougnon, M.; De Vliegher, A.; Vandecasteele, B.; Viaene, N.; Cornelis, W.; Bockstaele, E.V.; Reheul, D. The positive relationship between soil quality and crop production: A case study on the effect of farm compost application. Appl. Soil Ecol. 2014, 75, 189–198. [Google Scholar] [CrossRef]
Figure 1. Sample location of Melaleuca alternifolia in Ningyuan county.
Forests 13 02134 g001
Figure 2. Pearson correlation analysis between quality indicators and biomass of Melaleuca alternifolia.
Forests 13 02134 g002
Figure 3. Melaleuca alternifolia biomass of different treatment methods of residues. Notes: Different lowercase letters indicate significant differences among different treatments (one-way ANOVA, p < 0.05, n = 15).
Forests 13 02134 g003
Figure 4. Correlation between soil quality index and biomass of Melaleuca alternifolia.
Forests 13 02134 g004
Table 1. Contents of main nutrient elements in Melaleuca alternifolia residues.
ElementC/g·kg−1N/g·kg−1P/g·kg−1K/g·kg−1
Content468.3 ± 5.714.5 ± 1.360.21 ± 0.041.96 ± 0.25
Table 2. Determination methods of physical, chemical, and biological indicators of soil.
IndicatorMethodReference
Bulk density (BD, g·cm−3)
Mass water-holding capacity (MWC, g·kg−1)
Soil core methodLiu, J.; et al., 2017 [19]
Capillary porosity (CP, %)
Non-capillary porosity (NCP, %)
The total porosity (TTP, %)
Soil core immersion methodLiu, J.; et al., 2017 [19]
pHPotentiometry (soil: H2O = 1:2.5)Liu, J.; et al., 2017 [19]
Soil organic matter (SOM, g·kg−1)Potassium dichromate oxidationLi, P.; et al., 2013 [20]
Total nitrogen (TN, g·kg−1)Kjeldahl methodLi, P.; et al., 2013 [20]
Total phosphorus (TP, g·kg−1)HClO4 and HF digestion, acidic molybate–ascorbic acid blue color detectionLi, P.; et al., 2013 [20]
Total kalium (TK, g·kg−1)HClO4 and HF digestion, flame photometer detectionLi, P.; et al., 2013 [20]
Ammonia nitrogen (AN, mg·kg−1)Kcl leaching-indophenol blue colorimetric methodChang, X.; et al., 2021 [21]
Nitrate nitrogen (NN, mg·kg−1)Phenol disulfonic acid colorimetryChang, X.; et al., 2021 [21]
Available phosphorus (AP, mg·kg−1)Mehlich 3 methodLiu, J.; et al., 2017 [19]
Available kalium (AK, mg·kg−1)Mehlich 3 method and flame photometryLiu, J.; et al., 2017 [19]
Cation exchange capacity (CEC, cmol·kg−1)Ammonium acetate extractionLiu, J.; et al., 2017 [19]
Microbial biomass C (MBC, mg·kg−1)
Microbial biomass N (MBN, mg·kg−1)
Microbial biomass P (MBP, mg·kg−1)
Chloroform fumigating methodChang, X.; et al., 2021 [21]
Catalase (mg·kg−1·h−1)Potassium permanganate titrationChang, X.; et al., 2021 [21]
Urease (mg·kg−1·h−1)Phenol–sodium hypochlorite colorimetryChang, X.; et al., 2021 [21]
Sucrase (mg·kg−1·h−1)3,5-Dinitrosalicylic acid colorimetryChang, X.; et al., 2021 [21]
Acid phosphatase (ACP, mg·kg−1·h−1)Phosphoric acid–disodium benzene colorimetryChang, X.; et al., 2021 [21]
Table 3. Soil physical properties of different residue treatment methods.
IndicatorCKRTRSRDTRDS
BD1.254 ± 0.035 a1.148 ± 0.059 b1.185 ± 0.087 b1.188 ± 0.053 b1.201 ± 0.046 ab
MWC30.850 ± 2.421 a31.263 ± 1.996 a32.263 ± 2.938 a31.900 ± 2.314 a32.088 ± 1.890 a
CP29.775 ± 1.161 a34.513 ± 1.087 b33.200 ± 2.783 b34.425 ± 1.305 b33.638 ± 1.941 b
NCP21.088 ± 0.848 a21.400 ± 0.984 a21.02 5± 1.072 a21.763 ± 1.046 a21.150 ± 1.870 a
TTP50.863 ± 1.787 a55.913 ± 1.742 b54.225 ± 2.792 b56.188 ± 1.924 b54.788 ± 2.962 b
Notes: Values are means ± standard deviation. Different lowercase letters indicate significant differences among different treatments (one-way ANOVA, p < 0.05, n = 15).
Table 4. Soil chemical properties of different residue treatment methods.
IndicatorCKRTRSRDTRDS
pH4.606 ± 0.105 a4.414 ± 0.068 b4.505 ± 0.109 ab4.509 ± 0.131 ab4.496 ± 0.146 ab
SOM13.563 ± 1.280 a17.863 ± 0.818 c15.775 ± 1.146 b19.138 ± 1.460 c18.608 ± 1.385 c
TN1.545 ± 0.066 a1.574 ± 0.094 a1.559 ± 0.080 a1.594 ± 0.071 a1.578 ± 0.117 a
TP0.497 ± 0.012 a0.499 ± 0.014 ab0.515 ± 0.015 b0.508 ± 0.017 ab0.504 ± 0.015 ab
TK11.400 ± 0.904 a11.763 ± 1.043 a11.438 ± 0.676 a11.950 ± 1.048 a11.713 ± 0.732 a
AN12.525 ± 1.158 a15.788 ± 1.095 b14.703 ± 1.138 b15.063 ± 0.862 b15.213 ± 1.025 b
NN4.916 ± 0.154 a5.656 ± 0.373 b5.430 ± 0.223 b5.689 ± 0.589 b5.795 ± 0.368 b
AP4.676 ± 0.144 a5.004 ± 0.210 ab5.014 ± 0.399 b5.811 ± 0.296 c5.755 ± 0.408 c
AK67.475 ± 3.197 a72.663 ± 5.351 b69.225 ± 3.28 ab76.363 ± 5.146 c76.038 ± 3.189 c
CEC13.525 ± 0.877 a16.388 ± 0.660 b16.463 ± 1.150 b17.863 ± 0.841 c16.875 ± 0.835 b
Notes: Values are means ± standard deviation. Different lowercase letters indicate significant differences among different treatments (one-way ANOVA, p < 0.05, n = 15).
Table 5. Soil biological properties of different residue treatment methods.
IndicatorCKRTRSRDTRDS
MBC143.63 ± 10.02 a191.13 ± 13.59 c181.5 ± 27.28 bc173.27 ± 13.48 b170.50 ± 7.55 b
MBN9.413 ± 0.755 a13.452 ± 0.738 c11.951 ± 1.207 b13.14 ± 0.911 bc12.82 ± 1.793 bc
MBP22.171 ± 1.547 a26.263 ± 0.901 b25.382 ± 1.829 b26.049 ± 0.898 b25.630 ± 1.195 b
Catalase1.538 ± 0.089 a2.148 ± 0.100 c1.866 ± 0.195 b2.071 ± 0.147 c1.999 ± 0.234 bc
Urease0.216 ± 0.014 a0.241 ± 0.014 c0.222 ± 0.013 ab0.246 ± 0.010 c0.235 ± 0.021 bc
Sucrase19.91 ± 1.177 a23.99 ± 1.211 c22.16 ± 1.902 b25.63 ± 1.630 c25.61 ± 2.141 c
ACP1.985 ± 0.124 a2.138 ± 0.110 ab2.111 ± 0.151 ab2.220 ± 0.155 b2.160 ± 0.189 b
Notes: Values are means ± standard deviation. Different lowercase letters indicate significant differences among different treatments (one-way ANOVA, p < 0.05, n = 15).
Table 6. Results of principal component analysis of soil quality indicators in IDS.
PCPC1PC2
Eigenvalue13.5071.963
Percent71.3223.54
Cumulative percent71.3294.86
Eigenvector
MBC0.9730.185
BD−0.973−0.222
AN−0.949−0.238
pH0.8440.520
MBP0.8020.585
Catalase0.7910.601
CP0.7890.609
MBN0.7740.632
TTP0.7500.646
AP0.0560.989
AK0.2490.955
Sucrase0.4100.904
SOM0.4890.867
ACP0.5090.838
CEC0.5530.779
NN0.6150.760
Urease0.5330.752
Table 7. Communality and weight of soil quality indicators in MDS.
IndicatorCommunalityWeight
MBC0.7390.173
BD0.6730.157
AN0.6330.148
AP0.7350.172
AK0.6640.155
Sucrase0.8310.194
Publisher’s Note: MDPI stays neutral with regard to jurisdictional claims in published maps and institutional affiliations.

