Abstract
The determination of plywood bonding quality by shear testing is one of the most commonly used and informative tests, alongside bending strength, to characterise this compound material. Two types of birch plywood were studied: indoor use (class 1), thickness 18 mm, urea-formaldehyde glue; and exposed outdoor use (class 3), thickness 15 mm, phenolic formaldehyde glue. The corresponding pre-treatments indicated in standards UNE-EN 314-1 and -2 were applied to each type. To test the suitability of the method, the technique of digital image correlation (DIC) was used to obtain information about the complex modes of fracture present in compound materials such as plywood. Assessing the results based on the statistical extreme value theory provided more reliable and robust information about the failure strength values for low failure probabilities. The results confirm that DIC can be used to determine the true distribution of the deformations during the fracture process and, therefore, it provides greater knowledge of the details of the failure process. Statistical evaluation of the experimental data obtained with DIC indicates that test results exceeding the time limit of 30 ± 10 s should be evaluated, contrary to the operating procedure in standard UNE-EN 314-1, which states that they are invalid.
1. Introduction
From 2015 to 2019, the mean annual production of plywood worldwide was around 110 million m3 (Mm3). With a production of 55.5 Mm3 in 2019, China is the world’s primary producer, followed by the United States (9.9 Mm3). In Spain, plywood production in 2019 was 0.5 Mm3 [1,2,3]. Used mainly in construction, packaging and furniture manufacturing, plywood is mechanically characterised in the factory through in-house monitoring and at external laboratories, in both cases following the test protocols and specifications in force [4,5,6,7,8,9,10]. Bonding strength tests on compound materials (glue + wood) and the orthotropic nature of these materials provide information about board quality.
The mechanical characterisation of materials in general, and of plywood in particular, is a decisive factor in choosing an appropriate construction material. Characterisation consists of determining the parameters that define the mechanical behaviour of the material through tests in which the material is subjected to various loads. Tests are generally performed to experimentally determine the relationship the material exhibits between applied forces and displacements or between applied stresses and strains.
Among the optical measuring solutions available, digital image correlation (DIC) applications are experiencing spectacular advances in the experimental determination of displacements and deformations, both as an additional technique applicable to material characterisation and for measuring these magnitudes in all kinds of tests and processes, including farming and industry [11,12,13].
The DIC technique has been applied in wood to determine deformation under physical or mechanical loading. For physical loading, Kang et al. [14,15], Peng et al. [16], Lanvermann et al. [17] and García et al. [18] used it to measure moisture-induced and shrinkage deformations in drying wood, while Oscarsson et al. [19] applied it to assess the distribution of deformations around knots after consecutive load/unload cycles. For mechanical loading, Villarino et al. [20] correlated the Young’s modulus evolution of Pinus halepensis wood under compression with the microstructural behaviour observed after breakage, and Li et al. [21] analysed the influence of wood type (early- and latewood) and relative humidity on the bonding strength and strain distribution of glued wood, observing either glue line or early wood failures.
Using the photogrammetry-based method of DIC, the evolution of full-field 3D displacements and deformations in the space observed throughout the test chosen for the test piece or component can be recorded, unlike the limited information about in-plane deformation obtained by extensometry [22,23,24]. The required displacement and strain information can therefore be selected as necessary when analysing the test results, making DIC an exceptionally versatile technique. The superiority of DIC over other techniques is obvious. It incorporates the basic concept of speckle interferometry [25,26], ensuring a sufficiently high level of accuracy typical of optical techniques, in accordance with the phenomenon and the size of the component observed.
Applying photogrammetric DIC is simpler than working with interferometric techniques, in particular using the GOM Aramis software [27]. This makes DIC a very attractive tool both in laboratory research applications and industry, at any scale, from micrometres to metres. These attributes are particularly useful for analysing fractures in composite materials such as plywood panels, whose complex forms of failure are difficult, if not impossible, to view and quantify.
The technique is of special interest because it can be used to determine the suitability of results when calculating stresses and strains using advanced numerical simulation methods, such as finite element programmes, especially in situations where numerical modelling is complex.
The objectives of this study are: (i) To use DIC and its practical application in deformation measurement for shear fracture characterisation of class 1 (indoor use) and class 3 (outdoor use) birch plywood according to UNE-EN 314 standards [4,5], with regard to bonding quality. (ii) To assess the use of this technique to characterise wood properties and its potential in determining and interpreting the fracture phenomena that occur in standard wood tests. In particular, the aim is to increase understanding of the technique and improve possible fracture models, beyond simple non-critical application of standards, and to discuss the possible limitations of the standards in their current wording, especially with regard to the test time limit. (iii) To evaluate photogrammetric DIC as a complementary or alternative experimental technique to numerical techniques.
2. Materials and Methods
2.1. Bonding Quality Tests
For the bonding quality tests, the standards UNE-EN 314-1 and -2 were applied [4,5]. A sample of 70 test pieces of each panel was used; i.e., 70 for the 15 mm outdoor panel and 70 for the 18 mm indoor panel, grouped in lots of 10 test pieces.
Density and moisture content of the test pieces were determined using standards UNE-EN 323 [10] and UNE-EN 322 [9], respectively. Six test pieces were taken from the total sample and conditioned in a hygrothermal chamber at 20 ± 2 °C and 65 ± 5% relative humidity to constant weight, providing the results shown in Table 1.

Table 1.
Panel moisture content and density after conditioning.
The other test pieces were kept aside until the required test pre-treatments, following standard UNE-EN 314-1 [4].
The number of test pieces chosen corresponds to the minimum of 10 valid results required at the end of the process for each panel type and treatment, following standard UNE-EN 314-1 [4].
2.2. Types of Pre-Treatment
The test requires a series of pre-treatments, in accordance with standard UNE-EN 314-2 [5]. Pre-treatment A was applied to the plywood for indoor use, and pre-treatments A and B were applied to the plywood for exposed outdoor use. Pre-treatment A, according to standard UNE-EN 314-1, Section 5.1.1, comprises immersion of test pieces in water at 20 ± 3 °C for 24 h. This pre-treatment was applied to all class 1 test pieces, but only a few lots of pre-treated class 3 test pieces were tested. Pre-treatment B, according to standard UNE-EN 314-1, Section 5.1.3, comprises initial immersion of test pieces in boiling water for 4 h, drying in a forced ventilation oven for 16 h to 20 h at 60 ± 3 °C, a second immersion in boiling water for 4 h and finally cooling in water at 20 ± 3 °C for at least 1 h. This pre-treatment was applied to three lots of class 3 test pieces. The types and number of tests performed for each panel type are shown in Table 2. The terms “No fracture” and “Exceed time” refer, respectively, to the number of pieces showing no failure and the number exceeding the time limit of 30 ± 10 s specified in UNE-EN 314-1, according to which these test results are invalid.
Table 2.
Pre-treatment applied, according to standard UNE-EN 314-1, and number of tests performed for each panel type.
In both pre-treatments with immersion in water, the test pieces were placed in a metal basket to ensure that all pieces remained submerged in the water throughout the test and were well separated.
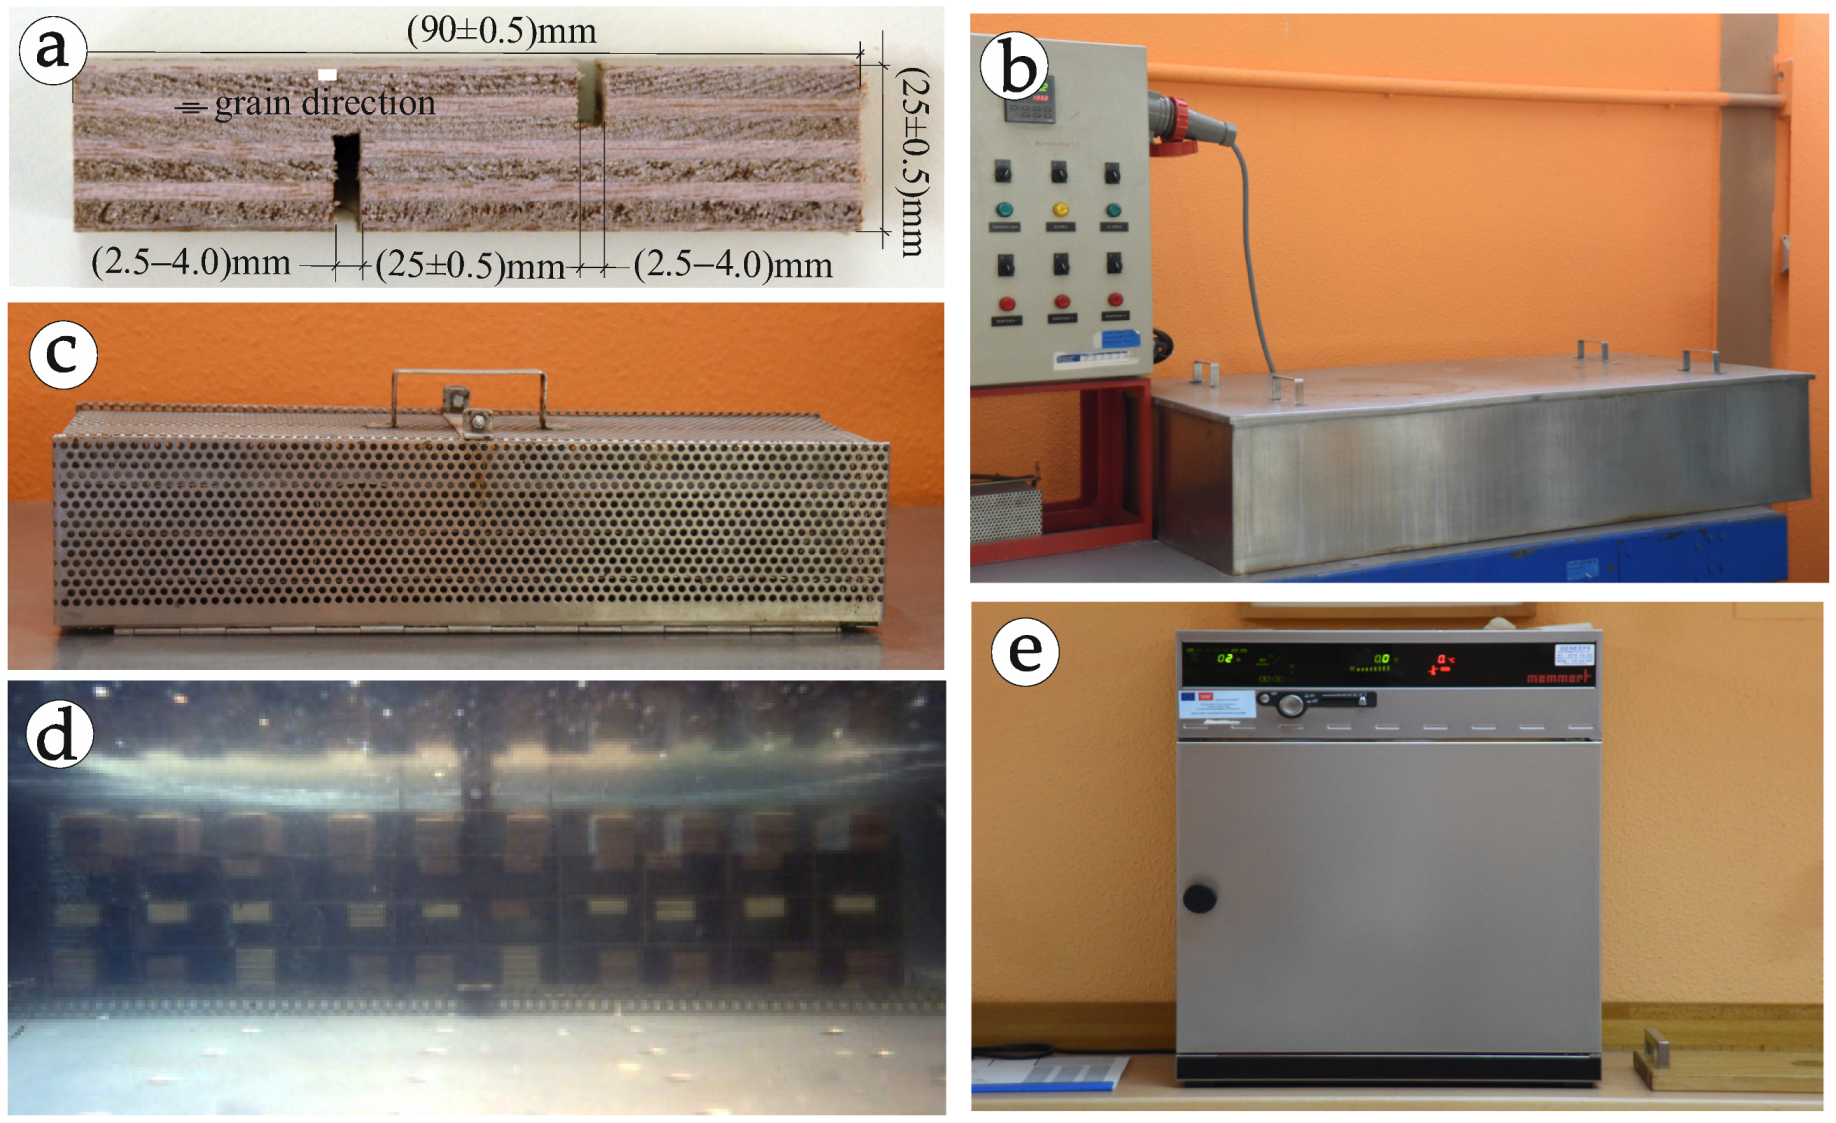
The immersion and boiling pre-treatments were performed in a stainless steel heated container with an accuracy of ±1 °C (Figure 1).
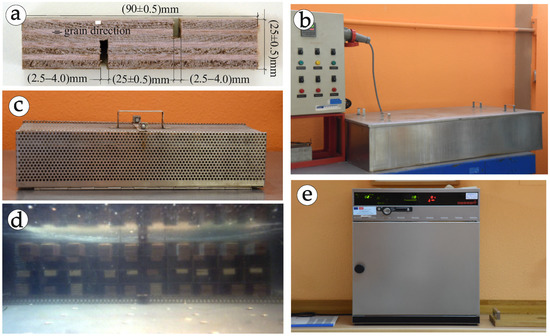
Figure 1.
(a) Test piece; (b) water bath; (c) immersion cage; (d) test pieces in the water bath; (e) oven.
2.3. DIC Device
The DIC measurements were made using the Aramis 3D 5M device by the company GOM (Carl Zeiss GOM Metrology GmbH, Braunschweig, Germany) (Figure 2). Used in full-field and local measurements, this high-resolution 3D camera system is equipped with two 5-megapixel cameras that provide high spatial resolution for determining the strain distribution and local stress effects in large measuring areas using strain measurements.
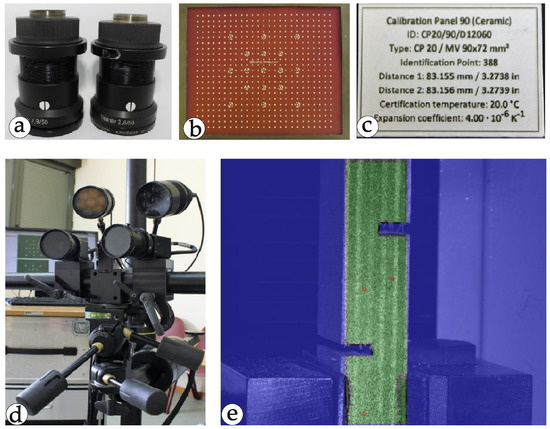
Figure 2.
DIC Aramis 3D 5M device, by GOM, at the Strength of Materials Laboratory, University of Oviedo, used for the study: (a) 50 mm lenses; (b) 90 × 72 calibration panel; (c) specifications of the calibration panel; (d) camera system; (e) mask used in the DIC measurements.
The basic principle of DIC is identifying the same points (or pixels) between two images captured before and after the load process to deduce the strain generated (see Sutton et al. [28]). After defining the area of interest or test area, divided in turn into evenly distributed virtual grids or subsets, the displacement map of each point of the subsets is plotted to obtain the full-field of strains (see Pan et al. [11]).
50 mm lenses were used based on the dimensions of the recording zone on the test pieces and the areas of interest; i.e., the areas where the stresses and strains caused by the fracture are generated.
The calibration panel chosen was CQ/CP20 90 × 72, which has a grid of 525 points in a 21 × 25 matrix. The central area has 17 main calibration markers (Figure 2b). The measurements between these points, known as and , have an accuracy of microns with a 95% uncertainty of measurement of:
Therefore, the measurements expressed according to the GOM Aramis User Manual [25] are:
The calibration markers are recognised by the software during the calibration process, enabling recognition of the theoretical positions of the other points in the panel.
After defining the test area and matching the field of observation to the area of the test piece, masks were applied to exclude conflictive areas such as edges or holes that could lead to error due to the different perspective relative to the cameras (Figure 2d).
A start point was defined, representing the start point of the coordinates relative to the test piece, on which the software establishes the bases for calculating the 3D model. This point is indicated in the first image taken on the left, and the programme can locate it through DUC in the image on the right. The programme then automatically identifies the other points. Because the piece is fractured in this type of testing, breaking into two parts, it was necessary to define two start points (one in each sector) to ensure image correlation in the whole piece throughout the test.
The recording speed was one image per second, which allows the magnitude to be recorded without loss of quality in the measurement of local deformations.
2.4. Test Equipment
The test pieces were tested using an MTS SYNERGIE testing machine (MTS System Corporation, Eden Prairie, MN, USA), by Material Test Systems (MTS), with a load capacity of 5 kN (Figure 3).
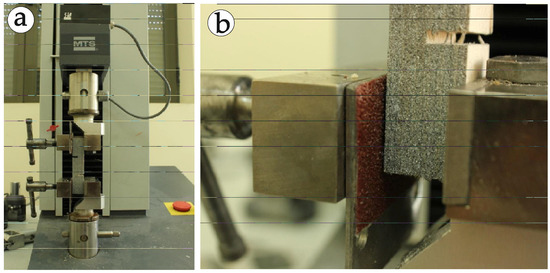
Figure 3.
(a) Testing machine; (b) test piece clamp.
To improve the clamping of the water-saturated test pieces during testing, pieces of 40 grain sandpaper were attached to the clamp grips with cyanoacrylate adhesive.
2.5. Statistical Analysis
The statistical extreme value theory [29,30] was applied. This theory states that behaviour in the tails of any type of distribution tends asymptotically to three unique types of distributions—Weibull, Gumbel and Fréchet—which, depending on the nature of the problem in hand, can be identified by their characteristics as maximum or minimum phenomena. When material strengths are concerned, minimum functions are the suitable option, but when studying load actions, the corresponding maximum families must be chosen.
Designing components based on the theory of ultimate limit states requires determination of low probabilities of failure. Consequently, the usual procedure, focusing on central failure probability values derived from the mean value and standard deviation of the distributions, is not recommended. Instead, a non-standard, more realistic and rigorous assessment is proposed, based on statistical extreme value theory. The design of real mechanical and structural components must ensure low probabilities of failure, e.g., 5 or 1% or even lower. However, the estimation of low probabilities cannot be guaranteed if the available number of tests is limited, which means that the low tail failure percentiles must be obtained by extrapolation from the central values of the distribution. Therefore, an assessment to the method recommended by the UNE-EN 314 standards [4,5] including results from tests exceeding time limit value was also performed.
The suitability of the Weibull minimum distribution is ensured when applied to evaluate the minimum strength of wood regardless of the theoretical distribution of the minimum strengths in the wood, because it represents the domain of attraction for minima when the distribution (as here, when the strength is involved) must have a lower limit, although not necessarily zero.
Obviously, it is not logical to disregard the fact that strengths also present a finite upper limit, which would justify, alternatively, the choice of a maximum Weibull distribution. Nevertheless, a possible better definition of the upper tail of the failure distribution is irrelevant because, from the design viewpoint, only the lower tail of the strength distribution is of interest. Adopting a two-parameter Gumbel distribution allows the restrictions about the lower and upper bounds to be disregarded in the definition of the three-parameter Weibull strength distribution. This is justified when the shape Weibull parameter has a value higher than 6 (see Castillo et al. [29,30]).
3. Results
The results obtained by the Aramis equipment were stored in .txt format and comprised time, force, strain and displacement values.
In all samples, the apparent cohesive wood failure percentage was determined, and the mean value (RMv,med) was calculated. The shear strength of each test was calculated (fv) from the arithmetic mean fv,med and the recorded minimum value fv,min, which together define the lower range of the variations. Table 3, Table 4 and Table 5, present the results obtained with the Aramis equipment, the statistical values and the apparent cohesive wood failure percentages in the shear tests, respectively, for the 15 mm panel, class 3 (outdoor), pre-treatment A. The outcomes for the 15 mm panel, class 3 (outdoor), pre-treatment B, are shown in Table 6, Table 7 and Table 8. Finally, Table 9, Table 10 and Table 11 summarize the corresponding outcomes for the 18 mm panel, class 1 (indoor), pre-treatment A. The results were stored in .txt format and comprised time, force, strain and displacement values.
Table 3.
Results for the 15 mm panel, class 3 (outdoor), pre-treatment A.
Table 4.
Statistical values for the 15 mm panel, class 3 (outdoor), pre-treatment A.
Table 5.
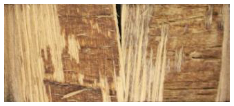
Apparent cohesive wood failure percentage after shear test on the 15 mm panel, class 3 (outdoor), pre-treatment A.
Table 6.
Results for the 15 mm panel, class 3 (outdoor), pre-treatment B.
Table 7.
Statistical values for the 15 mm panel, class 3 (outdoor), pre-treatment B.
Table 8.
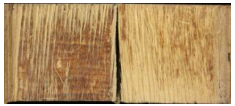
Apparent cohesive wood failure percentage after shear test on the 15 mm panel, class 3 (outdoor), pre-treatment B.
Table 9.
Results for the 18 mm panel, class 1 (indoor), pre-treatment A.
Table 10.
Statistical values for the 18 mm panel, class 1 (interior), pre-treatment A.
Table 11.
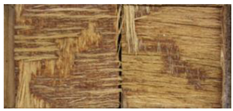
Apparent cohesive wood failure percentage after shear test on the 18 mm panel, class 1 (indoor), pre-treatment A.
4. Discussion
4.1. 15 mm Panel, Class 3 (Outdoor), with Pre-Treatment A
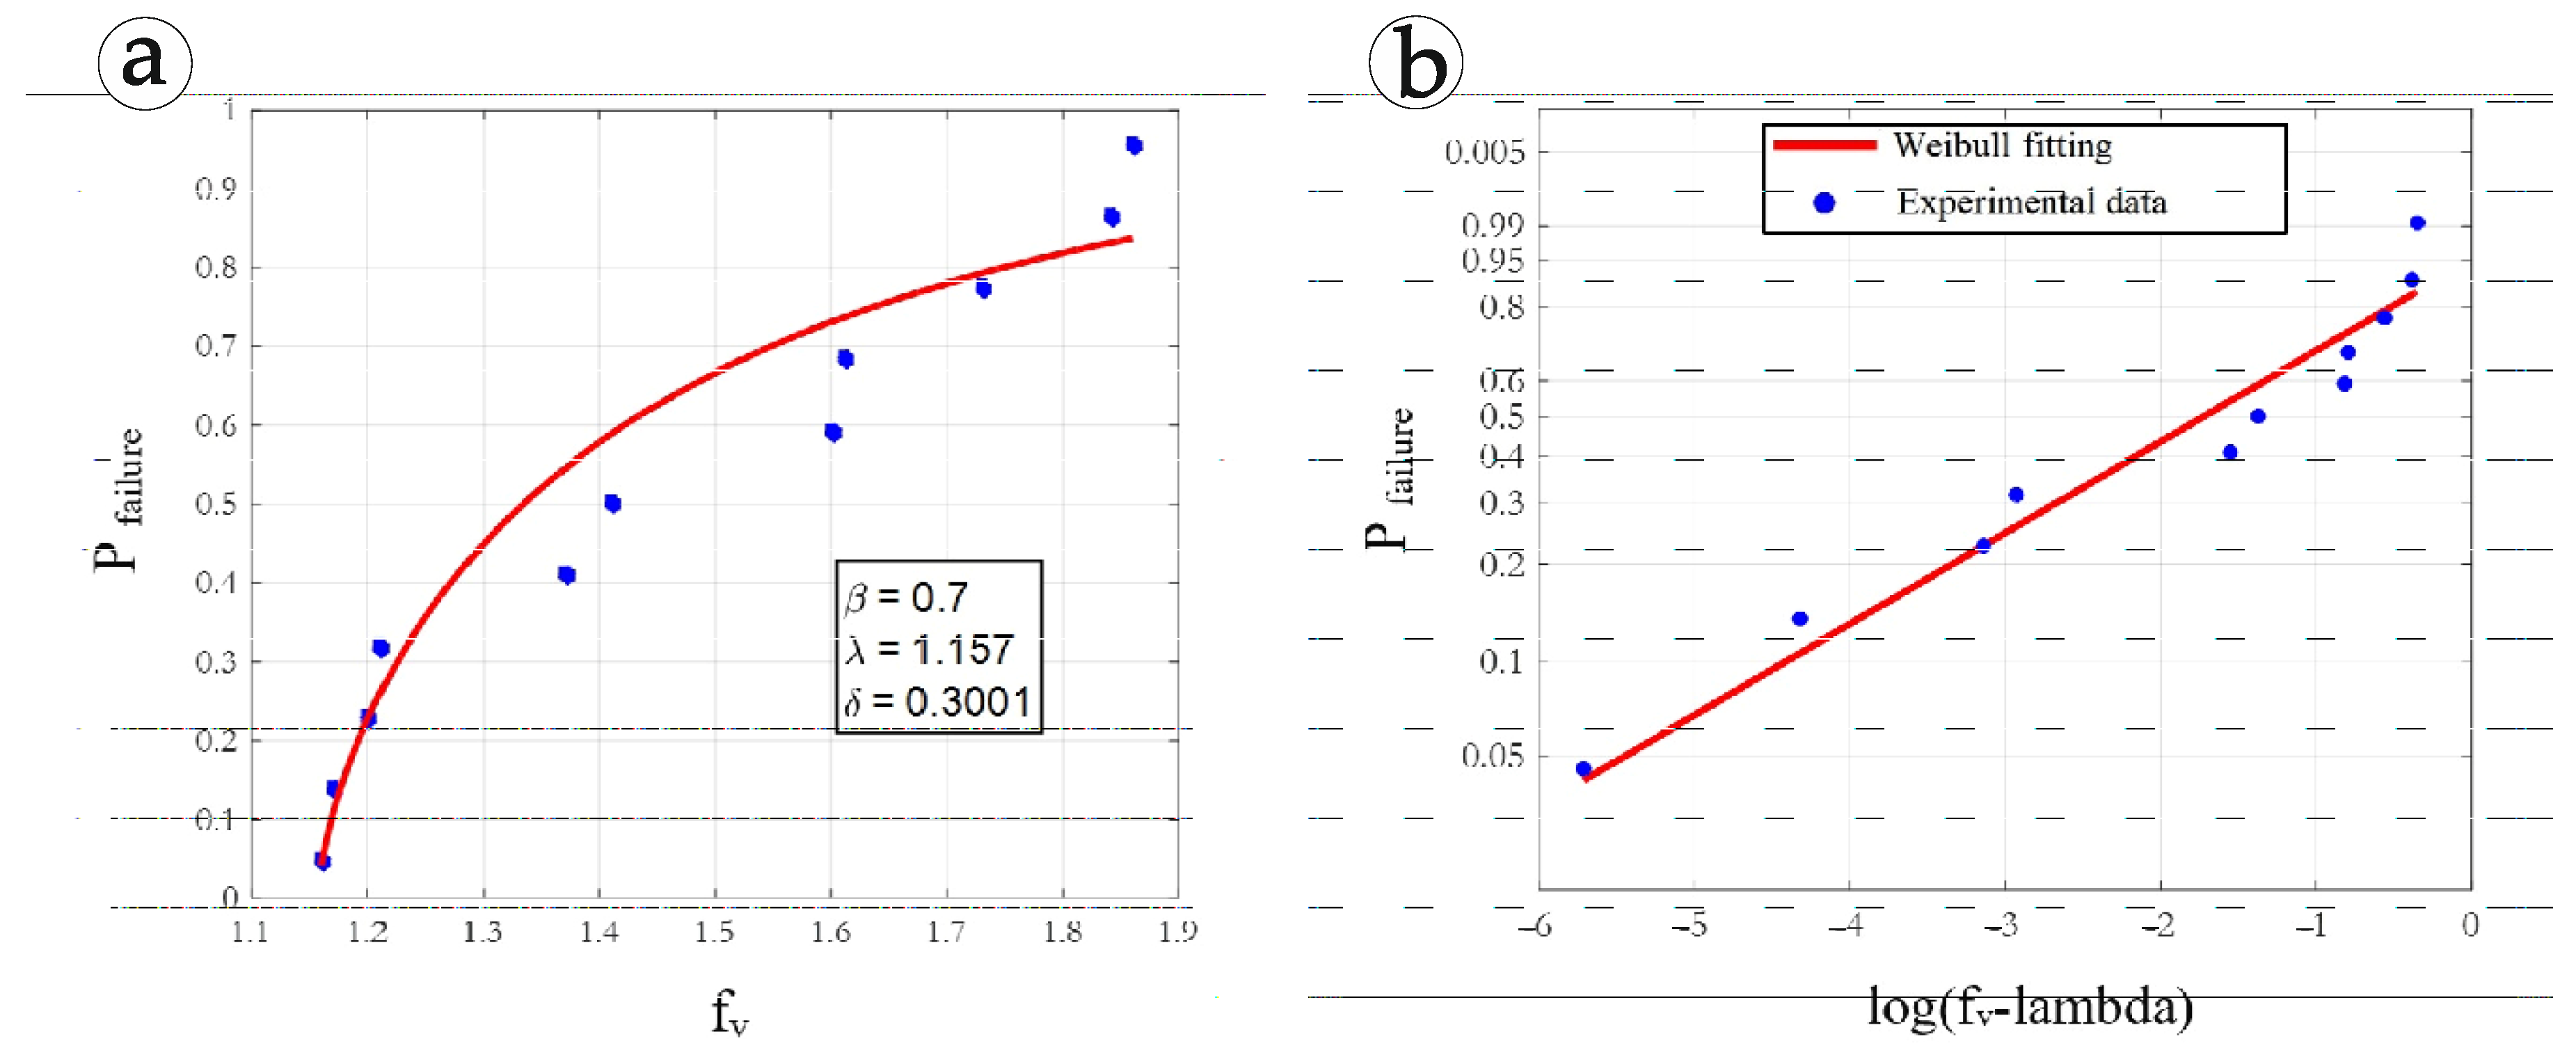
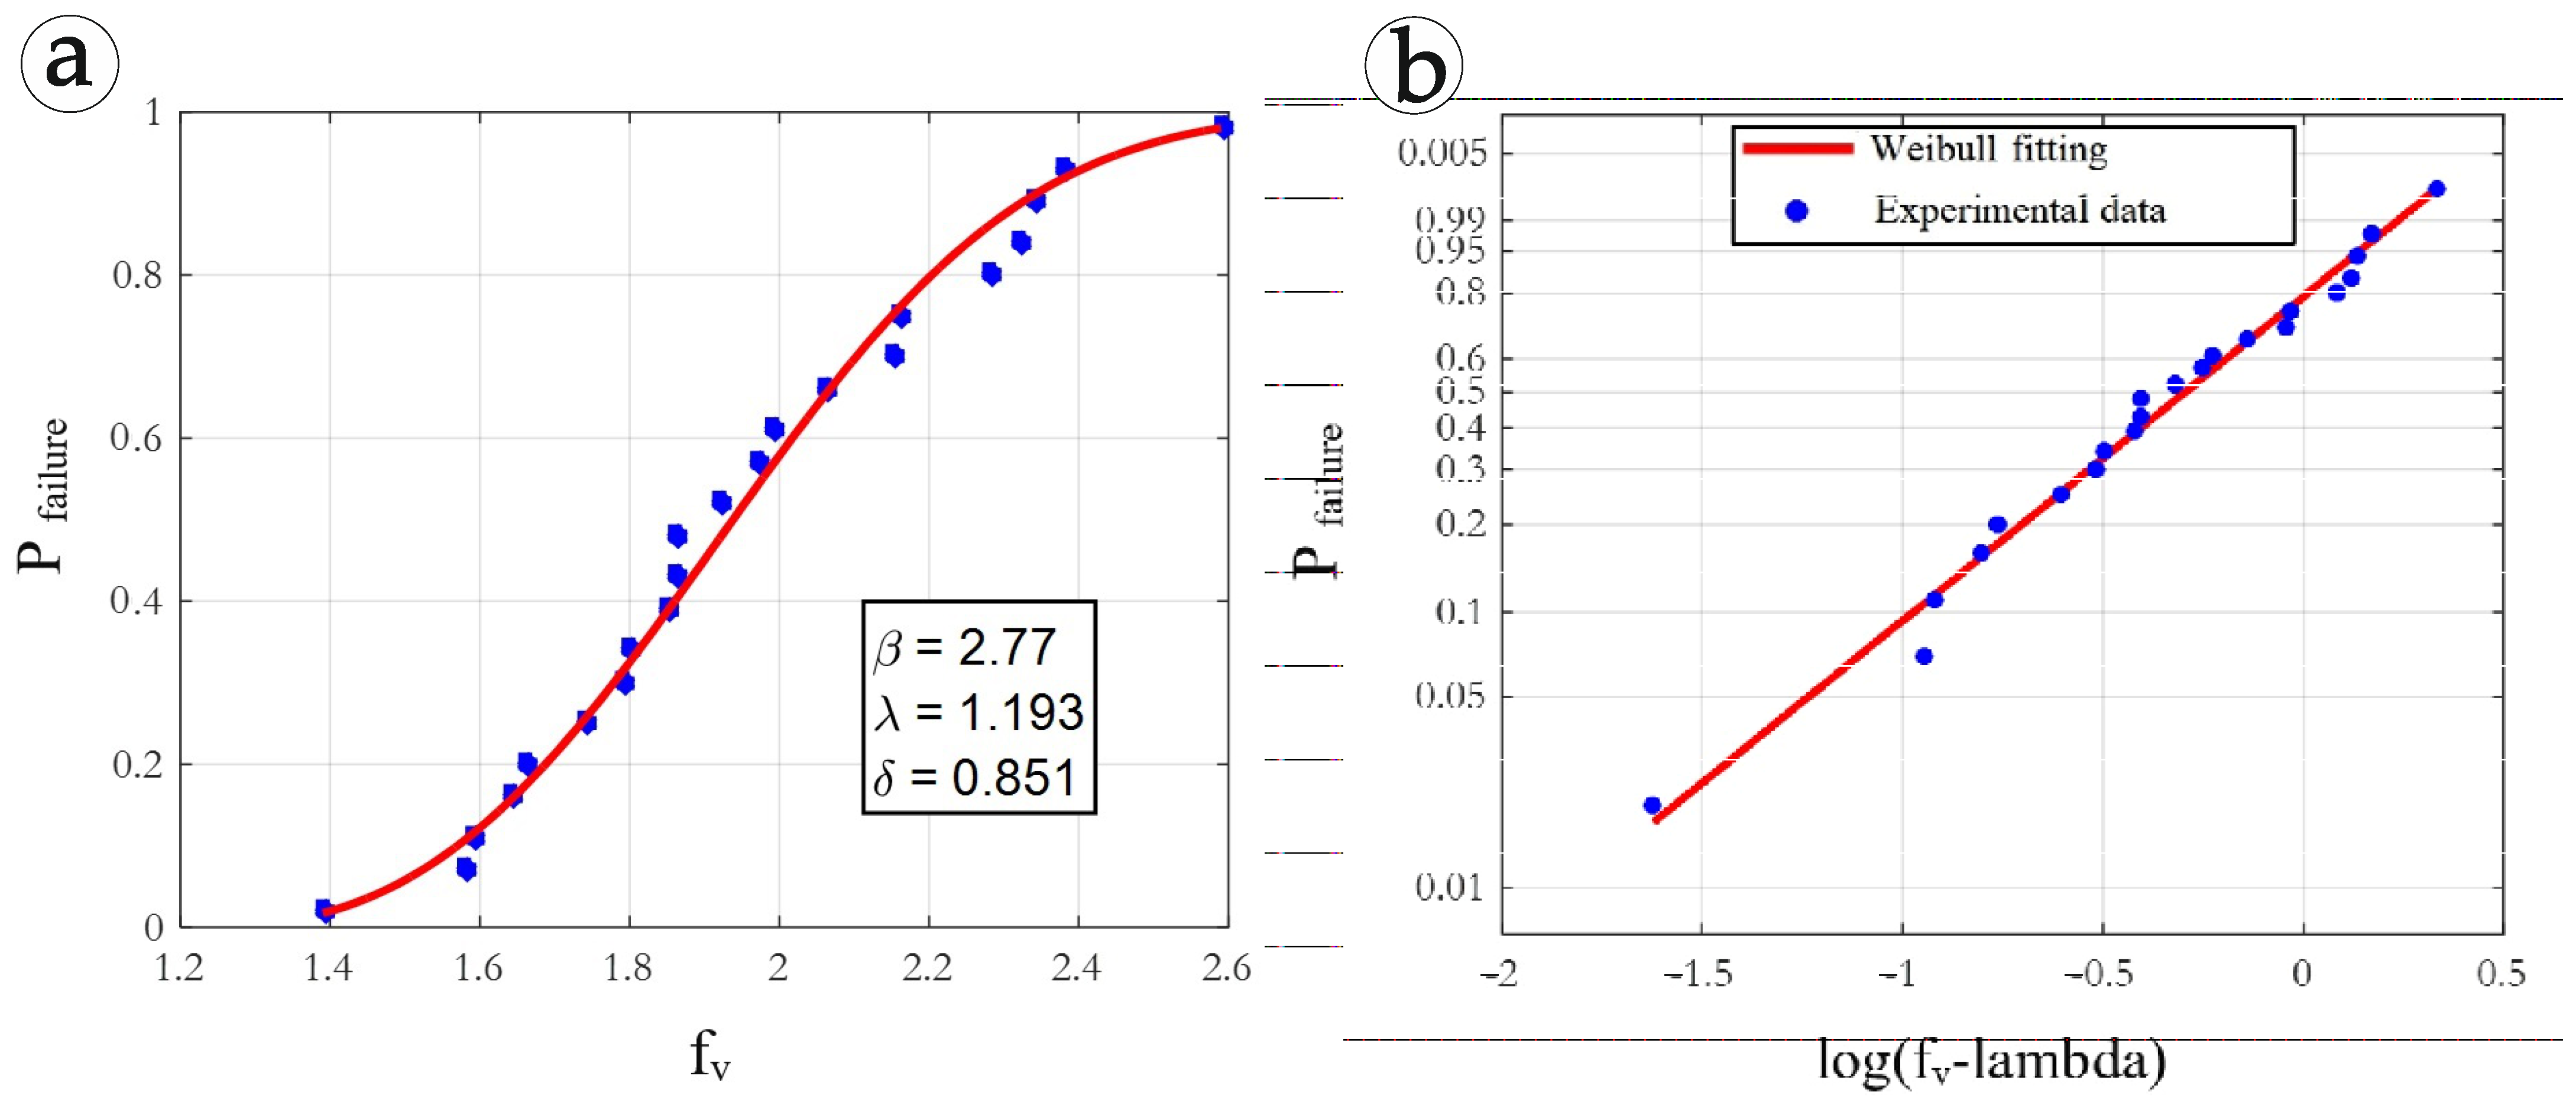
Figure 4a shows the resulting distribution in linear scale, including the values of the Weibull parameters (location λ, scale Δ and shape β), and Figure 4b shows this distribution in log–log scale (Gumbel paper), in both cases including only the valid results—that is, excluding the results that did not meet the test time limit of 30 ± 10 s indicated in standard UNE-EN 314-1 (Section 4) [4].
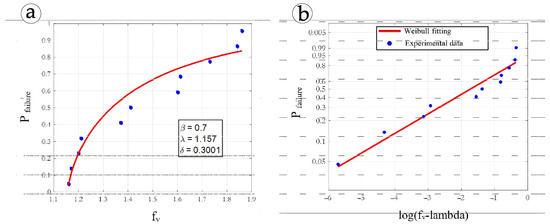
Figure 4.
Three-parameter Weibull distribution function fitted only from the results of the 15 mm panel, class 3 (outdoor), with pre-treatment A obtained within the test time limit. (a) In linear scale; (b) in log-log scale (Gumbel paper).
In contrast, Figure 5a,b show the distribution of the results in linear and log–log scale without excluding those that did not meet the test time limit.
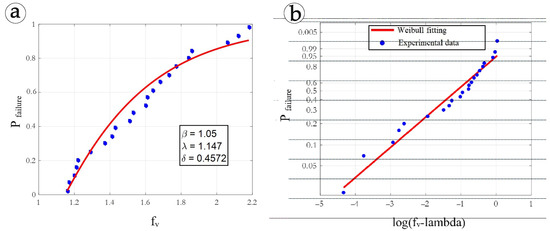
Figure 5.
Three-parameter Weibull distribution function fitted from all the results of the 15 mm panel, class 3 (outdoor), with pre-treatment A obtained within and exceeding the test time limit. (a) In linear scale; (b) in log–log scale (Gumbel paper).
The Weibull distributions estimated for the samples, excluding and including the test results that must be declared invalid according to standard UNE-EN 314-1 (Section 6) [4], show no notable difference. In particular, virtually the same values were observed for low fracture probabilities. It is therefore concluded that in this case the determination of the time limit is not totally justified.
The location parameter λ, representing the failure load threshold for a null probability, is the same for both distribution functions, with a value notably higher than zero. Therefore, under no circumstances would it be advisable to use a Weibull two-parameter function, implicitly involving the use of λ = 0, which would be overly conservative.
The values of the Weibull distribution parameters resulting from the assessment of the shear results for the 15 mm panel with pre-treatment A are not habitual. This appears to be due to the multiplicity of the types of fracture obtained, indicating notable heterogeneity in the sample, and to its unjustified consideration as a single homogeneous sample.
4.2. 15 mm Panel, Class 3 (Outdoor), with Pre-Treatment B
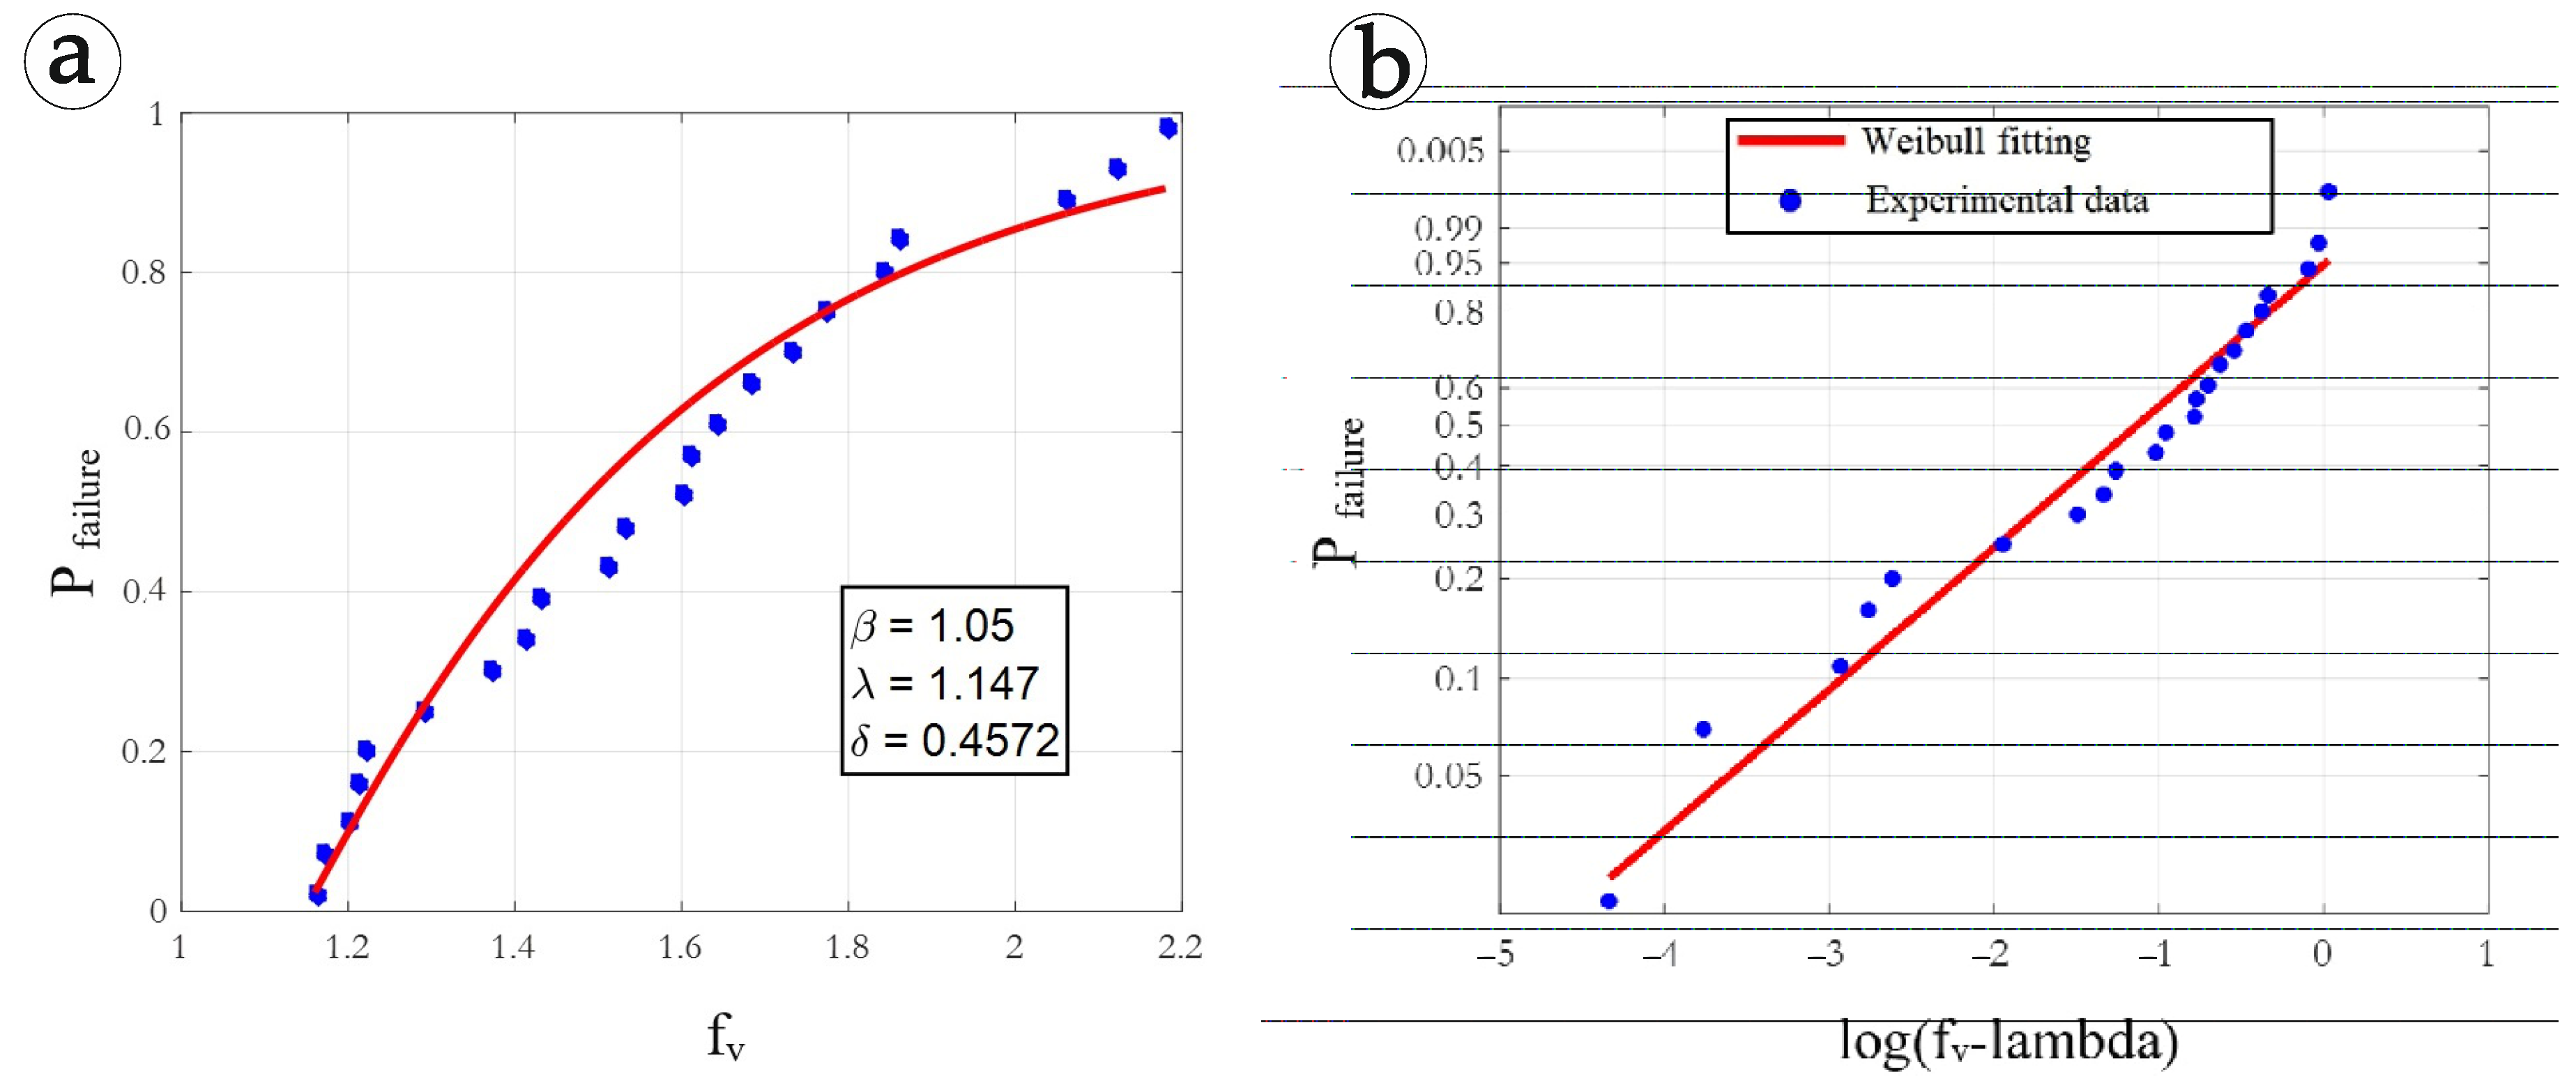
Conducting the same assessment of the results as in Section 4.1. with pre-treatment B, Figure 6 and Figure 7 include the distributions of results, in linear and log–log scale, using only valid values that fall within the test time limit (Figure 6a,b) and all the values obtained, both within and exceeding the test time limit (Figure 7a,b).
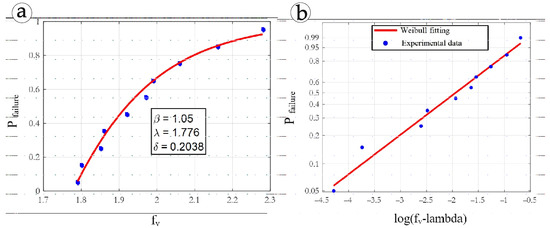
Figure 6.
Three-parameter Weibull distribution function fitted only from the results of the 15 mm panel, class 3 (outdoor), with pre-treatment B obtained within the test time limit. (a) In linear scale; (b) in log–log scale (Gumbel paper).

Figure 7.
Three-parameter Weibull distribution function fitted from all the results of the 15 mm panel, class 3 (outdoor), with pre-treatment B obtained within and exceeding the test time limit. (a) In natural scale; (b) in log–log scale (Gumbel paper).
The Weibull distributions estimated for the samples, excluding and including the test results that should be declared invalid according to standard UNE-EN 314-1 (Section 6) [2], show no remarkable difference. It is concluded that the determination of the time limit in this case is fully justified.
The location parameter λ is not the same for the two distribution functions, confirming this conclusion.
The values of the Weibull distribution parameters resulting from the assessment of the shear results for the 15 mm panel with pre-treatment A are not habitual. This appears to be due to the multiplicity of the types of fracture, indicating notable heterogeneity in the sample and its unjustified consideration as a single homogeneous sample.
4.3. 18 mm Panel, Class 3 (Outdoor), with Pre-Treatment A
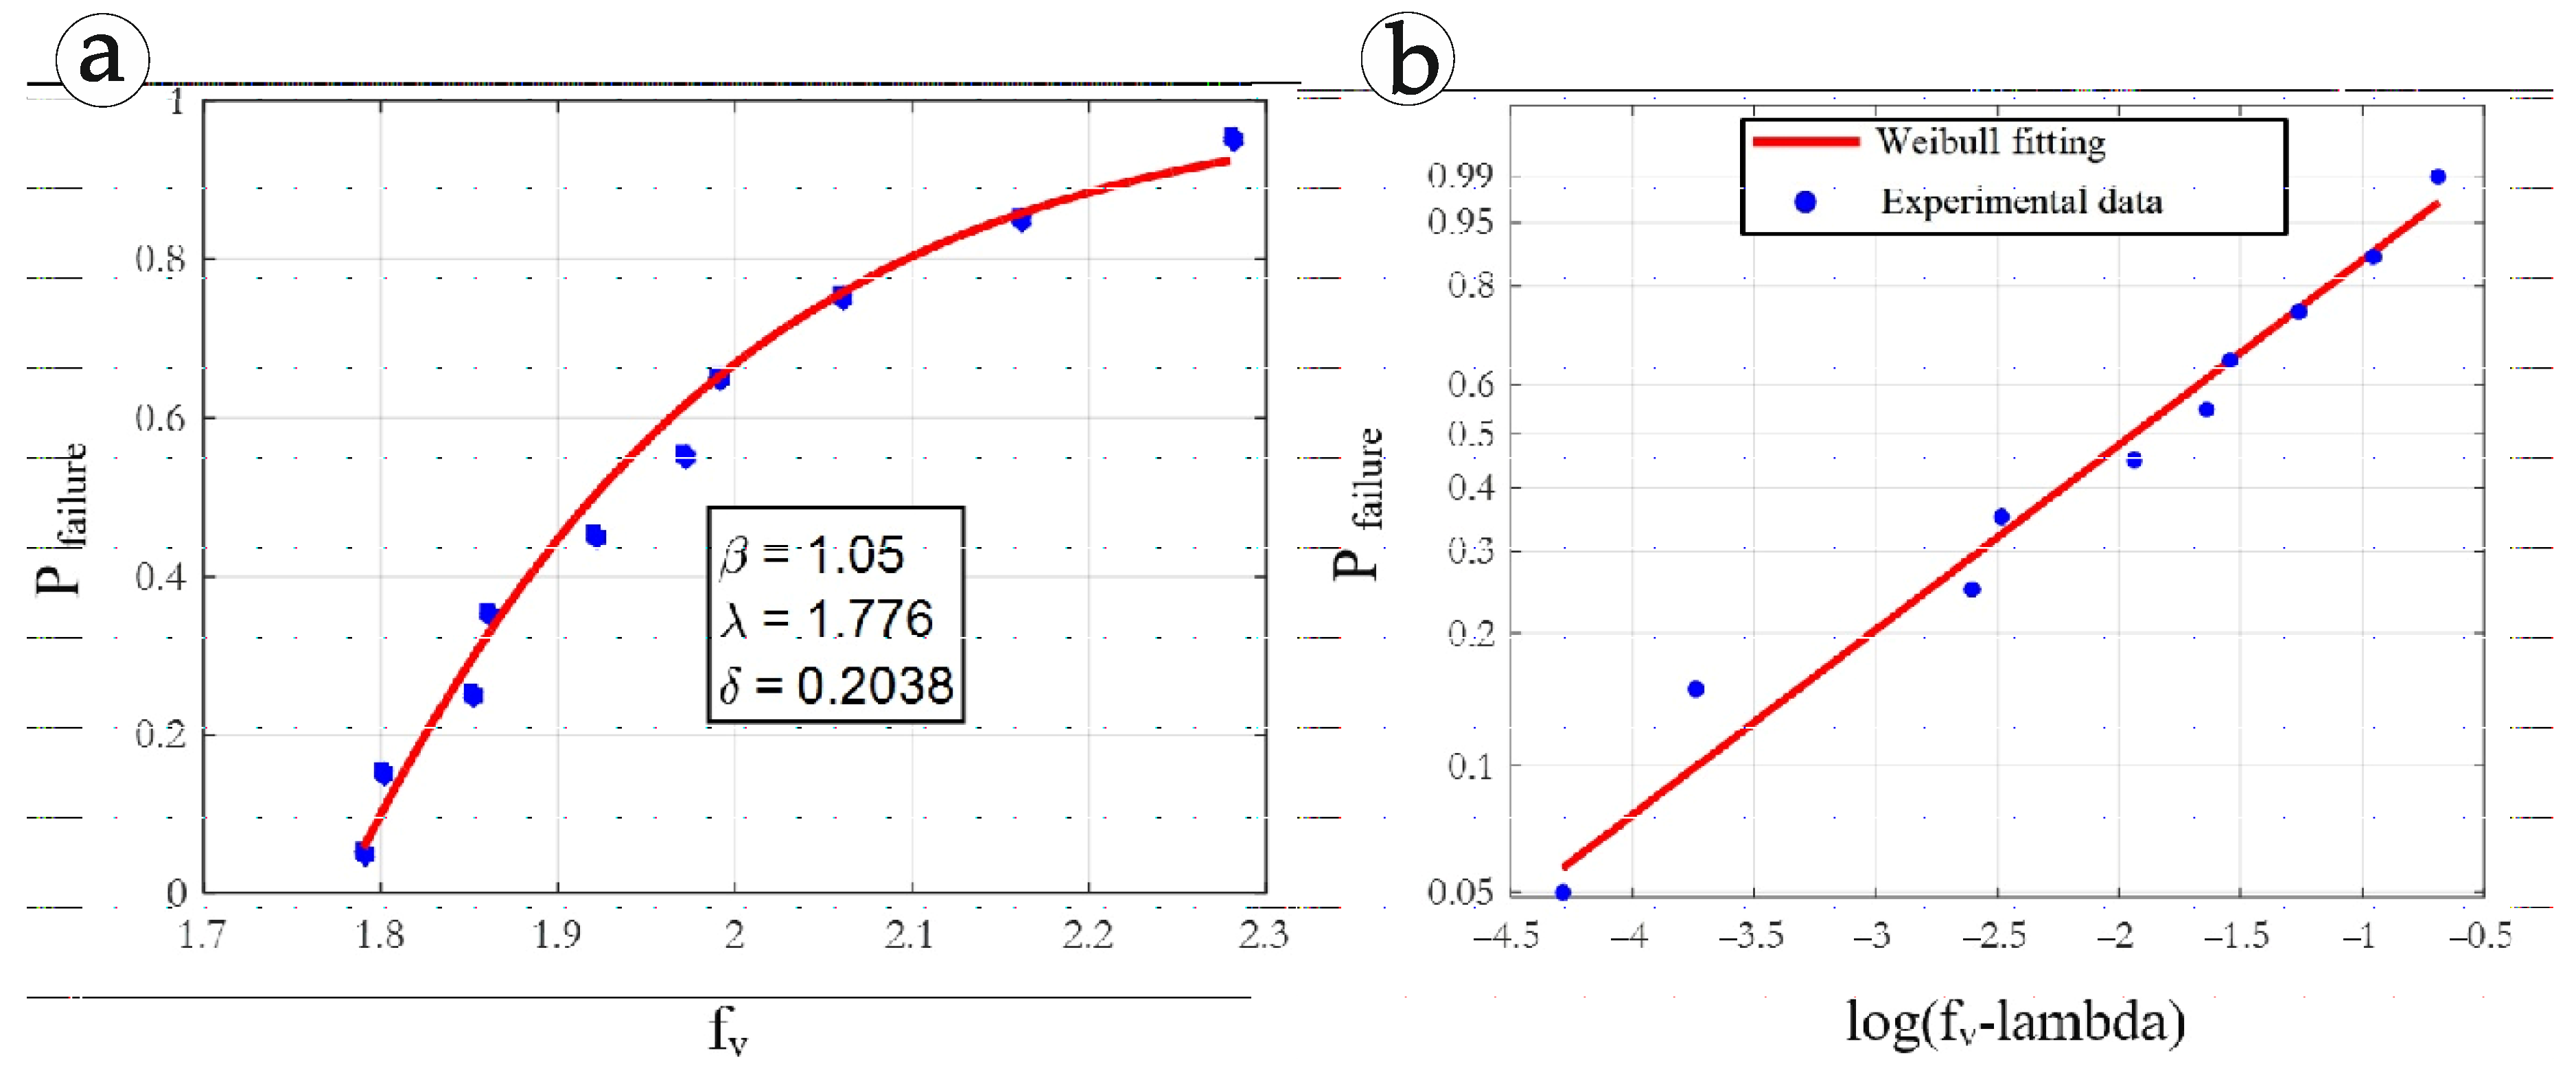
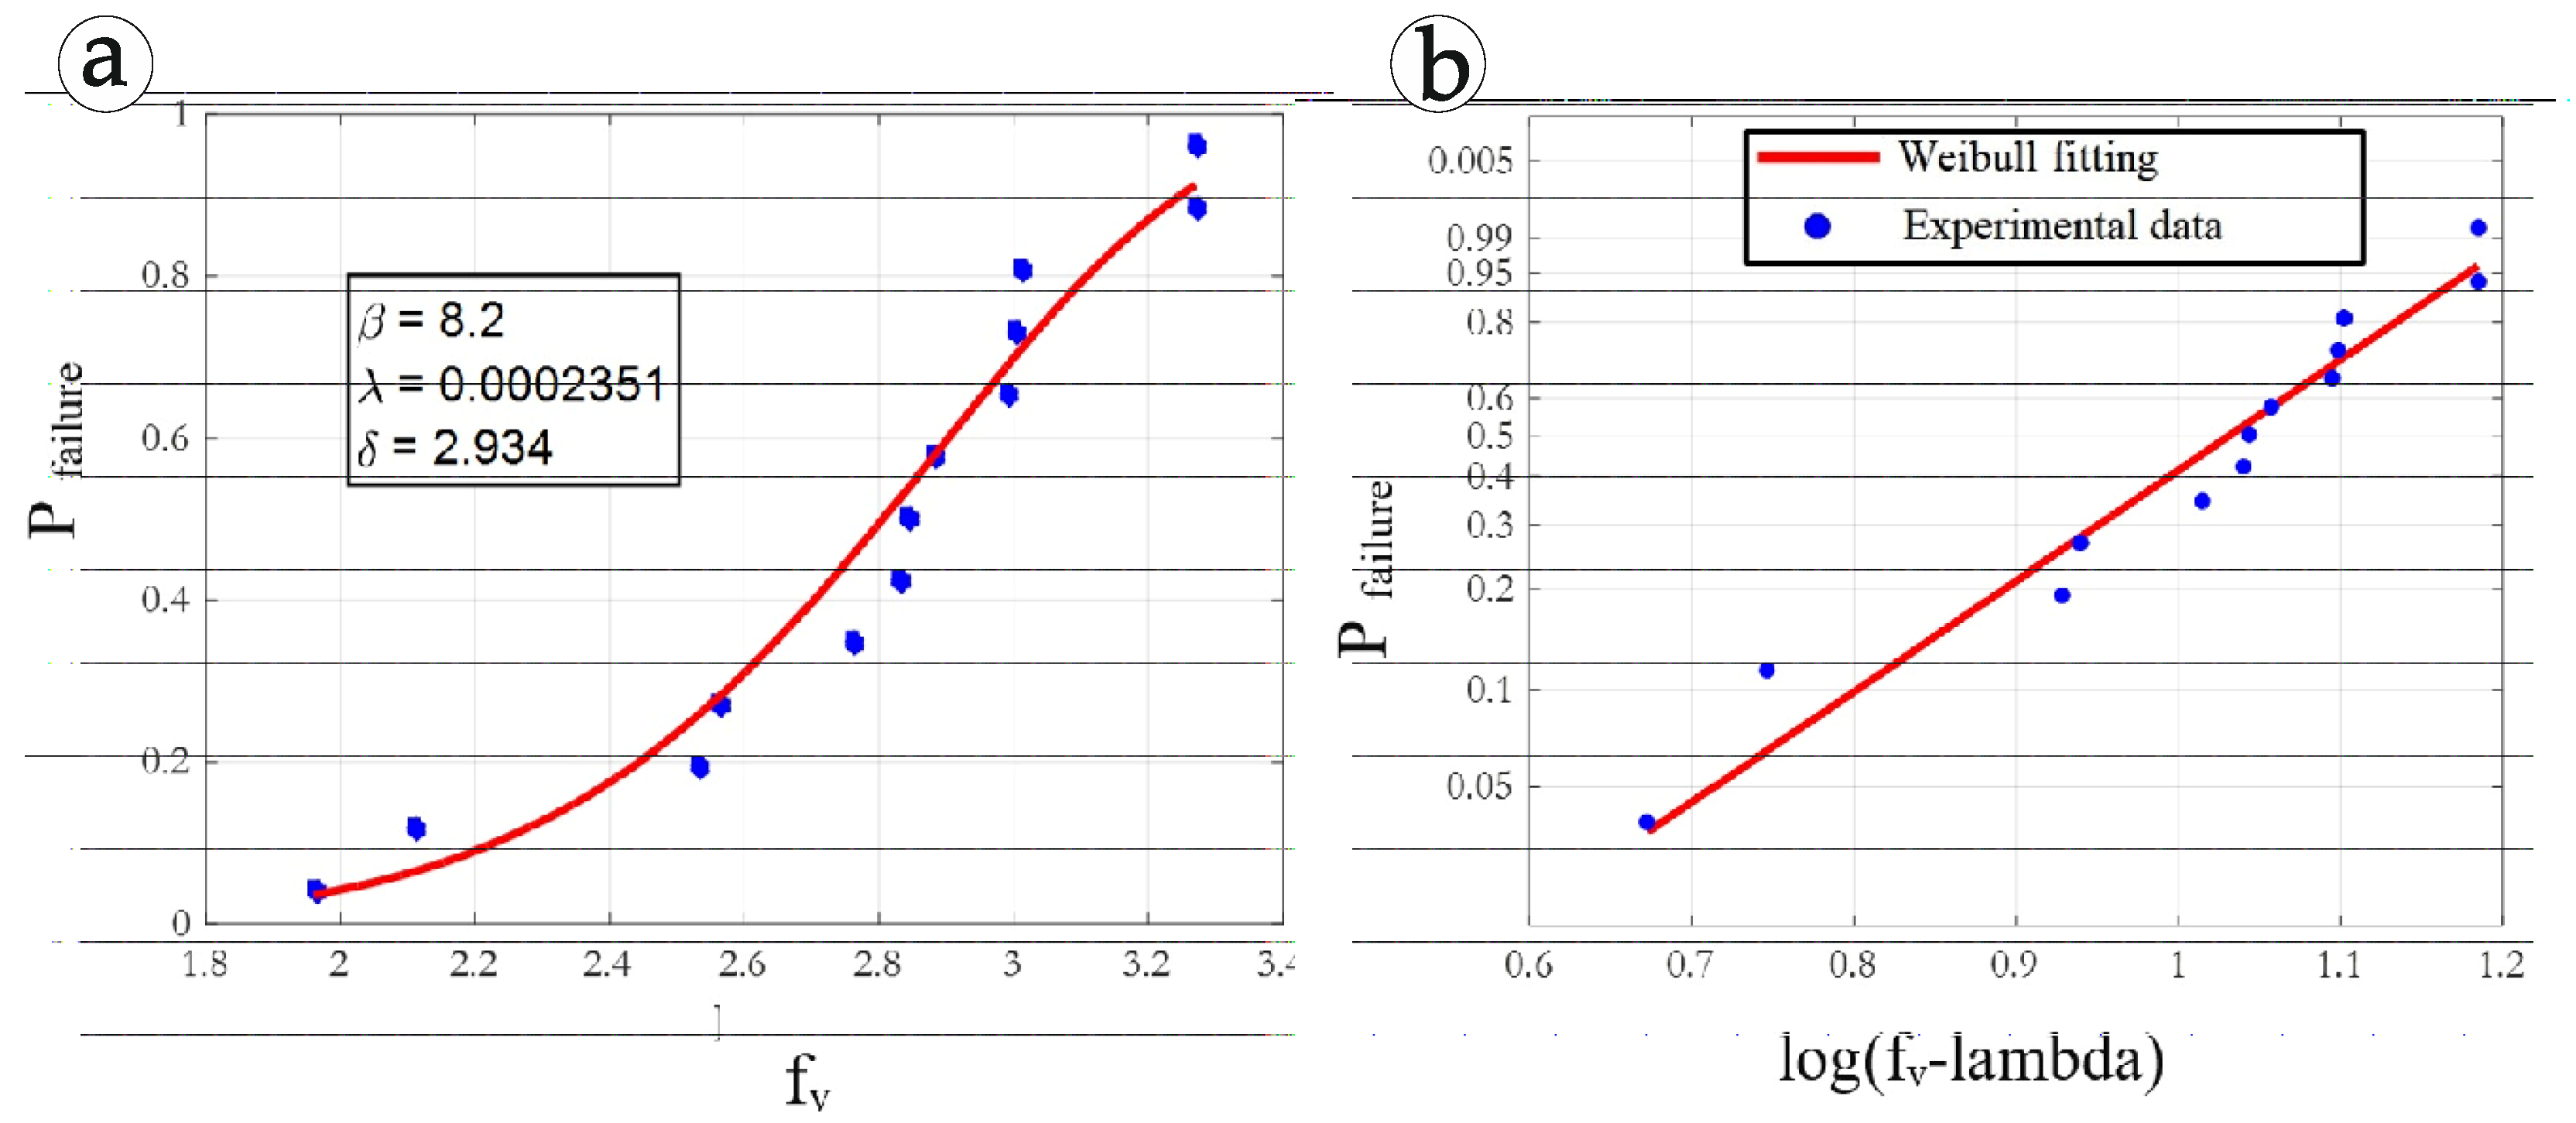
Applying the same assessment process as in the previous sections, the results obtained are shown in Figure 8 and Figure 9.
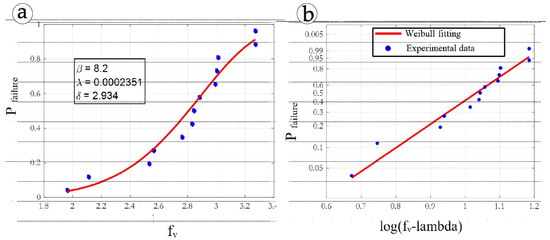
Figure 8.
Three-parameter Weibull distribution function fitted only from the results of the 18 mm panel, class 3 (outdoor), with pre-treatment A obtained within the test time limit. (a) In natural scale; (b) in log–log scale (Gumbel paper).

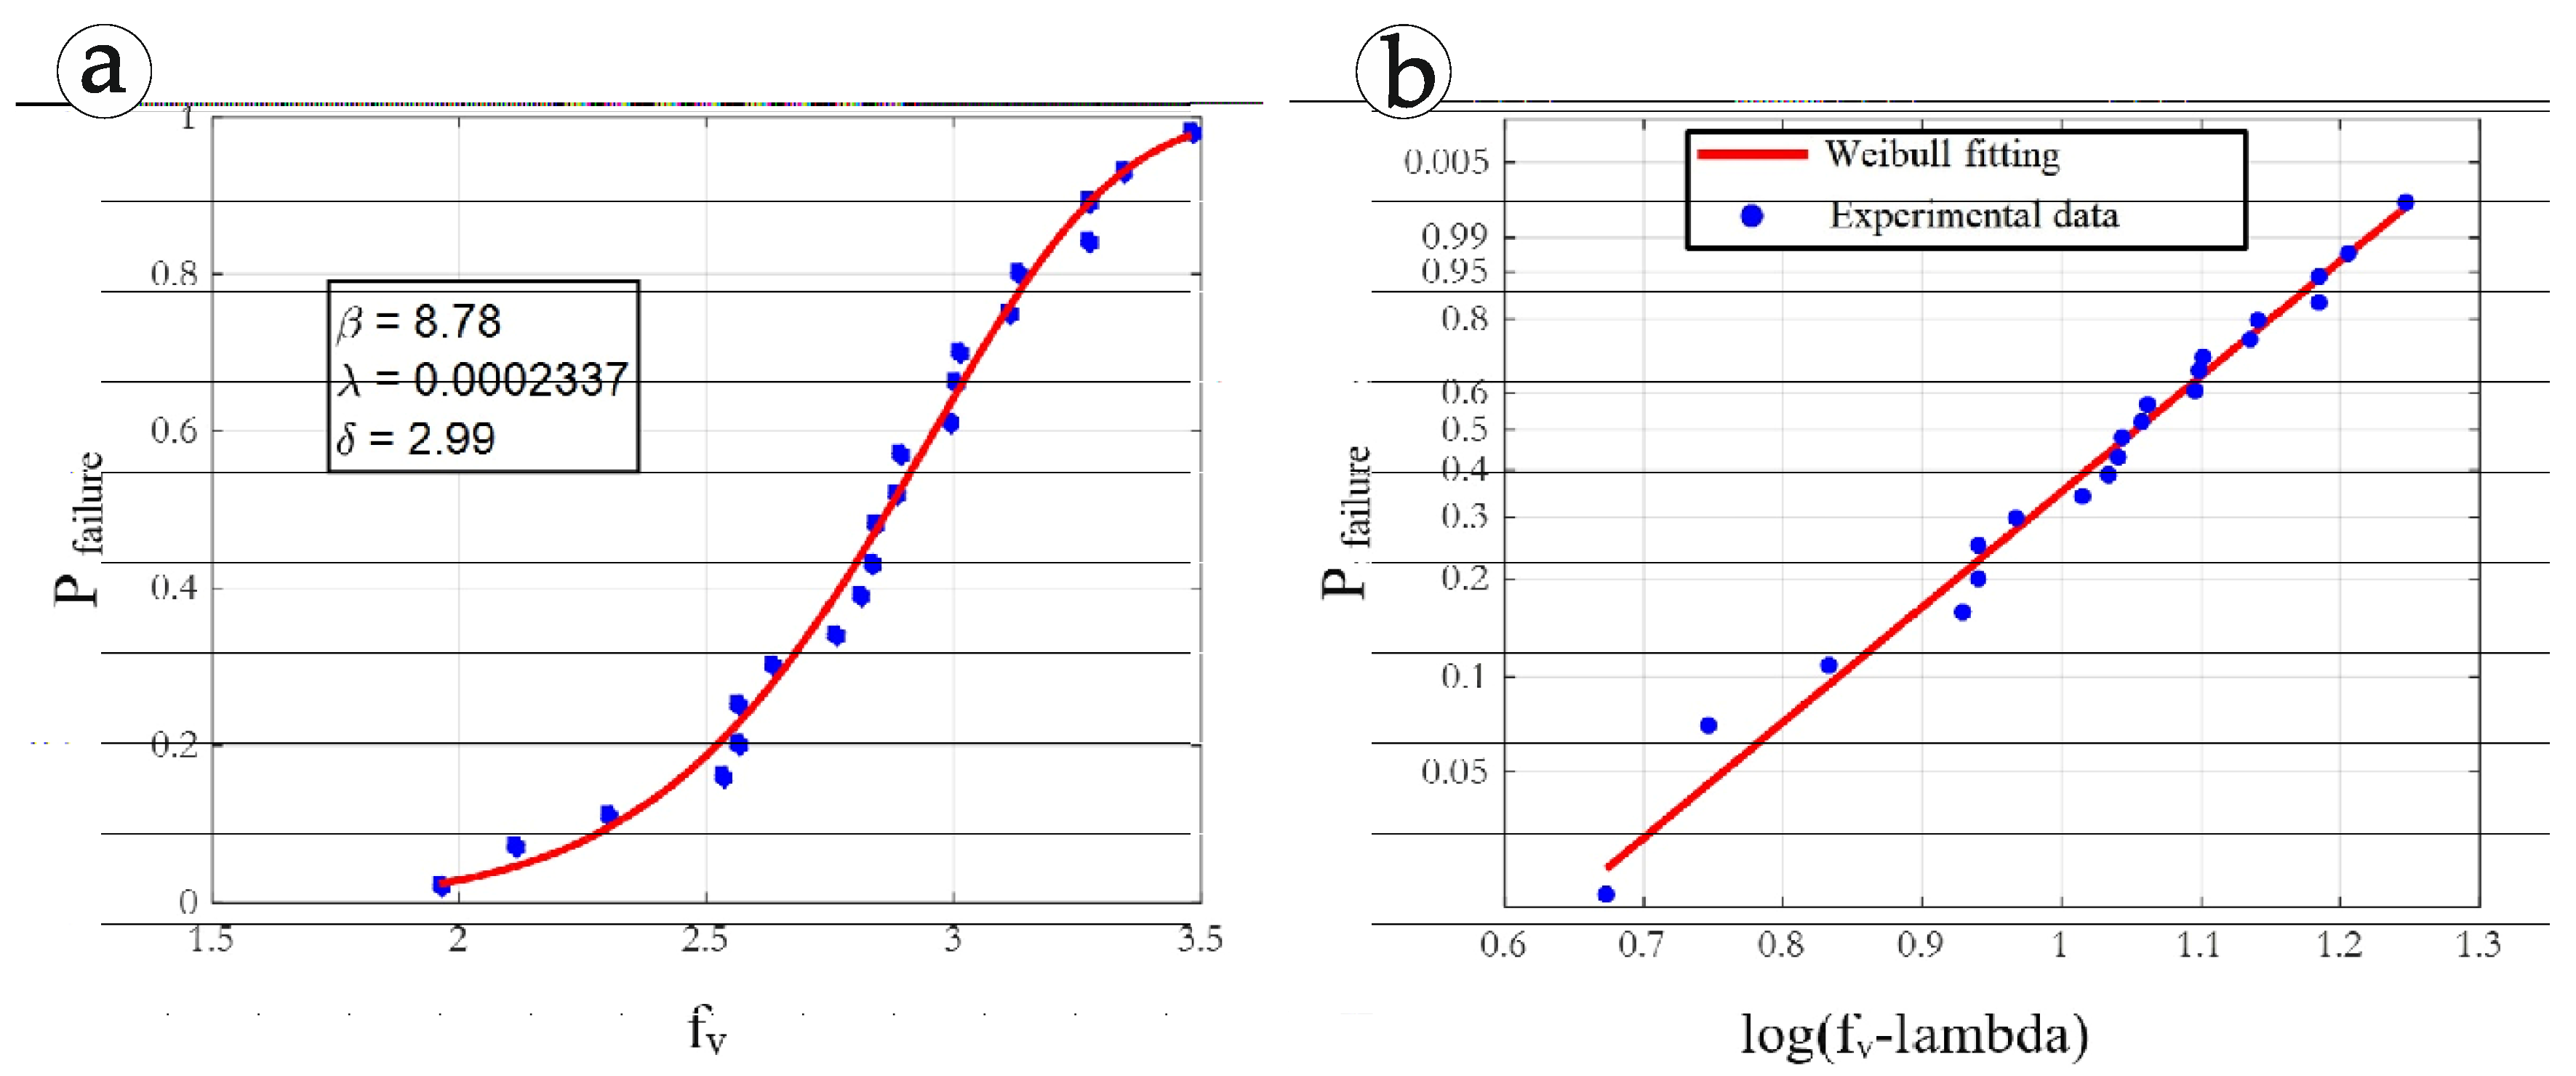
Figure 9.
Three-parameter Weibull distribution function fitted from all the results of the 18 mm panel, class 3 (outdoor), with pre-treatment A obtained within and exceeding the test time limit. (a) In natural scale; (b) in log–log scale (Gumbel paper).
The Weibull distributions estimated for the samples, excluding and including the test results that must be declared invalid according to standard UNE-EN 314-1 (Section 6) [4], are practically the same, even for low fracture probabilities. From this, it is concluded that the time limit values of the test are not justified.
The location parameter λ is practically null. Therefore, in this case a Weibull two-parameter function could be used with a realistic criterion.
The values of the Weibull distribution parameters resulting from assessing the shear results for the thin panel are habitual but high. The failure criteria are more consistent and, therefore, the test results are more homogeneous, resulting in more credible Weibull parameters.
With regard to the analysis of the load–displacement curves (Figures S1–S3 of the Supplementary Material), for the 15 mm panel (pre-treatment A) the curves show a consistent value in the gradients and a spread that was considered low in the failure strength values, with a mean value of Fv,med = 2.02 MPa and a coefficient of variation of 9.95%, which is, effectively, low.
For the 15 mm panel (pre-treatment B), the load–displacement curves show considerable variation in the gradients and the failure strength values, with a low mean value of Fv,med =1.47 MPa and a high coefficient of variation of 17.95%.
For the 18 mm panel (pre-treatment A), the load–displacement curves show considerable variability both in the gradients and the failure strength values, with a high mean value of Fv,med =2.77 MPa and a high coefficient of variation of 14.22%. Lastly, alternating loading-unloading phases were observed in the failure process, presumably due to the successive failures of the different bonding layers, a phenomenon commonly observed in composite materials, possibly, accentuated by their orthotropic construction.This process, moreover, is habitual in compound materials, probably accentuated by their orthotropic construction.
4.4. Interpretation of DIC Results in the Bonding Quality Test
The normal strain εy and the tangential strain εxy were analysed, both throughout the theoretical failure section, represented by the anti-symmetry axis of the test piece, and in two nearby parallel sections on each side of the theoretical failure section (Figures S4–S9 of the Supplementary Material).
The graph of the normal strain εy does not maintain the expected symmetry; instead, a moderate strain is observed in one half of the test piece, indicating that it is barely affected by the failure, while the strain occurs almost entirely in the other half and represents the entire failure process. Depending on the test, either the left or right half is affected. As expected, a greater concentration of strains was also observed in the corner of the notch from where the subsequent failure process would begin.
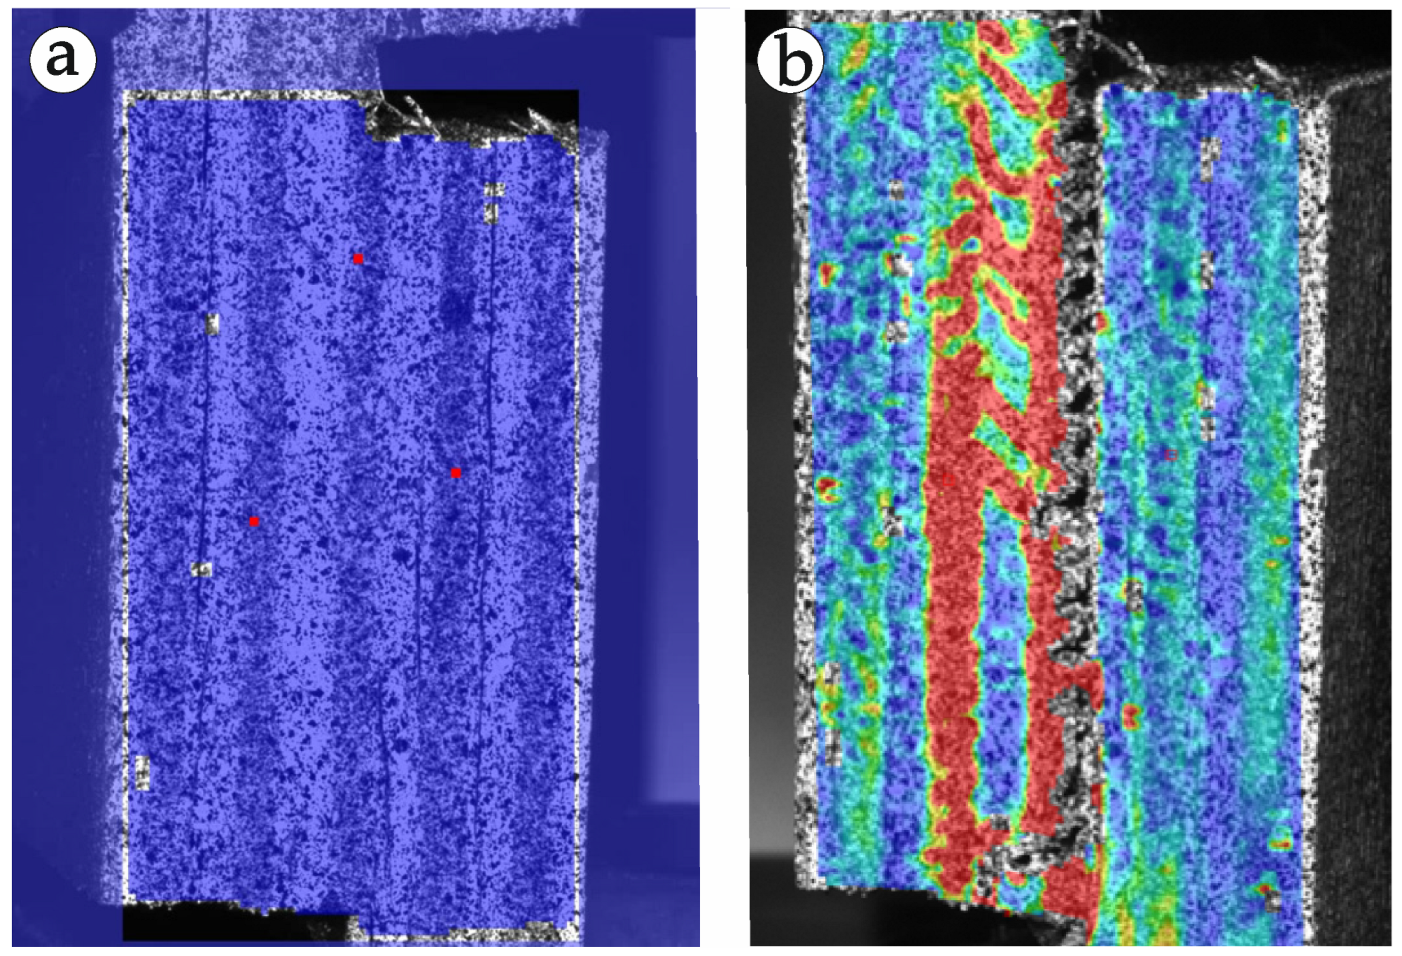
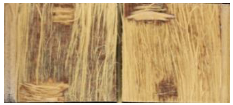
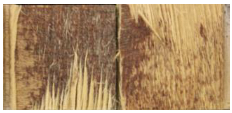
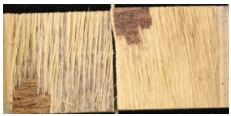
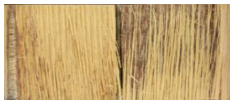
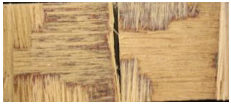
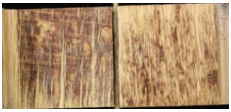
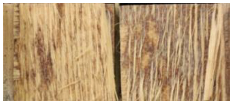
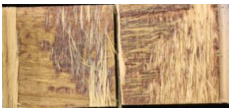
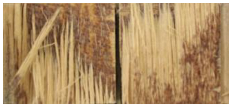
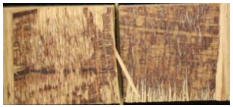
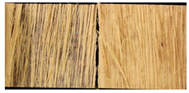
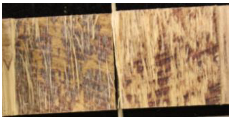
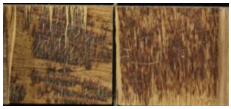
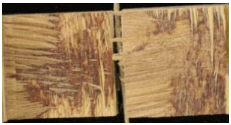
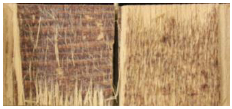
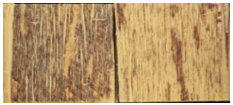
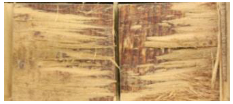
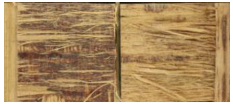
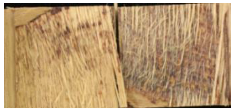
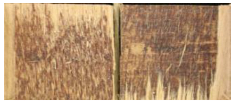
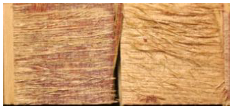
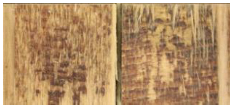
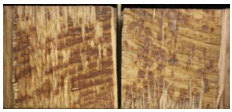
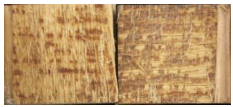
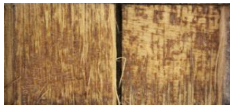
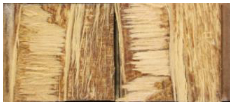
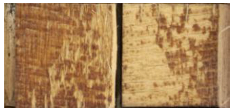
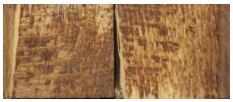
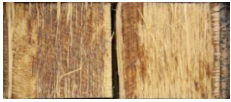
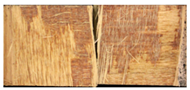
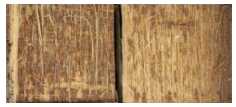
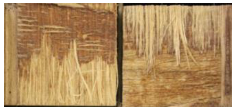
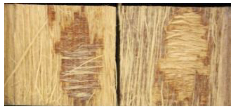
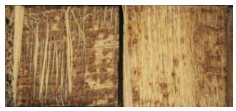
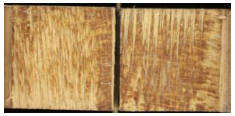
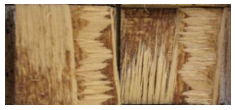
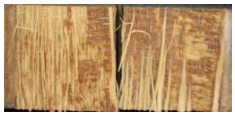
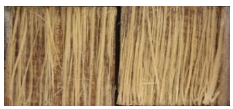
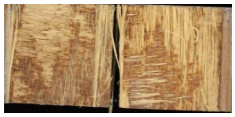
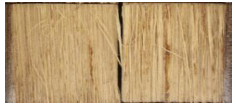
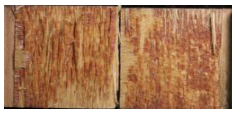
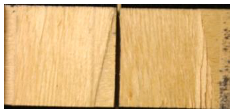
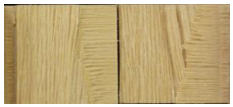
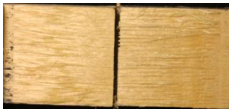
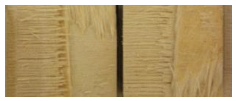
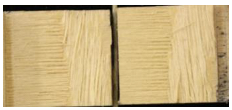
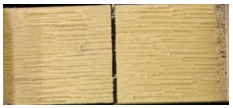
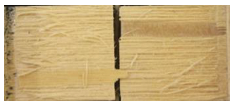
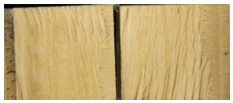
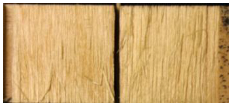
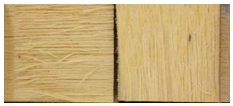
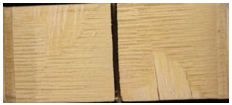
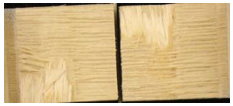
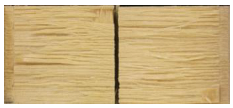
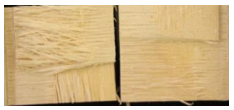
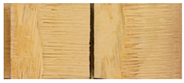
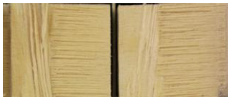
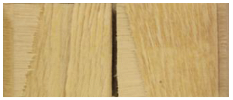
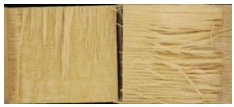
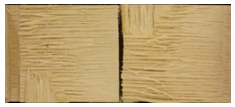
With regard to the shear deformation εxy, the test piece is practically subjected to a pure shear loading. As a result, throughout the line joining, the two notches at an almost constant tangential strain would be expected, and this is confirmed during the different stages of the load process, with small variations at the edges of the recordings; i.e., in the vicinity of the notches. In the Aramis recordings, the final stage of the failure process is observed, showing a succession of small failure bridges in the wood, forming an unusual failure mechanism (Figure 10). To the best of the authors’ knowledge, no studies have addressed the use of DIC to characterise plywood bonding quality under shear loading and, therefore, it was not possible to compare the results obtained.
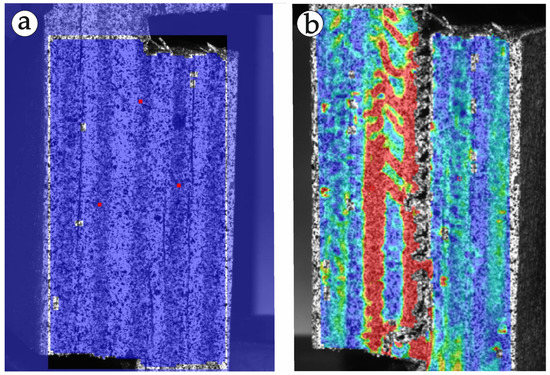
Figure 10.
(a) Re rence image of the plywood structure with the three start points in the reference image; (b) typical failure mechanism occurring in the shear test using DIC technique.
5. Conclusions
In this work, an extensive experimental programme was carried out to determine the bonding quality of 15 mm and 18 mm plywood panels under shear loading, for two different pre-treatments and different humidity conditions, indicated as A and B, applying the technique of digital image correlation (DIC).
Using the DIC technique, the failure process and real distribution of the strains throughout the bonding line of plywood panels can be analysed during and after the failure process. This enables the study of the response of plywood under shear loads, in particular when loads are close to failure.
The suitability of the plywood bonding quality test under shear loading, governed by standard UNE-EN 314-1, was verified for failure characterisation of compound materials of orthotropic construction such as plywood panels. The results showed that excluding test results based on the time limit value of 30 ± 10 s indicated in the operating procedure of standard UNE-EN 314-1 is questionable
Bonding strength is a typical statistical problem of minima. This justifies the application of extreme value statistics to evaluate the experimental results, providing a more reliable procedure to analyse test data and predict the failure results for low probabilities of failure.
Supplementary Materials
The following supporting information can be downloaded at: https://www.mdpi.com/article/10.3390/f13122135/s1, Figure S1: Load-displacement curves for 15 mm panel, pre-treatment A; Figure S2: Load-displacement curves for 15 mm panel, pre-treatment B; Figure S3: Load-displacement curves for 18 mm panel, pre-treatment A; Figure S4: εy-strain field for test piece 41, 15 mm panel, pre-treatment A; Figure S5: εxy -strain field for test piece 41, 15 mm panel, pre-treatment A; Figure S6: εy-strain field for test piece 16, 15 mm panel, pretreatment B; Figure S7: εxy-strain field for test piece 16, 15 mm panel, pretreatment B; Figure S8: εy-strain field for test piece 36, 18 mm panel, pre-treatment A; Figure S9: εxy-strain field for test piece 36, 18 mm panel, pre-treatment A.
Author Contributions
Conceptualisation, E.F.Z., A.F.C., L.G.E. and P.d.P.; formal analysis, E.F.Z., A.F.C., I.G. and M.L.; funding acquisition, E.F.Z.; investigation, E.F.Z., A.F.C., I.G., M.L., L.G.E., P.d.P., F.G.F. and A.G.-I.; methodology, E.F.Z., A.F.C. and F.G.F.; project administration, E.F.Z.; resources, E.F.Z. and A.F.C.; supervision, E.F.Z., I.G. and M.L.; validation, E.F.Z., A.F.C. and L.G.E.; visualisation, L.G.E., E.F.Z., A.F.C., I.G. and M.L.; writing—original draft, L.G.E., E.F.Z. and A.F.C.; writing—review and editing, E.F.Z., A.F.C., I.G., M.L., L.G.E., P.d.P., F.G.F. and A.G.-I. All authors have read and agreed to the published version of the manuscript.
Funding
The partial support of the Consejería de Educación y Ciencia del Principado de Asturias (Ref.: SV-PA-11-012) is acknowledged as part of the project “Una aproximación numérica general para la predicción de daño y fractura de materiales (A general numerical approach for prediction of damage and fracture of materials)”.
Institutional Review Board Statement
Not applicable.
Informed Consent Statement
Not applicabe.
Data Availability Statement
The relevant data is already included in the paper.
Conflicts of Interest
The authors declare no conflict of interest.
Abbreviations
| DIC | Digital image correlation |
| RMv,med | Mean apparent cohesive wood failure percentage value |
| fv | Shear fracture stress (N/mm2) |
| F | Test piece failure load (N) |
| l1 | Length of the shear area (mm) |
| b1 | Width of the shear area (mm) |
| fv,med | Mean shear stress value (N/mm2) |
| fv,min | Minimum shear stress value (N/mm2) |
| εy | Normal strain |
| εxy | Tangential strain |
References
- Food and Agriculture Organization of the United Nations. FAO Yearbook of Forest Products 2019; Food and Agriculture Organization of the United Nations: Rome, Italy, 2021. [Google Scholar]
- García Esteban, L.; Guindeo Casasús, A.; Peraza Oramas, C.; de Palacios de Palacios, P. La Madera y su Tecnología; Mundi, P., de Salazar, F.C.V., Eds.; AITIM: Madrid, Spain, 2010. [Google Scholar]
- Hermoso Prieto, E. Caracterización Mecánica de la Madera. Ph.D. Thesis, Universidad Politécnica de Madrid, Madrid, Spain, 2001. [Google Scholar]
- EN 314-1; European Standard. Plywood. Bonding Quality. Part 1: Test Methods. European Committee of Standardization (CEN): Brussels, Belgium, 2004.
- EN 314-2; European Standard. Plywood—Bonding Quality—Part 2: Requirements. European Committee of Standardization (CEN): Brussels, Belgium, 1993.
- EN 636:2012+A1:2015; European Standard. Plywood—Specifications. European Committee of Standardization (CEN): Brussels, Belgium, 2015.
- EN 326-1; European Standard. Wood-Based Panels—Sampling, Cuttizng and Inspection—Part 1: Sampling and Cutting of Test Pieces and Expression of Test Results. European Committee of Standardization (CEN): Brussels, Belgium, 1994.
- EN 12369-2; European Standard. Wood-Based Panels—Characteristic Values for Structural Design—Part 2: Plywood. European Committee of Standardization (CEN): Brussels, Belgium, 2011.
- EN 322:1994; European Standard. Wood-Based Panels—Determination of Moisture Content. European Committee of Standardization (CEN): Brussels, Belgium, 1993.
- EN 323:1994; European Standard. Wood-Based Panels—Determination of Density. European Committee of Standardization (CEN): Brussels, Belgium, 1993.
- Pan, B.; Qian, K.; Xie, H.M.; Asundi, A. Two dimensional digital image correlation for in plane displacement and strain measurement. A review. Meas. Sci. Technol. 2009, 20, 062001. [Google Scholar]
- Sutton, M.A.; Wolters, W.J.; Peters, W.H.; Ranson, W.F.; McNeill, S.R. Determination of displacements using an improved digital correlation method. Image Vis. Comput. 1983, 1, 133–139. [Google Scholar]
- Peters, W.H.; Ranson, W.F. Digital imaging techniques in experimental stress analysis. Opt. Eng. 1982, 21, 427–431. [Google Scholar]
- Kang, H.Y.; Muszynski, L.; Milota, M.R.; Kang, C.W.; Matsumura, J. Preliminary optical measurement of non-uniform drying strains and check formation in drying wood. J. Fac. Agric. Kyushu Univ. 2001, 56, 313–316. [Google Scholar]
- Kang, H.Y.; Kang, S.G.; Kang, C.W.; Matsumura, J. Measurement of strain distributions in white oak boards during drying using a digital image correlation method. J. Fac. Agric. Kyushu Univ. 2013, 58, 55–59. [Google Scholar]
- Peng, M.; Ho, Y.C.; Wang, W.C.; Chui, Y.H.; Gong, M. Measurement of wood shrinkage in jack pine using three dimensional digital image correlation (DIC). Holzforschung 2012, 66, 639–643. [Google Scholar]
- Lanvermann, C.; Wittel, F.K.; Niemz, P. Full-field moisture induced deformation in Norway spruce intra-ring variation of transverse swelling. Eur. J. Wood Wood Prod. 2014, 72, 43–52. [Google Scholar]
- García, R.A.; Rosero-Alvarado, J.; Hernández, R.E. Full-field moisture-induced strains of the different tissues of tamarack and red oak woods assessed by 3D digital image correlation. Wood Sci. Technol. 2020, 54, 139–159. [Google Scholar] [CrossRef]
- Oscarsson, J.; Olsson, A.; Enquist, B. Strain fields around knots in Norway spruce specimens exposed to tensile forces. Wood Sci. Technol. 2012, 46, 593–610. [Google Scholar]
- Villarino, A.; López-Rebollo, J.; Antón, N. Analysis of mechanical behavior through digital image correlation and reliability of Pinus halepensis Mill. Forests 2020, 11, 1232. [Google Scholar]
- Li, W.Z.; Liu, C.H.; Wang, X.Z.; Shi, J.T.; Mei, C.T.; Van den Bulcke, J.; Van Acker, J. Understanding the impact of wood type and moisture on the bonding strength of glued wood. Wood Mater. Sci. Eng. 2022. [Google Scholar] [CrossRef]
- Kraus, K. Photogrammetry. Geometry from Images and Laser Scans; De Gruyter: Berlin, Germany, 2007. [Google Scholar]
- Lerma García, J.L. Fotogrametría Moderna: Analítica y Digital; Universidad Politécnica de Valencia Serv. Publ.: Valencia, Spain, 2002. [Google Scholar]
- Schenk, T. Digital Photogrammetry; Backgrounds, Fundamentals Automatic Orientation Procedures; TerraScience: Laurelville, OH, USA, 1999; Volume 1. [Google Scholar]
- Gasvik, K.J. Optical Metrology; Willey: Chichester, UK, 1995. [Google Scholar]
- Schwider, J. Advanced Evaluation Techniques in Interferometry. Prog. Opt. 1990, 28, 271–359. [Google Scholar]
- GOM. ARAMIS User Manual RevA—Software; GOM: Braunschweig, Germany, 2009. [Google Scholar]
- Sutton, M.A.; Orteu, J.J.; Schreier, H.W. Image Correlation for Shape, Motion and Deformation Measurements—Basic Concepts, Theory and Applications; Springer: New York, NY, USA, 2009. [Google Scholar]
- Castillo, E. Extreme Value Theory in Engineering; Academic Press INC: San Diego, CA, USA, 1988. [Google Scholar]
- Castillo, E.; Hadi, A.S.; Balakrishnan, N.; Sarabia, J.M. Extreme Value and Related Models with Applications in Engineering and Science; Wiley: New York, NY, USA, 2005. [Google Scholar]


Publisher’s Note: MDPI stays neutral with regard to jurisdictional claims in published maps and institutional affiliations. |
© 2022 by the authors. Licensee MDPI, Basel, Switzerland. This article is an open access article distributed under the terms and conditions of the Creative Commons Attribution (CC BY) license (https://creativecommons.org/licenses/by/4.0/).