Article

Warming Responses of Leaf Morphology Are Highly Variable among Tropical Tree Species

by
Aloysie Manishimwe
1,2,*,
Bonaventure Ntirugulirwa
1,2,3,4,
Etienne Zibera
5,
Brigitte Nyirambangutse
1,6,
Myriam Mujawamariya
1,2,
Mirindi E. Dusenge
2,7,
Elias Bizuru
1,
Donat Nsabimana
5,
Johan Uddling
2 and
Göran Wallin
2,*
1
Department of Biology, College of Science and Technology, University of Rwanda, Avenue de l’Armée, Kigali P.O. Box 3900, Rwanda
2
Department of Biological and Environmental Sciences, University of Gothenburg, P.O. Box 461, SE-405 30 Gothenburg, Sweden
3
Rwanda Agriculture and Animal Resources Development Board, Kigali P.O. Box 5016, Rwanda
4
Rwanda Forestry Authority, Muhanga P.O. Box 46, Rwanda
5
School of Forestry and Biodiversity and Biological Sciences, College of Agriculture, Animal Sciences and Veterinary Medicine, University of Rwanda, Musanze P.O. Box 210, Rwanda
6
Global Green Growth Institute, 19F Jeongdong Building, 21-15 Jeongdon-gil, Jung-gu, Seoul 04518, Korea
7
College of Life and Environmental Sciences, University of Exeter, Exeter EX4 4RJ, UK
*
Authors to whom correspondence should be addressed.
Forests 2022, 13(2), 219; https://doi.org/10.3390/f13020219
Submission received: 9 December 2021 / Revised: 24 January 2022 / Accepted: 28 January 2022 / Published: 1 February 2022
(This article belongs to the Section Forest Ecophysiology and Biology)

Abstract

:
Leaf morphological traits vary along climate gradients, but it is currently unclear to what extent this results from acclimation rather than adaptation. Knowing so is important for predicting the functioning of long-lived organisms, such as trees, in a rapidly changing climate. We investigated the leaf morphological warming responses of 18 tropical tree species with early (ES) abd late (LS) successional strategies, planted at three sites along an elevation gradient from 2400 m a.s.l. (15.2 °C mean temperature) to 1300 m a.s.l. (20.6 °C mean temperature) in Rwanda. Leaf size expressed as leaf area (LA) and leaf mass per area (LMA) decreased, while leaf width-to-length ratio (W/L) increased with warming, but only for one third to half of the species. While LA decreased in ES species, but mostly not in LS species, changes in LMA and leaf W/L were common in both successional groups. ES species had lower LMA and higher LA and leaf W/L compared to LS species. Values of LMA and LA of juvenile trees in this study were mostly similar to corresponding data on four mature tree species in another elevation-gradient study in Rwanda, indicating that our results are applicable also to mature forest trees. We conclude that leaf morphological responses to warming differ greatly between both successional groups and individual species, with potential consequences for species competitiveness and community composition in a warmer climate.

Graphical Abstract

1. Introduction

Structural, chemical and physiological leaf traits have a decisive influence on the productivity of plants and their ecosystems [1,2]. Leaf morphological traits, such as leaf mass per unit area (LMA), leaf size and shape, influence the interception of light and the exchange of gases and energy between plants and the atmosphere, thereby controlling plant photosynthesis, transpiration and leaf temperature [3,4,5,6]. While it is well known that leaf traits are adapted to the environment where the species occur, the possibility to acclimate these traits to altered environmental conditions is crucial to the success with which plants and their ecosystems will respond to climate change [7,8,9].
LMA is one of the key traits of the leaf economics spectrum [1,10], used to assess the adaptation and acclimation of plants to environmental conditions [11,12,13,14]. LMA responds to environmental factors, such as light, temperature, water and nutrient availability [15,16]. It is also associated with functional leaf traits, such as leaf nutrient contents, photosynthesis and leaf respiration [17,18,19,20]. In controlled experiments, it is generally observed that LMA decreases with rising temperature, while it increases with drought [21]. Thus, the two most important climate change factors will act on LMA in opposite directions.
LMA responds to environmental factors through changes in both leaf density (LD) and leaf volume per area (LVA), the latter being directly proportional to leaf thickness (LT) in broad-leaved taxa [21,22,23,24]. High LVA is associated with a large number of cell layers (palisade and spongy parenchyma) and a large volume of intercellular air spaces, while high LD is a result of leaf tissues with high mass density (i.e., palisade parenchyma, vascular) and low proportion of epidermis, air spaces and overall smaller cells [22]. The observed decrease in LMA under high temperature and water and nutrient availability was mostly attributed to changes in LD rather than in LVA [21], whereas the increase in LMA under drought conditions was mostly due to increased LVA [21,25]. Choong et al. [26] reported that LVA contributes more than LD to variations in the LMA of tropical tree species, regardless of which environmental factor is causing these changes. Moreover, it was reported that a given change in temperature has a larger effect on LMA in tropical species compared to boreal species [21]. However, due to general scarcity of data and large-scale manipulative warming experiments in the tropics, the climate change responses of LMA and its underlying components, LD and LVA, remain highly uncertain for tropical tree species [21,27,28].
Elevation gradients can be used to investigate climate change effects under ecologically realistic conditions [29]. In such studies, LMA has been found to increase with elevation [13]. However, LMA also increases with tree height [30], which in turn declines with increasing elevation [31]. Moreover, while LMA and area-based leaf nitrogen (N) and phosphorous (P) content are positively correlated in global datasets [1,18,32], elevational trends in leaf N and P content are mixed, showing increases or no change in spite of consistent LMA increases [33,34,35,36,37]. These inconsistent global patterns and elevational trends of LMA with other factors complicate causal interpretations. Furthermore, most past studies along elevation gradients have investigated different species at different elevations and thus cannot distinguish between plastic acclimation and inherent differences among species and ecotypes. This could be resolved in semi-experimental elevation-gradient approaches with the same plant material planted at different elevations.
Leaf size and shape influences leaf energy balance, and size correlates with stomatal conductance [8,38], carbon assimilation rates and productivity [3,39]. Small and narrow leaves have thinner leaf boundary layers, and thus, more efficient heat dissipation, leading to lower leaf temperatures and heat stress under sunny and hot conditions [40,41,42,43]. Leaf size varies with environmental factors, such as light, water availability and temperature, along latitudinal and altitudinal gradients. Large leaves are found in wet and hot environments towards the equator, while small leaves are common where arid and hot environments are combined, and at high latitudes and elevations [44]. These conflicting influences of temperature and drought on leaf size make it difficult to predict the net effect on leaf size in areas such as the tropics, where both factors are likely to increase in intensity in a changing climate. Generally, observed declines in leaf size with increasing elevation are driven by variation in both precipitation and temperature, but more so with the former [45,46]. In addition, there were significant spatial patterns in leaf shape, i.e., leaves became shorter and rounder towards cooler climates [44,46,47].
Tropical forests, including tropical montane forests (TMF), are characterized by dynamic mixed successional stages, including early (ES), intermediate and late (LS) successional groups [48,49,50]. The shift in strategies (acquisitive versus conservative) is driven by changes in environmental conditions (e.g., light and water availability) during succession [51]. The resource-acquisition strategy of ES species is characterized by resource acquisition, carbon gain and fast growth, while LS species typically grow slower and use available resources more efficiently under unfavourable conditions (e.g., drought, shade) [52,53,54]. Previous experiments with tropical trees have indicated that ES species respond more favourably (or less negatively) to warming than LS species. This has been shown for plant growth [55] as well as for photosynthesis [56]. The plasticity of leaf traits, including LMA, in changes in light environment is also thought to be greater in ES compared to LS species [57]. Whether or not leaf morphological traits also show larger acclimation capacity to warming in tropical ES compared to LS species remains unknown. Furthermore, leaf morphology may also change with ontogenetic development, i.e., between juvenile and mature trees. LMA is normally higher in mature compared to juvenile trees [21], while leaf size is more ontogenetically variable [58]. Whether there are differences in leaf morphological responses to warming between young and mature trees remains to be investigated.
The East African region, with high mountains and great lakes, located between the monsoon domain of West Africa and the Indian ocean [59], faces some of the largest interannual rainfall variations in the world [60]. It is projected that precipitation extremes will increase between 2030 and 2052 in Sub-Saharan Africa and that East Africa will experience increases in precipitation in some regions and decreases in others [61]. Warming projections for the region exceed the global projection of 2 °C above pre-industrial levels by the end of the century [61,62]. In the future, these shifts in seasonal variations in rainfall and temperature are likely to affect tree species composition, phenological patterns (i.e., deciduous vs. evergreen) and carbon balance of tropical forests [63].
Afromontane tropical forests are highly productive and store large amounts of carbon compared to tropical montane forests (TMF) worldwide and to central-east Amazonian tropical lowland forests [64,65,66]. However, they are severely understudied and very little is known on how leaf morphological traits are influenced by climate and how they vary among species and successional strategies. To address this knowledge gap, we explored how leaf morphological traits respond to a warmer climate in a broad range of tropical tree species native to central and east Africa. The main study was conducted on juvenile trees in three multi-species common garden plantations along an elevation gradient. The results from these trees were compared to results from mature trees of the same species growing at different elevations in another elevation gradient. The elevation gradients were used to simulate different global warming scenarios, and the following hypotheses were tested for well-watered trees: (i) LMA decreases at warmer sites, with larger contributions from shifts in LD than from shifts in LVA (leaf thickness); (ii) Leaf size increases at warmer sites; (iii) LMA and leaf size of early successional species are more responsive to warming compared to late successional species; (iv) LMA and leaf size differ between juvenile and mature trees, but the responses to warming are similar.

2. Materials and Methods

2.1. Experimental Sites

This study was conducted during 2018 and 2019 in the TRopical Elevation Experiment in Rwanda (Rwanda TREE; see www.rwandatree.com (9 December 2021)) where 20 tropical tree species native to central and east Africa were grown at three experimental sites located at different elevations to expose the trees to different climates. A step down in the gradient was meant to represent a possible future climate-warming scenario. The sites were: (i) Sigira, high-elevation (HE) site, located in Nyamagabe district at 2°30′54″ S, 29°23′44″ E at the edges of Nyungwe national park in the tropical montane forest (TMF) vegetation zone at 2400 m a.s.l.; (ii) Rubona, mid-elevation (ME) site located in Huye district at 2°28′30.2″ S, 29°46′49.0″ E in the Lake Victoria transitional rainforest (LVTF) vegetation zone at 1600 m a.s.l.; (iii) Makera, low-elevation (LE) site located at Ibanda Makera in Kirehe district at 2°6′31″ S, 30°51′16″ E in the evergreen and semi-evergreen bushland and thicket vegetation zone at 1300 m a.s.l. (Table 1).

2.2. Planting Design and Plant Material

At each site, 18 plots of 15 × 15 m, spaced by 2.5 m paths, were established on a 50 × 102.5 m area where all vegetation was cleared before planting. The 18 plots allowed for a full factorial experimental design, with three water levels and two fertility levels and a replication of three plots for each of the six treatment combinations. However, the treatments started after this study was conducted. Within each plot, 20 different tree species with a replication of 5 (i.e., 100 trees per plot) were planted using 1.5 × 1.5 m spacing. The positions of trees and species inside plots were randomized.
In this study, 18 tree species were included, representing early (ES) and late (LS) successional strategies, as well as TMF and LVTF vegetation zone origins as follows: 5 ES/TMF, 5 LS/TMF, 5 ES/LVTF and 3 LS/LVTF species (Table 2). Note that, from literature, the classification of two of the species into distinct successional groups is ambiguous (Table 2), but according to our assessment Ficus thonningii Blume and Markhamia lutea (Benth.) K.Schum belong mostly to LS and ES groups, respectively, and therefore we will use that classification in this study.
The trees were propagated from seeds, cuttings or wildlings, depending on species-specific difficulties of propagation, in poly-pots in a nursery at Rubona research station during 2017. The germplasms were collected from Nyungwe TMF (high-elevation), or Rubona research station located in the LVTF vegetation zone (mid-elevation), depending on main species distribution range. After six to twelve months in the nursery and having reached a height of ~10–75 cm, depending on species, each plant was randomly assigned to site, plot and plot position (as constrained by the experimental design) and transplanted to the experimental plots within a period of approximately one month at the turn of the year from 2017 to 2018. All tree species received water when needed, irrespective of the planned water treatment, especially during the first dry periods in 2018.

2.3. Environmental Conditions

Weather stations were installed at all three Rwanda TREE sites to record ambient air and soil temperature, relative humidity, precipitation, solar radiation, soil water content, and wind speed and direction at a frequency of 30 min. The recording of most parameters started late January 2018, while wind and soil measurements started late August 2018 (Table 1). Soil temperature and water content sensors were installed in the center of 6 selected plots at each site, while other parameters were measured in an open area next to the plantations. The mean air temperatures (MAT), measured at 1.8 m above ground during the study period at the HE-site (Sigira), ME-site (Rubona) and LE-site (Makera) were 15.2, 20.0 and 20.6 °C, respectively. The daytime and extreme temperatures (expressed as 99%ile) were 17.1/23.1 °C at HE-site, 22.4/28.4 °C at ME-site and 24.0/31.2 °C at LE-site. The main reason for the larger difference in the daytime and extreme temperatures compared to MAT between the ME and LE sites was the larger difference between daytime and nighttime temperatures at the LE site. The sites also differed substantially in mean annual precipitation (MAP), decreasing progressively from HE (Sigira, c. 2100 mm) to ME (Rubona, c. 1700 mm) and LE (Makera c. 1100 mm; Table 1) sites. However, the relative seasonal distribution of precipitation was similar at all sites, with the highest rainfall in March–May and a dry period in June–August. Solar radiation was similar at ME and LE sites while the HE-site received less radiation, probably due to higher cloudiness. Soil temperatures were closely related to the site MAT, although it was probably also affected by radiation and canopy cover. Soil water content (SWC) was similar at LE and ME sites in spite of different MAP. The mean SWC at HE was substantially higher compared to the two other sites, probably because of both higher MAP and higher water-holding capacity due to higher soil clay content (Table 1).
In November 2017, previous to the planting of the trees, soil samples were collected at 0–10 cm and 20–30 cm depth in each plot. Soil bulk density (SBD), NH4+, NO3 and available P were analysed from composite samples of paired plots (→ 9 samples per site), while the remaining soil parameters were analysed from composite samples of six plots (→ 3 samples per site). All values presented here are averages for 0–30 cm soil depth (Table 1). The main soil texture differences between sites were a larger proportion of sand and less silt at ME site (Rubona, 53–62% and 5–9%, respectively) compared to the soil at HE (Sigira) and LE (Makera) sites (35–45% and 15–27%, respectively) while the clay content was relatively high at all sites (30–50%). The soil pH (water) was 4.2 at the HE-site and increased with approximately one unit for each step down the elevation gradient. Soil fertility expressed as total N and P content tended to decrease with decreasing elevation.

2.4. Leaf Sampling and Morphological Traits Measurements

Leaves or leaflets were collected in two campaigns (August to December 2018 and June to August 2019). For species with compound leaves (Table 2), only leaflets were sampled but for simplicity, we will denote them as leaves. In the first campaign, two randomly selected trees per species and plot were sampled, while one tree per plot and species was generally selected in the second campaign. However, for some species and plots, one additional tree was sampled during the second campaign, but sampling was always balanced between sites. Only plot averages were used for statistical analysis of site effects. In each campaign, one or more (2–3 from species with small leaves) mature and sun-exposed leaves from the upper half of the tree crown were sampled from each selected tree, resulting in: 1 sample * 2 trees * 18 plots * 18 species * 3 sites = 1944 leaves in 2018 and 1 sample * 1 tree * 18 plots * 18 species * 3 sites + 190 extra samples = 1162 leaves in 2019, giving a total number of 3106 leaf samples.
Leaf length (LL), leaf width (LW) and leaf thickness (LT, only in 2019 campaign) were measured directly after leaf collection, using a ruler and an electronic calliper (resolution 0.01 mm). Three to five leaf discs of known diameter (18 mm or 10 mm, depending on the size of the leaf) per leaf and tree were sampled using punchers. First- and second-order veins were avoided for LT measurements, as well as first-order veins for sampling of discs. For species with narrow leaves (Afrocarpus falcatus (Thunb.) C.N.Page and Faurea saligna Harv.) discs were not taken; instead, a photo was taken of the whole leaf next to a ruler for subsequent leaf-area determination. Both discs and photographed leaves and the remaining leaf material were brought in separate envelopes to the laboratory for later determination of LMA and nutrient contents, respectively.

2.5. Leaf Shape and Size Estimation

Leaf shape was determined as LW to LL ratio (leaf W/L ratio) and leaf size was expressed as leaf area (LA) and estimated from LW and LL using an allometric function:
LA = LW   ×   LL   ×   K
where K is the leaf-area factor, also known as the Montgomery parameter [69]. Species-specific K-values were determined for the 18 species based on 20 leaves of varied sizes collected from each species at the ME site (Rubona) in June 2020. Collected leaves were scanned in a flatbed scanner (CanonScan LiDE300, Canon Inc., Tokyo, Japan) and thereafter the LA, LL and LW were analysed using ImageJ software 1.50i (Rasband, W.S., U. S. National Institutes of Health, Bethesda, MD, USA). Petioles and petiolules were excluded from the measurements. The K-values were obtained by regression analysis of LA versus LW*LL, setting the intercept to zero. Independent of fixed or variable intercept, the R2 values obtained were 0.97–0.99, except for the two species with the largest and lowest LW to LL ratio, where the R2 values were 0.93 (Dombeya torrida (J.F.Gmel.) Bamps) and 0.89 (A. falcatus), respectively. The K-values among species varied between 0.66 and 0.85 (Table 2) and were used to estimate the LA of all sampled leaves.

2.6. Determination of LMA, LD and LVA

Each collected leaf disc or photographed leaf sample was oven-dried at 70 °C for at least 48 h and then weighed using a laboratory balance with 0.1 mg resolution. The area, width and length of the photographed leaves were determined using ImageJ software 1.50i. Total projected areas of discs or photographed leaves were used to calculate LMA [70]. Leaf area (LA) and leaf thickness (LT) were used to calculate leaf volume per area (LVA), while leaf mass (LM), LA and LT were used to calculate leaf density (LD) as follows:
LMA   = LM LA
LVA = LA · LT LA
LD = LM LA · LT  
The following units are used throughout the paper: Leaf size (LA), cm−2, LMA, g m−2, LVA, cm−3 m−2, LD g cm−3).

2.7. Leaf Nutrients Analysis

Composite samples of leaves (from six plots into one sample per species and site, constituting one block) were oven-dried at 70 °C for at least 48 h, and thereafter ground into a fine powder with a ball mill grinder (MM 301, MM 200, Retsch, Germany). Mass-based leaf nitrogen (NM) content was analysed using an elemental analyser (EA 1108, Fison Instruments, Rodano, Italy). Ground samples were sent for analysis of 37 non-N elements using inductively coupled plasma mass spectrometry after digestion in HNO3 and then aqua regia (Method VG101, Bureau Veritas Mineral laboratories, Vancouver, BC, Canada). Out of these non-N elements, only data for mass-based leaf phosphorus (PM) are reported. The mass-based leaf nutrients were converted to area-based contents (NA and PA) by multiplying with LMA.

2.8. Comparison of Juvenile Planted Trees with Mature and Natural Regenerated Trees

The leaf size and LMA of two ES species (Macaranga Kilimandscharica Pax and Polyscias fulva (Hiern) Harms) and two LS species (Carapa grandiflora Sprague and Syzygium guineense (Willd.) DC) in this study were compared to values obtained from two other studies on mature trees in south-west Rwanda: (i) an elevation gradient with five sites ranging 1700–2700 m a.s.l. [71] and (ii) 11 permanent monitoring plots in Nyungwe TMF [66].
In the mature-tree elevation-gradient study, leaves from trees with an average diameter at breast height (DBH) of 22–32 cm for all species and a total range from 8 to 82 cm were collected in three campaigns: (i) February–March 2017; (ii) September 2017 and (iii) January–February 2018. The leaves were collected at five sites along the elevation gradient with Nyungwe Bigugu Mountain (~2700 m) being the highest and coolest site, followed by Nyungwe East (~2500 m), Nyungwe West (~1950 m), Cyamudongo (1800–1900 m) and the Ruhande Arboretum (1700 m). The three highest sites are located in Nyungwe National Park (TMF) while the Cyamudongo site is located in the adjacent Cyamudongo forest (TMF/LVTF) and Ruhande Arboretum (LTVF), close to Huye town. In total, 1080 leaf samples were collected: 3 leaves * 6 trees * 4 species * 5 sites * 3 campaigns. For detailed information, see [71].
For the Nyungwe TMF permanent plots, leaves were collected from trees of all species having an average DBH of 31–51 cm for all species and a total range of 7 to 96 cm during September–December 2013 and February–April 2015. The leaves were collected from 11 out of 15 permanent plots along a 32 km east–west transect at an elevation ranging between 1950 and 2500 m a.s.l established during late 2011 and early 2012. In total, 445 leaf samples were collected: 5 leaves * 89 trees. For detailed information about the plots, see [66].
All leaf samples were collected from mature and sun-exposed leaves from the upper canopy, following the same protocol for determination of leaf size and LMA as in the Rwanda TREE project.

2.9. Statistics

The site and species effects on variables measured both in 2018 and 2019 (leaf W/L, LA and LMA) were analysed using a mixed linear model, using site and species as fixed between-subject factors and year as within-subject factor (repeated measure). The site and species effects on variables measured in only one year (LVA, LD, NM, NA, PM and PA) were analysed using a general linear model (GLM), using site and species as fixed factors. In both types of analysis, tree height was used as a covariate when it was significant. Since tree height changed with time (Table S3) we used a repeated covariance and applied a first-order autoregressive structure with heterogeneous variance in the mixed model analysis. For significant interactions of year by species and site by species, a one-way ANOVA was used to analyse the site effect on different species individually, with a Bonferroni test for post hoc comparison of individual sites. For species where the response variable was significantly correlated to tree height, a regression analysis with tree height as a covariate was used. The site effect was analysed by using plot means (18 per site) as replicates for morphological parameters, while block means (3 per site, i.e., 6 plots per block) for each species were used as replicates for nutrient parameters. To test for the differences between successional groups at the HE (control) site, a one-way ANOVA (repeated measure if both years was included) was used. Site means of each species were used as replicates within the early (10 species) and late (8 species) successional groups. The effect of tree age (juvenile trees in this study compared to mature trees from other studies) on LA and LMA was tested for a common elevation of 2000 m a.s.l., using a GLM with elevation as covariate and tree age as a fixed factor. The significance of the relationship between LMA or LA versus elevation was tested using regression analysis. A test of normality (Shapiro–Wilk) was performed to test the distribution of data, and Levene’s tested for homogeneity of variance. Homogeneity of variance was obtained for analysis of individual species, but not always when all species were analysed together. Effects were considered statistically significant at p < 0.05 if homogeneity of variance was obtained and at p < 0.01 for main effects when homogeneity was not obtained. All statistical tests were made using the SPSS 27.0 software package (SPSS, Inc., Chicago, IL, USA).

3. Results

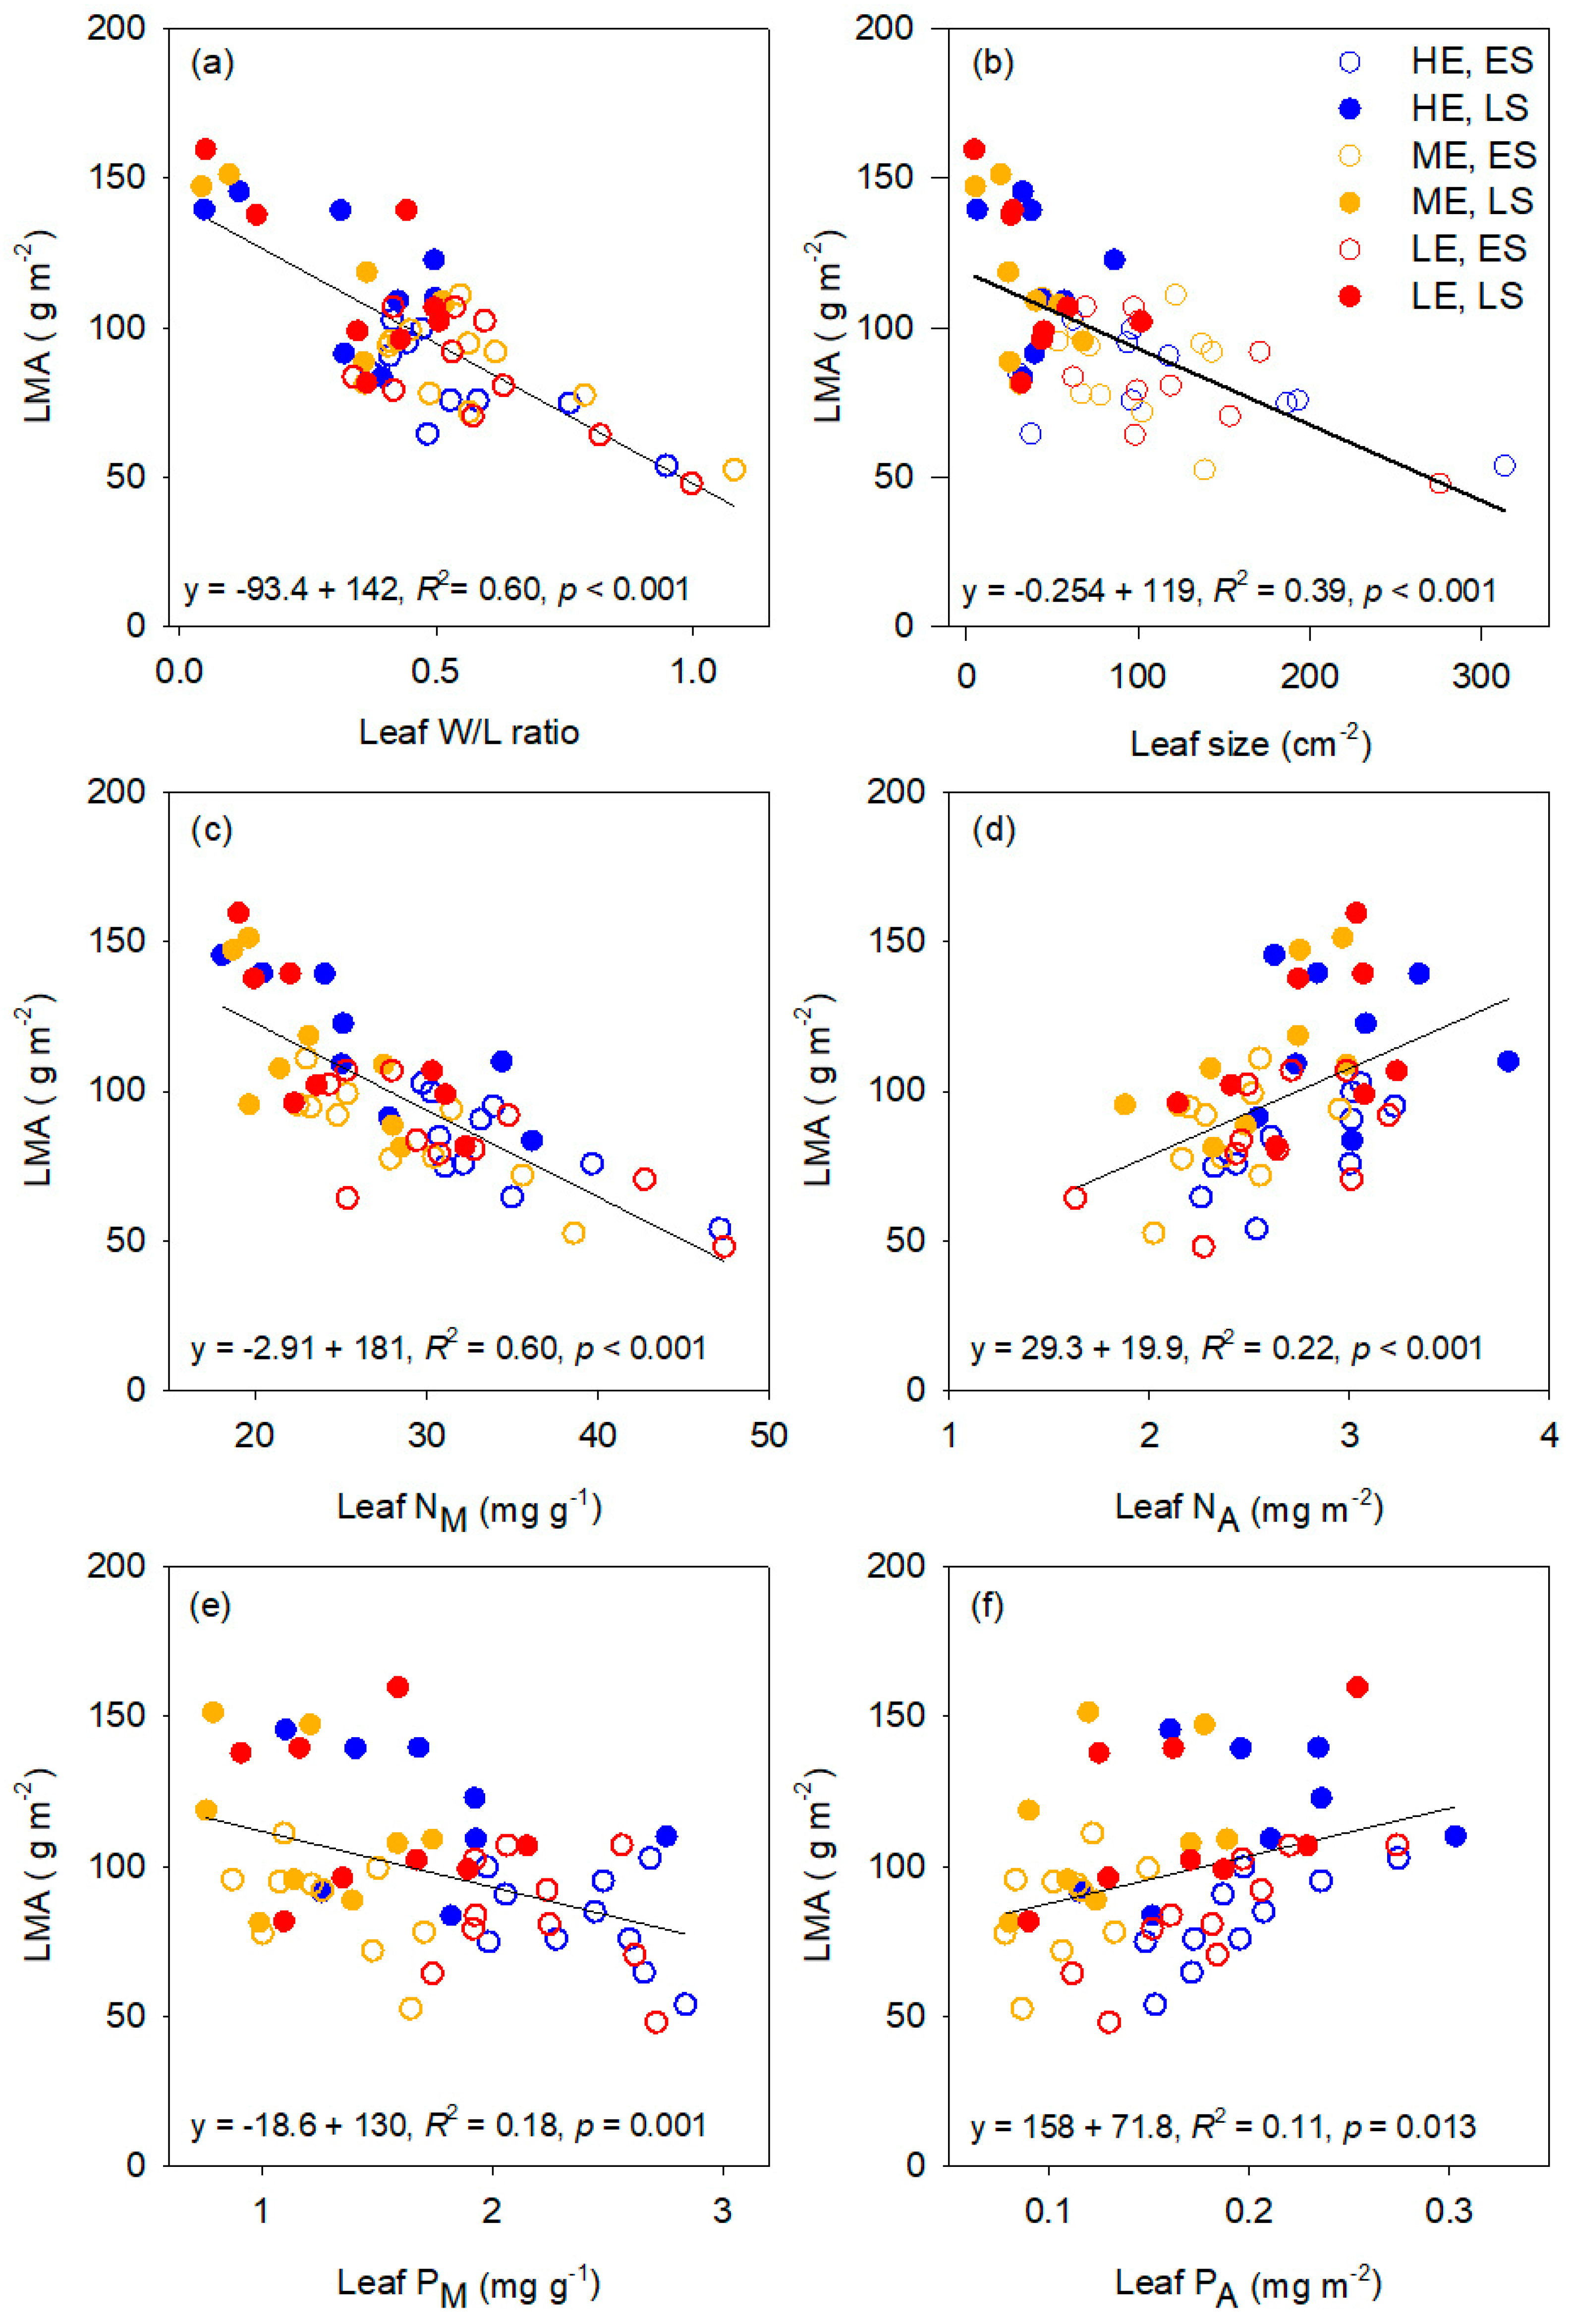
3.1. Leaf Trait Interrelationships and Variation between Species

Leaf size, leaf W/L ratio, LMA, LVA, LD, NM, NA, PM and PA varied greatly across species, as shown for the HE (Sigira) site (Figure 1a–f, Table S1). The difference between the two years was small and only significant for a relatively small difference in LMA within the ES group (11% lower in 2018 compared to 2019). The successional strategy of the species contributed largely to the inter-specific variation, as a significant difference between ES and LS species was observed for most variables except LVA, NA and PA content. In general, ES species had significantly higher leaf W/L ratio, LA, NM and PM, and lower LMA and LD compared to the LS species. D. torrida was often in the extreme position within the ES group while A. falcatus and F. saligna (depending on variable) shared the extreme position within the LS group. The species within a successional group that overlapped with species within the other group were more variable, but F. thonningii, classified as LS species, often had ES features that sometimes even exceeded the range of the ES species (Figure 1a,c,e,f).
The relationships between LMA and LA and other leaf traits were characterized by plotting LMA versus leaf W/L ratio, LA, NM, NA, PM and PA (Figure 2a–f) and LA versus NM (Figure S1). The relationship followed the same pattern at all sites, but here we only present the details from the HE (Sigira) site. LMA decreased significantly with increasing leaf W/L ratio (p < 0.001), LA (p < 0.001), NM (p < 0.001) and PM (p < 0.05), while it increased with increasing NA (p < 0.05) and PA (p < 0.005). These patterns were consistent both within and across successional groups (Figure 2a–f). Leaf size increased significantly with increasing NM across ES species (p < 0.001), while no correlation was observed for LS species (Figure S1).
The degree to which LVA and LD contributed to the variation in LMA was investigated by plotting both the slopes and R2 values of these relationships against each other (Figure 3, Figure S2 and Table S2). Based on these plots, three groups of species were identified where LMA was mostly affected by (i) LVA (4 species), (ii) LD (9 species) or (iii) equally by both LVA and LD (5 species). Species from both successional strategies and both forest types of origin were represented in all three identified groups, suggesting that neither successional strategy nor forest type are main factors for explaining the different influences of LVA and LD on LMA.

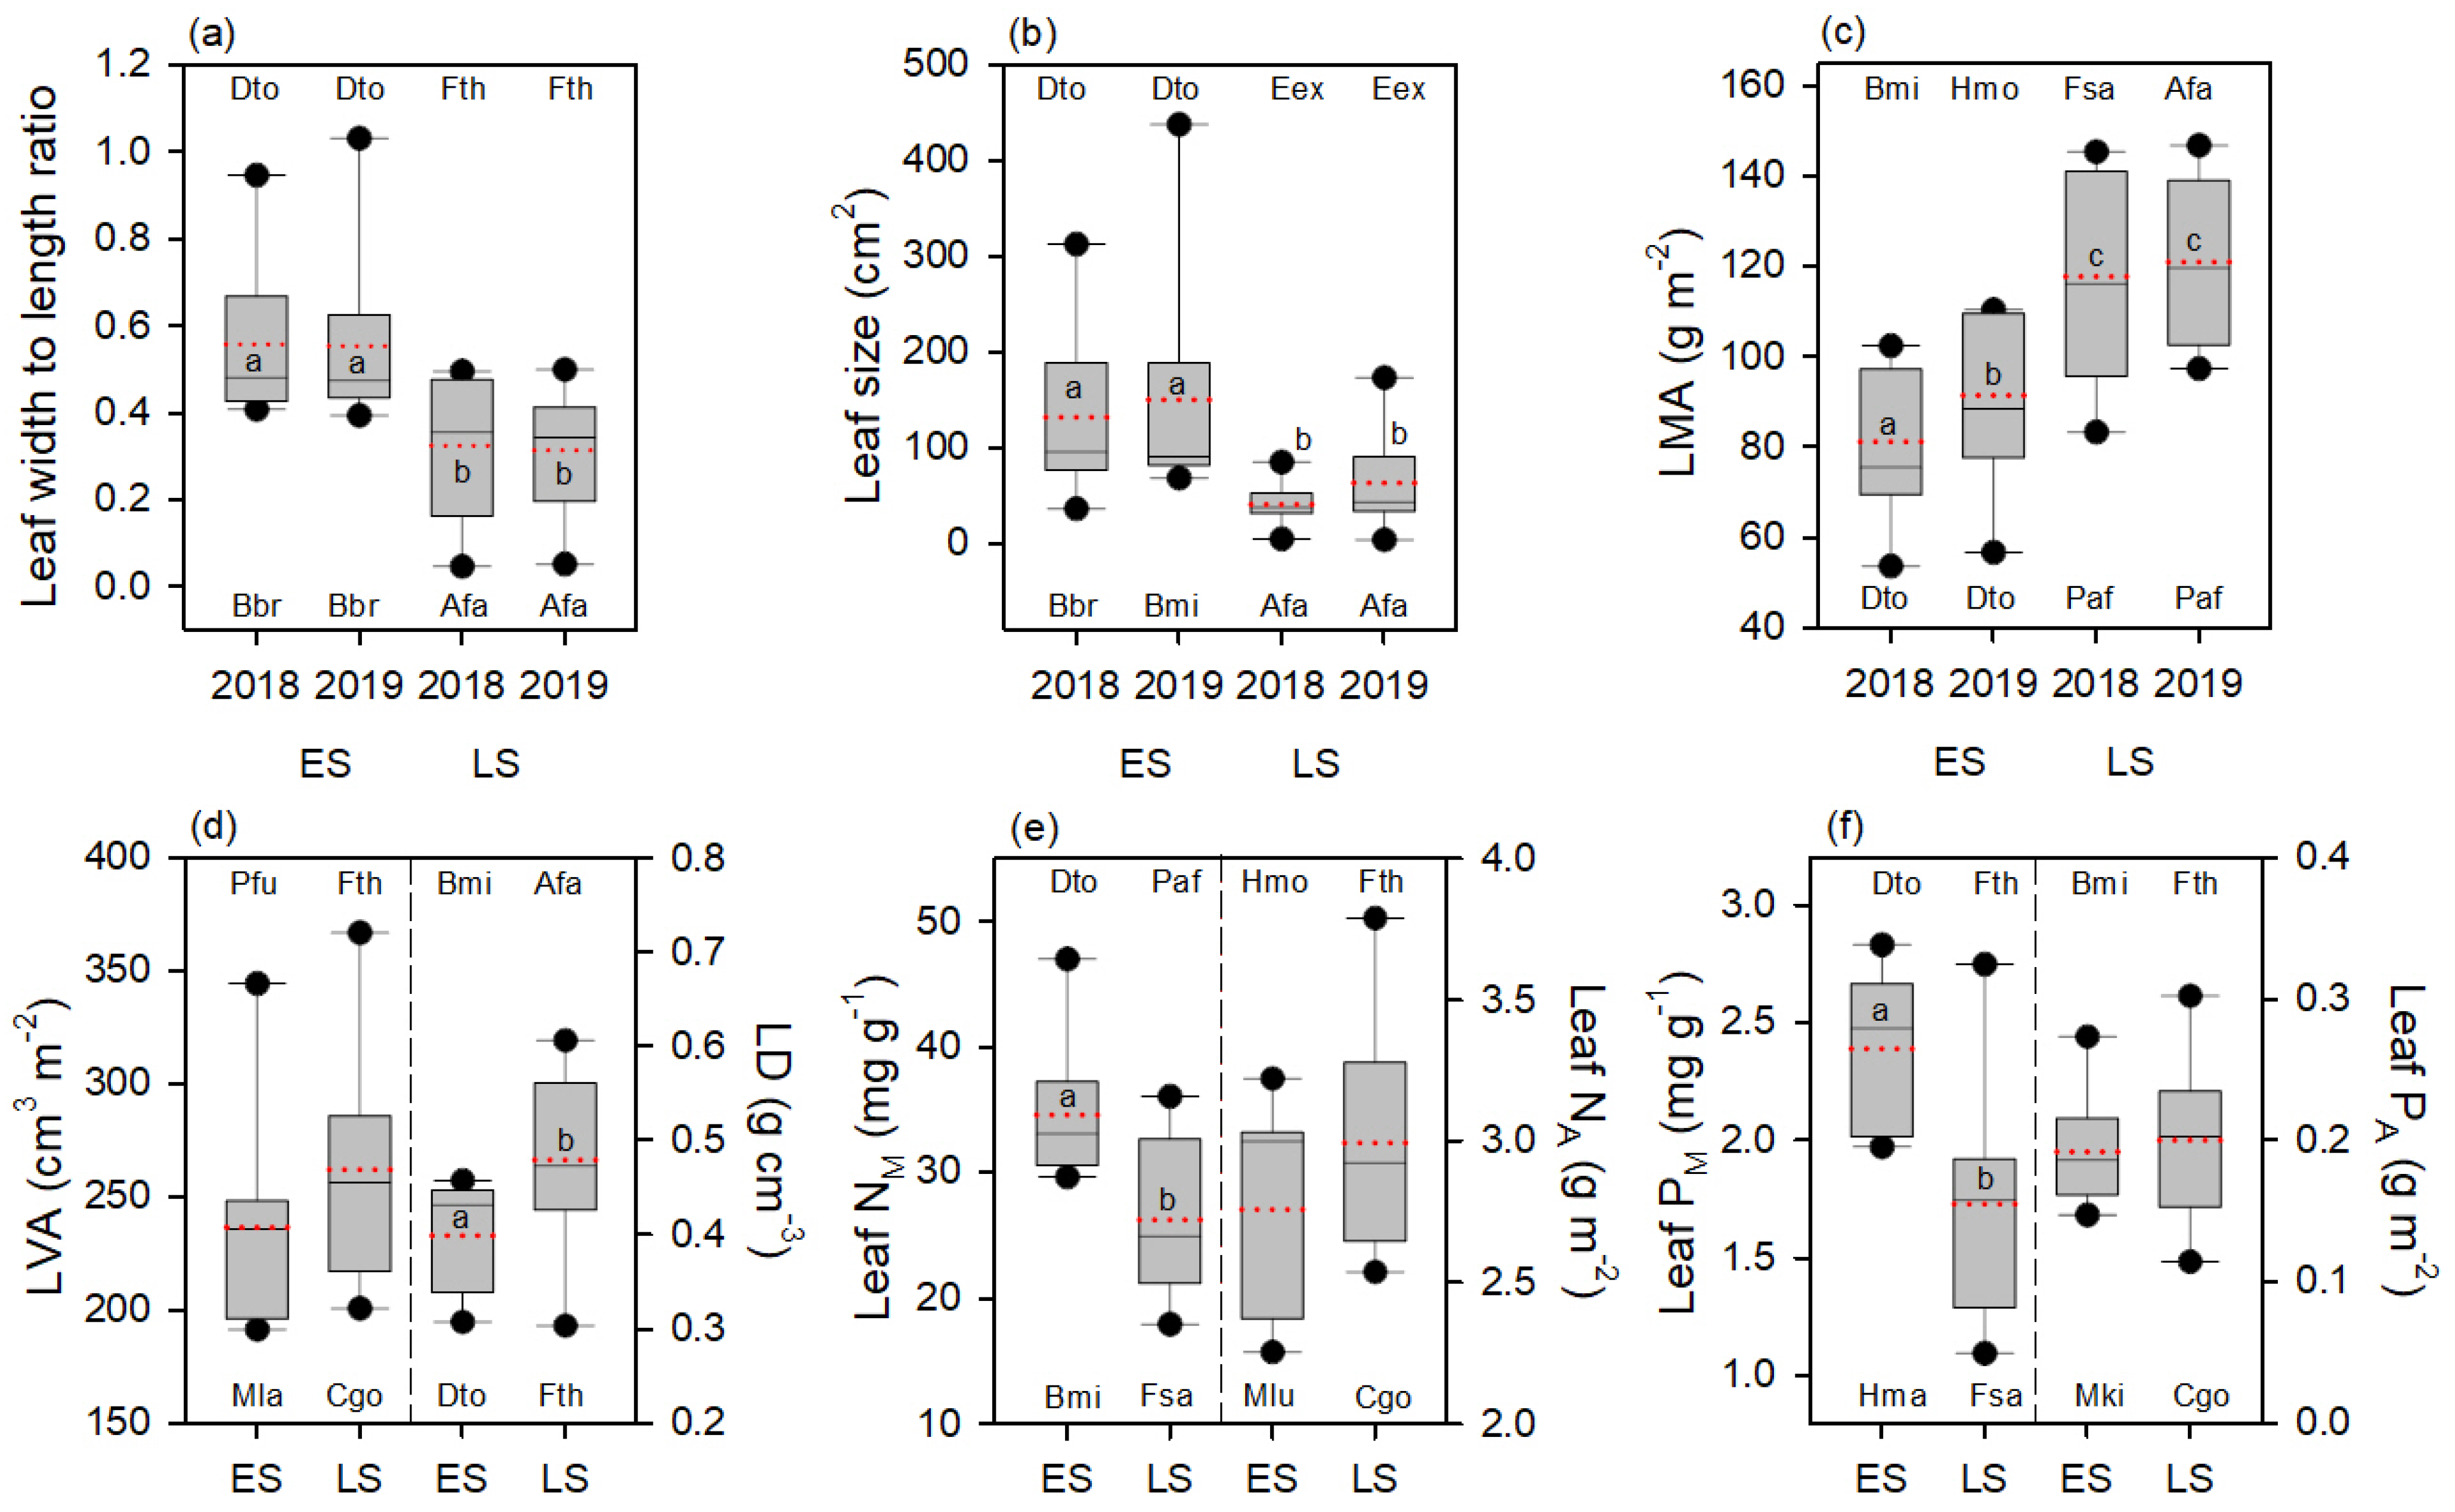
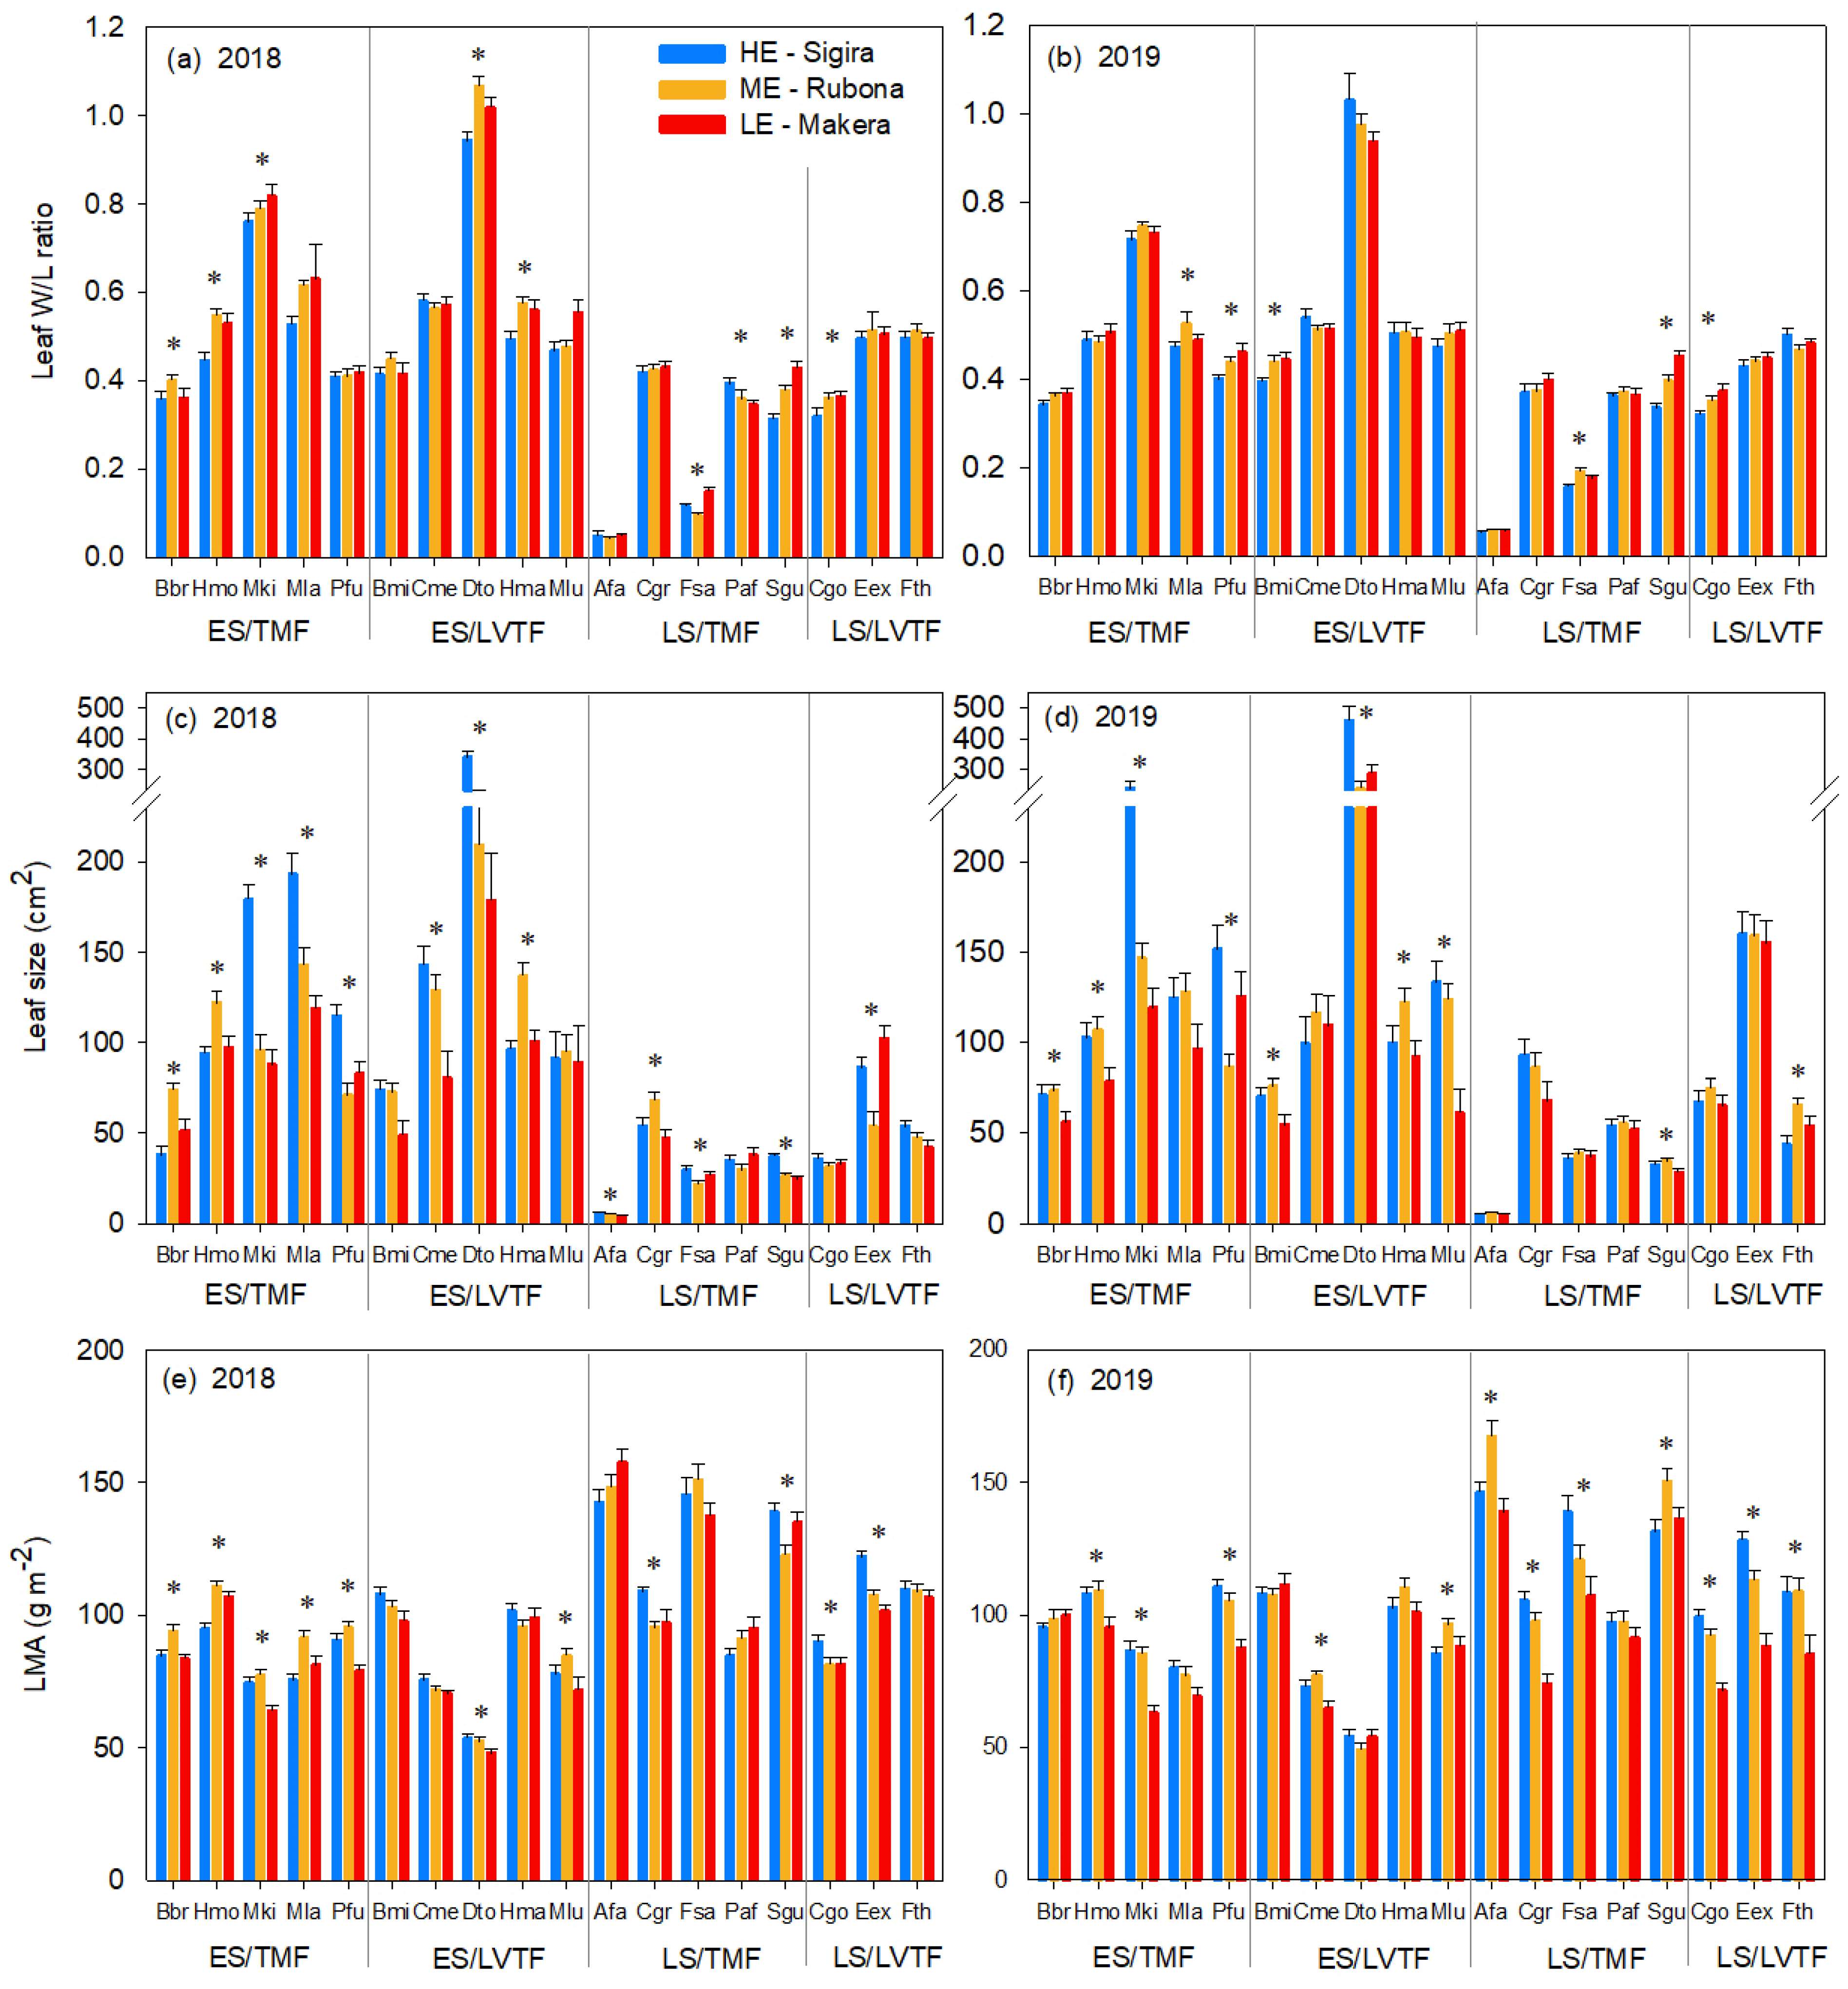
3.2. Leaf Shape, LMA and Leaf Size Responses to Sites and Warming

To separate from possible confounding influences of non-temperature site differences, we defined warming effects as a significant change in the same direction ( increasing or declining effect) at both ME and LE sites compared to HE, or a significant change at LE compared to HE sites but no difference between ME and HE (see Table 3). For species with a decline or increase at ME but not at LE (→ no systematic temperature effect) compared to HE, the change was not attributed to warming.
A significant site effect on leaf shape was observed (Table 4), with leaf W/L ratio being on average 5.4% and 7.5% higher at the warmer ME and LE sites, respectively, compared to the HE site. However, the site effect varied between species as well as between years (Table 4), and therefore the site effect of each species and year was analysed (Table 3, Figure 4a,b). Positive warming effects were observed for four species each year, but only Chrysophyllum gorungosanum Engl and S. guineense were similarly affected in both years. The only negative warming response of leaf W/L ratio was observed for Prunus africana (Hook.f.) Kalkman in 2018. No main site effects were observed for leaf size, LMA or LVA, but LD overall declined at warmer sites (Table 4). However, significant site * species, year * species and/or year * site * species * tree height interactions indicated variable site responses among species and years for LA, LMA, LD and leaf W/L ratio. Therefore, species-specific tests for individual years were conducted (Table 3), with tree height (TH) included as covariate for species where LA and LMA significantly correlated to tree height (Table 3 and Table S3). In 2018 and 2019, significant site effects on LA were observed for 13 and 10 species, respectively, of which seven species declined with warming in each year (Table 3, Figure 4c,d). Declines were more common in ES compared to LS species; five and seven out of the seven species with declines were ES species in 2018 and 2019, respectively. For LMA, significant site effects were observed for 11 and 12 species in 2018 and 2019, respectively, of which six and nine, respectively, declined with increasing warming (Table 3, Figure 4e,f). Contrary to the warming effects on LA, the effects on LMA were relatively evenly mixed between ES and LS species. A significant increase by warming was only observed for LMA of Harungana montana Spirlet in 2018 (Table 3). Although no significant main site effects were observed for LA and LMA, the across species average decreased with 23 and 35% for LA and 4.4 and 17.5% for LMA at the ME and LE sites, respectively, when compared to the HE site.
The soil content of N and P (Table 1), as well as both mass- and area-based leaf N and P content, differed significantly between sites (Table 4). Linear regressions were used to test if these site differences of leaf N and P content could explain the site and ‘warming’ effect on LMA and leaf size (Figures S4 and S5). The only significant effect observed was a positive relationship between the LMA effect size and PA effect size when the LE site (Makera) was compared to the HE site (Sigira). Since the PA effect size was more negative at the ME site compared to LE site, while the opposite was true for LMA, it is not likely that variable leaf PA could explain the warming effect.

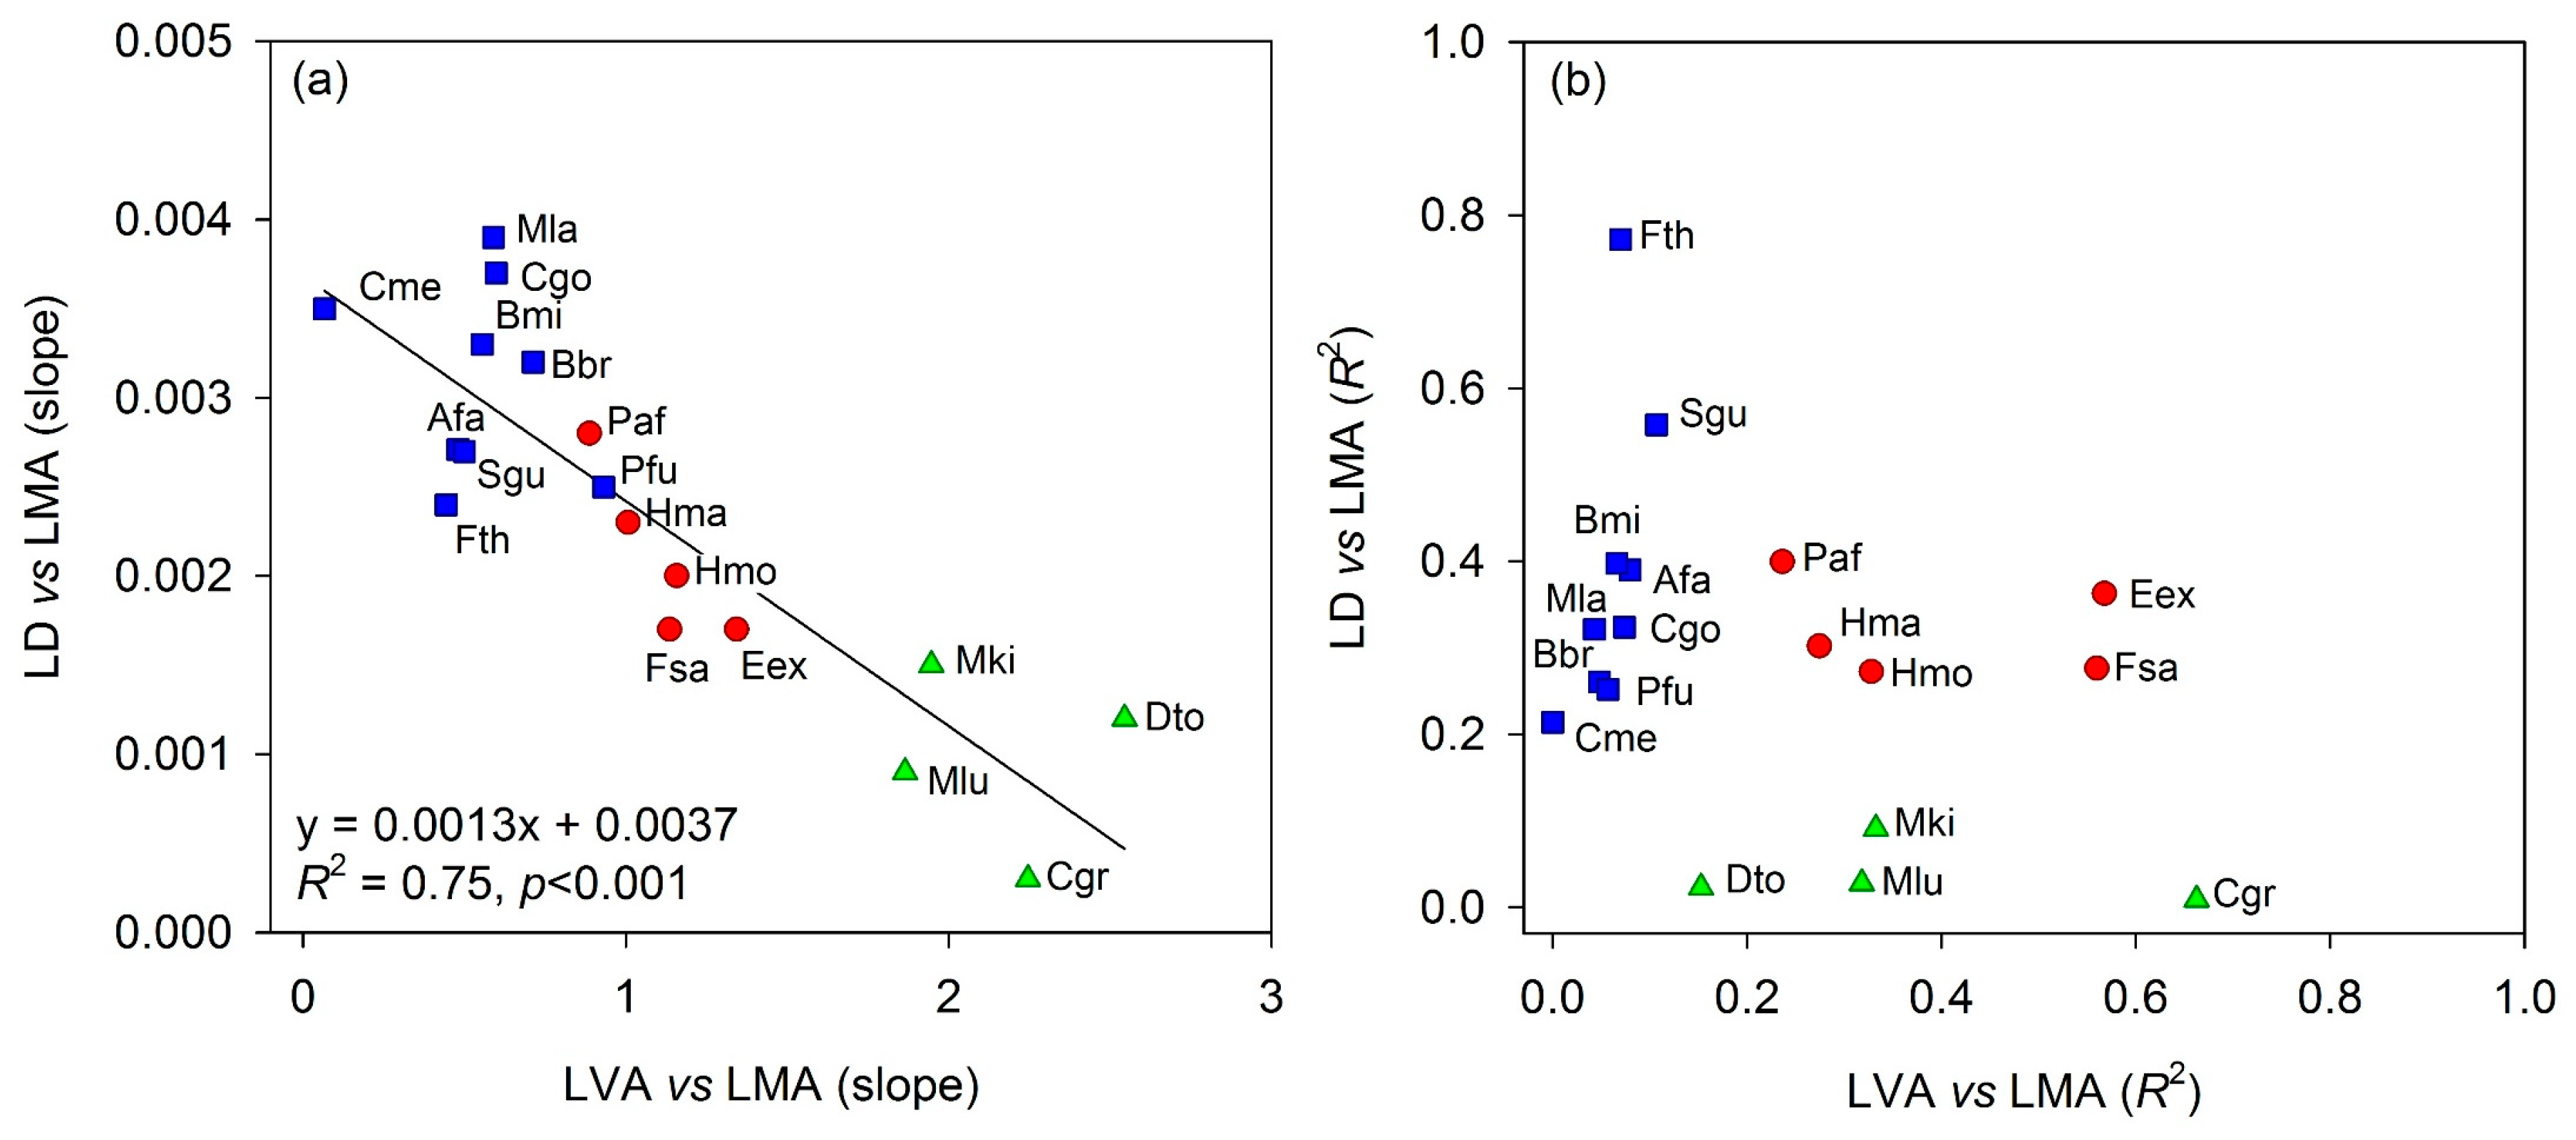
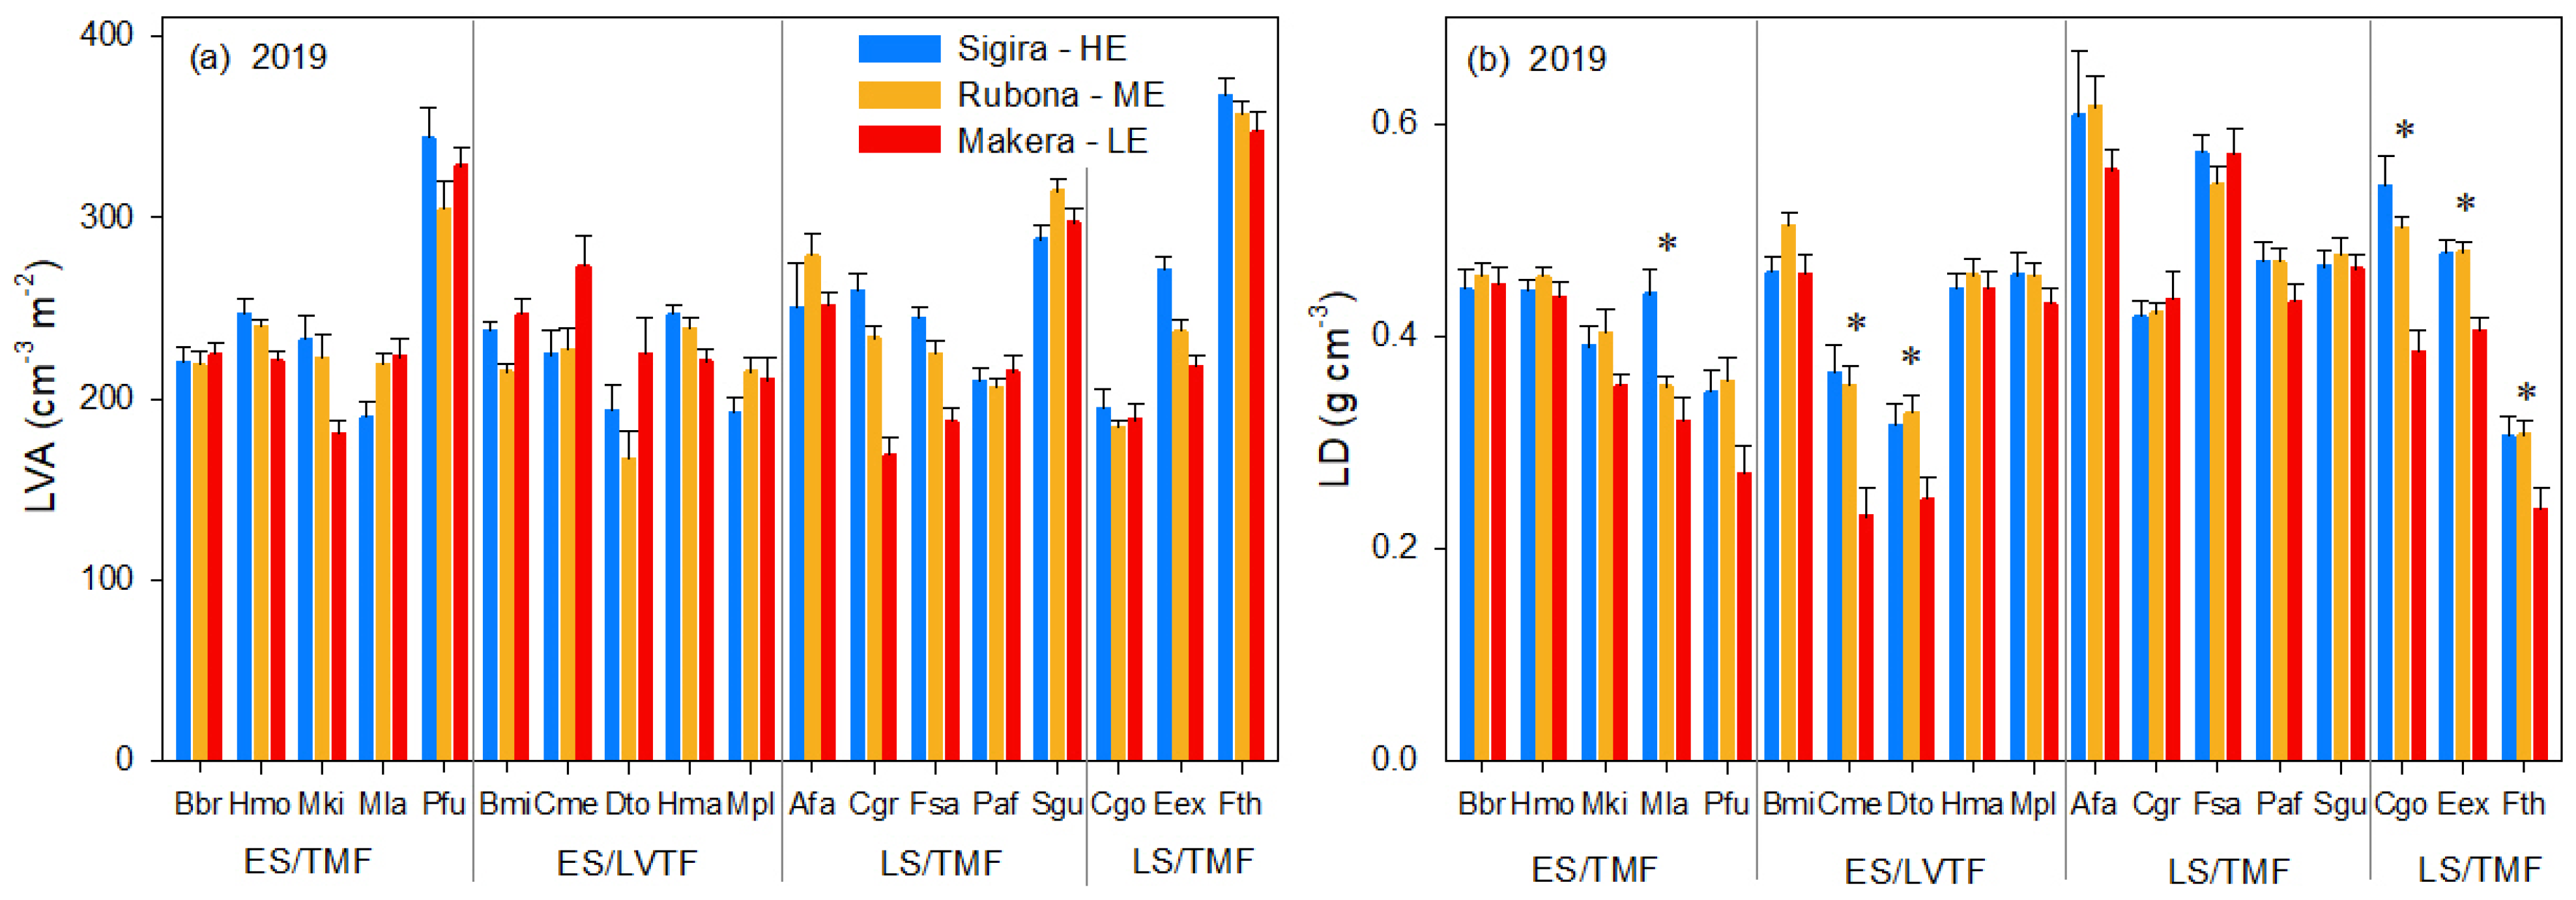
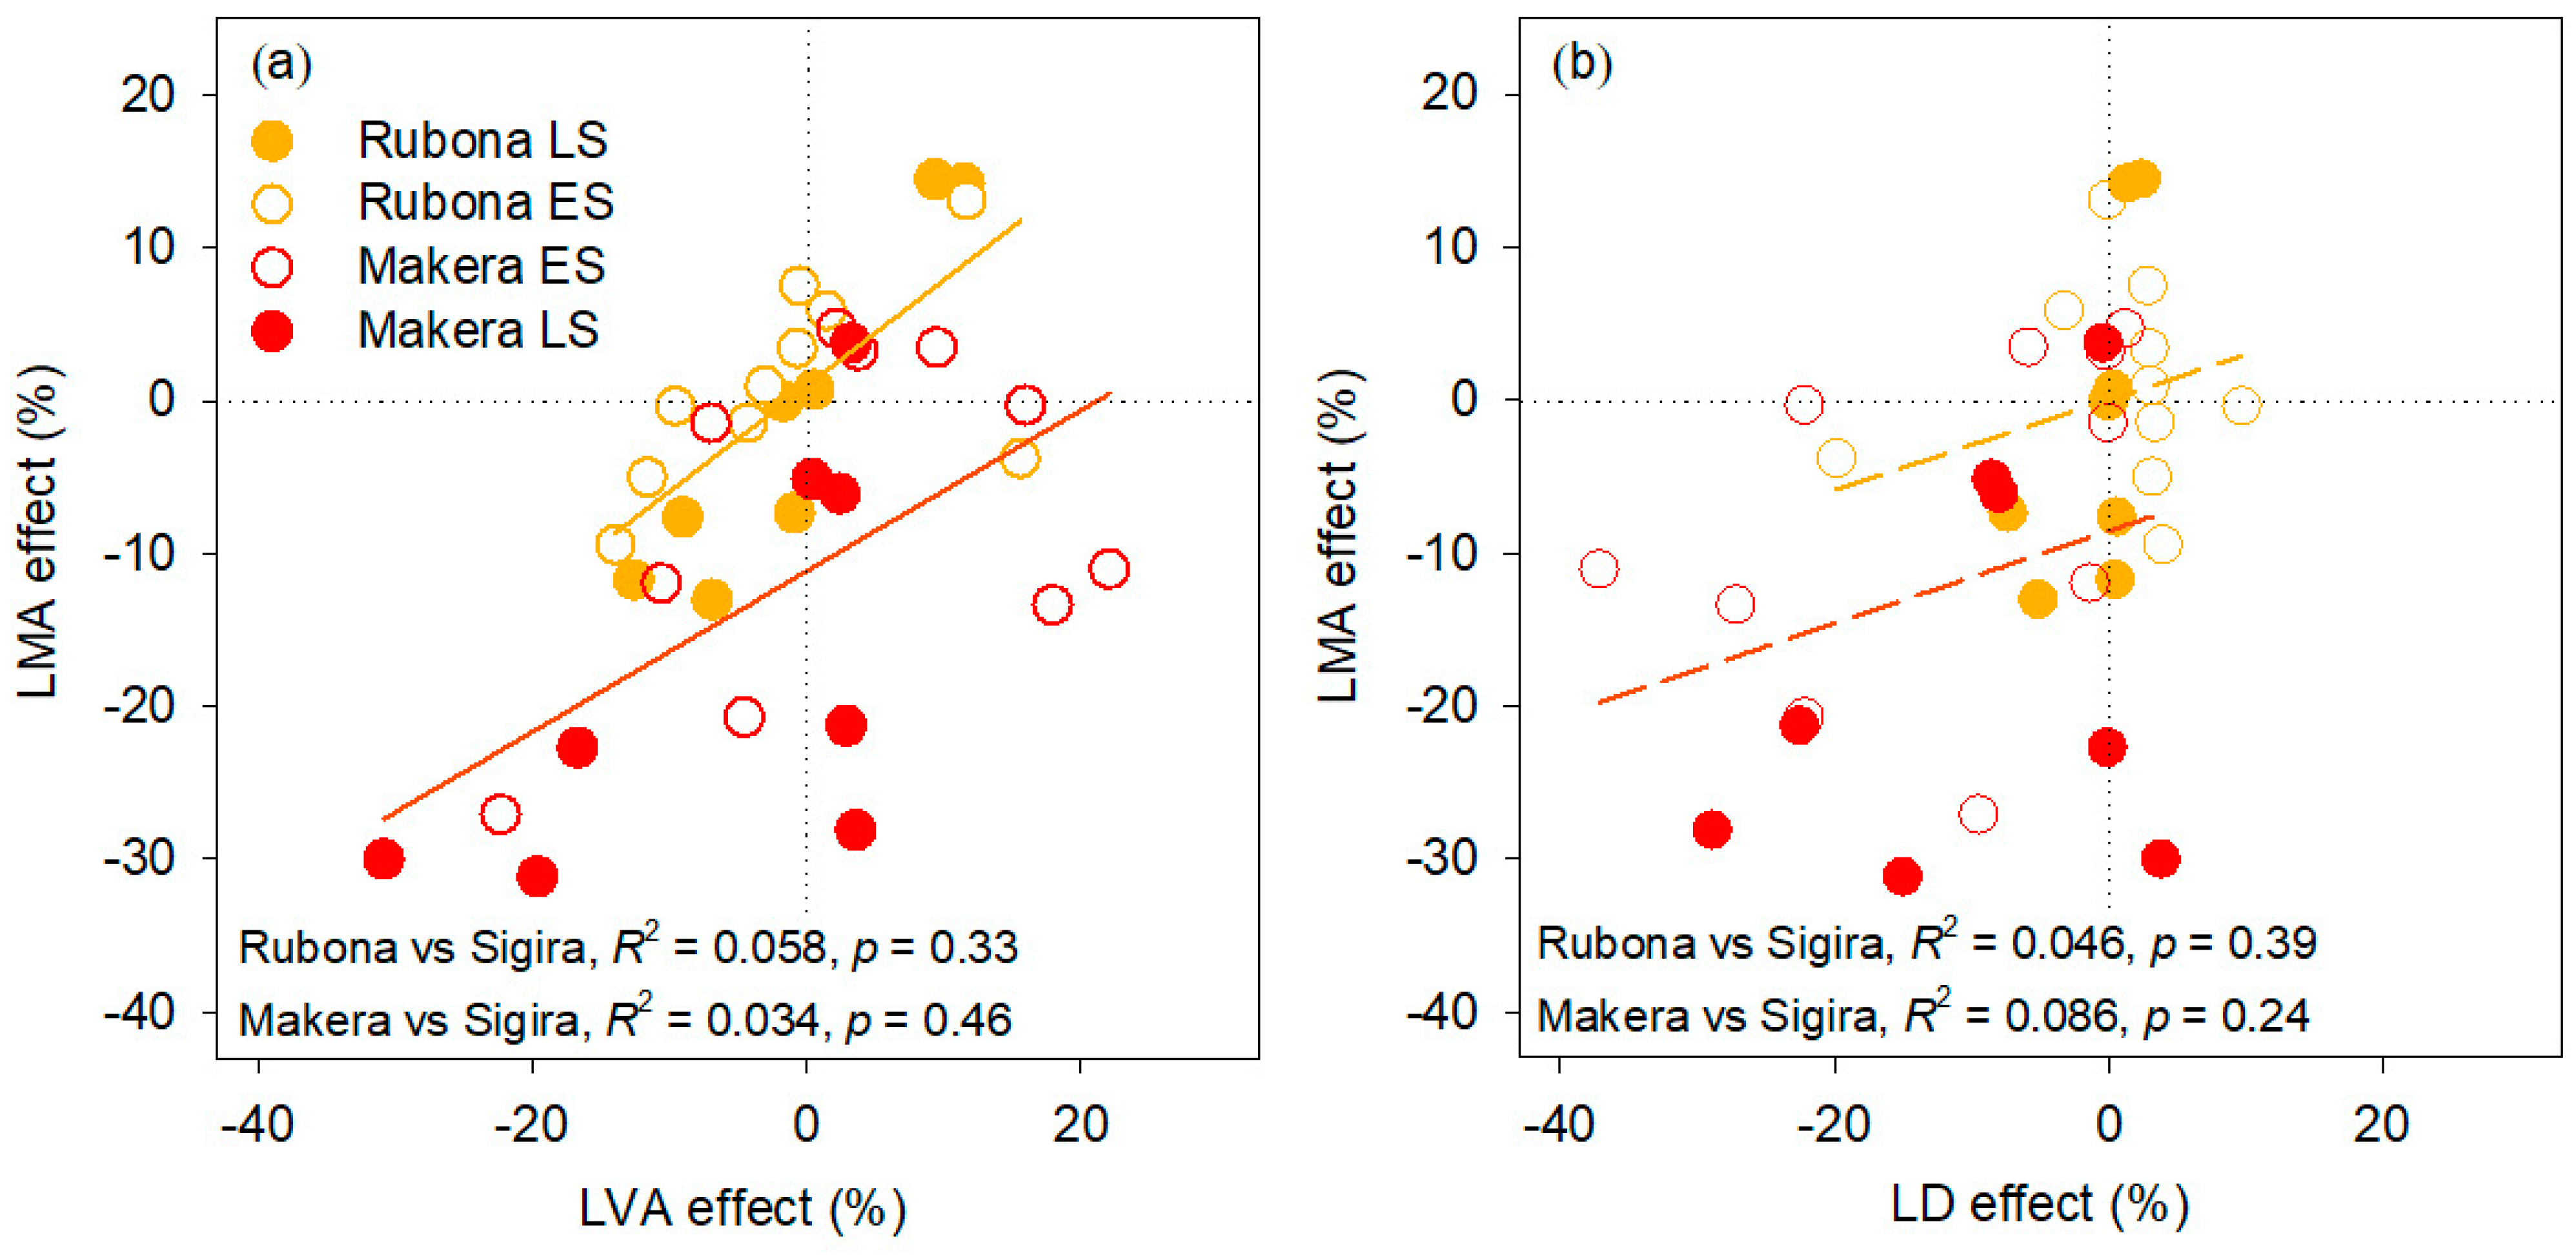
3.3. Effect of Warming on LVA and LD, and Their Contribution to the Effect on LMA

We observed significant main effects of both species and sites as well as an interaction between species and sites for LD (Table 4). The species-specific analysis showed a decline in LD with warming in six species (Table 3, Figure 5b). Most (four species) of these six species were included in the group where LMA was primarily affected by LD (Figure 3, Table S2). For LVA, a significant main effect was only found for species (Table 4, Figure 5a).
To test if LD and/or LVA contributed significantly to the site effects on LMA, regression analyses between sites effects on LMA versus site effects on LVA and LD, respectively, were conducted (Figure 6). These analyses showed a significant positive relationship between site effects on LMA and LVA, when both the ME and the LE sites were compared to the HE site, while no significant effects were observed for LD. These results partly contradict the results from analysis of the main site effect using ANOVA (Table 4). A likely explanation is that the site effect on LD is strong but only for a few species, while the site driven effect on LVA is more subtle and has a more general influence on the site effects on LMA. The significant effect of tree height on LVA may also have contributed to conceal the site effect.

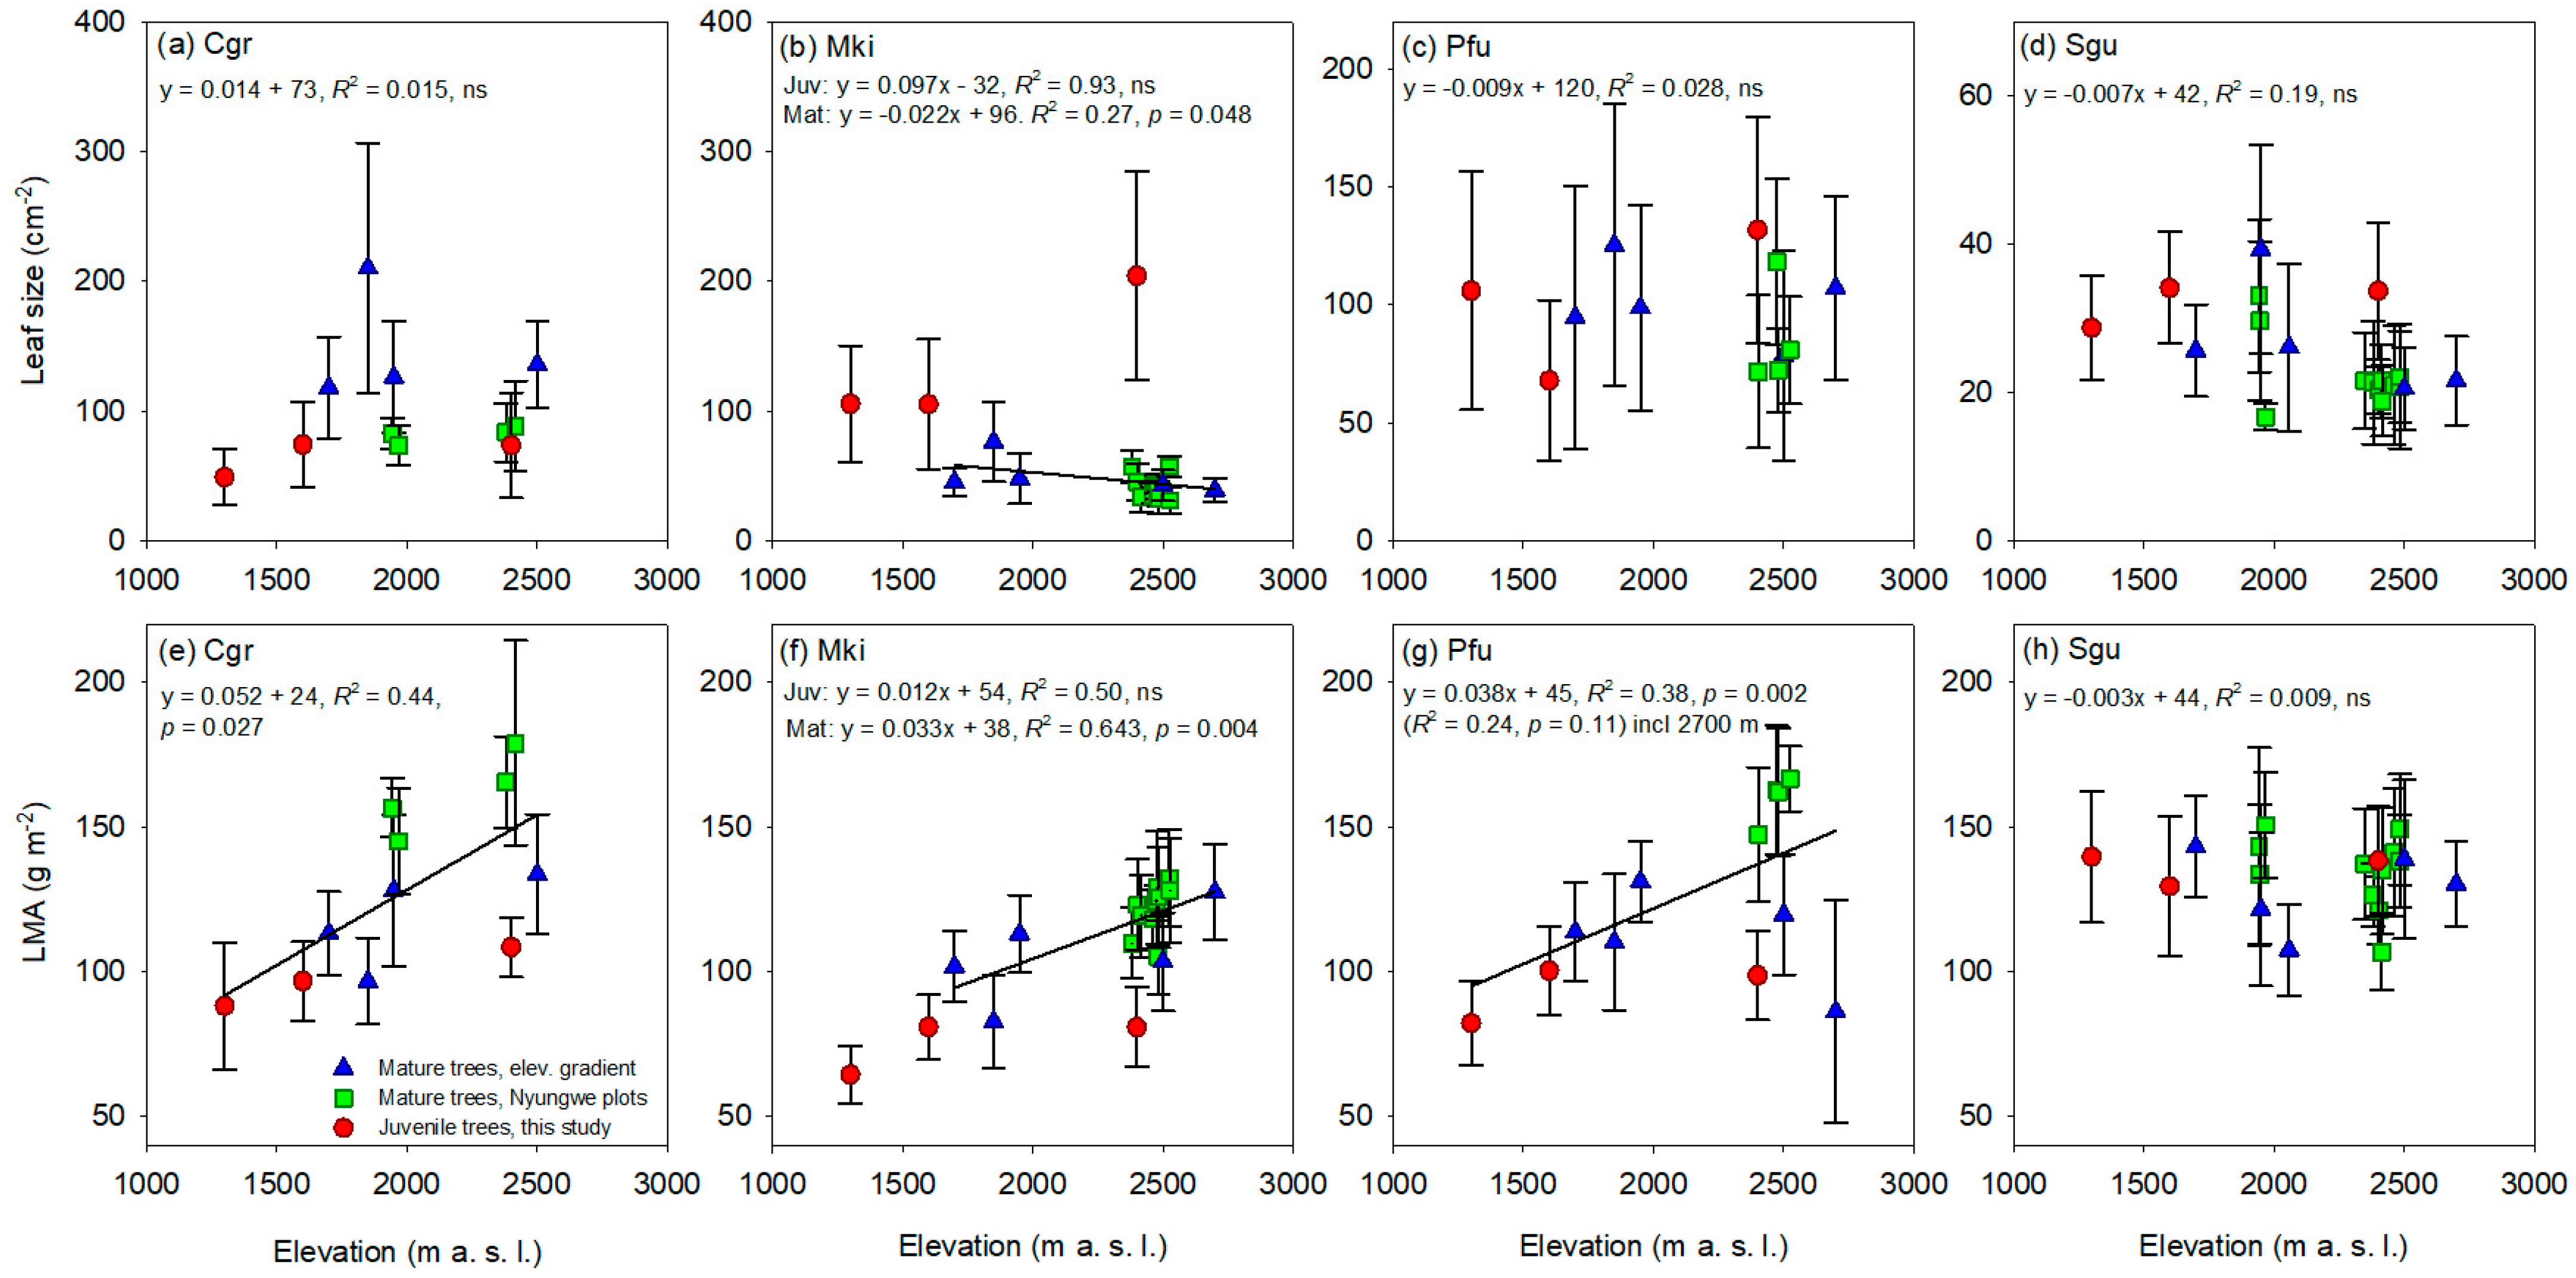
3.4. Leaf Size and LMA in Juvenile and Mature Trees at Different Elevations

We compared the average leaf size and LMA from 2018 and 2019 of the juvenile trees in present study with those from mature trees from other studies of four species (two ES and two LS) growing at different elevations (1700 to 2700 m a.s.l) (Figure 7a–h, Table 5). When standardised to an elevation of 2000 m a.s.l., a significant main age (juvenile vs. mature) effect on leaf size or LMA was observed in M. kilimandscharica, but not in the other three species (Table 5). The elevation effect was also analysed using regression analysis, separating age classes for M. kilimandscharica, but not for the other species (Figure 7). Similarly to the analysis of the juvenile trees alone (Table 3), there was a significant decline in LMA, with declining elevation for C. grandiflora, M. kilimandscharica (mature data only) and P. fulva, but not for S. guineense (Figure 7e–h). However, the LMA-to-elevation relationship for P. fulva was only significant when the observation at 2700 m a.s.l. (Figure 7g, Table 5) was excluded. The reason to exclude the highest elevation is that the site was on the edge of the elevation range for that species. For leaf size, there was no significant elevation effect except for mature leaves of M. kilimandscharica, which declined slightly in size with increasing elevation (Figure 6b, Table 5).

4. Discussion

We report results from an experimental elevation-gradient study where leaf morphological traits were collected from 18 Afrotropical tree species with different successional strategies and originating from different vegetation zones. All responses to a warmer climate were different among species and between early- and late-successional species groups. For species and traits that responded to warming, we generally observed decreased leaf size and LMA and increased leaf width-to-length ratio at warmer sites. Below, we discuss sources of variation in leaf morphology in tropical trees, including inter-trait relationships, acclimation to warming, and effects of species identity, successional strategy and ontogeny.

4.1. Characterisation of Leaf Traits in Different Species and Successional Groups

The LMA range (~50–150 g m−2) observed across species in our study is comparable to those reported in studies of trees in tropical rain and deciduous forests reviewed by Poorter et al. [21] and in a study along an elevation gradient in the Neotropics [37]. The variation in species leaf width-to-length ratio and leaf size varied 20-fold (~0.05 to 1) and 15-fold (30–440 cm2), respectively. The interspecific variation in LMA as a function of leaf width-to-length ratio, leaf size and leaf N and P per unit mass also broadly agreed with observation from other studies [1,72]. Furthermore, the ranges of LD and LVA in our study (see Figure S2) are comparable to those found in previous studies of evergreen and deciduous species [21]. Similarly to other studies [21,22,23,24], the contributions of LD and LVA to within-species LMA variation differed greatly among species; in some species, LD contributed more than LVA, in other species LVA contributed more than LD, and in a third group of species, LD and LVA equally contributed to the LMA variation (Figure 3). Our observed differences between successional groups are in agreement with previous studies, where ES species showed more acquisitive traits (higher leaf W/L ratio, LA, NM and PM, and lower LMA and LD) compared to LS species [51,52,53,54]. Overall, the range of leaf-morphology characteristics across the selected species in this study is typical for humid tropical evergreen and deciduous trees, although extreme values are lacking.

4.2. LMA Responses to Warming

Regardless of successional group, LMA declined with warming (i.e., increased with elevation; Table 3, Figure 4) for some species in our study, which confirms the first part of hypothesis #1. This is consistent with observations from both field studies and controlled experiments in the tropics as well as in several other biomes [1,13,15,21,24,36,73]. Within a given species, LMA usually correlates with photosynthesis, since thicker leaves with more palisade parenchyma tissue tend to have both higher LMA and photosynthetic capacity [21,74,75]. Indeed, the lower LMA at warm sites agrees with the decline in photosynthetic capacity observed in LS species in the present elevation gradient [76].
The results on the contribution by LD and LVA to warming-induced shifts in LMA are less consistent with previous research. We hypothesised that LD contributed more than LVA to shifts in LMA at higher temperatures, based on the global meta-analysis [21]. Indeed, there was a species-dependent effect of site on LD (declines in six species) but not on LVA (Table 3 and Table 4). However, when the site effects on LVA and LD were compared with site effects on LMA using regression analysis, we found a significant positive correlation for LVA only (Figure 6). This suggests that shifts in both LVA and LD contributed to warming-induced changes in LMA, but that the contribution by shifts in LVA is consistent across species, while the contribution by LD is strong, but only for a few species. Therefore, the second part of hypothesis #1, that mostly LD affected the warming response of LMA, was not confirmed.
LVA shifts were found to be important for LMA changes in a study on 42 tropical tree species from different habitats in south-east Asia, regardless of environmental factors causing these changes [26], as well as in an elevation-gradient study on six tropical tree species in south China [73]. The conflicting results on LVA and LD contributions to warming-induced changes in LMA in these studies on tropical trees (including our study) compared to global datasets [21] may reflect mixed effects of warming and other factors, especially effects of VPD along elevation gradients. The effect of high VPD on leaf size (i.e., leaf size declines) by reducing the total number of epidermal cells per leaf and per leaf area [6] likely altered the relationships between LMA, LD and LVA at our warmer sites. Furthermore, de la Riva et al. [77] concluded that both LD and LVA varied in a study of 34 Mediterranean woody species along a water-availability gradient. Several studies have also attributed both LD and LVA to LMA variation as a result of several environmental factors, including warming, cooling, drought, aridity, light intensity and nutrients availability, which complicate the causal interpretation of LD and LVA contributions to LMA variation in response to warming for our three groups of species identified in Figure 3 [17,21,25,37,78,79].

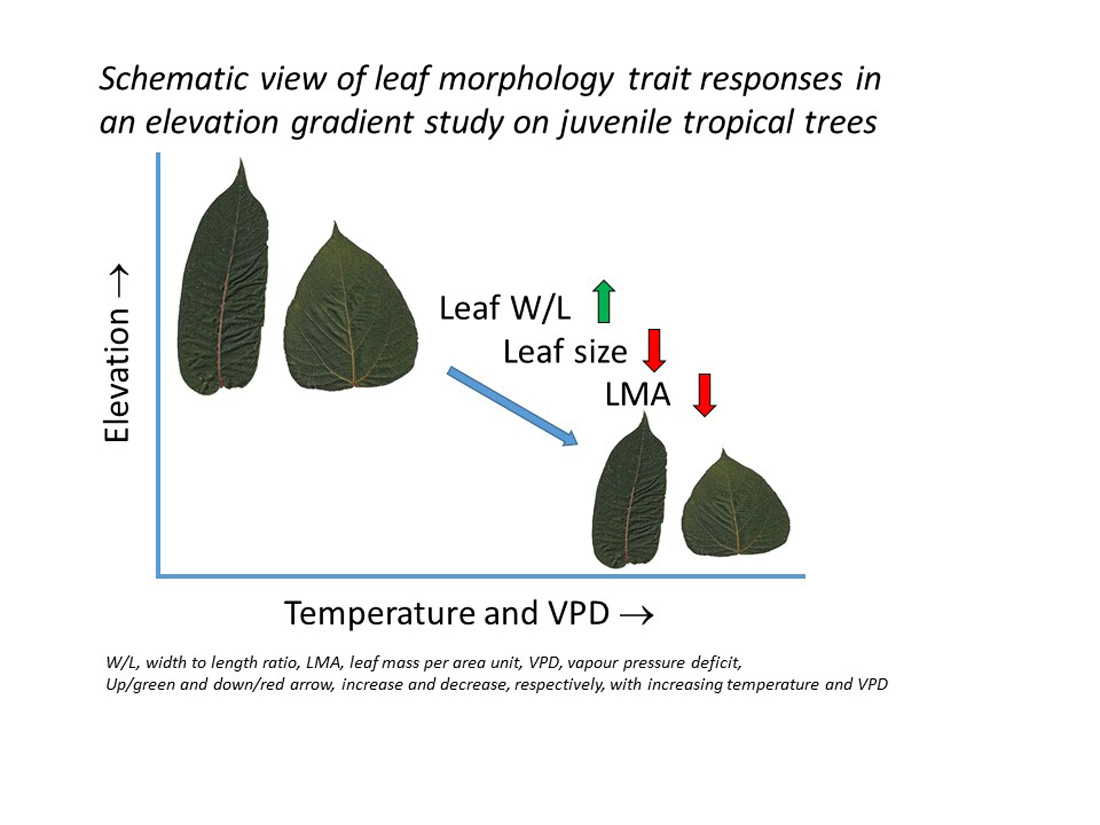
4.3. Leaf Size and Leaf Width to Length Response to Warming

Leaf size significantly decreased with warming in several species, but not in all (Table 3 and Table 5). This result was opposite to hypothesis #2. It is in contrast to a study on trees in a temperate rainforest along an elevation gradient in New Zealand [45] as well as an investigation of herbarium specimens from eight tree species in China sampled at different latitudes (~20 to 40° N) and prevailing temperatures [46]. The conflicting results on leaf size may be a result of interacting effects of temperature and water limitations on leaf size [44]. Although the plants in this study were watered at all sites, the VPD was higher at lower elevations (Table 1). High VPD causes declines in xylem and leaf water potential, production of abscisic acid and stomatal closure responses, even if soil water is abundant [80]. Our result is probably explained by hydraulic constraints on water transport and leaf growth [23,46,81]. This is also supported by Li et al. [46], who concluded that precipitation was more important than temperature for the effect on leaf size. Smaller leaf size in a warmer climate also implies thinner leaf boundary layer and more efficient heat dissipation, mitigating heat stress under sunny and hot conditions [40,41,42,43]. However, with the rather small changes in leaf size observed here, this effect was likely of less importance than that of hydraulic constraints.
The study by Li et al. [46] also observed that temperature was more important for leaf W/L ratio, and contrary to our observation, reported a decrease with increasing temperature. This suggests, together with the results from our 18 tree species, that the warming response of leaf W/L ratio is species-specific.

4.4. Responses to Warming in Species of Different Successional Groups

We found that leaf size typically declined with warming in ES species, but not in LS species, while the effects on both leaf W/L and LMA were fairly evenly distributed between ES and LS species (Table 3). Hypothesis #3 was therefore only confirmed for leaf size and not for LMA and leaf W/L ratio. However, there is much information supporting the theory that ES trees have higher plasticity in response to warming compared to LS trees [55,56]. The opposite effect (i.e., lower plasticity in ES compared to LS trees) has been found for changes in light conditions [82]. Whether the plasticity of leaf morphology in response to warming is higher in ES compared to LS species remains to be more extensively investigated.

4.5. LMA and Leaf Size in Juvenile and Mature Trees at Different Elevations

Mature and juvenile trees exhibited similar relationships between elevation (and thus temperature) and leaf size or LMA in three out of four species (Figure 7), thus mostly supporting hypothesis #4. When combining juvenile and mature tree data, LMA decreased with declining elevation, on average over the four species by 24 g m−2 per 1000 m. This is of similar magnitude to the decrease of 17 g m−2 per 1000 m observed for the community-weighted LMA of sun leaves down an Andes–Amazon elevation gradient [13]. This is a surprisingly low difference in elevation response when accounting for the variability in the LMA responses among the species in our study, and the differences in species compositions between the study sites.
When standardised at the same elevation (2000 m a.s.l.), no age effect was found on LMA and leaf size, except for M. kilimandscharica. Our findings do not support the common observation of ontogenic changes in leaf traits in other studies, with mature trees from both temperate and tropical biomes having higher LMA and thicker, larger leaves than juvenile trees [83,84,85]. Only our observation of lower LMA in juvenile compared to mature M. kilimandscharica trees is consistent with most previous research, while the larger leaf size in juvenile compared to mature trees of this species were instead opposite to the common observation. However, in a study of 51 tree species in south-east Asian rain forests, it was shown that juvenile trees could have larger, smaller and similar sized leaves compared to mature trees [58], which is more in line with our results. The larger variability of leaf size compared to LMA in our study, as evidenced by on average higher within-site coefficient of variation (33% compared to 15% for leaf size and LMA, respectively), could contribute to potential inconsistences. However, the overall similarity between the responses from young and mature trees provides support for using more frequently available data from young trees to predict climate change effects on leaf morphology of mature forest trees, but with caution, as the responses are very species-specific.

5. Conclusions

This elevation-gradient study demonstrated that effects of a warmer climate on leaf morphology are highly variable among species, and sometimes also between successional groups. Leaf size decreased at warm sites in ES species, but mostly not in LS species, while changes in LMA (decreases) and leaf W/L ratio (increases) were common in both groups. The similarity in the warming response of leaf morphology in juvenile and mature trees suggests that our results are also applicable to mature forest trees. The reduction in leaf size at warmer sites found in most ES species is contrary to results in most controlled warming experiments. This may be linked to water economy, with hydraulic constraints on plant water-transport capacity acting to decrease leaf size in air with higher temperatures and VPD in the field, but not in chamber experiments with small and constantly well-watered plants. The warming-induced reduction in leaf size in ES species only may imply that these are better than LS species in preventing overheating in a warmer climate. Lower LMA in a warmer climate in some species is likely to make their leaves less resistant to external forces, such as wind and herbivory. The large variability in leaf morphological responses to a warmer climate may therefore shift the competitive balance among species and between successional groups, potentially affecting the tree community composition of tropical montane forests in a warming world.

Supplementary Materials

The following supporting information can be downloaded online at: https://www.mdpi.com/article/10.3390/f13020219/s1, Table S1: Data of leaf morphology at the high-elevation site during 2018 and 2019; Table S2: Regression information for leaf volume per unit area (LVA) and leaf density (LD) versus leaf mass per unit area (LMA); Table S3: Tree height of sampled trees and the relationship of leaf morphology and nitrogen contents versus tree heights; Figure S1: Leaf size in relation to leaf nitrogen per unit mass; Figure S2: Leaf volume per area (LVA) and leaf density (LD) in relation to leaf mass per area unit (LMA); Figure S3: Scanned fresh leaves of the 18 studied species; Figure S4: The effect of leaf nitrogen and phosphorus on leaf size effects between sites; Figure S5: The effect of leaf nitrogen and phosphorus on LMA effect between sites.

Author Contributions

Conceptualisation, A.M., E.B., D.N., J.U. and G.W.; Data curation, A.M., E.Z. and G.W.; Formal analysis, A.M., M.E.D. and G.W.; Funding acquisition, G.W., AM and J.U.; Investigation, A.M., B.N. (Bonaventure Ntirugulirwa), E.Z., B.N. (Brigitte Nyirambangutse), M.M. and G.W.; Methodology, A.M., J.U. and G.W.; Project administration, B.N. (Bonaventure Ntirugulirwa), D.N., J.U. and G.W.; Supervision, E.B., D.N. and G.W.; Visualisation, A.M. and G.W.; Writing—original draft, A.M. and G.W.; Writing—review & editing, A.M., J.U., D.N., M.E.D. and G.W. All authors have read and agreed to the published version of the manuscript.

Funding

We acknowledge funding from the Swedish Research Council (VR; grant 2015-03338) and the Swedish Research Council for Environmental, Agricultural Science and Spatial Planning (Formas; grant 2015-1458). AM acknowledges University of Rwanda—Sweden programme grant, Central Research Grants sub-programme managed under the UR Directorate of Research and Innovation. GW and JU acknowledge the Swedish strategic research area ‘Biodiversity and Ecosystem services in a Changing Climate’ (BECC; http:www.becc.lu.se (9 December 2021)).

Data Availability Statement

The original contributions presented in the study are included in the article/Supplementary Materials. Further data will be made available upon request to the corresponding authors.

Acknowledgments

We are grateful to the Rwanda Agriculture and Animal Resources Development Board (RAB) for providing land for the field plots, and to the Rwanda Development Board (RDB) for providing access permits to the study sites in Nyungwe National Park. Furthermore, we are grateful for all the support from the field staff at the Rwanda TREE sites.

Conflicts of Interest

The authors declare no conflict of interest. The funders had no role in the design of the study, in the collection, analyses, or interpretation of data, in the writing of the manuscript or in the decision to publish the results.

References

  1. Wright, I.J.; Reich, P.B.; Westoby, M.; Ackerly, D.D.; Baruch, Z.; Bongers, F.; Cavender-Bares, J.; Chapin, T.; Cornelissen, J.H.C.; Diemer, M.; et al. The worldwide leaf economics spectrum. Nature 2004, 428, 821–827. [Google Scholar] [CrossRef] [PubMed]
  2. Whitfield, J. The Cost of Leafing: Understanding the trade-offs involved for plants making leaves promises fresh insights on every scale from the plant to the planet. Nature 2006, 444, 539–541. [Google Scholar] [CrossRef] [PubMed]
  3. Li, Y.; Reich, P.B.; Schmid, B.; Shrestha, N.; Feng, X.; Lyu, T.; Maitner, B.S.; Xu, X.; Li, Y.; Zou, D.; et al. Leaf size of woody dicots predicts ecosystem primary productivity. Ecol. Lett. 2020, 23, 1003–1013. [Google Scholar] [CrossRef]
  4. Marron, N.; Villar, M.; Dreyer, E.; Delay, D.; Boudouresque, E.; Petit, J.M.; Delmotte, F.M.; Guehl, J.M.; Brignolas, F. diversity of leaf traits related to productivity in 31 Populus deltoides x Populus nigra clones. Tree Physiol. 2005, 25, 425–435. [Google Scholar] [CrossRef] [PubMed] [Green Version]
  5. Meziane, D.; Shipley, B. Direct and indirect relationships between specific leaf area, leaf nitrogen and leaf gas exchange. effects of irradiance and nutrient supply. Ann. Bot. 2001, 88, 915–927. [Google Scholar] [CrossRef] [Green Version]
  6. Murphy, M.R.C.; Jordan, G.J.; Brodribb, T.J. Acclimation to humidity modifies the link between leaf size and the density of veins and stomata. Plant Cell Environ. 2014, 37, 124–131. [Google Scholar] [CrossRef] [PubMed] [Green Version]
  7. Crous, K.Y. Plant responses to climate warming: Physiological adjustments and implications for plant functioning in a future, warmer world. Am. J. Bot. 2019, 106, 1049–1051. [Google Scholar] [CrossRef] [Green Version]
  8. Fauset, S.; Freitas, H.C.; Galbraith, D.R.; Sullivan, M.J.P.; Aidar, M.P.M.; Joly, C.A.; Phillips, O.L.; Vieira, S.A.; Gloor, M.U. Differences in leaf thermoregulation and water use strategies between three co-occurring Atlantic forest tree species. Plant Cell Environ. 2018, 41, 1618–1631. [Google Scholar] [CrossRef] [Green Version]
  9. Fyllas, N.M.; Bentley, L.P.; Shenkin, A.; Asner, G.P.; Atkin, O.K.; Díaz, S.; Enquist, B.J.; Farfan-Rios, W.; Gloor, E.; Guerrieri, R.; et al. Solar radiation and functional traits explain the decline of forest primary productivity along a tropical elevation gradient. Ecol. Lett. 2017, 20, 730–740. [Google Scholar] [CrossRef]
  10. Wright, I.A.N.J.; Westoby, M.; Reich, P.B. Wright. Convergence towards higher leaf mass per area in dry and nutrient-poor habitats has different consequences for leaf life span. J. Ecol. 2002, 90, 534–543. [Google Scholar] [CrossRef] [Green Version]
  11. Bussotti, F. Functional leaf traits, plant communities and acclimation processes in relation to oxidative stress in trees: A critical overview. Glob. Chang. Biol. 2008, 14, 2727–2739. [Google Scholar] [CrossRef]
  12. Gornish, E.S.; Prather, C.M. Foliar functional traits that predict plant biomass response to warming. J. Veg. Sci. 2014, 25, 919–927. [Google Scholar] [CrossRef]
  13. Neyret, M.; Bentley, L.P.; Oliveras, I.; Marimon, B.S.; Marimon-Junior, B.H.; Almeida de Oliveira, E.; Barbosa Passos, F.; Castro Ccoscco, R.; dos Santos, J.; Matias Reis, S.; et al. Examining variation in the leaf mass per area of dominant species across two contrasting tropical gradients in light of community assembly. Ecol. Evol. 2016, 6, 5674–5689. [Google Scholar] [CrossRef] [PubMed] [Green Version]
  14. Bussotti, F.; Pancrazi, M.; Matteucci, G.; Gerosa, G. Leaf morphology and chemistry in Fagus sylvatica (Beech) trees as affected by site factors and ozone: Results from conecofor permanent monitoring plots in Italy. Tree Physiol. 2005, 25, 211–219. [Google Scholar] [CrossRef] [Green Version]
  15. Doughty, C.E.; Santos-Andrade, P.E.; Shenkin, A.; Goldsmith, G.R.; Bentley, L.P.; Blonder, B.; Díaz, S.; Salinas, N.; Enquist, B.J.; Martin, R.E.; et al. Tropical forest leaves may darken in response to climate change. Nat. Ecol. Evol. 2018, 1918–1924. [Google Scholar] [CrossRef]
  16. Blonder, B.; Vasseur, F.; Violle, C.; Shipley, B.; Enquist, B.J.; Vile, D. Testing models for the leaf economics spectrum with leaf and whole-plant traits in Arabidopsis thaliana. AoB Plants 2015, 7, 1–12. [Google Scholar] [CrossRef] [Green Version]
  17. Niinemets, Ü. Global-scale climatic controls of leaf dry mass per area, density, and thickness in trees and shurbs. Ecology 2001, 82, 453–469. [Google Scholar] [CrossRef]
  18. Osnas, J.L.D.; Katabuchi, M.; Kitajima, K.; Wright, S.J.; Reich, P.B.; van Bael, S.; Kraft, N.J.B.; Samaniego, M.J.; Pacala, S.W.; Lichstein, J.W. Divergent drivers of leaf trait variation within species, among species, and among functional groups. Proc. Natl. Acad. Sci. USA 2018, 115, 5480–5485. [Google Scholar] [CrossRef] [Green Version]
  19. Mujawamariya, M.; Wittemann, M.; Manishimwe, A.; Ntirugulirwa, B.; Zibera, E.; Nsabimana, D.; Wallin, G.; Uddling, J.; Dusenge, M.E. Complete or overcompensatory thermal acclimation of leaf dark respiration in African tropical trees. New Phytol. 2021, 229, 2548–2561. [Google Scholar] [CrossRef]
  20. Feng, Y.L.; Cao, K.F.; Zhang, J.L. Photosynthetic characteristics, dark respiration, and leaf mass per unit area in seedlings of four tropical tree species grown under three irradiances. Photosynthetica 2004, 42, 431–437. [Google Scholar] [CrossRef]
  21. Poorter, H.; Niinemets, Ü.; Poorter, L.; Wright, I.J.; Villar, R. Causes and consequences of variation in leaf mass per area (LMA): A meta-analysis. New Phytol. 2009, 182, 565–588. [Google Scholar] [CrossRef] [PubMed]
  22. Villar, R.; Ruiz-Robleto, J.; Ubera, J.L.; Poorter, H. Exploring variation in leaf mass per area (LMA) from leaf to cell: An anatomical analysis of 26 woody species. Am. J. Bot. 2013, 100, 1969–1980. [Google Scholar] [CrossRef] [PubMed]
  23. Coble, A.P.; Cavaleri, M.A. Vertical leaf mass per area gradient of mature sugar maple reflects both height-driven increases in vascular tissue and light-driven increases in palisade layer thickness. Tree Physiol. 2017, 37, 1337–1351. [Google Scholar] [CrossRef] [PubMed]
  24. Zhang, L.; Yang, L.; Shen, W. Dramatic altitudinal variations in leaf mass per area of two plant growth forms at extreme heights. Ecol. Indic. 2020, 110, 105890. [Google Scholar] [CrossRef]
  25. Lambers, H.I.; Chapin, F.S.; Pons, T.L. Plant Physiological Ecology, 2nd ed.; Springer: New York, NY, USA, 2008. [Google Scholar] [CrossRef]
  26. Choong, M.F.; Lucas, P.W.; Ong, J.S.Y.; Pereira, B.; Tan, H.T.W.; Turner, I.M. Leaf fracture toughness and sclerophylly: Their correlations and ecological implications. New Phytol. 1992, 121, 597–610. [Google Scholar] [CrossRef]
  27. Cavaleri, M.A.; Reed, S.C.; Smith, W.K.; Wood, T.E. Urgent need for warming experiments in tropical forests. Glob. Chang. Biol. 2015, 21, 2111–2121. [Google Scholar] [CrossRef]
  28. Chapman, C.A.; Galán-Acedo, C.; Gogarten, J.F.; Hou, R.; Lawes, M.J.; Omeja, P.A.; Sarkar, D.; Sugiyama, A.; Kalbitzer, U. A 40-year evaluation of drivers of African rainforest change. For. Ecosyst. 2021, 8, 66. [Google Scholar] [CrossRef]
  29. Malhi, Y.; Silman, M.; Salinas, N.; Bush, M.; Meir, P.; Saatchi, S. Introduction: Elevation gradients in the tropics: Laboratories for ecosystem ecology and global change research. Glob. Chang. Biol. 2010, 16, 3171–3175. [Google Scholar] [CrossRef]
  30. Cavaleri, M.A.; Oberbauer, S.F.; Clark, D.B.; Clark, D.A.; Ryan, M.G. Height is more important than light in determining leaf morphology in a tropical forest. Ecology 2010, 91, 1730–1739. [Google Scholar] [CrossRef]
  31. Milla, R.; Reich, P.B. Multi-trait interactions, not phylogeny, fine-tune leaf size reduction with increasing altitude. Ann. Bot. 2011, 107, 455–465. [Google Scholar] [CrossRef] [Green Version]
  32. Osnas, J.L.D.; Lichstein, J.W.; Reich, P.B.; Pacala, S.W. Global leaf trait relationships: Mass, area, and the leaf economics spectrum. Science 2013, 340, 741–744. [Google Scholar] [CrossRef]
  33. Vitousek, P.M.; Matson, P.A.; Turner, D.R. Elevational and age gradients in Hawaiian montane rainforest: Foliar and soil nutrients. Oecologia 1988, 77, 565–570. [Google Scholar] [CrossRef] [PubMed]
  34. Kitayama, K.; Aiba, S.I. Ecosystem structure and productivity of tropical rain forests along altitudinal gradients with contrasting soil phosphorus pools on Mount Kinabalu, Borneo. J. Ecol. 2002, 90, 37–51. [Google Scholar] [CrossRef]
  35. Körner, C. The nutritional status of plants from high altitudes—A Worldwide Comparison. Oecologia 1989, 81, 379–391. [Google Scholar] [CrossRef]
  36. Tanner, E.V.J.; Vitousek, P.M.; Cuevas, E. Experimental investigation of nutrient limitation of forest growth on wet tropical mountains. Ecology 1998, 79, 10–22. [Google Scholar] [CrossRef]
  37. van De Weg, M.; Meir, P.; Grace, J.; Atkin, O.K. Altitudinal variation in leaf mass per unit area, leaf tissue density and foliar nitrogen and phosphorus content along an Amazon-Andes gradient in Peru. Plant Ecol. Divers. 2009, 2, 243–254. [Google Scholar] [CrossRef]
  38. Tserej, O.; Feeley, K.J. Variation in leaf temperatures of tropical and subtropical trees are related to leaf thermoregulatory traits and not geographic distributions. Biotropica 2021, 53, 868–878. [Google Scholar] [CrossRef]
  39. Michaletz, S.T.; Weiser, M.D.; McDowell, N.G.; Zhou, J.; Kaspari, M.; Helliker, B.R.; Enquist, B.J. The energetic and carbon economic origins of leaf thermoregulation. Nat. Plants 2016, 2, 1–9. [Google Scholar] [CrossRef]
  40. Vårhammar, A.; Wallin, G.; McLean, C.M.; Dusenge, M.E.; Medlyn, B.E.; Hasper, T.B.; Nsabimana, D.; Uddling, J. Photosynthetic temperature responses of tree species in Rwanda: Evidence of pronounced negative effects of high temperature in montane rainforest climax species. New Phytol. 2015, 206, 1000–1012. [Google Scholar] [CrossRef]
  41. Leigh, A.; Sevanto, S.; Close, J.D.; Nicotra, A.B. The influence of leaf size and shape on leaf thermal dynamics: Does theory hold up under natural conditions? Plant Cell Environ. 2017, 40, 237–248. [Google Scholar] [CrossRef] [PubMed]
  42. Ntawuhiganayo, E.B.; Uwizeye, F.K.; Zibera, E.; Dusenge, M.E.; Ziegler, C.; Ntirugulirwa, B.; Nsabimana, D.; Wallin, G.; Uddling, J. Traits controlling shade tolerance in tropical montane trees. Tree Physiol. 2020, 40, 183–197. [Google Scholar] [CrossRef] [PubMed] [Green Version]
  43. Bhusal, N.; Lee, M.; Han, A.R.; Han, A.; Kim, H.S. Responses to drought stress in Prunus sargentii and Larix kaempferi seedlings using morphological and physiological parameters. For. Ecol. Manag. 2020, 465, 118099. [Google Scholar] [CrossRef]
  44. Wright, I.J.; Dong, N.; Maire, V.; Prentice, I.C.; Westoby, M.; Díaz, S.; Gallagher, R.V.; Jacobs, B.F.; Kooyman, R.; Law, E.A.; et al. Global climatic drivers of leaf size. Science 2017, 357, 917–921. [Google Scholar] [CrossRef] [PubMed] [Green Version]
  45. Nichlos, S.A.; Wilson, C.R.; Lusk, C.H. Differential effects of elevation on leaf size of overstorey and understorey species in a temperate rainforest. N. Zeal. J. Bot. 2019, 57, 39–49. [Google Scholar] [CrossRef]
  46. Li, Y.; Zou, D.; Shrestha, N.; Xu, X.; Wang, Q.; Jia, W.; Wang, Z. Spatiotemporal variation in leaf size and shape in response to climate. J. Plant Ecol. 2020, 13, 87–96. [Google Scholar] [CrossRef]
  47. Peppe, D.J.; Royer, D.L.; Cariglino, B.; Oliver, S.Y.; Newman, S.; Leight, E.; Enikolopov, G.; Fernandez-Burgos, M.; Herrera, F.; Adams, J.M.; et al. Sensitivity of leaf size and shape to climate: Global patterns and paleoclimatic applications. New Phytol. 2011, 190, 724–739. [Google Scholar] [CrossRef] [Green Version]
  48. Chazdon, R.L. Change and determinism in tropical forest succession. In Tropical forest Community Ecology; Carson, W.P., Schnitzer, S.A., Schwarz, E., Eds.; Wiley Blackwell: Oxford, UK, 2008; pp. 384–408. [Google Scholar]
  49. Coelho, P.A.; Santos, P.F.; de Paiva Paula, E.; Apgaua, D.M.G.; Madeira, B.G.; Menino, G.C.D.; Nunes, Y.R.F.; Santos, R.M.; Tng, D.Y.P. Tree succession across a seasonally dry tropical forest and forest-savanna ecotone in northern Minas Gerais, Brazil. J. Plant Ecol. 2016, 10, rtw091. [Google Scholar] [CrossRef]
  50. Fan, K.; Tao, J.; Zang, L.; Yao, J.; Huang, J.; Lu, X.; Ding, Y.; Xu, Y.; Zang, R. Changes in plant functional groups during secondary succession in a tropical montane rain forest. Forests 2019, 10, 1134. [Google Scholar] [CrossRef] [Green Version]
  51. Lohbeck, M.; Lebrija-Trejos, E.; Martínez-Ramos, M.; Meave, J.A.; Poorter, L.; Bongers, F. Functional trait strategies of trees in dry and wet tropical forests are similar but differ in their consequences for succession. PLoS ONE 2015, 10, e0123741. [Google Scholar] [CrossRef] [Green Version]
  52. Hernández-Vargas, G.; Perroni, Y.; López-Acosta, J.C.; Noa-Carrazana, J.C.; Sánchez-Velásquez, L.R. Do the distribution patterns of plant functional traits change during early secondary succession in tropical montane cloud forests? Acta Oecol. 2019, 95, 26–35. [Google Scholar] [CrossRef]
  53. Sterck, F.; Markesteijn, L.; Schieving, F.; Poorter, L. Functional traits determine trade-offs and niches in a tropical forest community. Proc. Natl. Acad. Sci. USA 2011, 108, 20627–20632. [Google Scholar] [CrossRef] [PubMed] [Green Version]
  54. Prado-Junior, J.A.; Schiavini, I.; Vale, V.S.; Arantes, C.S.; van der Sande, M.T.; Lohbeck, M.; Poorter, L. Conservative species drive biomass productivity in tropical dry forests. J. Ecol. 2016, 104, 817–827. [Google Scholar] [CrossRef] [Green Version]
  55. Cheesman, A.W.; Winter, K. Growth response and acclimation of CO2 exchange characteristics to elevated temperatures in tropical tree seedlings. J. Exp. Bot. 2013, 64, 3817–3828. [Google Scholar] [CrossRef] [PubMed] [Green Version]
  56. Slot, M.; Winter, K. High tolerance of tropical sapling growth and gas exchange to moderate warming. Funct. Ecol. 2018, 32, 599–611. [Google Scholar] [CrossRef]
  57. Valladares, F.; Wright, S.J.; Lasso, E.; Kitajima, K.; Pearcy, R.W. Plastic phenotypic response to light of 16 congeneric shrubs from a Panamanian rainforest. Ecology 2000, 81, 1925–1936. [Google Scholar] [CrossRef]
  58. Thomas, S.C.; Ickes, K. Ontogenetic Changes in leaf size in Malaysian rain forest trees. Biotropica 1995, 27, 427–434. [Google Scholar] [CrossRef]
  59. Ring, U.; Albrecht, C.; Schrenk, F. The East African rift system: Tectonics, climate and biodiversity. In Mountains, Climate and Biodiversity; Hoorn, C., Perrigo, A., Antonelli, A., Eds.; Wiley: Hoboken, NJ, USA, 2018; pp. 391–412. [Google Scholar]
  60. Camberlin, P. Climate of eastern Africa. In Oxford Research Encyclopedias; Oxford University Press: Oxford, UK, 2018. [Google Scholar] [CrossRef]
  61. IPCC—Intergovernmental Panel on Climate Change. Global Warming of 1.5 °C. An IPCC Special Report on the Impacts of Global Warming of 1.5°C above Pre-Industrial Levels and Related Global Greenhouse Gas Emission Pathways, in the Context of Strengthening the Global Response to the Threat of Climate Change, Sustainable Development, and Efforts to Eradicate Poverty; Masson-Delmotte, V., Zhai, P., Pörtner, H.-O., Roberts, D., Skea, J., Shukla, P.R., Pirani, A., Moufouma-Okia, W., Péan, C., Pidcock, R., et al., Eds.; World Meteorological Organization: Geneva, Switzerland, 2018. [Google Scholar]
  62. IPCC—Intergovernmental Panel on Climate Change. Climate Change 2014—Impacts. Adaptation and Vulnerability: Part B: Regional Aspects: Working Group II Contribution to the IPCC Fifth Assessment Report; Cambridge University Press: Cambridge, UK, 2014. [Google Scholar] [CrossRef] [Green Version]
  63. Bonal, D.; Burban, B.; Stahl, C.; Wagner, F.; Hérault, B. The response of tropical rainforests to drought—lessons from recent research and future prospects. Ann. For. Sci. 2016, 73, 27–44. [Google Scholar] [CrossRef] [Green Version]
  64. Malhi, Y.; Doughty, C.; Galbraith, D. The allocation of ecosystem net primary productivity in tropical forests. Philos. Trans. R. Soc. B Biol. Sci. 2011, 366, 3225–3245. [Google Scholar] [CrossRef] [Green Version]
  65. Cuni-Sanchez, A.; Sullivan, M.; Platts, P.; Lewis, S.; Marchant, R.; Imani, G.; Hubau, W.; Abiem, I.; Adhikari, H.; Albrecht, T.; et al. High above-ground carbon stock of African tropical montane forests. Nature 2021, 596, 536–542. [Google Scholar] [CrossRef]
  66. Nyirambangutse, B.; Zibera, E.; Uwizeye, F.K.; Nsabimana, D.; Bizuru, E.; Pleijel, H.; Uddling, J.; Wallin, G. Carbon stocks and dynamics at different successional stages in an Afromontane tropical forest. Biogeosciences 2017, 14, 1285–1303. [Google Scholar] [CrossRef] [Green Version]
  67. Kindt, R.; Lillesø, J.P.B.; van Breugel, P.; Bingham, M.; Demissew, S.; Dudley, C.; Friis, I.; Gachathi, F.; Kalema, J.; Mbago, F.; et al. Correspondence in forest species composition between the vegetation map of Africa and higher resolution maps for seven African countries. Appl. Veg. Sci. 2014, 17, 162–171. [Google Scholar] [CrossRef]
  68. Ellis, B.; Daly, D.C.; Hickery, L.J.; Johnson, K.R.; Mitchell, J.D.; Wilf, P.; Wing, S.L. Manual of Leaf Architecture; Cornell University Press: Ithaca, NY, USA, 2009; p. 190. [Google Scholar]
  69. Shi, P.; Liu, M.; Yu, X.; Gielis, J.; Ratkowsky, D.A. Proportional relationship between leaf area and the product of leaf length and width of four types of special leaf shapes. Forests 2019, 10, 178. [Google Scholar] [CrossRef] [Green Version]
  70. Laurans, M.; Martin, O.; Nicolini, E.; Vincent, G. Functional traits and their plasticity predict tropical trees regeneration niche even among species with intermediate light requirements. J. Ecol. 2012, 100, 1440–1452. [Google Scholar] [CrossRef] [Green Version]
  71. Mujawamariya, M.; Manishimwe, A.; Ntirugulirwa, B.; Zibera, E.; Ganszky, D.; Ntawuhiganayo Bahati, E.; Nyirambangutse, B.; Nsabimana, D.; Wallin, G.; Uddling, J. Climate sensitivity of tropical trees along an elevation gradient in rwanda. Forests 2018, 9, 647. [Google Scholar] [CrossRef] [Green Version]
  72. Lin, S.; Niklas, K.J.; Wan, Y.; Hölscher, D.; Hui, C.; Ding, Y.; Shi, P. Leaf shape influences the scaling of leaf dry mass vs. area: A test case using bamboos. Ann. For. Sci. 2020, 77, 11. [Google Scholar] [CrossRef] [Green Version]
  73. Wu, T.; Tissue, D.T.; Li, X.; Liu, S.; Chu, G.; Zhou, G.; Li, Y.; Zheng, M.; Meng, Z.; Liu, J. Long-term effects of 7-year warming experiment in the field on leaf hydraulic and economic traits of subtropical tree species. Glob. Chang. Biol. 2020, 26, 7144–7157. [Google Scholar] [CrossRef] [PubMed]
  74. Vemmos, S.N.; Petri, E.; Stournaras, V. Seasonal changes in photosynthetic activity and carbohydrate content in leaves and fruit of three fig cultivars (Ficus carica L.). Sci. Hortic. 2013, 160, 198–207. [Google Scholar] [CrossRef]
  75. Bhusal, N.; Bhusal, S.J.; Yoona, T.M. Comparisons of physiological and anatomical characteristics between two cultivars in bi-leader apple trees (Malus × domestica Borkh.). Sci. Hortic. 2018, 231, 73–81. [Google Scholar] [CrossRef]
  76. Mujawamariya, M. Climate Change Sensitivity of Photosynthesis and Respiration in Tropical Trees. Ph.D. Thesis, University of Rwanda, Kigali, Rwanda, University of Gothenburg, Gothenburg, Sweden, 2021. [Google Scholar]
  77. de la Riva, E.G.; Olmo, M.; Poorter, H.; Ubera, J.S.; Villar, R. Leaf mass per area (LMA) and its relationship with leaf structure and anatomy in 34 mediterranean woody species along a water availability gradient. PLoS ONE 2016, 11, e0148788. [Google Scholar] [CrossRef] [Green Version]
  78. Niinemets, Ü.; Kull, O.; Tenhunen, J.D. Variability in leaf morphology and chemical composition as a function of canopy light environment in coexisting deciduous trees. Int. J. Plant Sci. 1999, 160, 837–848. [Google Scholar] [CrossRef]
  79. Sancho-Knapik, D.; Escudero, A.; Mediavilla, S.; Scoffoni, C.; Zailaa, J.; Cavender-Bares, J.; Álvarez-Arenas, T.G.; Molins, A.; Alonso-Forn, D.; Ferrio, J.P.; et al. Deciduous and evergreen oaks show contrasting adaptive responses in leaf mass per area across environments. New Phytol. 2021, 230, 521–534. [Google Scholar] [CrossRef] [PubMed]
  80. Grossiord, C.; Buckley, T.N.; Cernusak, L.A.; Novick, K.A.; Poulter, B.; Siegwolf, R.T.W.; Sperry, J.S.; McDowell, N.G. Plant responses to rising vapor pressure deficit. New Phytol. 2020, 226, 1550–1566. [Google Scholar] [CrossRef] [PubMed] [Green Version]
  81. Sun, J.; Wang, M.; Lyu, M.; Niklas, K.J.; Zhong, Q.; Li, M.; Cheng, D. stem and leaf growth rates define the leaf size vs. number trade-off. AoB Plants 2019, 11, 1–7. [Google Scholar] [CrossRef] [PubMed]
  82. Rozendaal, D.M.A.; Hurtado, V.H.; Poorter, L. Plasticity in Leaf Traits of 38 tropical tree species in response to light; relationships with light demand and adult stature. Funct. Ecol. 2006, 20, 207–216. [Google Scholar] [CrossRef]
  83. Ishida, A.; Yazaki, K.; Ang, L.H. Ontogenetic transition of leaf physiology and anatomy from seedlings to mature trees of a rain forest pioneer tree, Macaranga gigantea. Tree Physiol. 2005, 25, 513–522. [Google Scholar] [CrossRef] [PubMed]
  84. Thomas, S.C.; Winner, W.E. Photosynthetic differences between saplings and adult trees: An integration of field results by meta-analysis. Tree Physiol. 2002, 22, 117–127. [Google Scholar] [CrossRef]
  85. Brito-Rocha, E.; Schilling, A.C.; Dos Anjos, L.; Piotto, D.; Dalmolin, A.C.; Mielke, M.S. regression models for estimating leaf area of seedlings and adult individuals of neotropical rainforest tree species. Braz. J. Biol. 2016, 76, 983–989. [Google Scholar] [CrossRef] [Green Version]
Figure 1. (af) Leaf characteristics of 18 species at high-elevation site (Sigira). (a) Leaf shape (i.e., leaf width to leaf length ratio: W/L), (b) leaf size, (c) leaf mass per unit area (LMA), (d) leaf volume per area (LVA), leaf density (LD), (e) leaf nitrogen (N) per unit mass (NM) and area (NA), and (f) leaf phosphorous (P) per unit mass (PM) and area (PA). Leaf shape, size and LMA (ac) were measured in both 2018 and 2019. Leaf N and P were measured in 2018 and LVA and LD in 2019 only (df). The boxplot boundary indicates the 25th and 75th percentile, the error bars indicate the 95th and 5th percentiles, the black solid line and the red dotted lines inside the boxes indicate median and mean, respectively. The black dots show the highest and lowest species means, for which species codes (see Table 2) are indicated in the lower and upper part of the figure. Different letters (a–c) inside boxes indicate significant differences (p < 0.05) of the mean between early (ES) and late (LS) successional species and years when relevant.
Forests 13 00219 g001
Figure 2. (af) Leaf mass per unit area (LMA, y axis) in relation to (a) leaf width-to-length ratio (leaf W/L ratio); (b) leaf size; (c) leaf nitrogen per unit mass (Leaf NM); (d) leaf nitrogen per unit area (Leaf NA); (e) leaf phosphorus per unit mass (Leaf PM); (f) leaf phosphorus per unit area (Leaf PA). Each data point represents species mean at each site. HE, High-elevation site (Sigira); ME, Medium elevation site (Rubona); LE, low elevation site (Makera); ES, early successional trees; LS, late successional trees. Lines, equation and R2 represent the regression line for all sites and successional groups. p-value refers to the regression line.
Forests 13 00219 g002
Figure 3. Slope (a) and R2 (b) for leaf density (LD) versus leaf mass per unit area (LMA) in relation to slope and R2 for leaf volume per unit area (LVA) versus LMA for 18 species (for species codes, see Table 2). Blue squares, LMA mainly influenced by LD; green triangles, LMA mainly influenced by LVA; red circles, LMA influenced by both LD and LVA. p-value refers to the regression line.
Forests 13 00219 g003
Figure 4. (af) Site (i.e., warming) effect on (a,b) leaf width-to-length ratio (W/L), (c,d) leaf size and (e,f) leaf mass per area unit (LMA) in 18 species (see Table 2 for full names) measured at three sites of different elevation (HE, ME and LE, high, mid and low elevations, respectively) in (a,c,e) 2018 and (b,d,f) 2019. The species are divided into four groups, depending on successional stage and forest type of origin. ES and LS, early and late successional, TMF, tropical montane forest and LVTF, Lake Victoria transitional forest. * indicate statistical differences between sites within species (p < 0.05); see Table 3 for detailed statistical results. Note the broken axis for leaf size.
Forests 13 00219 g004
Figure 5. (a,b) Site (i.e., warming) effects on (a) leaf volume per area unit (LVA) and (b) leaf density (LD) in 18 species (see Table 2 for full names) measured at three sites of different elevation (HE, ME and LE, high, mid and low elevations, respectively) in 2019. The species are divided into four groups, depending on successional stage and forest type of origin. ES and LS, early and late successional, TMF, tropical montane forest and LVTF, Lake Victoria transitional forest. * indicates statistical differences between sites within species (p < 0.05); see Table 4 for detailed statistical results. Note that there was no significant species x site interaction for LVA, and therefore the site effect for individual species was not analysed.
Forests 13 00219 g005
Figure 6. (a,b) The effect of (a) leaf volume per unit area (LVA) and (b) leaf density on leaf mass per unit area (LMA) between the mid- (Rubona) and low- (Makera) elevation versus high-elevation sites (Sigira). Each symbol represents one species, yellow, Rubona; red, Makera. Open and closed symbols, early (ES) and late (LS) successional trees, respectively. R2 and p-values are given for the regression line of all species at a site.
Forests 13 00219 g006
Figure 7. (ah) Leaf size and leaf mass per area unit (LMA) at different elevations for Cgr, Carapa grandiflora (a,e); Mki, Macaranga kilimandscharica (b,f); Pfu, Polyscias fulva (c,g); Sgu, Syzygium guineense (d,h) in three independent studies in Rwanda. Each data point shows mean ± SD at each site included in the studies. Blue triangle, mature-tree elevation-gradient study; green square, permanent monitoring plots in Nyungwe forest with mature trees; red circle, elevation-gradient study with juvenile trees (Rwanda TREE, this study); lines, equation and R2 represents the regression line for all tree studies. p-value refers to the slope coefficient.
Forests 13 00219 g007
Table 1. Site, weather and soil characteristics at Rwanda TREE experimental sites. Weather data are annual mean ± SD for the period 1 February 2018–31 January 2020, except for wind, which is given for 1 February 2019–31 January 2020. Soil data are mean ± SD of three blocks (1 block = 6 subplots). HE, high elevation; ME, mid elevation; LE, low elevation; MAT, mean annual temperature; MAP, mean annual precipitation; T air day and night, mean air temperature in light and darkness (< and >2 µmol m−2 s−1 PPFD), respectively; VPD day, daytime mean vapour pressure deficit; PPFD day, daytime mean photosynthetic photon flux density; gust wind speed, average of maximum half-hourly wind speeds; T soil, mean soil temperature at 10–20 cm depth; SWC, soil water content at 10–20 cm depth; SBD, soil bulk density; P, phosphorus, N, nitrogen; Org C, organic carbon; All soil parameters from SBD and downwards are average between 0–30 cm depth.
Site:Sigira (HE)Rubona (ME)Makera (LE)
Site characteristics
Elevation (m a.s.l.)240016001300
LatitudeS 2°30′54″S 2°28′30″S 2°6′31″
LongitudeE 29°23′44″E 29°46′49″E 30°51′16″
Potential Natural Vegetation 1Montane forestLake Victoria Transitional rain forestEvergreen and semi-evergreen bushland and thicket
Weather
MAP (mm year−1)2144 ± 611672 ± 1361106 ± 33
MAT (°C) 15.2 ± 0.120.0 ± 0.020.6 ± 0.1
T air day (°C)17.1 ± 0.222.4 ± 0.124.0 ± 0.3
T air night (°C)13.3 ± 0.117.5 ± 0.116.9 ± 0.03
T air 99%ile (°C)23.1 ± 0.428.4 ± 0.431.2 ± 0.4
T air 1%ile (°C)10.9 ± 0.313.4 ± 0.210.9 ± 0.8
VPD day (kPa)0.51 ± 0.031.03 ± 0.011.14 ± 0.03
VPD 99%ile (kPa)1.5 ± 0.0042.5 ± 0.113.0 ± 0.16
PPFD day (µmol m−2 s−1)611 ± 66764 ± 62740 ± 31
PPFD 99%ile (µmol m−2 s−1)1683 ± 1341884 ± 1351841 ± 104
Wind speed (m s−1)0.60.70.3
Wind speed gusts (m s−1)1.21.20.7
Wind speed gusts 99%ile (m s−1)3.54.03.0
Soil properties
T soil (°C)16.722.422.4
SWC (m3 m−3)0.290.190.20
SWC 1%ile (m3 m−3)0.120.090.10
SBD (g cm−3)1.0 ± 0.01.6 ± 0.11.4 ± 0.1
TextureClaySandy clayClay loam
pH (Water)4.2 ± 0.25.0 ± 0.16.1 ± 0.1
pH (KCl)3.4 ± 0.13.9 ± 0.05.3 ± 0.2
Available P (µg g−1)12.1 ± 3.914.1 ± 0.78.2 ± 2.5
NH4+ (µg g−1)11.3 ± 2.910.1 ± 2.37.1 ± 1.0
NO3 (µg g−1)28.3 ± 1.97.2 ± 3.024.1 ± 4.6
Tot N (mg g−1)2.73 ± 0.352.00 ± 0.391.26 ± 0.04
Tot P (mg g−1)0.65 ± 0.020.14 ± 0.040.27 ± 0.02
Org C (mg g−1)38.6 ± 1.127.1 ± 3.127.3 ± 2.4
1 Classification according to Kindt et al. [67].
Table 2. Taxonomy for species and their main forest type of origin, classification into successional group as well as their leaf type and shape. FT, forest type of origin; TMF, tropical montane forest (~>2000 m a.s.l.); LVTF, Lake Victoria Transitional Forest (~1500–2000 m a.s.l.); SG, successional group (ES, early LS, late); K, leaf area factor; *, species with mixed successional group features.
CodeScientific Name and Author 1Family Name 1FT 2SGDistribution 3Plant Functional Type 4Leaf Type & Shape 5K
AfaAfrocarpus falcatus, (Thunb.) C.N.PagePodocarpaceaeTMFLSEastern and Southern AfricaEvergreenSimple alternate, Oblong linear0.85
BbrBridelia brideliifolia, (Pax) FeddeEuphorbiaceae/Phyllanthaceae TMFESEastern and Southern Africa Semi-deciduousSimple alternate, Elliptic0.76
BmiBridelia micrantha, (Hochst.) BaillEuphorbiaceae/Phyllanthaceae LVTFESSub-Sahara AfricaSemi-deciduousSimple alternate, Elliptic0.75
CgoChrysophyllum gorungosanum, EnglSapotaceaeLVTFLSPantropical Africa mountainsEvergreenSimple alternate, Obovate0.67
CgrCarapa grandiflora, SpragueMeliaceaeTMFLSAlbertine Rift and west Africa mountainsEvergreenPinnately Compound, Oblong0.75
CmeCroton megalocarpus, Hutch.EuphorbiaceaeLVTFESPantropical AfricaSemi-deciduousSimple opposite, Ovate0.71
DtoDombeya torrida, (J.F.Gmel.) BampsSterculiaceae/Malvaceae LVTFESEast Africa mountainsSemi-deciduousSimple alternate, Elliptic lobate0.72
EexEntandrophragma excelsum, (Dawe & Sprague) SpragueMeliaceaeLVTFLSEast Africa mountainsEvergreenPinnately Compound, Elliptic0.75
FsaFaurea saligna, HarvProteaceaeTMFLSEastern and Southern Africa EvergreenSimple alternate, Oblong acute0.69
FthFicus thonningii, BlumeMoraceaeLVTFLS *PantropicalSemi-deciduousSimple alternate, Elliptic0.71
HmaHarungana madagascariensis, Lam. ex PoirHypericaceaeLVTFESPantropical AfricaSemi-deciduousSimple opposite, Ovate0.70
HmoHarungana montana, SpirletHypericaceaeTMFESAlbertine RiftSemi-deciduousSimple opposite, Ovate0.70
MkiMacaranga kilimandscharica, PaxEuphorbiaceaeTMFESEast Africa mountainsSemi-deciduousSimple alternate, Ovate truncate0.66
MlaMaesa lanceolata, Forssk.Myrsinaceae/PrimulaceaeTMFESSub-Sahara Africa and MadagascarSemi-deciduousSimple alternate, Ovate0.67
MluMarkhamia lutea, (Benth.) K.SchumBignoniaceaeLVTFES *PaleotropicalEvergreenPinnately Compound0.71
PafPrunus africana, (Hook.f.) KalkmanRosaceaeTMFLSSub-Sahara Africa and MadagascarEvergreenSimple alternate, Oblong0.73
PfuPolyscias fulva, (Hiern) HarmsAraliaceaeTMFESPantropical Africa Semi-deciduousPinnately Compound, Oblong0.79
SguSyzygium guineense, (Willd.) DC.MyrtaceaeTMFLSSub-Sahara Africa and MadagascarEvergreenSimple opposite, Elliptic0.67
1 Taxonomy information from The plant list (http://www.theplantlist.org (9 December 2021)) and for family names, both classic and Angiosperm Phylogeny Group (APG III) system are given when applicable; 2 Forest type follows the Potential Natural Vegetation’s by Kindt et al. [67]; 3 www.gbif.org (1 December 2021); 4 Semi-deciduous species drop variable amounts of leaf depending the severity of drought, but are rarely completely defoliated; 5 Leaf type and shape classifications follow Ellis et al. [68], see also Figure S3.
Table 3. Significance of warming effect on leaf shape (width-to-length ratio, W/L) leaf size (leaf area) and leaf mass per unit area (LMA) in 2018 and 2019, and on leaf volume per unit area (LVA) and leaf density (LD) in 2019. Different letters (a, b, c) denote significant differences between sites. H, M and L represent high- (Sigira), mid- (Rubona) and low- (Makera) elevation sites, respectively. Explanation of species codes is given in Table 2; SG, successional group (ES, early; LS, late); FT, forest type (TMF, tropical montane forest; LVTF, Lake Victoria transitional forest); C, covariate used in statistical analysis when significant; h, tree height. The arrows indicate the direction of warming effect of species with significant site effect (p < 0.05).
Leaf L/W RatioLeaf SizeLMALD
2018201920182019201820192019
SpecSGFTCPHML CPHML CPHML CPHML CPHML CPHML CPHML
BbrESTMFh0.013abab 0.101 h<0.001aba 0.028aab 0.003aba 0.468 0.845
HmoESTMFh<0.001abab 0.369 0.001abah0.016abab <0.001abb 0.006aab 0.528
MkiESTMF 0.013aabb 0.124 h<0.001abb <0.001abb <0.001aab <0.001aab 0.162
MlaESTMF 0.077 0.047abab <0.001abb 0.127 h<0.001abab 0.067 <0.001abb
PfuESTMF 0.785 0.003abbh<0.001abb 0.001abb <0.001aab <0.001aabh0.065
BmiESLVTF 0.143 0.023aabbh0.107 0.009aabh0.137 0.606 0.060
CmeESLVTF 0.522 0.366 h0.036aabbh0.563 0.075 0.001aabh0.003aab
DtoESLVTFh<0.001abab 0.164 h<0.001abb <0.001abb 0.011aabh0.230 0.008aab
HmaESLVTFh0.001ababh0.920 <0.001abah0.023ababh0.106 h0.096 0.797
MluESLVTFh0.053 0.109 h0.896 h0.001aabh0.002abab 0.009aba 0.421
AfaLSTMFh0.361 0.321 <0.001abb 0.056 h0.119 0.001aba 0.228
CgrLSTMFh0.820 0.218 h0.007ababh0.199 0.006abbh<0.001aab 0.782
FsaLSTMF <0.001aab 0.002ababh0.024ababh0.747 0.254 h0.012aabb 0.485
PafLSTMF 0.023aabb 0.572 h0.203 h0.882 h0.056 0.480 0.195
SguLSTMFh<0.001abch<0.001abch<0.001abb 0.039ababh0.008ababh0.012ababh0.813
CgoLSLVTF 0.024abb 0.017aabbh0.434 h0.451 h0.038* h<0.001aab <0.001aab
EexLSLVTF 0.788 0.313 <0.001abah0.948 h<0.001abb <0.001abc <0.001aab
FthLSLVTF 0.547 0.063 h0.093 h<0.001abab 0.735 h0.023ababh0.027abab
Decrease with warming (down at both M and L or no/small effect at M and down at L compared to H elevation sites). Increase with warming (up at both M and L or no/small effect at M and up at L compared to H elevation sites). → No warming effect (up at one site and down at one site or down/up at M but no effect at L compared to H elevation sites). * a statistically significant site effect was obtained in the ANOVA analysis, but not in the Bonferoni post-hoc test.
Table 4. p-values for effects of year, site and species, and for leaf width-to-length ratio (W/L), leaf size, leaf mass per area unit (LMA) and effects of site, species for leaf volume per unit area (LVA), leaf density (LD) and leaf nitrogen per unit mass (NM) and area (NA), and leaf phosphorus per unit mass (PM) and area (PA). Tree height was used as covariate when significant (Table S3). df represents degree of freedom.
p-Values for Two Years Datap-Values for One Year Data
SourcedfLeaf W/LLeaf SizeLMALVALDNMPMNAPA
Tree height (covariate)1ns<0.001<0.0010.022nsnsnsnsns
Year (repeated)1<0.001<0.0010.039
Site2<0.0010.5960.2490.116<0.001<0.001<0.001<0.001<0.001
Species17<0.0010.007<0.001<0.001<0.001<0.001<0.001<0.001<0.001
Year * Site20.1080.1140.007
Year * Species17<0.001<0.001<0.001
Year * Tree height1 <0.0010.011
Site * Species34<0.0010.033<0.0010.2170.035<0.001<0.001<0.001<0.001
Site * Tree height2 0.8150.7170.203
Species * Tree height17 <0.0010.0280.016
Year * Site * Species34<0.0010.242<0.001
Year * Site * Tree height2 0.5170.313
Year * Site * Tree height17 <0.001<0.001
Site * Species * Tree height34 <0.0010.1960.702
Year * Site * Species * Tree height34 0.0430.000
Table 5. p-values for effect of tree age (juvenile and mature trees) on leaf size and leaf mass per area unit (LMA) of four species along elevation gradients using elevation as a covariate and standardised to 2000 m a.s.l (common for all gradients). The elevation effect was analysed by regression analysis, and for significant age * elevation interaction, a separate regression analysis was conducted for each tree age class (Figure 7a–h). For full name of species, see Table 2.
p-Values for Species
Variable/SourceCgrMkiPfuSgu
Leaf size
Age0.20<0.0010.410.12
Elevation0.72<0.0010.640.54
Age * Elevation0.53<0.0010.140.019
LMA
Age0.0700.0050.210.83
Elevation0.0750.0130.470.82
Age * Elevation0.310.200.860.87
Publisher’s Note: MDPI stays neutral with regard to jurisdictional claims in published maps and institutional affiliations.

