Author Contributions
Conceptualization, F.T., A.R.K., K.T.-A., A.L.M. and R.P.; data curation, F.T., A.R.K., K.T.-A. and A.L.M.; formal analysis, F.T., A.R.K., A.L.M., R.V. and R.P.; investigation, F.T., A.R.K. and K.T.-A.; methodology, F.T., A.R.K., K.T.-A., A.L.M., R.V. and R.P.; resources, A.L.M. and R.P.; supervision, F.T.; validation, F.T., A.R.K., K.T.-A., A.L.M., R.V. and R.P.; visualization, K.T.-A. and R.V.; writing—original draft, F.T., A.R.K., K.T.-A., A.L.M. and R.P.; Writing—review and editing, F.T., A.L.M., R.V. and R.P. All authors have read and agreed to the published version of the manuscript.
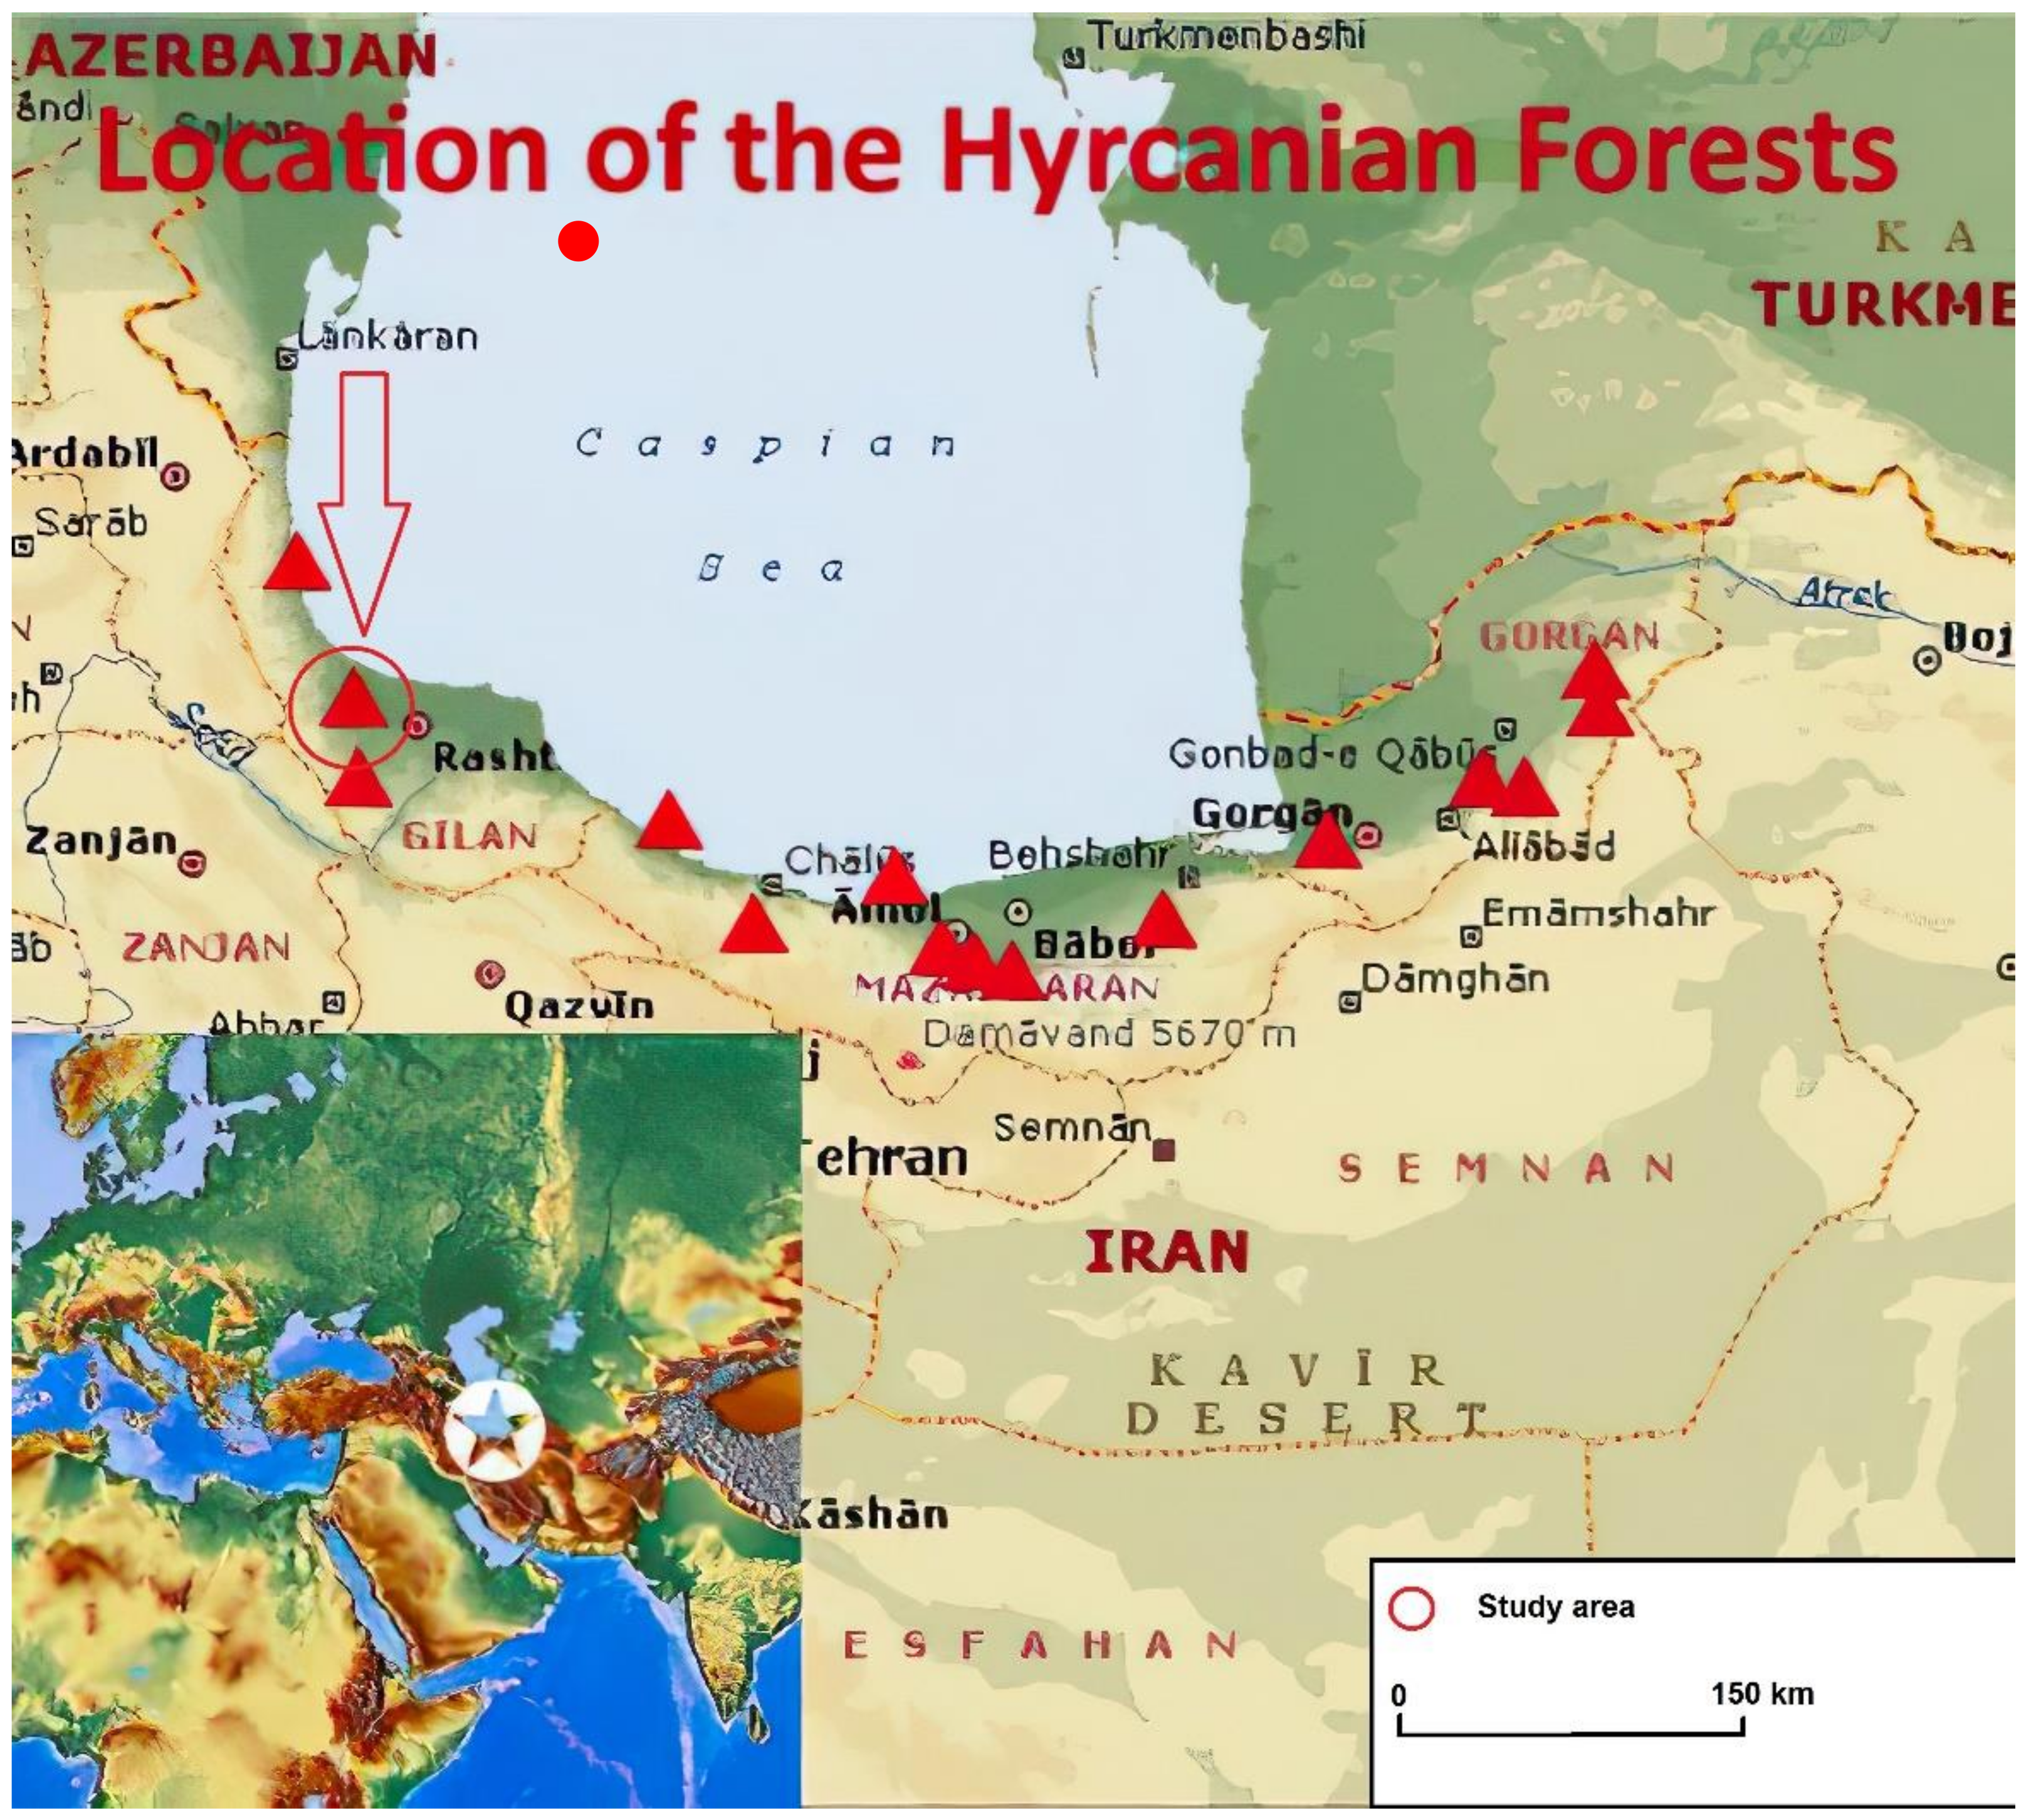
Figure 1.
Map of Hyrcanian forests, and location of study area (red circle).
Figure 1.
Map of Hyrcanian forests, and location of study area (red circle).
Figure 2.
The bars show the number of living trees (a), fallen DW (b) and standing DW (c) in altitude of <600 m referred to diameter (DBH) distribution in each silviculture method (left y-axis). The scatter bars show the volume of living trees (a), fallen DW (b) and standing DW (c) per DBH class (right y-axis). Sh, shelter wood silviculture; Sc, selection cutting silviculture; Pr, protected stand.
Figure 3.
The bars show the number of living trees (a), fallen DW (b) and standing DW (c) in altitude of 600–1200 m referred to diameter distribution in each silviculture method (left y-axis). The scatter bars show the volume of living trees (a), fallen DW (b) and standing DW (c) per diameter class (right y-axis). Sh, shelter wood silviculture; Sc, selection cutting silviculture; Pr, protected stand.
Figure 4.
The bars show the number of living trees (a), fallen DW (b) and standing DW (c) in altitude of >1200 m referred to diameter distribution in each silviculture method (left y-axis). The scatter bars show the volume of living trees (a), fallen DW (b) and standing DW (c) per DBH class (right y-axis). Sh, shelter wood silviculture; Sc, selection cutting silviculture; Pr, protected stand.
Figure 5.
Volume proportion of standing and fallen DW in different silvicultural managed stands. Sh, shelter wood silviculture; Sc, selection cutting silviculture; Pr, protected stand.
Figure 5.
Volume proportion of standing and fallen DW in different silvicultural managed stands. Sh, shelter wood silviculture; Sc, selection cutting silviculture; Pr, protected stand.
Figure 6.
Volume proportion of each decay classes of DW in different silvicultural managed stands. Sh, shelter wood silviculture; Sc, selection cutting silviculture; Pr, protected stand.
Figure 6.
Volume proportion of each decay classes of DW in different silvicultural managed stands. Sh, shelter wood silviculture; Sc, selection cutting silviculture; Pr, protected stand.
Figure 7.
Value of DW indices by altitude class and silvicultural management. Sh, shelter wood silviculture; Sc, selection cutting silviculture; Pr, protected stand. SCI, snag creation index; FLCI, fallen log creation index; SLI, snag longevity index; and PMLI, past management legacy index.
Figure 7.
Value of DW indices by altitude class and silvicultural management. Sh, shelter wood silviculture; Sc, selection cutting silviculture; Pr, protected stand. SCI, snag creation index; FLCI, fallen log creation index; SLI, snag longevity index; and PMLI, past management legacy index.
Figure 8.
Snag frequency in relation with live tree frequency.
Figure 8.
Snag frequency in relation with live tree frequency.
Figure 9.
DW volume in relation with live tree volume.
Figure 9.
DW volume in relation with live tree volume.
Figure 10.
Proportion of C-stock in live trees, fallen and standing DW in different silvicultural managed stands. Sh, shelter wood silviculture; Sc, selection cutting silviculture; Pr, protected stand.
Figure 10.
Proportion of C-stock in live trees, fallen and standing DW in different silvicultural managed stands. Sh, shelter wood silviculture; Sc, selection cutting silviculture; Pr, protected stand.
Table 1.
Stand and operation characteristics in the study area (Sh, shelter wood silviculture; Sc, selection cutting silviculture; Pr, protected stand).
Table 1.
Stand and operation characteristics in the study area (Sh, shelter wood silviculture; Sc, selection cutting silviculture; Pr, protected stand).
| Stand and Operation Characteristics | Altitude of <600
m a.s.l | Altitude of 600–1200
m a.s.l | Altitude of >1200
m a.s.l |
|---|
| Sh | Sc | Sh | Sc | Sh | Sc |
|---|
| Year of last cutting | 1995 | 2000 | 1998 | 2008 | 1995 | 2005 |
| Stand density before last cutting (stem ha−1) | 243 | 324 | 264 | 345 | 270 | 377 |
| Stand density after last cutting (stem ha−1) | 205 | 296 | 219 | 311 | 228 | 332 |
| Stand basal area before last cutting (m2 ha−1) | 27.5 | 29.1 | 30.2 | 33.7 | 33.5 | 34.0 |
| Stand basal area after last cutting (m2 ha−1) | 22.8 | 22.3 | 24.1 | 26.5 | 26.6 | 27.1 |
| Stand volume before last cutting (m3 ha−1) | 263.2 | 286.4 | 269.7 | 305.7 | 276.8 | 329.1 |
| Stand volume after last cutting (m3 ha−1) | 241.8 | 271.7 | 244.7 | 279.5 | 250.0 | 288.7 |
| Harvest intensity at last cutting (%) | 8.1 | 5.1 | 9.3 | 8.6 | 9.7 | 12.3 |
Table 2.
Classification system of deadwood (DW) types in decay classes [
2].
Table 2.
Classification system of deadwood (DW) types in decay classes [
2].
| Types | | Decay Class |
|---|
| Character | 1 | 2 | 3 | 4 | 5 |
|---|
| Snags | Leaves | Present | Absent | Absent | Absent | Absent |
| Bark | Tight | Loose | Partly present (<50% bark) | Absent | Absent |
| Crown, branches and twigs | All present | Only branches present | Only large branch stubs present | Broken top, few or no branch stubs | Branch stubs absent, <6 m in height |
| Bole | Recently dead | Standing, firm | Standing, decayed | Heavily decayed, Soft and block structure | Fragmented and powdery |
| Indirect measure | Cambium still fresh, died <1 year | Cambium decayed, knife blade penetrates a few millimetres | Knife blade penetrates <2 cm | Knife blade penetrates 2–5 cm | Knife blade penetrates all the way |
| Fallen logs | Structural
integrity | Sound | Sapwood slightly rotting, heartwood sound | Sapwood missing, heartwood mostly sound | Heartwood decayed | Soft |
| Leaves | Present | Absent | Absent | Absent | Absent |
| Branches | All twigs present | Larger twigs present | Larger branches present | Few branch stubs present | Absent |
| Bark | Present | Present | Often present | Often present | Absent |
| Bole shape | Round | Round | Round | Round to oval | Oval to flat |
| Wood consistency | Solid | Solid | Partly soft Semisolid | Partly soft | Fragmented, powdery |
| Colour of wood | Original colour | Original colour | Original colour to faded | Original colour to faded | Heavily faded |
| Portion of log on ground | Elevated on support point | Elevated on support point | Near or on ground | Whole log on ground | Whole log on ground |
| Indirect measure | Cambium still fresh, died | Cambium decayed, knife blade penetrates a few mm | Knife blade penetrates <2 cm | Knife blade penetrates 2–5 cm | Knife blade penetrates all the way |
| Stumps | Indirect measure | Cambium still
fresh, died <1 year | Cambium decayed, knifeblade penetrates a few mm | Knife blade penetrates <2 cm | Knife blade penetrates 2–5 cm | Knife blade penetrates all the way |
Table 3.
Mean (±SD) wood basic density in live trees and decay classes of DW.
Table 3.
Mean (±SD) wood basic density in live trees and decay classes of DW.
| Decay Class of DW | Basic Density (g cm−3) |
|---|
| DC0–Live tree | 0.67 (±0.10) a |
| DC1 | 0.48 (±0.11) b |
| DC2 | 0.37 (±0.09) c |
| DC3 | 0.32 (±0.06) d |
| DC4 | 0.25 (±0.05) e |
| DC5 | 0.19 (±0.04) f |
Table 4.
Species’ composition and growing stock of living trees (mean ± SD) in different silvicultural managed forest at altitude of <600 m. Sh, shelter wood silviculture; Sc, selection cutting silviculture; Pr, protected stand.
Table 4.
Species’ composition and growing stock of living trees (mean ± SD) in different silvicultural managed forest at altitude of <600 m. Sh, shelter wood silviculture; Sc, selection cutting silviculture; Pr, protected stand.
| Tree Species | Tree Frequency (Stem ha−1) | Basal Area (m2 ha−1) | Tree Volume (m3 ha−1) |
|---|
| Sh | Sc | Pr | Sh | Sc | Pr | Sh | Sc | Pr |
|---|
| Parrotia persica C.A. Meyer. | 38.3 ± 3.3 b | 25.7 ± 2.8 c | 56.5 ± 7.5 a | 2.3 ± 0.2 b | 1.6 ± 0.2 c | 2.9 ± 0.2 a | 22.4 ± 1.9 b | 20.3 ± 2.5 b | 30.4 ± 3.0 a |
| Quercus castaneifolia C.A.M. | 30.1 ± 3.5 b | 33.3 ± 3.4 b | 45.3 ± 5.5 a | 2.0 ± 0.2 b | 2.3 ± 0.2 b | 2.8 ± 0.2 a | 25.1 ± 2.4 c | 29.5 ± 2.4 b | 39.1 ± 3.2 a |
| Alnus glutinosa L. | 26.6 ± 3.3 c | 35.4 ± 2.6 b | 45.7 ± 5.0 a | 1.1 ± 0.1 b | 2.0 ± 0.2 a | 2.0 ± 0.2 a | 23.0 ± 1.6 c | 35.0 ± 3.0 a | 36.3 ± 3.7 a |
| Carpinus betulus L. | 20.7 ± 2.9 c | 27.2 ± 2.5 a | 31.3 ± 3.0 a | 0.8 ± 0.1 a | 0.9 ± 0.1 a | 0.9 ± 0.1 a | 16.2 ± 1.5 c | 24.7 ± 2.6 b | 30.6 ± 3.1 a |
| Acer velutinum Boiss. | 17.0 ± 1.9 c | 23.1 ± 2.2 b | 30.2 ± 2.6 a | 0.5 ± 0.0 a | 0.7 ± 0.1 a | 0.6 ± 0.1 a | 10.0 ± 1.5 c | 19.1 ± 1.3 b | 24.3 ± 2.7 a |
| Acer cappadocicum Gled. | 12.7 ± 1.5 b | 16.4 ± 1.9 b | 23.5 ± 2.4 a | 0.3 ± 0.0 b | 0.5 ± 0.1 b | 0.8 ± 0.1 a | 6.9 ± 1.0 c | 9.3 ± 0.9 b | 14.2 ± 2.6 a |
| Other species * | 7.8 ± 1.2 c | 11.5 ± 1.5 b | 16.8 ± 2.6 a | 0.1 ± 0.0 b | 0.3 ± 0.0 a | 0.5 ± 0.1 a | 2.9 ± 1.1 c | 4.4 ± 1.5 b | 8.3 ± 1.5 a |
| All species | 153.2 ± 15.5 c | 172.6 ± 9.4 b | 249.3 ± 10.9 a | 7.1 ± 0.4 b | 8.3 ± 0.7 b | 10.5 ± 0.8 a | 106.5 ± 8.2 c | 142.3 ± 7.5 b | 183.2 ± 8.9 a |
Table 5.
The volume of fallen, standing, and total DW (mean ± SD) in decay classes in different silvicultural managed stands at altitude <600 m. Sh, shelterwood silviculture; Sc, selection cutting silviculture; Pr, protected stand.
Table 5.
The volume of fallen, standing, and total DW (mean ± SD) in decay classes in different silvicultural managed stands at altitude <600 m. Sh, shelterwood silviculture; Sc, selection cutting silviculture; Pr, protected stand.
| Decay Class | Fallen DW | Standing DW | Total DW |
|---|
| Sh | Sc | Pr | Sh | Sc | Pr | Sh | Sc | Pr |
|---|
| DW Volume (m3 ha−1) |
|---|
| DC1 | 1.25 ± 0.21 c | 2.20 ± 0.28 b | 3.04 ± 0.15 a | 2.04 ± 0.12 c | 2.26 ± 0.14 b | 4.99 ± 0.30 a | 3.29 ± 0.22 c | 4.46 ± 0.20 b | 8.03 ± 0.68 a |
| DC2 | 0.84 ± 0.10 c | 1.55 ± 0.20 b | 2.70 ± 0.18 a | 1.48 ± 0.11 c | 2.13 ± 0.15 b | 4.62 ± 0.30 a | 2.32 ± 0.30 c | 3.68 ± 0.22 b | 7.32 ± 0.62 a |
| DC3 | 0.64 ± 0.07 c | 0.78 ± 0.11 b | 2.51 ± 0.20 a | 0.87 ± 0.11 c | 1.24 ± 0.17 b | 3.50 ± 0.32 a | 1.51 ± 0.14 c | 2.02 ± 0.14 b | 6.01 ± 0.60 a |
| DC4 | 0.19 ± 0.05 c | 0.58 ± 0.05 b | 2.41 ± 0.22 a | 0.55 ± 0.05 c | 0.88 ± 0.10 b | 2.32 ± 0.21 a | 0.74 ± 0.10 c | 1.46 ± 0.06 b | 4.73 ± 0.61 a |
| DC5 | 0.10 ± 0.02 c | 0.49 ± 0.05 b | 2.14 ± 1.85 a | 0.30 ± 0.05 c | 0.80 ± 0.08 b | 2.11 ± 0.15 a | 0.40 ± 0.07 c | 1.29 ± 0.05 b | 4.25 ± 0.46 a |
| Total | 3.02 ± 0.17 c | 5.60 ± 0.21 b | 12.80 ± 0.61 a | 5.24 ± 0.25 c | 7.31 ± 0.42 b | 17.57 ± 0.78 a | 8.26 ± 0.67 b | 12.91 ± 1.01 b | 30.37 ± 2.00 a |
Table 6.
Mean C-stock in DW decay classes different in silvicultural managed stands at altitude <600 m. Sh, shelter wood silviculture; Sc, selection cutting silviculture; Pr, protected stand.
Table 6.
Mean C-stock in DW decay classes different in silvicultural managed stands at altitude <600 m. Sh, shelter wood silviculture; Sc, selection cutting silviculture; Pr, protected stand.
| Decay Class of DW | C-Stock (t ha−1) |
|---|
| Sh | Sc | Pr |
|---|
| DC1 | 0.76 | 1.03 | 1.85 |
| DC2 | 0.41 | 0.65 | 1.30 |
| DC3 | 0.23 | 0.31 | 0.92 |
| DC4 | 0.09 | 0.18 | 0.57 |
| DC5 | 0.04 | 0.12 | 0.39 |
| All DW | 1.53 | 2.29 | 5.03 |
| Live trees | 34.05 | 45.42 | 58.64 |
Table 7.
Species’ composition and growing stock of living trees (mean ± SD) in different silvicultural managed forest at altitude of 600–1200 m. Sh, shelterwood silviculture; Sc, selection cutting silviculture; Pr, protected stand.
Table 7.
Species’ composition and growing stock of living trees (mean ± SD) in different silvicultural managed forest at altitude of 600–1200 m. Sh, shelterwood silviculture; Sc, selection cutting silviculture; Pr, protected stand.
| Tree Species | Tree Frequency (Stem ha−1) | Basal Area (m2 ha−1) | Volume (m3 ha−1) |
|---|
| Sh | Sc | Pr | Sh | Sc | Pr | Sh | Sc | Pr |
|---|
| Fagus oreintalis Lipsky | 38.6 ± 3.3 b | 43.5 ± 4.8 b | 61.5 ± 7.5 a | 2.5 ± 0.3 c | 3.9 ± 0.3 b | 4.5 ± 0.4 a | 35.2 ± 3.5 b | 51.5 ± 2.6 a | 50.1 ± 4.3 a |
| Carpinus betulus L. | 37.1 ± 3.5 c | 53.3 ± 3.4 a | 45.3 ± 5.5 b | 1.9 ± 0.2 c | 3.1 ± 0.3 b | 3.7 ± 0.3 a | 32.6 ± 3.1 b | 48.1 ± 3.6 a | 43.0 ± 3.5 a |
| Quercus castaneifolia C.A.M. | 36.6 ± 3.3 b | 35.4 ± 2.6 b | 45.7 ± 5.0 a | 0.5 ± 0.2 c | 1.0 ± 0.1 b | 2.1 ± 0.2 a | 27.3 ± 3.6 b | 30.1 ± 3.3 b | 43.6 ± 3.9 a |
| Alnus subcordata C.A.M. | 20.7 ± 2.9 b | 27.2 ± 2.5 a | 31.3 ± 3.0 a | 1.7 ± 0.2 b | 1.9 ± 0.2 b | 2.5 ± 0.2 a | 17.0 ± 2.4 c | 23.5 ± 2.9 b | 30.7 ± 3.0 a |
| Acer velutinum Boiss. | 17.0 ± 1.9 b | 23.1 ± 2.2 b | 35.2 ± 2.6 a | 1.1 ± 0.1 b | 1.5 ± 0.2 b | 2.0 ± 0.1 a | 10.3 ± 2.1 c | 19.5 ± 2.5 b | 24.3 ± 2.9 a |
| Acer cappadocicum Gled. | 12.7 ± 1.5 b | 16.4 ± 1.9 b | 33.5 ± 2.4 a | 1.0 ± 0.1 b | 1.1 ± 0.1 b | 1.7 ± 0.1 a | 6.0 ± 1.8 c | 14.4 ± 1.9 b | 21.0 ± 3.0 a |
| Fraxinus excelsior L. | 7.7 ± 1.5 b | 2.7 ± 1.5 c | 10.2 ± 1.3 a | 0.5 ± 0.1 a | 0.3 ± 0.0 a | 0.4 ± 0.0 a | 2.9 ± 0.5 b | 1.7 ± 0.7 c | 6.8 ± 1.1 a |
| Other species * | 4.8 ± 1.2 c | 7.5 ± 1.5 b | 11.6 ± 2.6 a | 0.3 ± 0.0 b | 0.7 ± 0.1 a | 0.7 ± 0.1 a | 1.7 ± 0.3 c | 3.9 ± 0.9 b | 7.7 ± 1.4 a |
| All species | 175.2 ± 15.3 c | 201.6 ± 11.6 b | 274.3 ± 10.6 a | 9.5 ± 1.0 c | 13.5 ± 1.1 b | 17.6 ± 1.2 a | 133.0 ± 8.8 c | 192.7 ± 12.9 b | 227.2 ± 9.5 a |
Table 8.
The volume of fallen, standing, and total DW (mean ± SD) by decay classes in different silvicultural managed stands at altitude 600–1200 m. Sh, shelter wood silviculture; Sc, selection cutting silviculture; Pr, protected stand.
Table 8.
The volume of fallen, standing, and total DW (mean ± SD) by decay classes in different silvicultural managed stands at altitude 600–1200 m. Sh, shelter wood silviculture; Sc, selection cutting silviculture; Pr, protected stand.
| Decay Class | Fallen DW | Standing DW | Total DW |
|---|
| Sh | Sc | Pr | Sh | Sc | Pr | Sh | Sc | Pr |
|---|
| DW Volume (m3 ha−1) |
|---|
| DC1 | 1.48 ± 0.25 c | 2.61 ± 0.27 b | 3.55 ± 0.20 a | 2.29 ± 0.14 c | 2.71 ± 0.18 b | 5.40 ± 0.72 a | 3.77 ± 0.22 c | 5.32 ± 0.32 b | 8.95 ± 0.68 a |
| DC2 | 0.95 ± 0.11 c | 1.97 ± 0.22 b | 3.21 ± 0.30 a | 1.85 ± 0.12 c | 2.46 ± 0.20 b | 5.08 ± 0.43 a | 2.80 ± 0.30 c | 4.43 ± 0.25 b | 8.29 ± 0.62 a |
| DC3 | 0.63 ± 0.08 c | 0.98 ± 0.14 b | 2.80 ± 0.21 a | 1.10 ± 0.10 c | 1.71 ± 0.16 b | 4.26 ± 0.40 a | 1.73 ± 0.14 c | 2.69 ± 0.16 b | 7.06 ± 0.60 a |
| DC4 | 0.21 ± 0.05 c | 0.80 ± 0.08 b | 2.76 ± 0.20 a | 0.78 ± 0.06 c | 1.00 ± 0.12 b | 3.32 ± 0.34 a | 0.99 ± 0.10 c | 1.80 ± 0.06 b | 6.08 ± 0.61 a |
| DC5 | 0.10 ± 0.02 c | 0.58 ± 0.05 b | 2.30 ± 0.17 a | 0.35 ± 0.04 c | 0.92 ± 0.08 b | 3.07 ± 0.33 a | 0.45 ± 0.07 c | 1.50 ± 0.07 b | 5.37 ± 0.46 a |
| Total | 3.37 ± 0.11 c | 6.94 ± 0.26 b | 14.62 ± 0.75 a | 6.37 ± 0.35 c | 8.80 ± 0.46 b | 21.13 ± 0.9 a | 9.74 ± 1.02 c | 15.74 ± 1.27 b | 35.75 ± 3.00 a |
Table 9.
Mean C-stock in DW decay classes different in silvicultural managed stands at altitude 600–1200 m. Sh, shelter wood silviculture; Sc, selection cutting silviculture; Pr, protected stand.
Table 9.
Mean C-stock in DW decay classes different in silvicultural managed stands at altitude 600–1200 m. Sh, shelter wood silviculture; Sc, selection cutting silviculture; Pr, protected stand.
| Decay Class of DW | C-Stock (t ha−1) |
|---|
| Sh | Sc | Pr |
|---|
| DC1 | 0.87 | 1.23 | 2.06 |
| DC2 | 0.50 | 0.79 | 1.47 |
| DC3 | 0.21 | 0.41 | 1.08 |
| DC4 | 0.11 | 0.22 | 0.72 |
| DC5 | 0.04 | 0.14 | 0.49 |
| All DW | 1.73 | 2.79 | 5.82 |
| Live trees | 41.52 | 62.09 | 72.83 |
Table 10.
Species’ composition and growing stock of living trees (mean ± SD) in different silvicultural managed forest at altitude of >1200 m. Sh, shelterwood silviculture; Sc, selection cutting silviculture; Pr, protected stand.
Table 10.
Species’ composition and growing stock of living trees (mean ± SD) in different silvicultural managed forest at altitude of >1200 m. Sh, shelterwood silviculture; Sc, selection cutting silviculture; Pr, protected stand.
| Tree Species | Tree frequency (Stem ha−1) | Basal Area (m2 ha−1) | Volume (m3 ha−1) |
|---|
| Sh | Sc | Pr | Sh | Sc | Pr | Sh | Sc | Pr |
|---|
| Fagus orientalis Lipsky | 49.5 ± 4.0 c | 63.7 ± 4.6 b | 78.6 ± 5.7 a | 4.4 ± 0.2 c | 5.6 ± 0.3 b | 6.9 ± 0.5 a | 36.4 ± 3.8 c | 55.7 ± 4.1 a | 59.3 ± 5.5 a |
| Carpinus betulus L. | 30.2 ± 3.7 c | 40.3 ± 4.8 b | 51.2 ± 4.9 a | 2.2 ± 0.1 b | 2.3 ± 0.2 b | 4.6 ± 0.3 a | 21.2 ± 3.0 c | 40.6 ± 3.5 a | 33.8 ± 3.5 a |
| Alnus subcordata C.A.M. | 37.5 ± 3.5 b | 40.9 ± 4.3 ab | 44.7 ± 3.3 a | 3.3 ± 0.2 a | 3.8 ± 0.3 a | 2.0 ± 0.2 b | 27.0 ± 3.1 c | 40.2 ± 3.5 a | 35.0 ± 3.3 a |
| Acer veletinum Boiss. | 37.0 ± 3.9 c | 44.2 ± 4.0 b | 53.2 ± 5.0 a | 0.6 ± 0.1 b | 1.3 ± 0.1 a | 1.4 ± 0.1 a | 29.1 ± 3.4 b | 27.0 ± 2.8 b | 37.5 ± 3.5 a |
| Acer cappadocicum Gled. | 18.1 ± 2.4 c | 27.0 ± 3.1 b | 39.2 ± 3.8 a | 0.3 ± 0.1 c | 0.7 ± 0.1 b | 1.1 ± 0.1 a | 13.1 ± 2.2 b | 17.3 ± 2.5 b | 31.0 ± 3.2 a |
| Ulmus glabra Huds. | 13.0 ± 1.6 c | 19.9 ± 3.0 b | 26.3 ± 3.5 a | 0.1 ± 0.0 c | 0.4 ± 0.1 b | 1.2 ± 0.1 a | 7.6 ± 1.4 c | 12.8 ± 1.3 b | 24.7 ± 3.0 a |
| Tilia begonifolia Stev. | 11.2 ± 1.5 c | 18.5 ± 2.6 b | 26.0 ± 3.1 a | 0.1 ± 0.0 b | 0.2 ± 0.0 b | 0.9 ± 0.1 a | 5.8 ± 1.3.5 b | 6.8 ± 1.0 b | 17.3 ± 2.4 a |
| Zelkova caprinifolia Dipp. | 7.6 ± 0.9 c | 12.1 ± 2.3 b | 19.1 ± 2.4 a | 0.1 ± 0.0 c | 0.4 ± 0.1 b | 0.7 ± 0.1 a | 2.3 ± 0.5 b | 6.8 ± 0.6 b | 18.6 ± 2.0 a |
| Other species * | 4.3 ± 0.9 b | 8.0 ± 2.5 a | 11.0 ± 2.3 a | 0.1 ± 0.0 b | 0.3 ± 0.1 b | 0.7 ± 0.1 a | 1.8 ± 0.7 c | 3.5 ± 1.8 b | 7.3 ± 1.9 a |
| All species | 208.2 ± 14.2 c | 274.6 ± 9.7 b | 349.3 ± 16.0 a | 11.2 ± 1.3 c | 15.0 ± 1.3 b | 19.5 ± 1.7 a | 144.3 ± 9.6 c | 210.7 ± 6.6 b | 264.5 ± 8.9 a |
Table 11.
The volume of fallen, standing, and total of DW (mean ± SD) in decay classes in different silvicultural managed stands at altitude > 1200 m. Sh, shelter wood silviculture; Sc, selection cutting silviculture; Pr, protected stand.
Table 11.
The volume of fallen, standing, and total of DW (mean ± SD) in decay classes in different silvicultural managed stands at altitude > 1200 m. Sh, shelter wood silviculture; Sc, selection cutting silviculture; Pr, protected stand.
| Decay Class | Fallen DW | Standing DW | Total DW |
|---|
| Sh | Sc | Pr | Sh | Sc | Pr | Sh | Sc | Pr |
|---|
| DW Volume (m3 ha−1) |
|---|
| DC1 | 2.21 ± 0.25 c | 3.17 ± 0.27 b | 4.73 ± 0.32 a | 2.83 ± 0.19 c | 3.05 ± 0.21 b | 6.40 ± 0.80 a | 5.04 ± 0.31 c | 6.22 ± 0.53 b | 11.13 ± 0.88 a |
| DC2 | 1.10 ± 0.11 c | 2.08 ± 0.22 b | 4.08 ± 0.30 a | 2.05 ± 0.20 c | 3.02 ± 0.20 b | 5.08 ± 0.52 a | 3.15 ± 0.35 c | 5.10 ± 0.44 b | 9.16 ± 0.83 a |
| DC3 | 0.72 ± 0.08 c | 1.10 ± 0.14 b | 3.11 ± 0.24 a | 1.23 ± 0.15 c | 2.05 ± 0.19 b | 4.31 ± 0.37 a | 1.95 ± 0.20 c | 3.15 ± 0.27 b | 7.42 ± 0.72 a |
| DC4 | 0.34 ± 0.05 c | 0.83 ± 0.08 b | 3.05 ± 0.25 a | 0.90 ± 0.08 c | 1.06 ± 0.11 b | 4.22 ± 0.35 a | 1.24 ± 0.16 c | 1.89 ± 0.10 b | 7.27 ± 0.70 a |
| DC5 | 0.13 ± 0.02 c | 0.51 ± 0.05 b | 2.55 ± 0.22 a | 0.45 ± 0.03 c | 1.00 ± 0.08 b | 4.05 ± 0.35 a | 0.58 ± 0.07 c | 1.51 ± 0.09 b | 6.60 ± 0.85 a |
| Total | 4.50 ± 0.30 c | 7.69 ± 0.29 b | 17.52 ± 1.02 a | 7.46 ± 0.39 c | 10.18 ± 0.55 b | 24.06 ± 0.8 a | 11.96 ± 1.11 c | 17.87 ± 1.90 b | 41.58 ± 3.00 a |
Table 12.
Mean C-stock in DW decay classes in different silvicultural managed stands at altitude >1200 m. Sh, shelter wood silviculture; Sc, selection cutting silviculture; Pr, protected stand.
Table 12.
Mean C-stock in DW decay classes in different silvicultural managed stands at altitude >1200 m. Sh, shelter wood silviculture; Sc, selection cutting silviculture; Pr, protected stand.
| Decay Class | C-Stock (t ha−1) |
|---|
| Sh | Sc | Pr |
|---|
| DC1 | 1.16 | 1.43 | 2.56 |
| DC2 | 0.56 | 0.91 | 1.63 |
| DC3 | 0.30 | 0.48 | 1.14 |
| DC4 | 0.15 | 0.23 | 0.87 |
| DC5 | 0.05 | 0.14 | 0.60 |
| All DW | 2.22 | 3.19 | 6.80 |
| Live trees | 46.04 | 67.70 | 85.09 |
Table 13.
ANOVA results (F-value) for effect of silvicultural management method, altitude, and their interaction on frequency and volume of live trees, DW, and C-stock. * p < 0.05, ** p < 0.01, N.S. = No significance.
Table 13.
ANOVA results (F-value) for effect of silvicultural management method, altitude, and their interaction on frequency and volume of live trees, DW, and C-stock. * p < 0.05, ** p < 0.01, N.S. = No significance.
| | | Silviculture Method | Altitude | Silviculture Method × Altitude |
|---|
| Live trees | Frequency (n ha−1) | 124.683 ** | 47.134 ** | 26.010 ** |
| Volume (m3 ha−1) | 173.528 ** | 34.119 ** | 33.832 ** |
| Fallen DW | Frequency (n ha−1) | 257.206 ** | 22.407 ** | 21.744 ** |
| Volume (m3 ha−1) | 183.010 ** | 10.065 * | 8.270 * |
| Standing DW | Frequency (n ha−1) | 79.450 ** | 10.186 * | 4.031 N.S. |
| Volume (m3 ha−1) | 53.340 ** | 9.706 * | 4.317 N.S. |
| Total DW | Frequency (n ha−1) | 177.539 ** | 9.100 * | 5.192 N.S. |
| Volume (m3 ha−1) | 59.402 ** | 7.106 * | 3.005 N.S. |
| C-stock | Live trees (t ha−1) | 40.610 ** | 7.230 * | 7.028 * |
| Fallen DW (t ha−1) | 23.950 ** | 7.300 * | 8.603 * |
| Standing DW (t ha−1) | 93.404 ** | 13.483 ** | 7.555 * |
| Total DW (t ha−1) | 33.119 ** | 11.560 ** | 14.427 ** |

 ,
, 


