
Spatio-Temporal Change of Multiple Ecosystem Services and Their Driving Factors: A Case Study in Beijing, China


Abstract
:1. Introduction
2. Materials and Methods
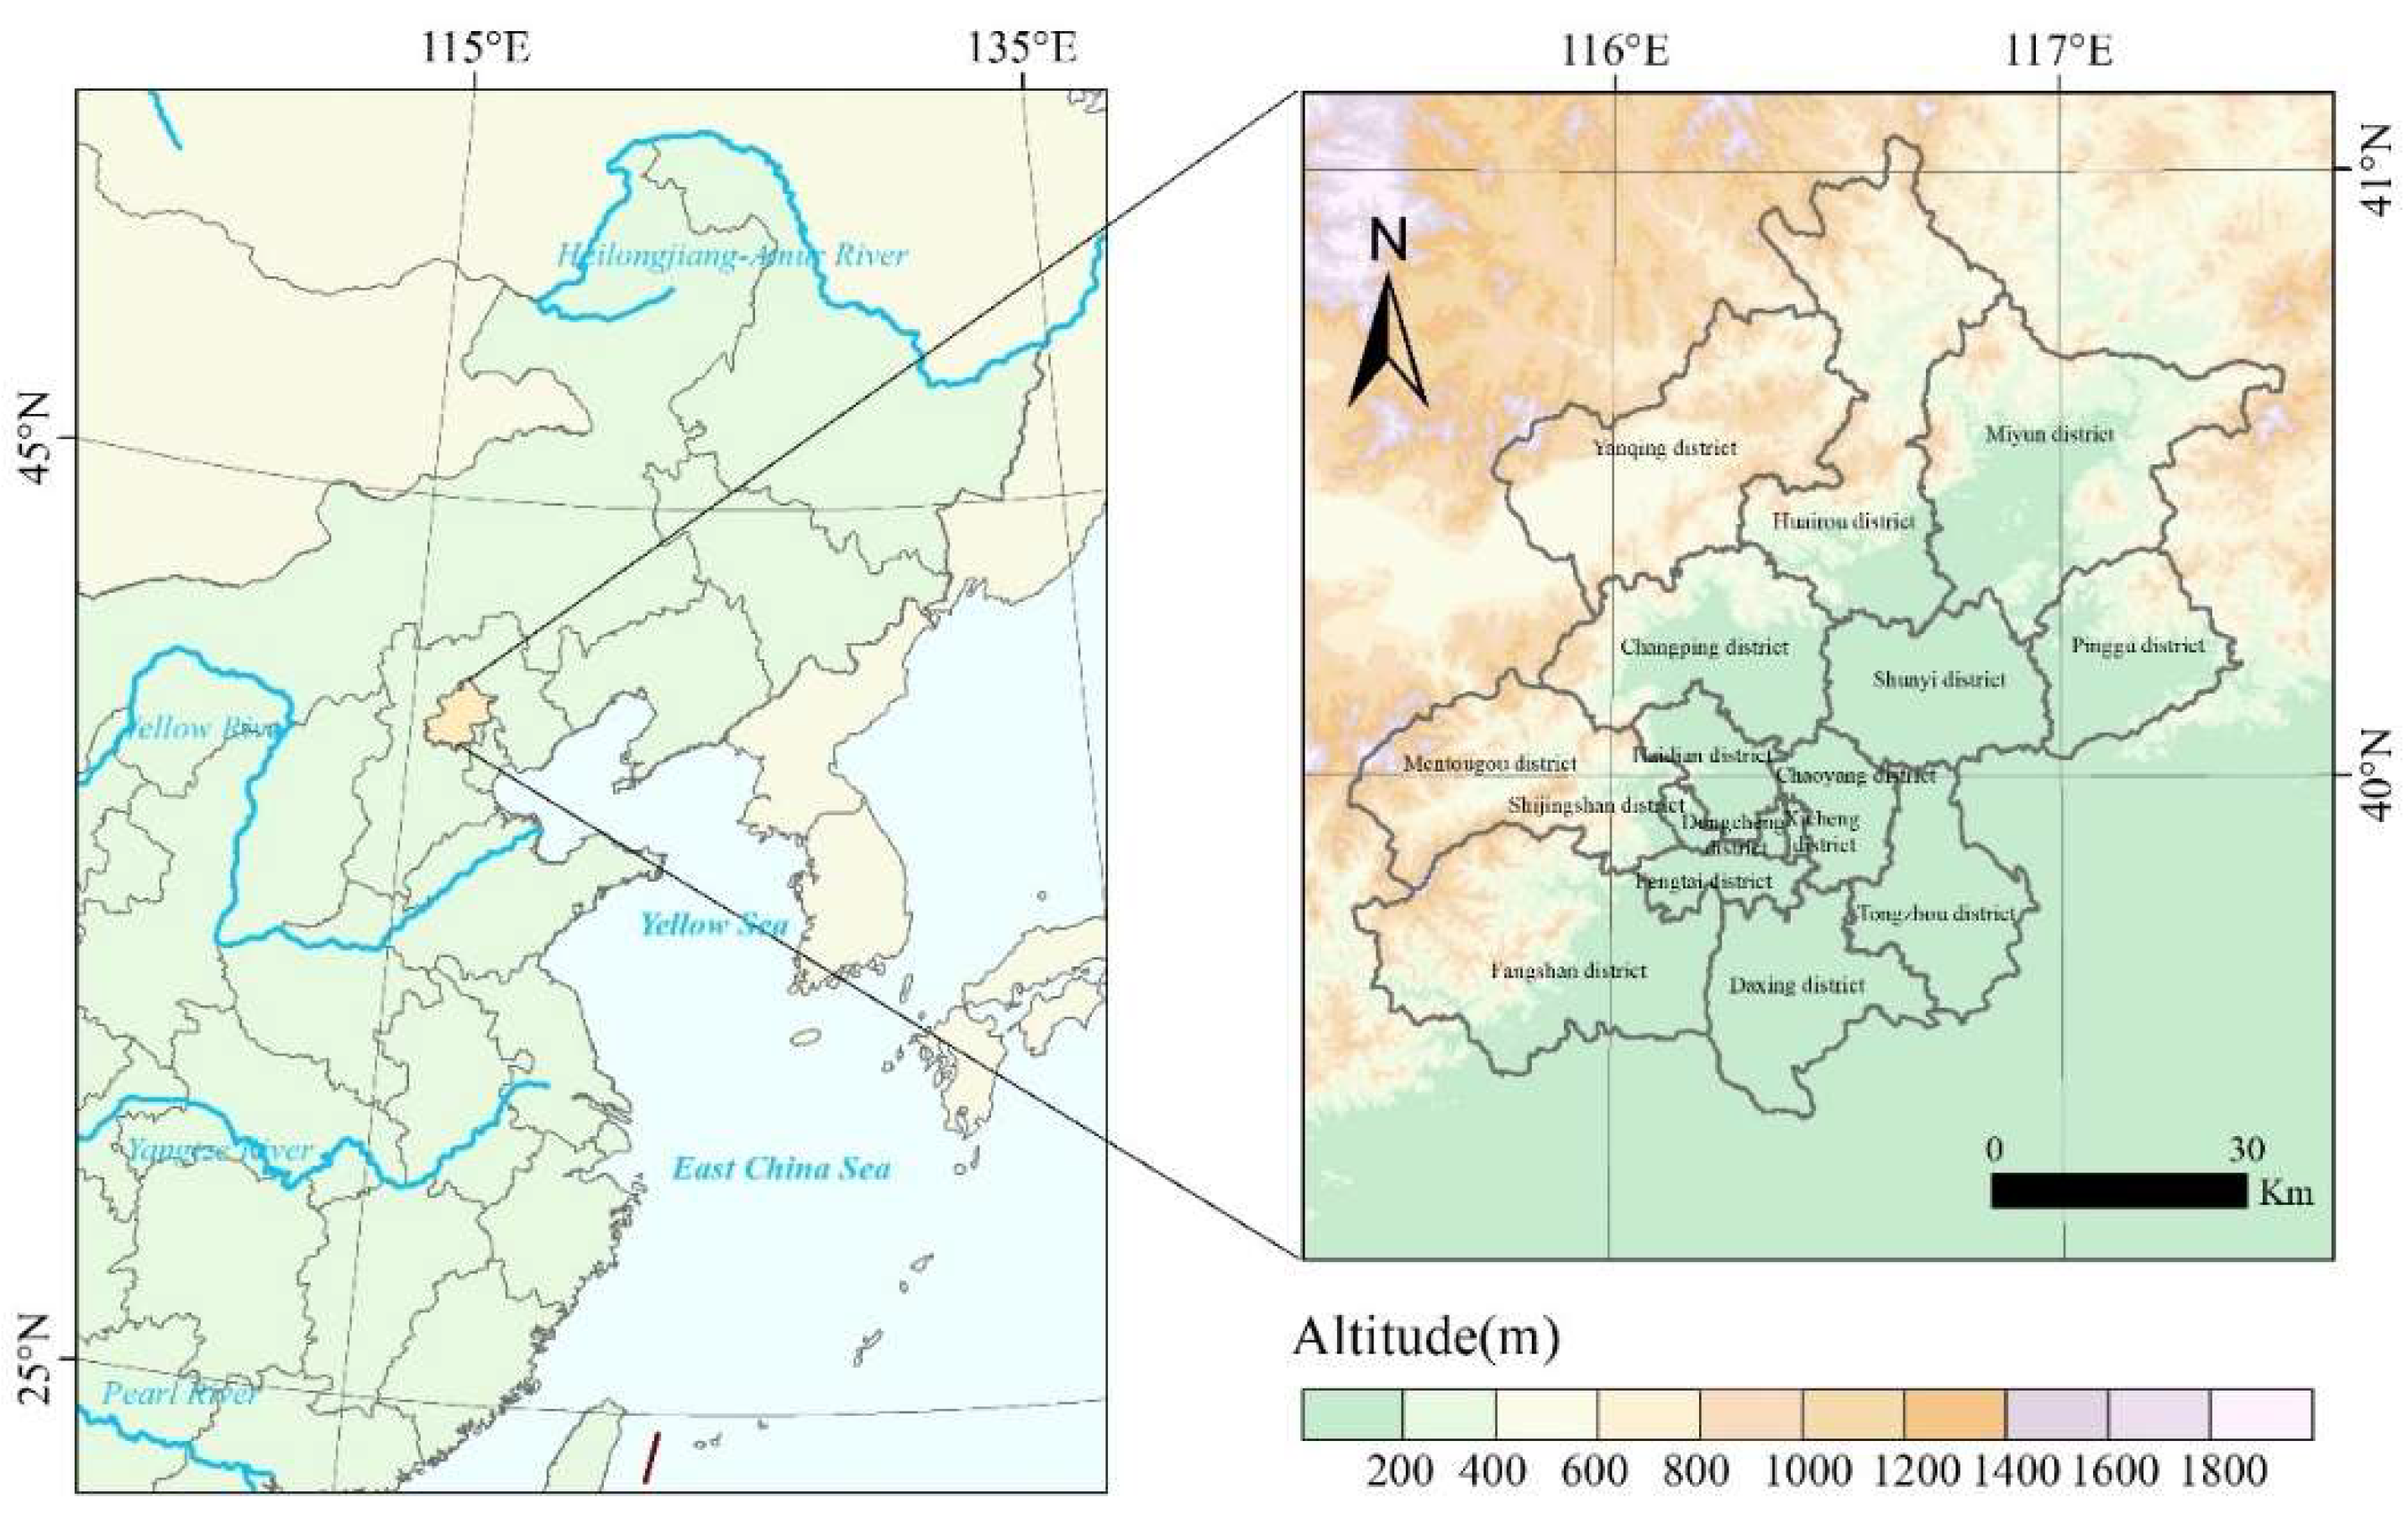
2.1. Study Area
2.2. Data Sources
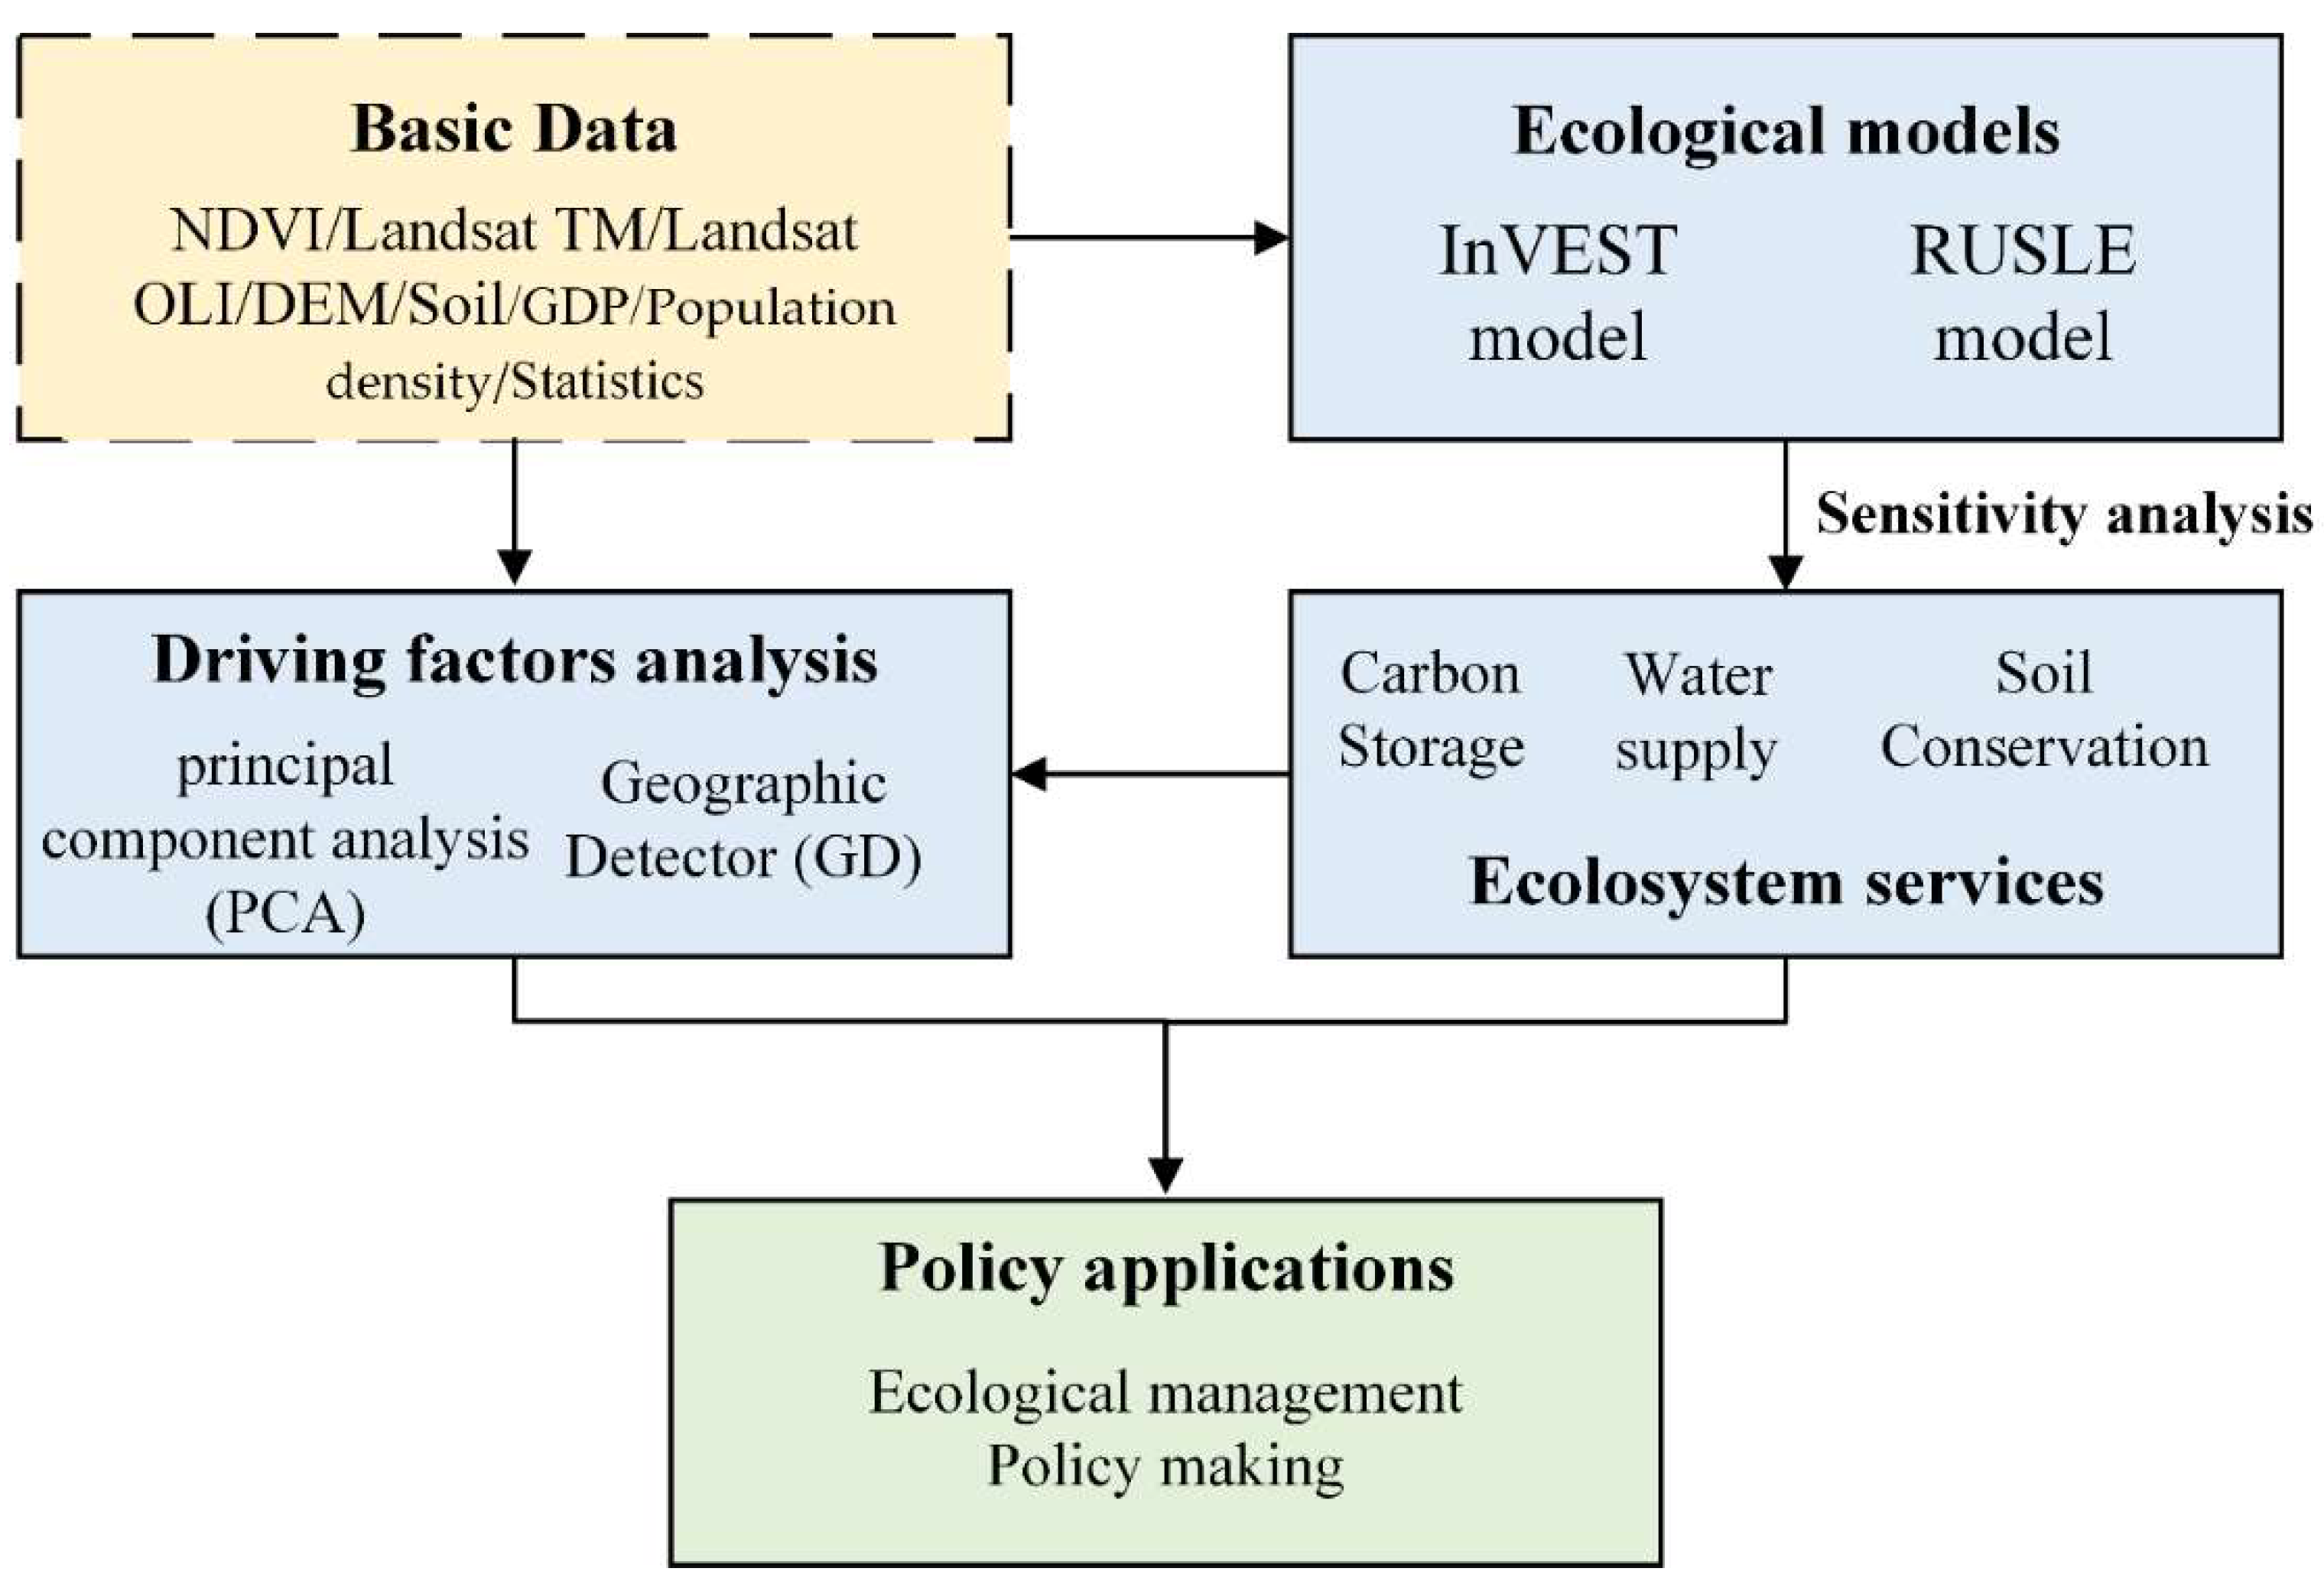
2.3. Methods
2.3.1. LULC Maps
2.3.2. Sensitivity Analysis
2.3.3. Carbon Storage
2.3.4. Water Yield
2.3.5. Soil Conservation
2.3.6. Identification of Driving Factors
2.3.7. Factors Influencing ESs
3. Results
3.1. Land Use Changes from 1985 to 2020 in Beijing
3.2. Sensitivity of Parameters
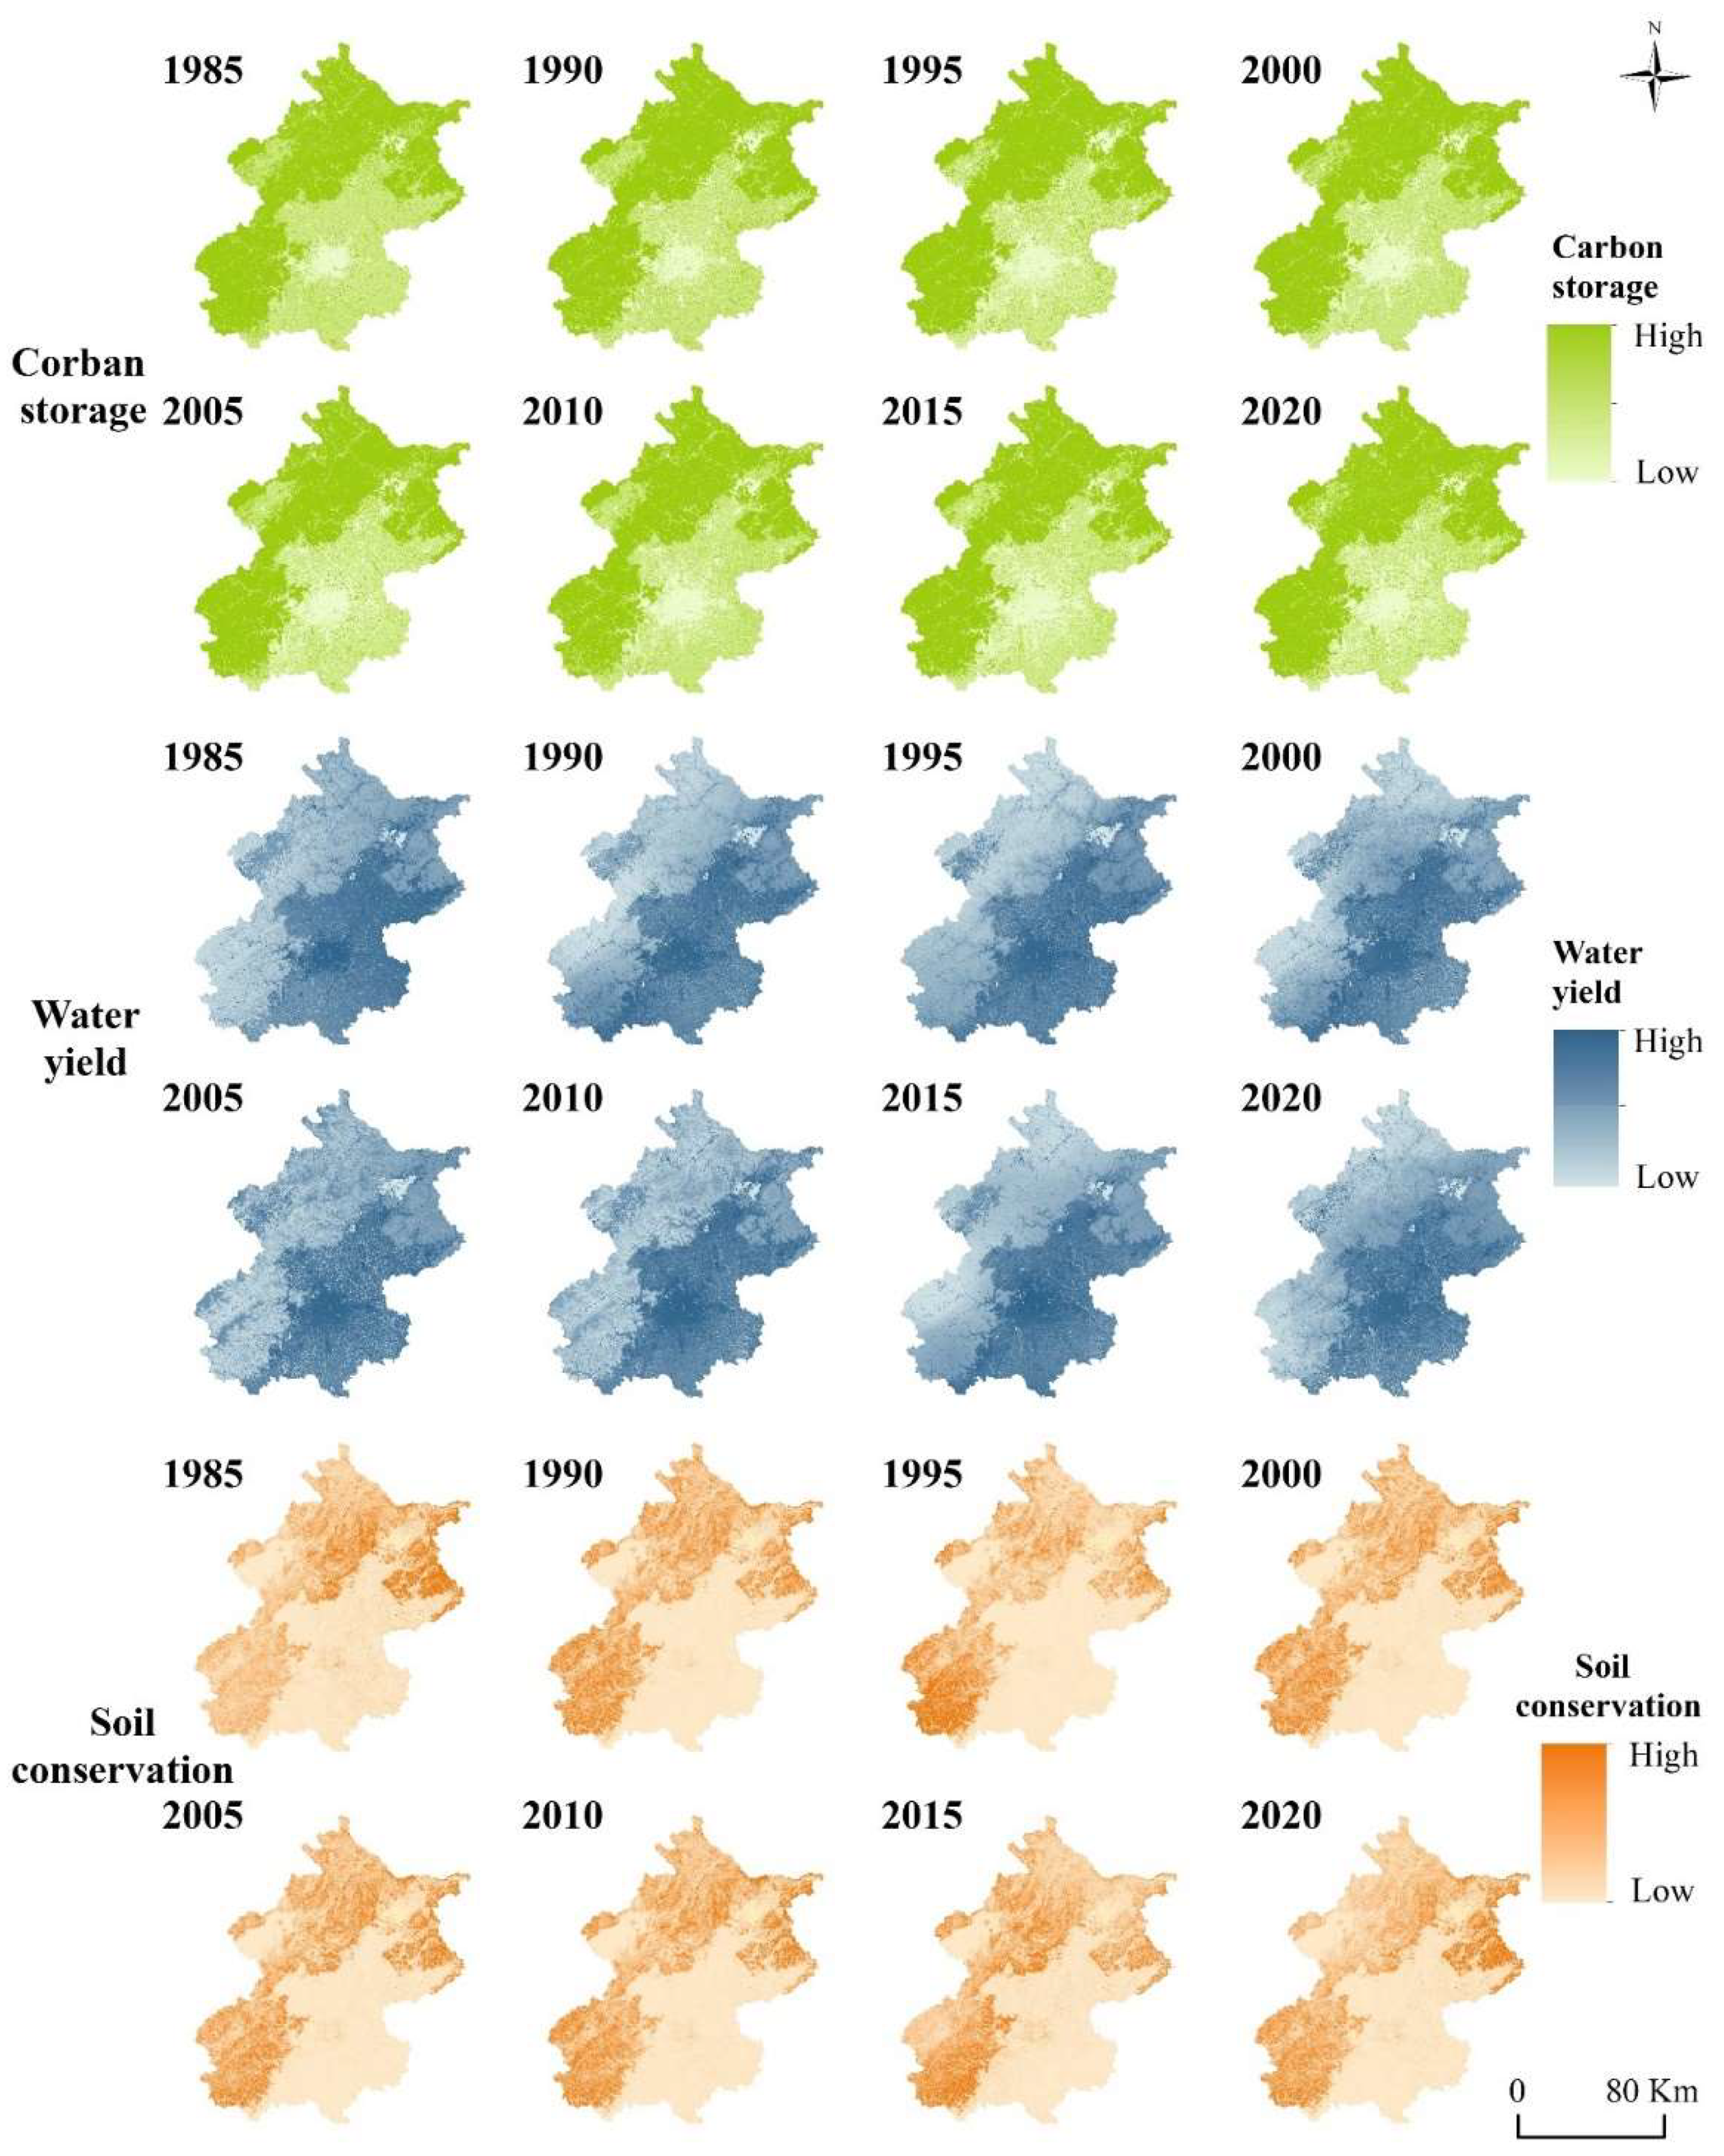
3.3. Spatio-Temporal Changes in ESs from 1985 to 2020
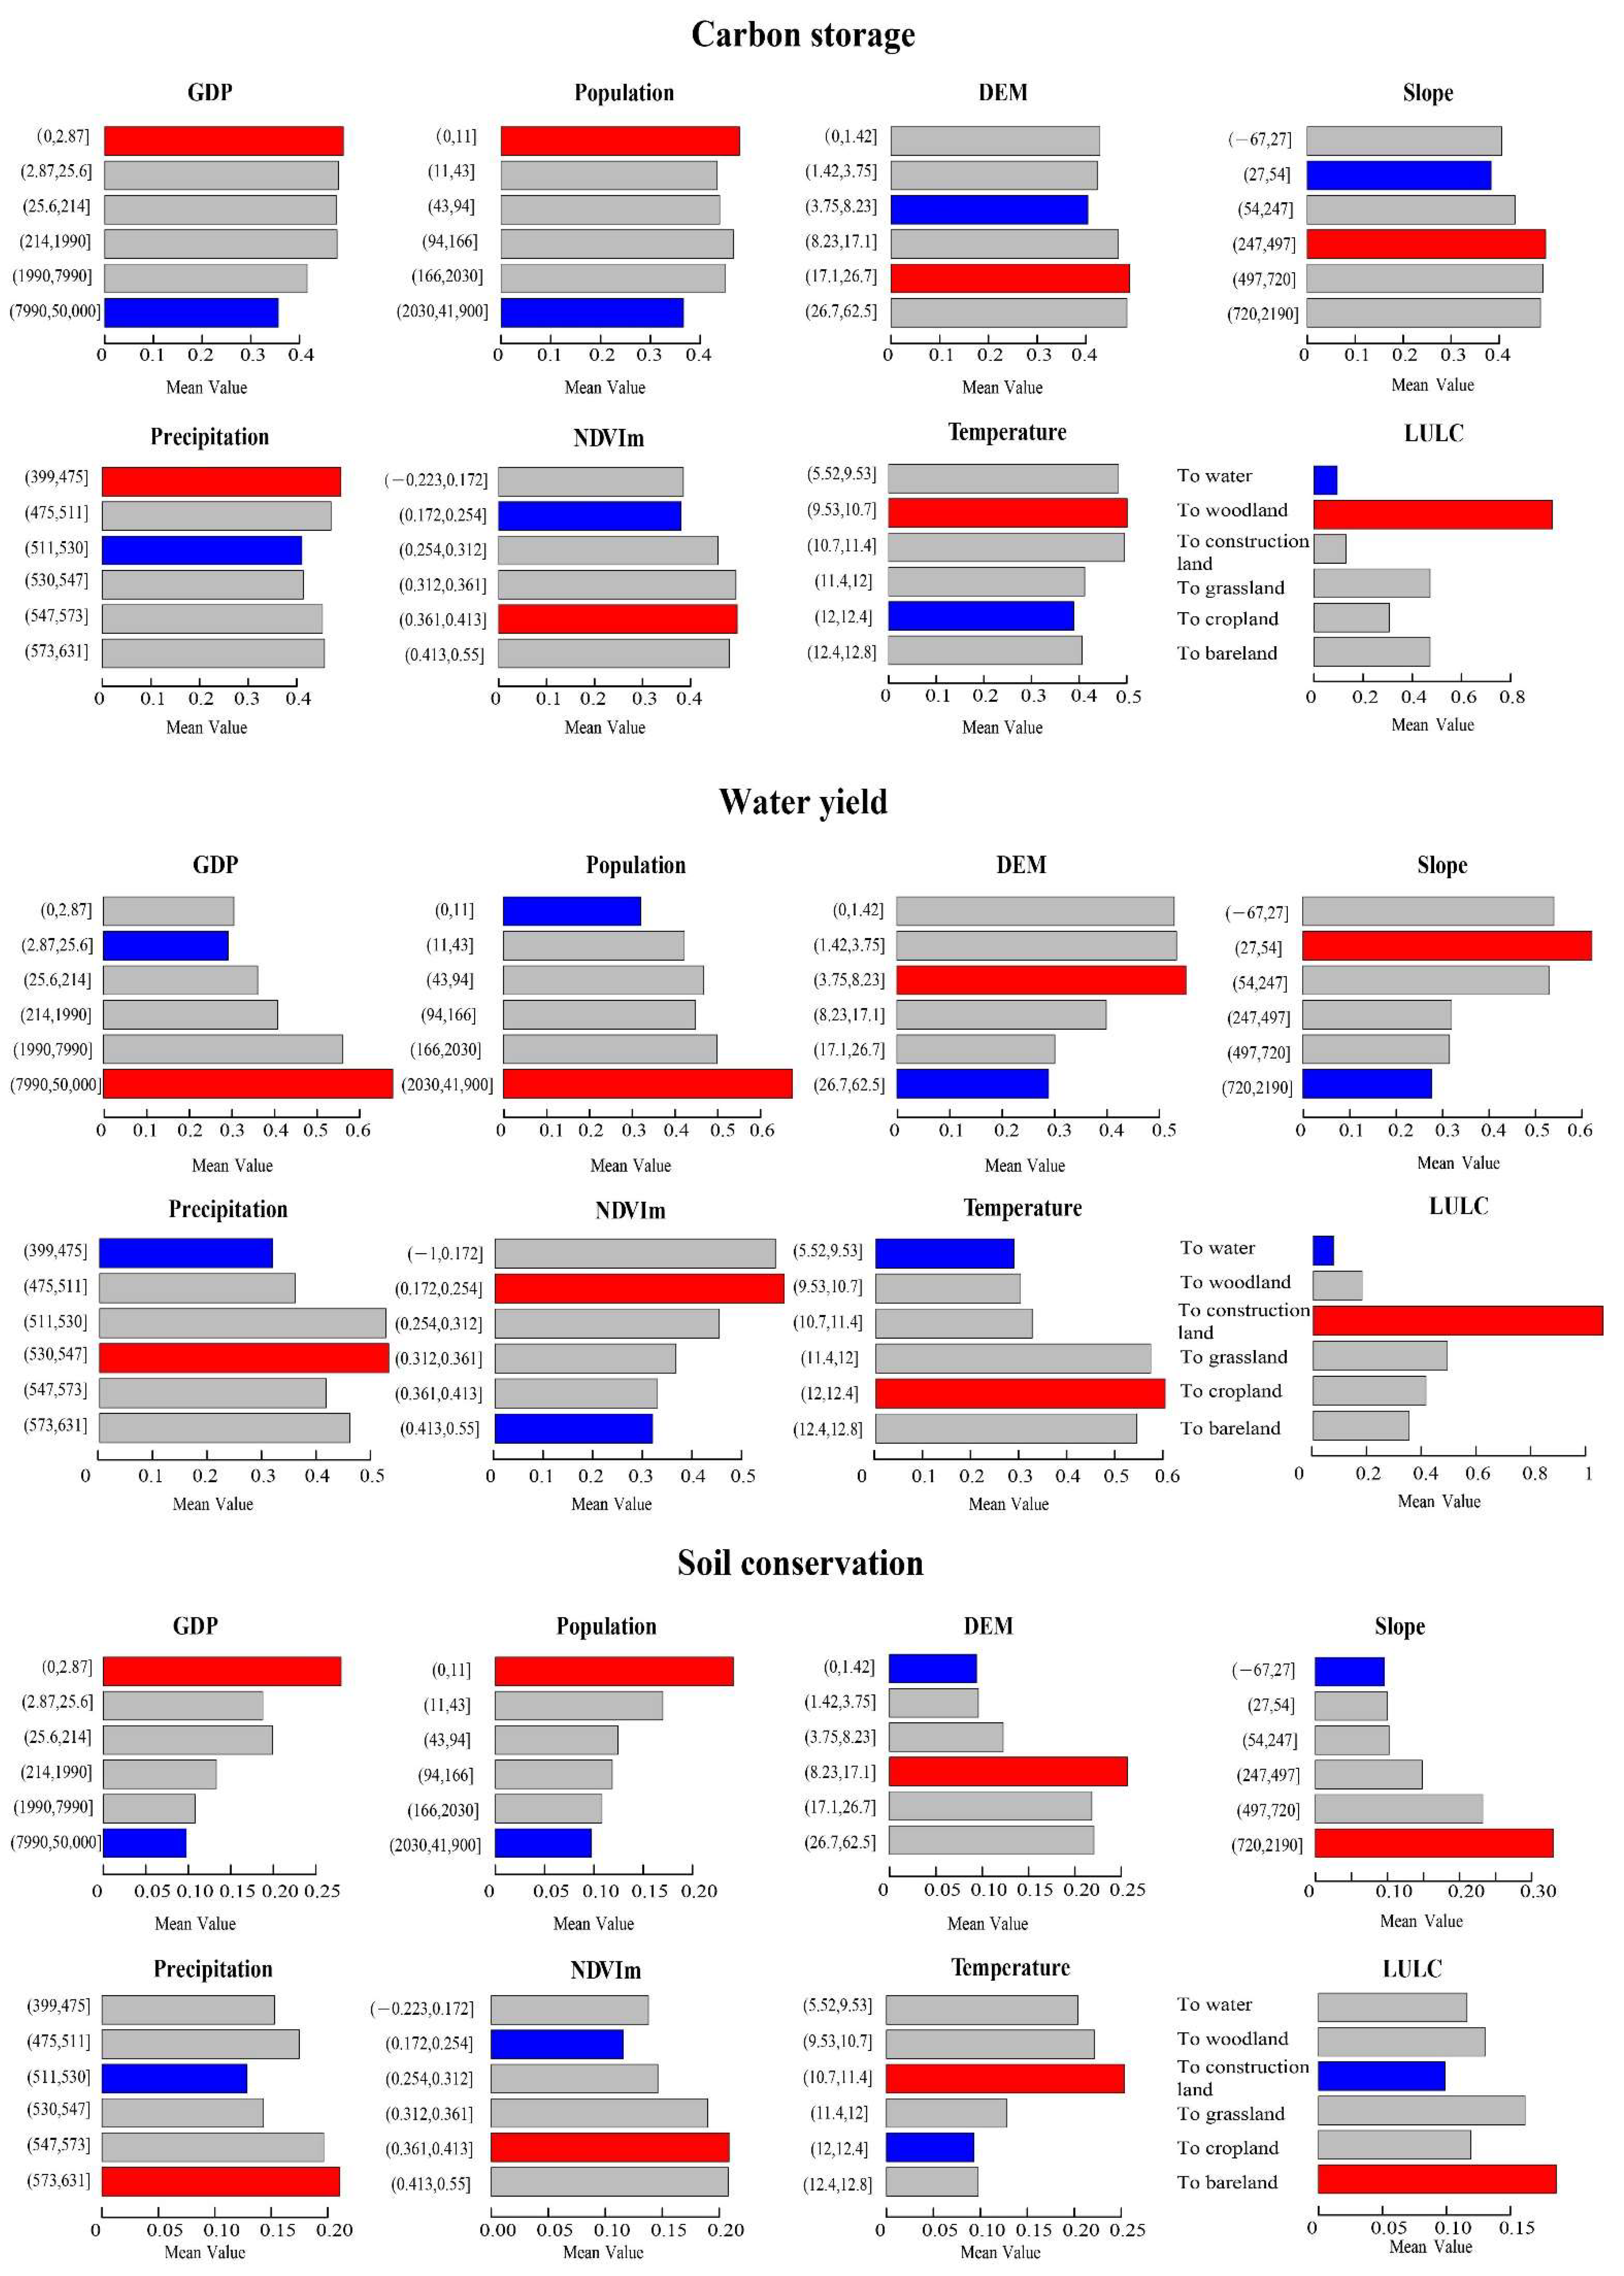
3.4. Driving Factor Analysis
4. Discussion
4.1. Comparison with Previous Studies
4.2. Strengths and Limitations
5. Conclusions
Author Contributions
Funding
Institutional Review Board Statement
Informed Consent Statement
Data Availability Statement
Acknowledgments
Conflicts of Interest
References
- Costanza, R.; d’Arge, R.; Groot, R.D.; Farber, S.; Grasso, M.; Hannon, B.; Limburg, K.; Naeem, S.; O’Neill, R.V.; Paruelo, J.; et al. The value of the world’s ecosystem services and natural capital. Nature 1997, 387, 253–260. [Google Scholar] [CrossRef]
- Daily, G.C.; Matson, P.A. Ecosystem services: From theory to implementation. Proc.Natl.Acad.Sci.U.S.A. 2008, 105(28), 9455–9456. [Google Scholar] [CrossRef] [PubMed] [Green Version]
- Benjamin, B.; Neville, C.; Stoyan, N.; Katalin, P.; Rob, A. Mapping and modelling ecosystem services for science, policy and practice. Ecosyst. Serv. 2013, 4, 1–3. [Google Scholar] [CrossRef]
- Luo, Q.L.; Zhou, J.F.; Li, Z.G.; Yu, B.L. Spatial differences of ecosystem services and their driving factors: A comparation analysis among three urban agglomerations in China’s Yangtze River Economic Belt. Sci. Total Environ. 2020, 725, 138452. [Google Scholar] [CrossRef] [PubMed]
- Rositano, F.; Bert, F.E.; Piñeiro, G.; Ferraro, D.O. Identifying the factors that determine ecosystem services provision in Pampean agroecosystems (Argentina) using a data-mining approach. Environ. Dev. 2018, 25, 3–11. [Google Scholar] [CrossRef] [Green Version]
- Lyu, R.F.; Clarke, K.C.; Zhang, J.M.; Feng, J.L.; Jia, X.H.; Li, J.J. Spatial correlations among ecosystem services and their socio-ecological driving factors: A case study in the city belt along the Yellow River in Ningxia, China. Appl. Geogr. 2019, 108, 64–73. [Google Scholar] [CrossRef] [Green Version]
- MEA. Millennium Ecosystem Assessment: Ecosystems and Human Well-Being; Island Press: Washington, DC, USA, 2005. [Google Scholar]
- Pan, Z.Z.; He, J.H.; Liu, D.F.; Wang, J.W.; Guo, X.N. Ecosystem health assessment based on ecological integrity and ecosystem services demand in the Middle Reaches of the Yangtze River Economic Belt, China. Sci. Total Environ. 2021, 774, 144837. [Google Scholar] [CrossRef]
- Callesen, I. Biodiversity and ecosystem services in life cycle impact assessment—Inventory objects or impact categories? Ecosyst. Serv. 2016, 22, 94–103. [Google Scholar] [CrossRef]
- Yu, K.J.; Gong, Y. Exploration on Ecological Restoration Model for the Improvement of Ecosystem Services of Yellow River Floodplains—A Case Study of Zhengzhou Yellow River Floodplain Park Planning and Design. Landscape Architecture Frontiers 2021, 9, 86–97. [Google Scholar] [CrossRef]
- Li, Z.H.; Deng, X.Z.; Jin, G.; Mohmmed, A.; Arowolo, A.O. Tradeoffs between agricultural production and ecosystem services: A case study in Zhangye, Northwest China. Sci. Total Environ. 2020, 707, 136032. [Google Scholar] [CrossRef]
- Mahmoud, S.H.; Gan, T.Y. Impact of anthropogenic climate change and human activities on environment and ecosystem services in arid regions. Sci. Total Environ. 2018, 633, 1329–1344. [Google Scholar] [CrossRef] [PubMed]
- Bai, Y.; Ochuodho, T.O.; Yang, J. Impact of land use and climate change on water-related ecosystem services in Kentucky, USA. Ecol. Indic. 2019, 102, 51–64. [Google Scholar] [CrossRef]
- Strefler, J.; Kriegler, E.; Bauer, N.; Luderer, G.; Pietzcker, R.C.; Giannousakis, A.; Edenhofer, O. Alternative carbon price trajectories can avoid excessive carbon removal. Nat. Commun. 2021, 12, 2264. [Google Scholar] [CrossRef] [PubMed]
- Li, B.; Sivapalan, M. Long-Term Coevolution of an Urban Human-Water System Under Climate Change: Critical Role of Human Adaptive Actions. Water Resour. Res. 2020, 56, e2020WR027931. [Google Scholar] [CrossRef]
- Gao, J.; Tang, X.G.; Lin, S.Q.; Bian, H.Y. The Influence of Land Use Change on Key Ecosystem Services and Their Relationships in a Mountain Region from Past to Future (1995-2050). Forests. 2021, 12, 616. [Google Scholar] [CrossRef]
- Sun, X.; Li, F. Spatio-temporal assessment and trade-offs of multiple ecosystem services based on land use changes in Zengcheng, China. Sci. Total Environ. 2017, 609, 1569–1581. [Google Scholar] [CrossRef]
- Haas, J.; Ban, Y.F. Urban growth and environmental impacts in Jing-Jin-Ji, the Yangtze, River Delta and the Pearl River Delta. Int. J. Appl Earth Obs. Geoinf. 2014, 30, 42–55. [Google Scholar] [CrossRef]
- Qiu, B.K.; Li, H.L.; Zhou, M.; Zhang, L. Vulnerability of ecosystem services provisioning to urbanization: A case of China. Ecol. Indic. 2015, 57, 505–513. [Google Scholar] [CrossRef]
- Sun, X.; Lu, Z.M.; Li, F.; Crittenden, J.C. Analyzing spatio-temporal changes and trade-offs to support the supply of multiple ecosystem services in Beijing, China. Ecol. Indic. 2018, 94, 117–129. [Google Scholar] [CrossRef]
- Hu, T.; Wu, J.S.; Li, W.F. Assessing relationships of ecosystem services on multi-scale: A case study of soil erosion control and water yield in the Pearl River Delta. Ecol. Indic. 2019, 99, 193–202. [Google Scholar] [CrossRef]
- Jiang, W.G.; Deng, Y.; Tang, Z.H.; Lei, X.; Chen, Z. Modelling the potential impacts of urban ecosystem changes on carbon storage under different scenarios by linking the CLUE-S and the InVEST models. Ecol. Model. 2017, 345, 30–40. [Google Scholar] [CrossRef]
- Zhang, Y.X.; Min, Q.W.; Zhao, G.G.; Jiao, W.J.; Liu, W.W.; Bijaya, G.C.D.; Lu, L. Can Clean Energy Policy Improve the Quality of Alpine Grassland Ecosystem? A Scenario Analysis to Influence the Energy Changes in the Three-River Headwater Region, China. Sustainability 2016, 8, 231. [Google Scholar] [CrossRef] [Green Version]
- Cheng, F.Y.; Liu, S.L.; Hou, X.Y.; Zhang, Y.Q.; Dong, S.K. Response of bioenergy landscape patterns and the provision of biodiversity ecosystem services associated with land-use changes in Jinghong County, Southwest China. Landsc. Ecol. 2018, 33, 783–798. [Google Scholar] [CrossRef]
- Wang, J.T.; Peng, J.; Zhao, M.Y.; Liu, Y.X.; Chen, Y.Q. Significant trade-off for the impact of Grain-for-Green Programme on ecosystem services in North-western Yunnan, China. Sci. Total Environ. 2017, 574, 57–64. [Google Scholar] [CrossRef] [PubMed]
- Chen, C.; Park, T.; Wang, X.H.; Piao, S.L.; Xu, B.D.; Chaturvedi, R.K.; Fuchs, R.; Brovkin, V.; Ciais, P.; Fensholt, R.; et al. China and India lead in greening of the world through land-use management. Nat. Sustain. 2019, 2, 122–129. [Google Scholar] [CrossRef]
- Fang, L.L.; Wang, L.C.; Chen, W.X.; Sun, J.; Cao, Q.; Wang, S.Q.; Wang, L.Z. Identifying the impacts of natural and human factors on ecosystem service in the Yangtze and Yellow River Basins. J. Clean. Prod. 2021, 314, 127995. [Google Scholar] [CrossRef]
- Zhang, Z.M.; Gao, J.F.; Fan, X.Y.; Lan, Y.; Zhao, M.S. Response of ecosystem services to socio-economic development in the Yangtze River Basin, China. Ecol. Indic. 2017, 72, 481–493. [Google Scholar] [CrossRef]
- Zhang, Z.M.; Peng, J.; Xu, Z.H.; Wang, X.Y.; Meersmans, J. Ecosystem services supply and demand response to urbanization: A case study of the Pearl River Delta, China. Ecosyst. Serv. 2021, 49, 101274. [Google Scholar] [CrossRef]
- Chen, T.Q.; Feng, Z.; Zhao, H.F.; Wu, K.N. Identification of ecosystem service bundles and driving factors in Beijing and its surrounding areas. Sci. Total Environ. 2020, 711, 134687. [Google Scholar] [CrossRef]
- Luo, Q.L.; Zhang, X.L.; Li, Z.G.; Yang, M.; Lin, Y.H. The effects of China’s ecological control line policy on ecosystem services: The case of Wuhan City. Ecol. Indic. 2018, 93, 292–301. [Google Scholar] [CrossRef]
- Jia, B.Q.; Qiu, K.B. The cooling effect of plain afforestation in the Beijing Project and its remote sensing-based valuation. Acta Ecol. Sin. 2017, 37, 726–735. (In Chinese) [Google Scholar]
- Gong, S.H.; Xiao, Y.; Xiao, Y.; Zhang, L.; Ouyang, Z.Y. Driving forces and their effects on water conservation services in forest ecosystems in China. Chin. Geogr. Sci. 2017, 27, 216–228. [Google Scholar] [CrossRef] [Green Version]
- FAO/IIASA/ISRIC/ISSCAS/JRC. Harmonized World Soil Database (Version 1.2); FAO: Rome, Italy, 2012. [Google Scholar]
- Xu, X.L. China GDP Spatial Distribution Kilometer Grid Data Set. Data Registration and Publication System of Resources and Environmental Sciences and Data Center, Cas. 2017. Available online: http://www.resdc.cn/DOI (accessed on 29 January 2022).
- Haghnegahdar, A.; Razavi, S. Insights into sensitivity analysis of Earth and environmental systems models: On the impact of parameter perturbation scale. Environ Model Softw. 2017, 95, 115–131. [Google Scholar] [CrossRef]
- Sanchez-Canales, M.; Benito, A.L.; Passuello, A.; Terrado, M.; Ziv, G.; Acuna, V.; Schuhmacher, M.; Elorza, F.J. Sensitivity analysis of ecosystem service valuation in a Mediterranean watershed. Sci. Total Environ. 2012, 440, 140–153. [Google Scholar] [CrossRef] [PubMed]
- Zhao, Y.; Zhang, J.F.; Li, T.; Xia, W. Parameter Sensitivity Analysis and Method Comparison of Rainfall Runoff Model. China Water Wastewater 2021, 37, 114–120. (In Chinese) [Google Scholar] [CrossRef]
- Fernandes, M.M.; Fernandes, M.R.D.M.; Garcia, J.R.; Matricardi, E.A.T.; Almeida, A.Q.D.; Pinto, A.S.; Menezes, R.S.C.; Silva, A.D.J.; Lima, A.H.D.S. Assessment of land use and land cover changes and valuation of carbon stocks in the Sergipe semiarid region, Brazil: 1992–2030. Land Use Policy 2020, 99, 104795. [Google Scholar] [CrossRef]
- He, C.Y.; Zhang, D.; Huang, Q.X.; Zhao, Y.Y. Assessing the potential impacts of urban expansion on regional carbon storage by linking the LUSD-urban and InVEST models. Environ. Model. Softw. 2016, 75, 44–58. [Google Scholar] [CrossRef]
- Jiang, J.H.; Qi, S.; Hu, J.; Lu, J.S.; Li, Y.; Jin, M.L. Assessment of Forest Ecosystem Carbon Storage in the Mountain Area of Beijing Based on the InVEST Model. Earth Environ. 2019, 47, 326–335. (In Chinese) [Google Scholar]
- Wang, C.; Zhan, J.Y.; Chu, X.; Liu, W.; Zhang, F. Variation in ecosystem services with rapid urbanization: A study of carbon sequestration in the Beijing–Tianjin–Hebei region, China. Phys. Chem. Earth. 2019, 110, 195–202. [Google Scholar] [CrossRef]
- Xu, Q.R.; Zheng, X.Q.; Zheng, M.R. Do urban planning policies meet sustainable urbanization goals? A scenario-based study in Beijing, China. Sci. Total Environ. 2019, 670, 498–507. [Google Scholar] [CrossRef] [PubMed]
- Belete, M.; Deng, J.S.; Wang, K.; Zhou, M.M.; Zhu, E.Y.; Shifaw, E.; Bayissa, Y. Evaluation of satellite rainfall products for modeling water yield over the source region of Blue Nile Basin. Sci. Total Environ. 2020, 708, 134834. [Google Scholar] [CrossRef]
- Sharp, R.; Chaplin-Kramer, R.; Wood, S.; Guerry, A.; Tallis, H.; Ricketts, T. VEST 3.3.2 User’s Guide; The Natural Capital Project; Stanford University: Stanford, CA, USA; University of Minnesota: Minneapolis, MN, USA; The Nature Conservancy: Arlington, VA, USA; World Wildlife Fund: Gland, Switzerland, 2016. [Google Scholar]
- Donohue, R.J.; Roderick, M.L.; McVicar, T.R. Roots, storms and soil pores: Incorporating key ecohydro-logical processes into Budyko‘s hydrological model. J. Hydrol. 2012, 436-437, 35–50. [Google Scholar] [CrossRef]
- Williams, J.R.; Renard, K.G.; Dyke, P.T. EPIC: A new method for assessing erosion’s effect on soil productivity. J. Soil Water Conserv. 1983, 38, 381–383. Available online: https://www.jswconline.org/content/38/5/381.short (accessed on 29 January 2022).
- Rao, E.M.; Ouyang, Z.Y.; Yu, X.X.; Xiao, Y. Spatial patterns and impacts of soil conservation service in China. Geomorphology 2014, 207, 64–70. [Google Scholar] [CrossRef]
- Hamel, P.; Chaplin-Kramer, R.; Sim, S.; Mueller, C. A new approach to modeling the sediment retention service (InVEST 3.0): Case study of the Cape Fear catchment, North Carolina, USA. Sci. Total Environ. 2015, 524-525, 166–177. [Google Scholar] [CrossRef]
- Pacheco, F.A.L.; Varandas, S.G.P.; Fernandes, L.F.S.; Junior, R.F.V. Soil losses in rural watersheds with environmental land use conflicts. Sci. Total Environ. 2014, 485-486, 110–120. [Google Scholar] [CrossRef]
- Feng, Q.; Zhao, W.W.; Wang, J.; Zhang, X.; Zhao, M.Y.; Zhong, L.N.; Liu, Y.X.; Fang, X.N. Effects of Different Land use Types on Soil Erosion under Natural Rainfall in the Loess Plateau, China. Pedosphere. 2016, 26, 243–256. [Google Scholar] [CrossRef]
- Song, Y.Z.; Wang, J.F.; Ge, Y.; Xu, C.D. An optimal parameters-based geographical detector model enhances geographic characteristics of explanatory variables for spatial heterogeneity analysis: Cases with different types of spatial data. GISci. Remote Sens. 2020, 57, 593–610. [Google Scholar] [CrossRef]
- Wang, J.F.; Zhang, T.L.; Fu, B.J. A measure of spatial stratified heterogeneity. Ecol. Indic. 2016, 67, 250–256. [Google Scholar] [CrossRef]
- Wang, J.F.; Li, X.H.; Christakos, G.; Liao, Y.L.; Zhang, T.; Gu, X.; Zheng, X.T. Geographical Detectors-Based Health Risk Assessment and its Application in the Neural Tube Defects Study of the Heshun Region, China. Int. J. Geogr Inf. Sci. 2020, 24, 107–127. [Google Scholar] [CrossRef]
- Hu, T.Y.; Li, X.C.; Gong, P.; Yu, W.C.; Huang, X.C. Evaluating the effect of plain afforestation project and future spatial suitability in Beijing. Sci. China Earth Sci. 2020, 63, 1587–1598. [Google Scholar] [CrossRef]
- Mashizi, A.K.; Sharafatmandrad, M. Investigating tradeoffs between supply, use and demand of ecosystem services and their effective drivers for sustainable environmental management. J. Environ. Manage. 2021, 289, 112534. [Google Scholar] [CrossRef] [PubMed]
- He, Y.Y.; Kuang, Y.Q.; Zhao, Y.L.; Ruan, Z. Spatial Correlation between Ecosystem Services and Human Disturbances: A Case Study of the Guangdong-Hong Kong-Macao Greater Bay Area, China. Remote Sens. 2021, 13, 1174. [Google Scholar] [CrossRef]
- Shen, J.S.; Li, S.C.; Liang, Z.; Liu, L.B.; Li, D.L.; Wu, S.Y. Exploring the heterogeneity and nonlinearity of trade-offs and synergies among ecosystem services bundles in the Beijing-Tianjin-Hebei urban agglomeration. Ecosyst. Serv. 2020, 43, 101103. [Google Scholar] [CrossRef]
- Jiang, C.; Wang, F.; Zhang, H.Y.; Dong, X.L. Quantifying changes in multiple ecosystem services during 2000–2012 on the Loess Plateau, China, as a result of climate variability and ecological restoration. Ecol. Eng. 2016, 97, 258–271. [Google Scholar] [CrossRef]
- Livesley, S.J.; McPherson, E.G.; Calfapietra, C. The Urban Forest and Ecosystem Services: Impacts on Urban Water, Heat, and Pollution Cycles at the Tree, Street, and City Scale. J. Environ. Qual. 2016, 45, 119–124. [Google Scholar] [CrossRef]
- Xu, X.B.; Yang, G.S.; Tan, Y. Identifying ecological red lines in China’s Yangtze River Economic Belt: A regional approach. Ecol. Indic. 2019, 96, 635–646. [Google Scholar] [CrossRef]
- Li, X.; Sun, W.; Zhang, D.; Huang, J.L.; Li, D.H.; Ding, N.; Zhu, J.F.; Xie, Y.J.; Wang, X.R. Evaluating water provision service at the sub-watershed scale by combining supply, demand, and spatial flow. Ecol. Indic. 2021, 127, 107745. [Google Scholar] [CrossRef]


| Pattern | Parameter | Unit | Value Range |
|---|---|---|---|
| Carbon storage | Carbon Densities | t/ha | Unlimited |
| Precipitation | mm | Unlimited | |
| Reference Evapotranspiration | mm | Unlimited | |
| Soil Depth | mm | Unlimited | |
| Water yield | Plant Available Water Content | 0–1 | |
| Evapotranspiration Coefficient of Vegetation | 0–1.5 | ||
| Maximum Root Depth for Plants | mm | 0–10,000 | |
| Z Parameter | Unlimited | ||
| Soil conservation | Rainfall Erodibility Factor | MJ·mm/(t/ha/yr) | Unlimited |
| Soil Erodibility Factor | t·h/(MJ·mm) | 0–1 | |
| Slope Length Factor | Unlimited | ||
| Slope Steepness Factor | Unlimited | ||
| Crop/Vegetation and Management Factor | 0–1 | ||
| Support Practice Factor | 0–1 |
| Pattern | Variable | Definition | Unit |
|---|---|---|---|
| Ecological | DEM | Elevation | m |
| Slope | Slope | ° | |
| Meteorological | Precipitation | 40-year average precipitation | mm |
| Temperature | 40-year average temperature | °C | |
| Socio-economic | GDP | Gross national product | yuan/km2 |
| Population | Population of cell | Person/km2 | |
| NDVIm | 40-year average NDVI | % | |
| LULC | 35-year land use change | - |
| Year | Construction Land | Water | Cropland | Woodland | Grassland | Bare Land |
|---|---|---|---|---|---|---|
| 1985 | 960.13 | 108.19 | 4944.52 | 8751.76 | 1630.23 | 15.17 |
| 1990 | 1754.16 | 196.93 | 4379.36 | 9030.97 | 1031.09 | 17.49 |
| 1995 | 2223.47 | 265.08 | 3233.82 | 9607.60 | 1061.19 | 18.84 |
| 2000 | 2337.99 | 156.67 | 3595.84 | 9244.94 | 1059.11 | 15.45 |
| 2005 | 2565.07 | 121.49 | 3668.81 | 9006.78 | 1033.04 | 14.81 |
| 2010 | 2607.82 | 139.47 | 3547.70 | 9335.20 | 768.33 | 11.48 |
| 2015 | 2631.09 | 163.82 | 3469.63 | 9463.53 | 669.48 | 12.45 |
| 2020 | 2685.91 | 158.56 | 3385.23 | 9575.12 | 594.23 | 10.95 |
| Pattern | Parameter | Sensitivity Rank |
|---|---|---|
| Carbon storage | Carbon Densities | Highly sensitive |
| Precipitation | Highly sensitive | |
| Reference Evapotranspiration | Highly sensitive | |
| Soil Depth | Insensitive | |
| Water yield | Plant Available Water Content | Insensitive |
| Evapotranspiration Coefficient of Vegetation | Insensitive | |
| Maximum Root Depth for Plants | Insensitive | |
| Z Parameter | Insensitive | |
| Soil conservation | Rainfall Erodibility Factor | Highly sensitive |
| Soil Erodibility Factor | Sensitive | |
| Slope Length Factor | Medium sensitive | |
| Slope Steepness Factor | Medium sensitive | |
| Crop/Vegetation and Management Factor | Insensitive | |
| Support Practice Factor | Insensitive |
| Year | Carbon Storage (108 tons/yr) | Water Yield (109 m3/yr) | Soil Conservation (108 tons/yr) |
|---|---|---|---|
| 1985 | 2.38 | 1.62 | 1.76 |
| 1990 | 2.41 | 2.01 | 1.89 |
| 1995 | 2.45 | 1.77 | 2.26 |
| 2000 | 2.39 | 1.25 | 1.61 |
| 2005 | 2.35 | 0.68 | 1.41 |
| 2010 | 2.33 | 0.97 | 1.12 |
| 2015 | 2.37 | 1.82 | 0.91 |
| 2020 | 2.45 | 1.72 | 1.96 |
Publisher’s Note: MDPI stays neutral with regard to jurisdictional claims in published maps and institutional affiliations. |
© 2022 by the authors. Licensee MDPI, Basel, Switzerland. This article is an open access article distributed under the terms and conditions of the Creative Commons Attribution (CC BY) license (https://creativecommons.org/licenses/by/4.0/).
Share and Cite
Liu, H.; Xiao, W.; Li, Q.; Tian, Y.; Zhu, J. Spatio-Temporal Change of Multiple Ecosystem Services and Their Driving Factors: A Case Study in Beijing, China. Forests 2022, 13, 260. https://doi.org/10.3390/f13020260
Liu H, Xiao W, Li Q, Tian Y, Zhu J. Spatio-Temporal Change of Multiple Ecosystem Services and Their Driving Factors: A Case Study in Beijing, China. Forests. 2022; 13(2):260. https://doi.org/10.3390/f13020260
Chicago/Turabian StyleLiu, Huayan, Wenfa Xiao, Qi Li, Yu Tian, and Jianhua Zhu. 2022. "Spatio-Temporal Change of Multiple Ecosystem Services and Their Driving Factors: A Case Study in Beijing, China" Forests 13, no. 2: 260. https://doi.org/10.3390/f13020260