1. Introduction
Biodiversity loss has been a major and challenging problem globally, and is a potential risk factor for pandemics [
1]. The ongoing global COVID-19 pandemic has confirmed this concern. The loss of biodiversity has generated conditions that not only favored the appearance of the virus but also enabled the COVID-19 pandemic to surface [
2,
3]. Biodiversity conservation is, therefore, an urgent global task.
Aiming to produce high-quality habitats and improve regional biodiversity [
4], in 2012, Beijing launched its largest decade-long afforestation campaign, the Plain Afforestation Project (PAP), which required building hundreds of gardens and parks in urban areas. To assess the success of PAP, the rapid and effective monitoring of urban biodiversity is key [
5], which has led to a need for innovative investigation approaches. However, the need for expert knowledge and the substantial costs in terms of both money and time are major obstacles for any multi-taxa approach based on large-scale fieldwork [
6]. Thus, the development of cost-effective and robust tools for monitoring urban forest biodiversity is a pressing need [
1].
Operating within the conceptual and methodological framework of ecoacoustics [
7], passive acoustic monitoring (PAM) is a promising approach with many advantages, including its availability in remote and difficult-to-reach locations, noninvasiveness, non-observer bias, permanent record of surveys, and low cost [
8,
9,
10,
11]. In addition, PAM allows for standardized surveys that can provide new insights into sound-producing organisms over enhanced spatiotemporal scales [
12]. For example, the global acoustic database Ocean Biodiversity Information System–Spatial Ecological Analysis of Megavertebrate Population (OBIS-SEAMAP) was developed to enable research data commons, and contains more than one million observation recordings from 163 datasets spanning 71 years (1935 to 2005), provided by a growing international network of data users [
13].
In terrestrial soundscapes, bird vocalizations are one of the most prominent elements [
14] and have been widely used to detect species and monitor and quantify ecosystems [
15]. More specifically, acoustic traits have been proved to respond to environmental changes, such as climate change [
16], habitat fragmentation [
17], vegetation structure, and microclimate [
18]. With the emergence of PAM, massive acoustic data have accumulated globally, offering unprecedented opportunities, as well as challenges, for innovative biodiversity monitoring.
A critical challenge in PAM studies is the analysis and handling of very large amounts of acoustic data, especially for programs spanning wide temporal or spatial extents [
19]. However, manual analysis is still the primary method for extracting biological information from PAM recordings [
20], which typically combines aural and visual inspection of spectrograms [
21,
22] to achieve graphical representations of acoustic events connected to biophony, geophony, and anthrophony, as well as a general overview of the daily acoustic pattern [
21]. When experienced observers are involved, manual analysis is always considered to be the most accurate, but it is time-consuming, costly, frequently subjective, and ultimately fails to be applied across broad spatiotemporal scales [
22].
To address the challenges posed by massive data and manual analysis, increasing numbers of studies have been conducted on individual species, and there seems to be a rising interest in the ecological processes of biomes [
23,
24]. It has been well established that monitoring community acoustic dynamics is key to understanding the changes and drivers of ecosystem biodiversity within the framework of soundscape ecology [
25,
26,
27,
28]. The burgeoning development of this framework has stimulated research interest in ecological applications of acoustic indices, which have been intensively proposed and tested [
29,
30,
31,
32,
33,
34].
Unfortunately, automated acoustic analysis remains a difficult subject to study because of the wide variety of information available in each acoustic environment, making it difficult to quickly identify and extract critical ecological information for interpreting recordings [
29]. Most existing acoustic indices use simple algorithms to collapse the signal into one domain and quantify the soundscape by summing or contrasting acoustic energy variations [
12,
24,
34], which are intrinsically an extension of the traditional sound pressure and spectral density indices [
29,
35,
36,
37,
38]. Although cheap and fast, this type of analysis leads to massive loss of information, so its eco-efficiency remains controversial. In addition, the difficulty in excluding the interference of noise in order to quantify biophony alone remains a major limitation of the existing indices, which leads to huge bias in the application of these indices in urban areas [
33], raising concerns over their applicability [
34,
37].
Although automated analysis techniques are rapidly improving, software tools still lag far behind actual applications [
22,
39,
40,
41,
42]. We therefore suggest that advancing the theory and practice of soundscape ecology research requires going beyond the limits of the temporal/frequency structure of sound and developing more tools to retain as much ecologically relevant information as possible from recordings, testing our methods in complex urban environments to clarify their robustness.
Remote sensing technology has been broadly used in many applications, such as extracting land cover/usage information. Object-based image analysis (OBIA) has emerged as an effective tool to overcome the problems of traditional pixel-based techniques of image data [
43,
44]. It defines segments rather than pixels to classify areas, and it incorporates meaningful spectral and non-spectral features for class separation, thereby providing a clear illustration of landscape patterns [
43,
44,
45,
46]. Owing to its superiority and efficiency [
47], OBIA has been utilized in many different areas, such as computer vision [
48,
49], biomedical imaging [
50,
51], and environmental scanning electron microscopy (SEM) analysis [
52,
53,
54]. Just as remote sensing images are numeric representations of the earth surface landscape consisting of water area, forest land, wetlands, etc. [
55], spectrograms are visual expressions of collections of various sound components (biophony, geophony and anthrophony). As such, could OBIA provide a novel perspective for extracting bird vocalizations when introducing advanced remote sensing tools in the soundscape field? Could we further digitally summarize vocalization patches and use them as ecologically relevant indicators of acoustic community patterns?
Based on the above hypotheses, an automated bird vocalization extraction method based on OBIA is presented here. We hypothesize that OBIA may allow for the extracting of bird vocalizations from recordings with complex background noise and the representation of long-term acoustic data as numbers describing biophony. From the perspective of community-level soundscape ecology, we are not necessarily concerned with species identification, but with achieving a numerical description of the qualitative patterns of species vocalizations [
24]. OBIA enables rapid identification of the number of bird vocalizations while providing multidimensional spectral, morphological, and acoustic traits, unlike other existing methods (whether manual or automatic). Examples of spectral variables include the mean value and standard deviation of a specific spectral band; morphological traits include size, perimeter, and compactness; acoustic traits include song length and frequency information.
In the present paper, we take a first look at how OBIA might provide a new perspective on the current automated acoustic analysis methods and provide a complement to existing acoustic indices that can be used for urban forest biodiversity assessments.
4. Discussion
When analyzing biophony in urban environments, anthrophony could lead to potential false positives [
95]. Low recognition accuracy is often attributed to noise [
96], which affects the whole process unless removed initially. Hence, at present, most methods for analyzing biophony in urban environments are trained and tested on relatively low numbers of high-quality recordings that have been carefully selected [
22]. This may lead to better results but will limit the generalization of their approach to real field recordings, especially in urban areas with complex acoustic environments. Therefore, in our study, we used only noise reduction, which meant that batch and fast processing could be performed.
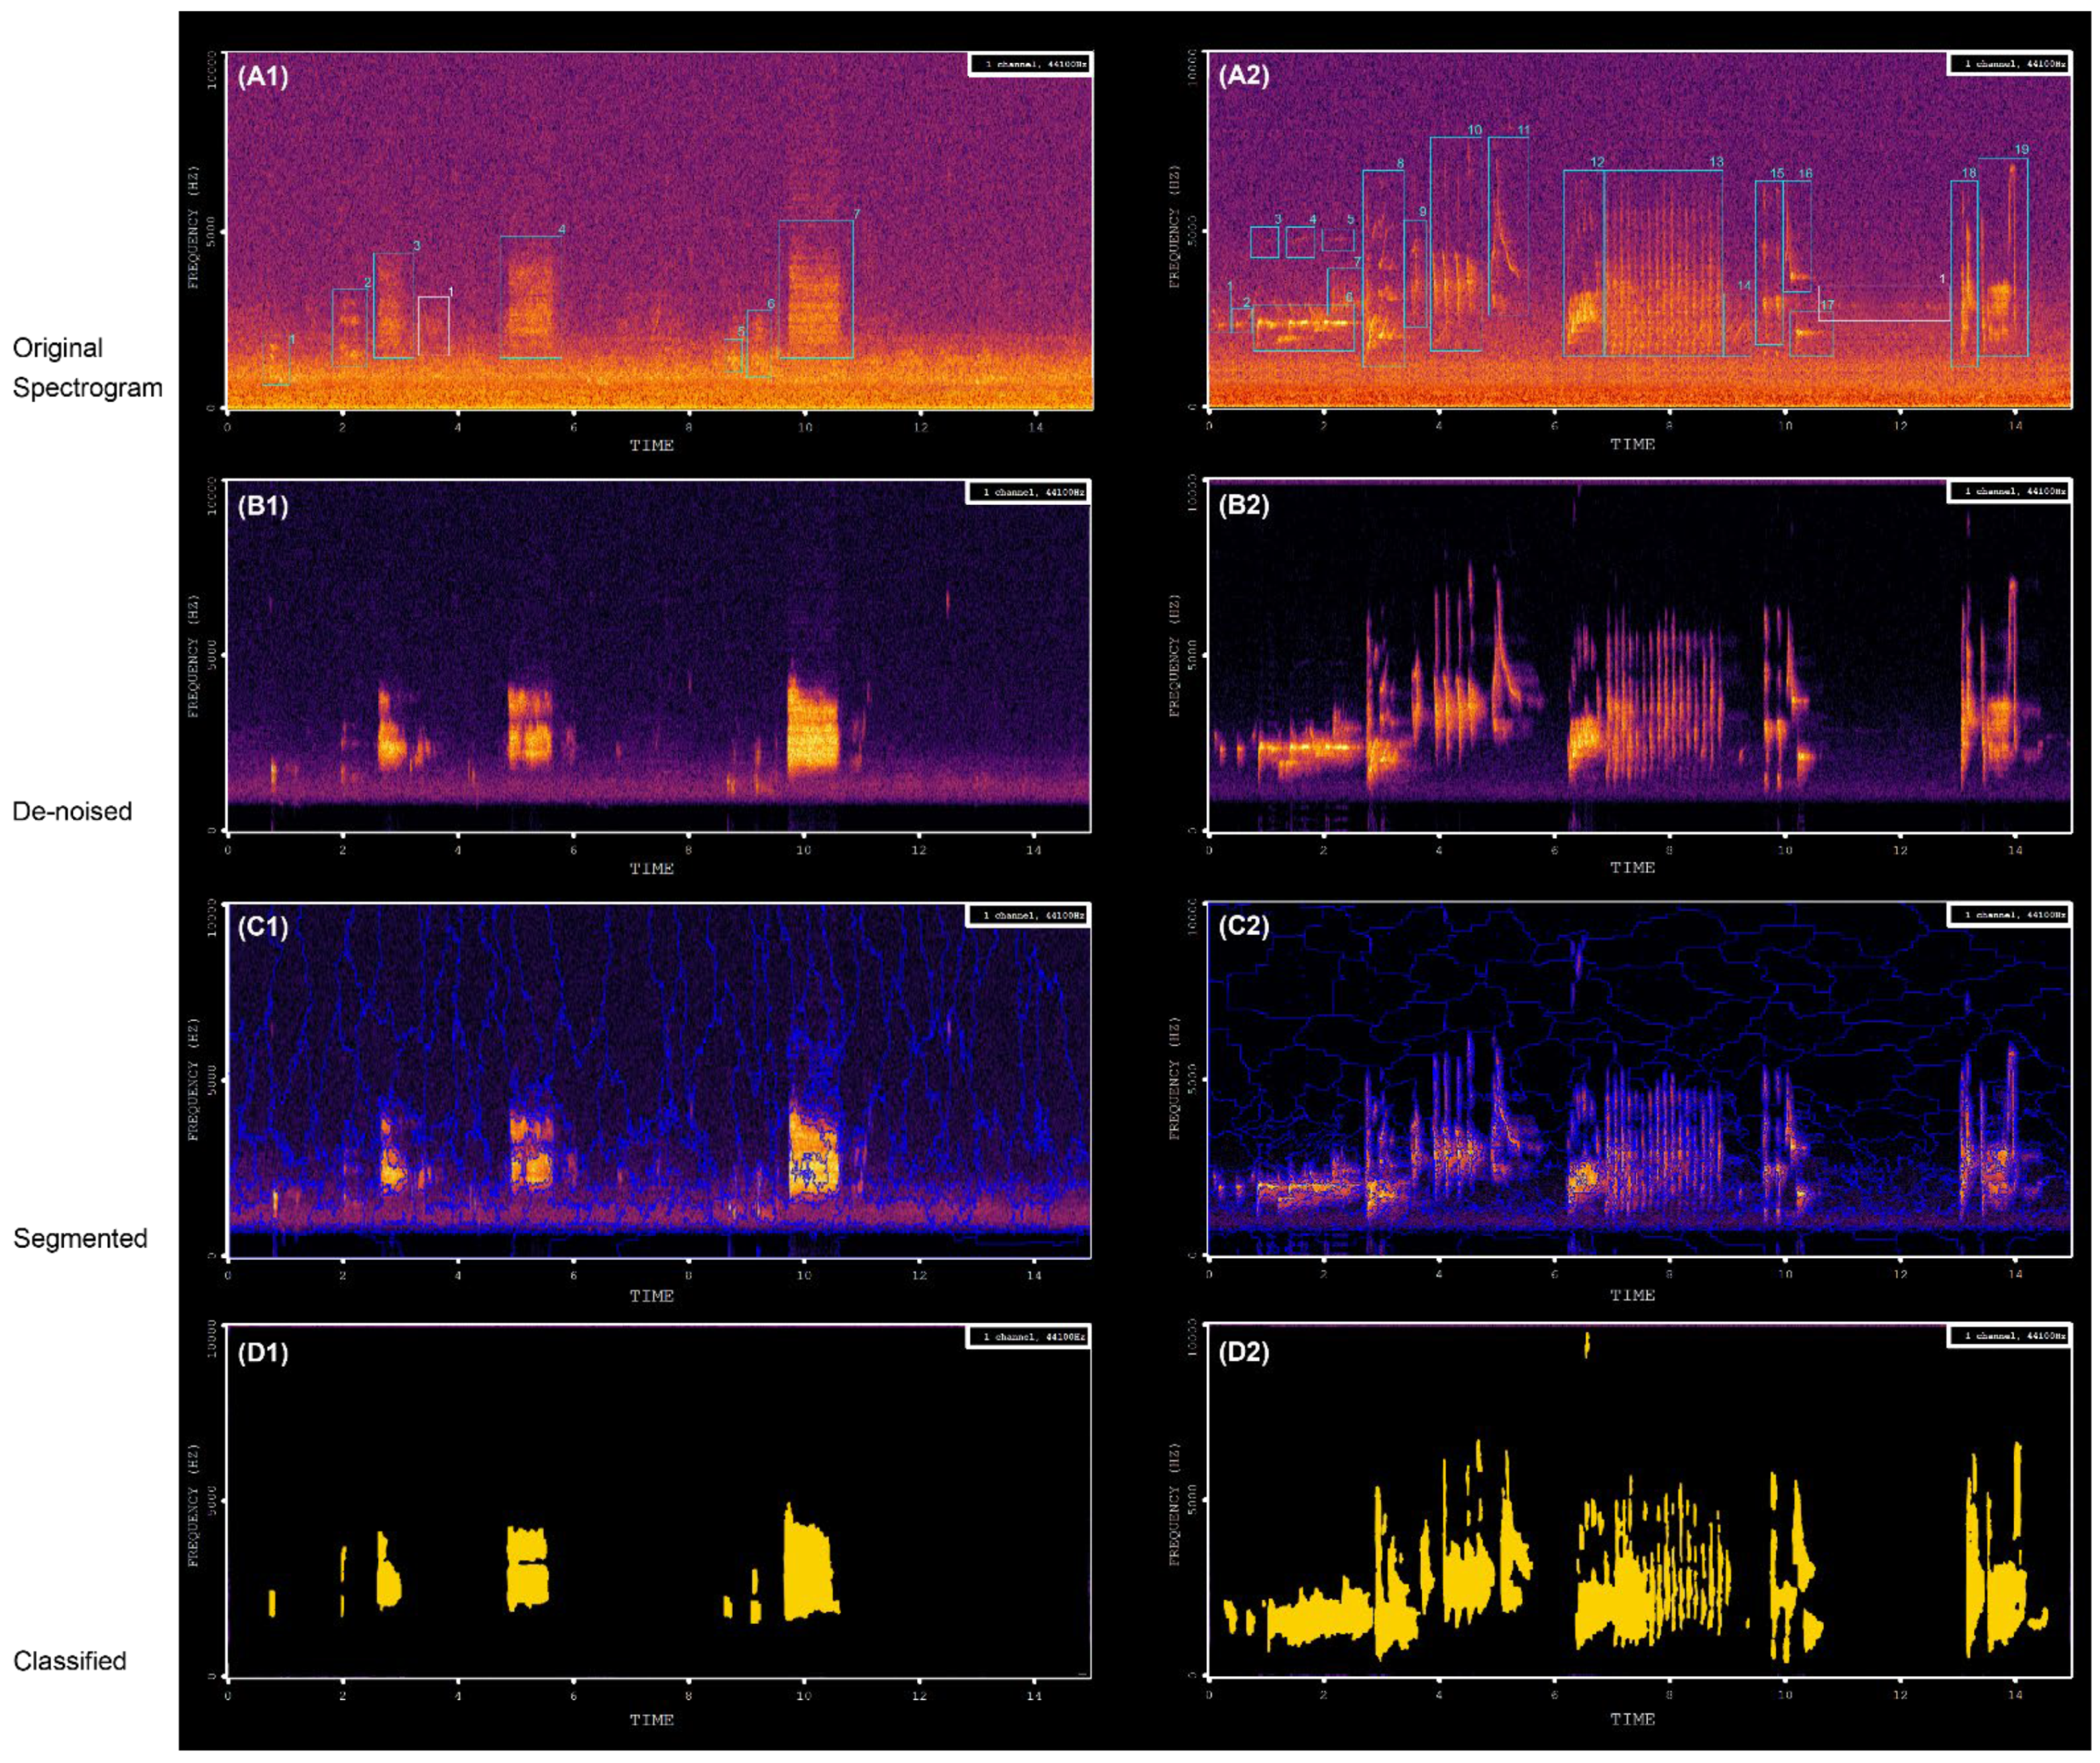
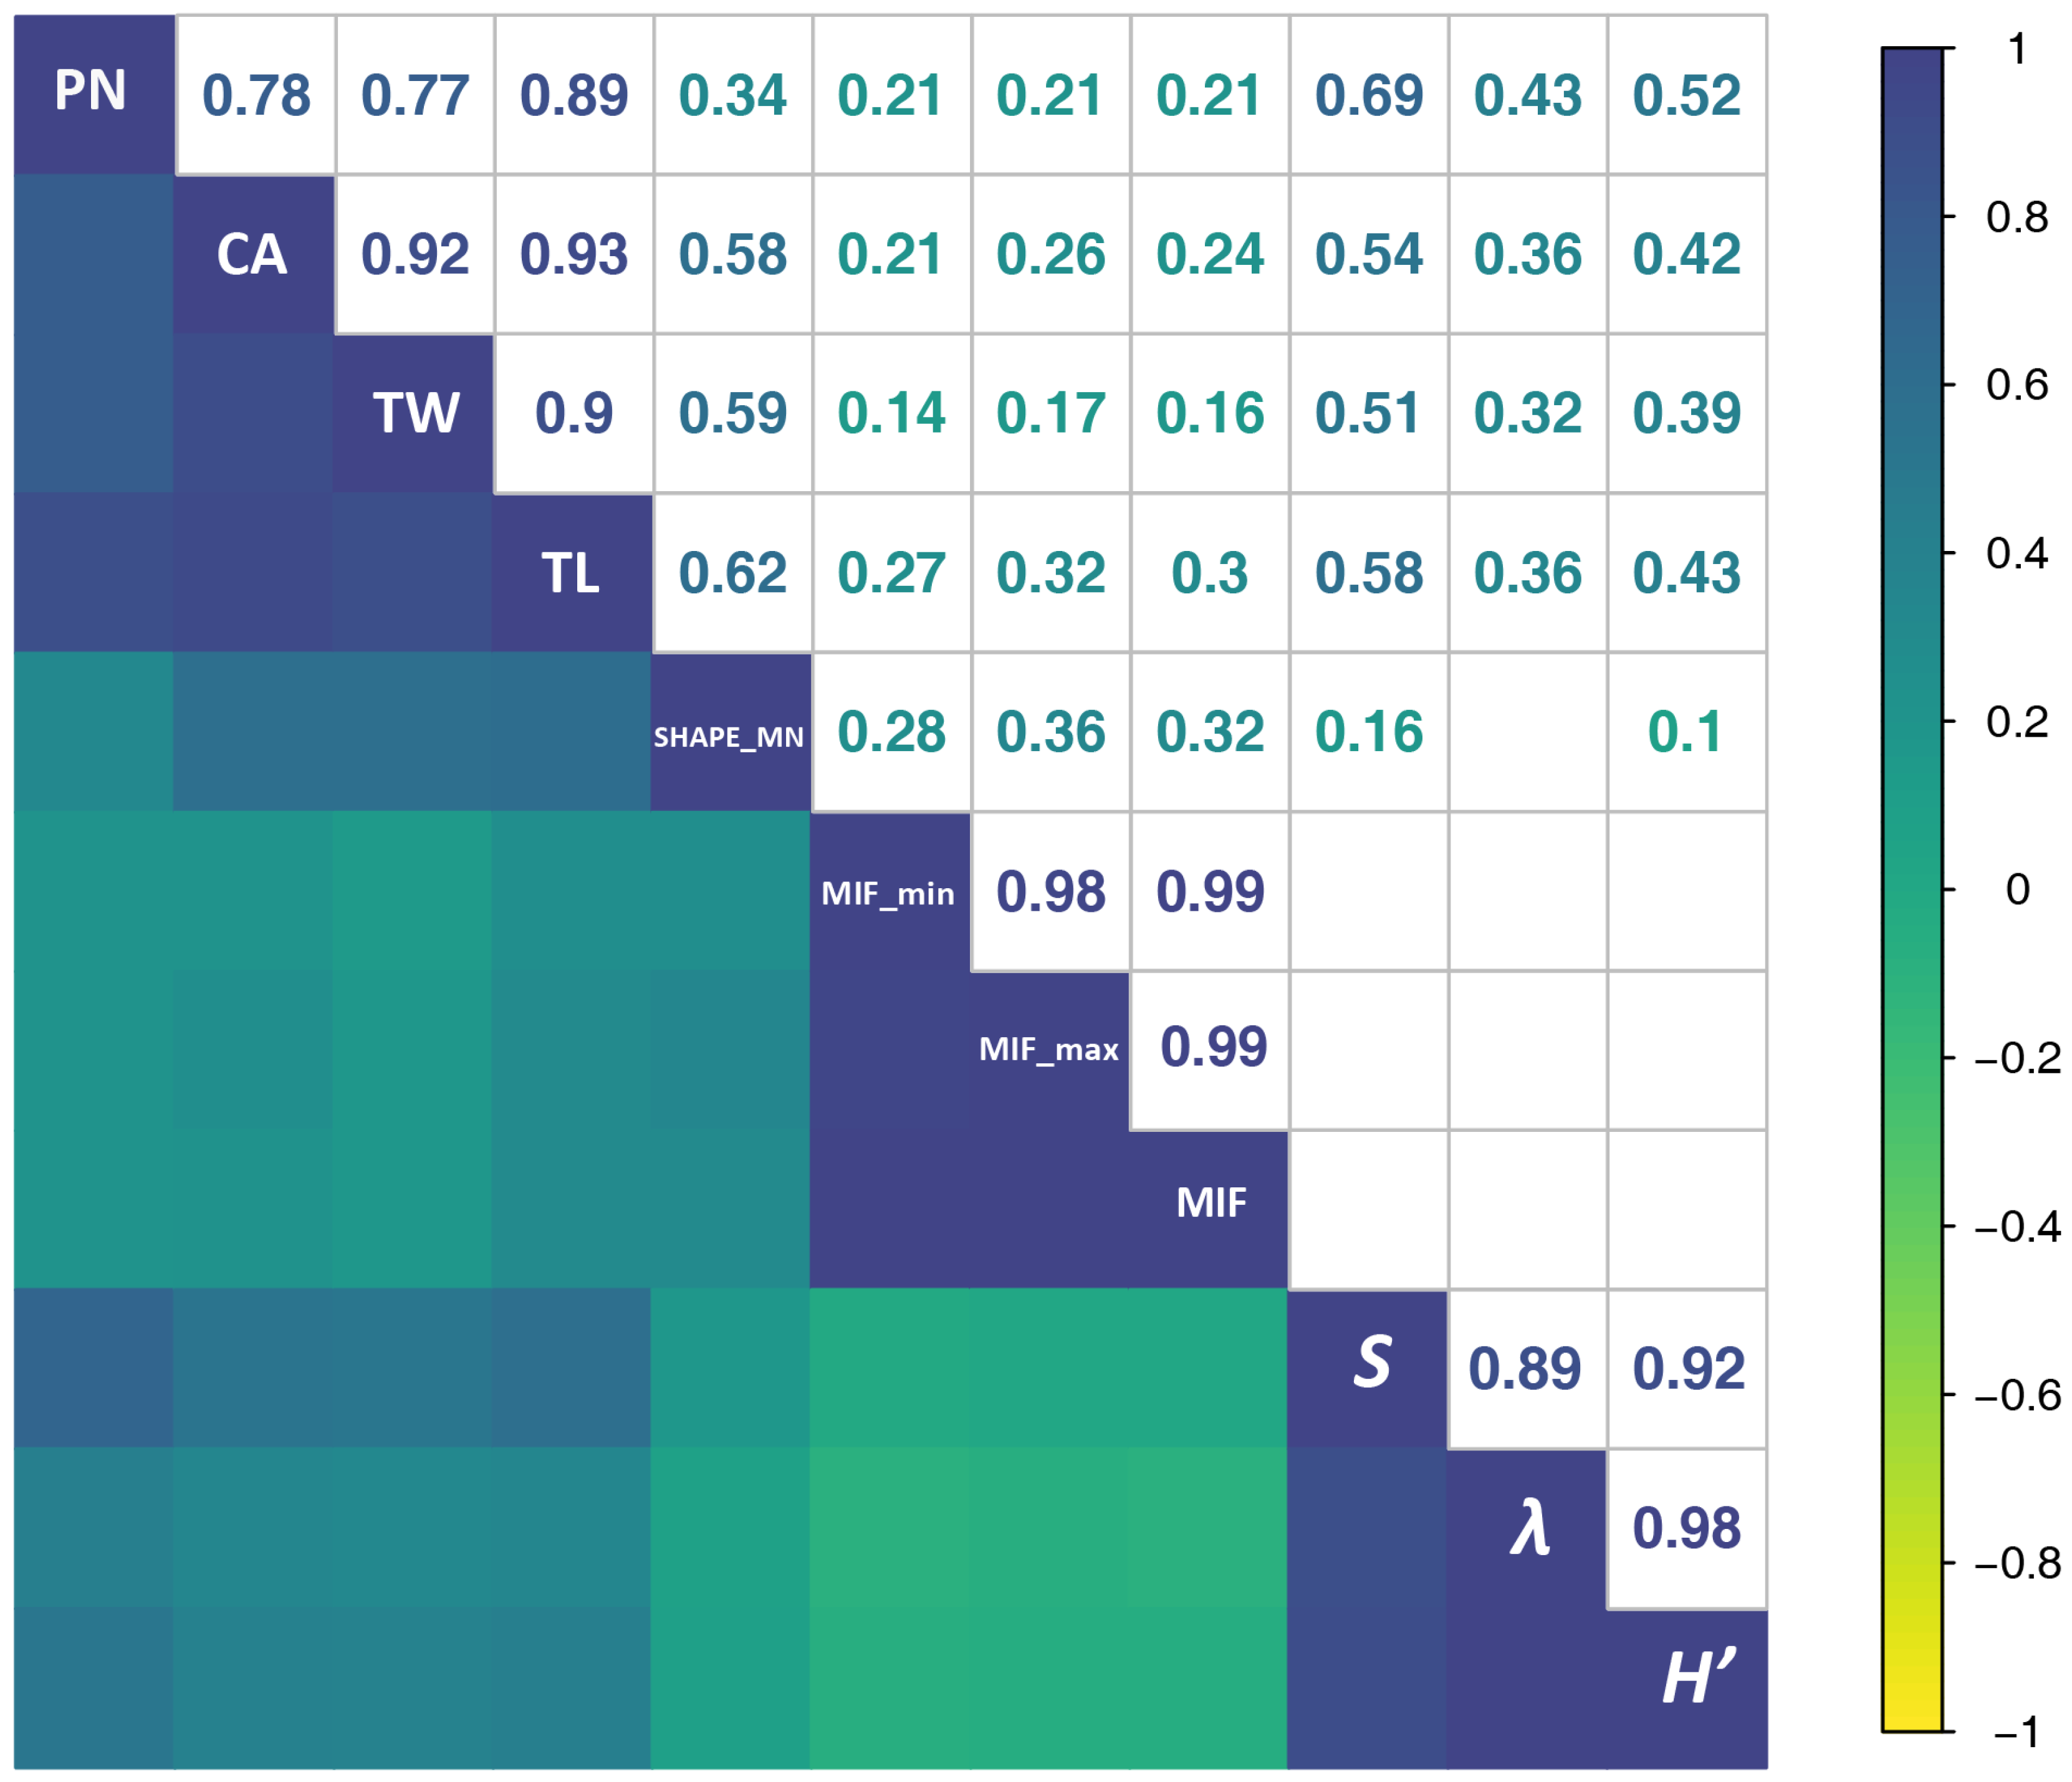
According to Spearman’s rho correlations, NP was always more strongly correlated with AEs than with BEs, suggesting that SFMs were still somewhat influenced by human-generated noise, even after the denoising process. SFMs were hardly affected by constant-intensity noise (e.g., noise from aircraft or automobile traffic; for an example see
Figure 5D: persistent noise was not extracted by the algorithm) [
29,
33]. In addition to pre-processing filtering, which eliminated most of the noise, CART models minimized the confounding effects of noise and syllables through training samples. The inherent properties of constant-intensity noise are different from those of bird vocalizations and are easily recognized by the model. For example, the brightness (
Figure 4) of bird vocalizations was generally greater than 80, while the values for noise were 30–60. Nevertheless, some intermittent human noises, such as car horns and ringtones, might be extracted together with bird vocalizations using our approach. However, we believe that testing the approach in other habitats such as natural forests or biodiversity conservation areas will yield more encouraging results.
By treating spectrograms as images, previous studies have applied image processing techniques to extract bird vocalizations [
10,
59,
60,
83,
96,
97,
98], such as widely used median clipping [
41,
99,
100] and frame- or acoustic event-based morphological filtering [
66]. There are plenty of toolboxes available to extract acoustic traits [
22], such as central frequency, highest frequency, lowest frequency, initial frequency, and loudest frequency and so on [
10,
59], which are basically time–frequency characteristics only. To the best knowledge, all these studies aimed to identify or classify one or several bird species specifically. However, when focusing on the entire ecosystem, the species-level approach misses the forest for the trees [
101]. Unlike the studies aiming at recognition of one or more species, ours attempted to take a global estimate of the acoustic output of the community. Our results indicated that SFMs are a promising complement to the existing indices working as biodiversity proxies when rapid assessments are required because SFMs were significantly correlated with diversity indices. SFMs allow for the effective interpretation of different pieces of bio-information in recordings, probably because their unique mathematical properties reflect different components of the soundscape, preserving more of the potentially eco-relevant information.
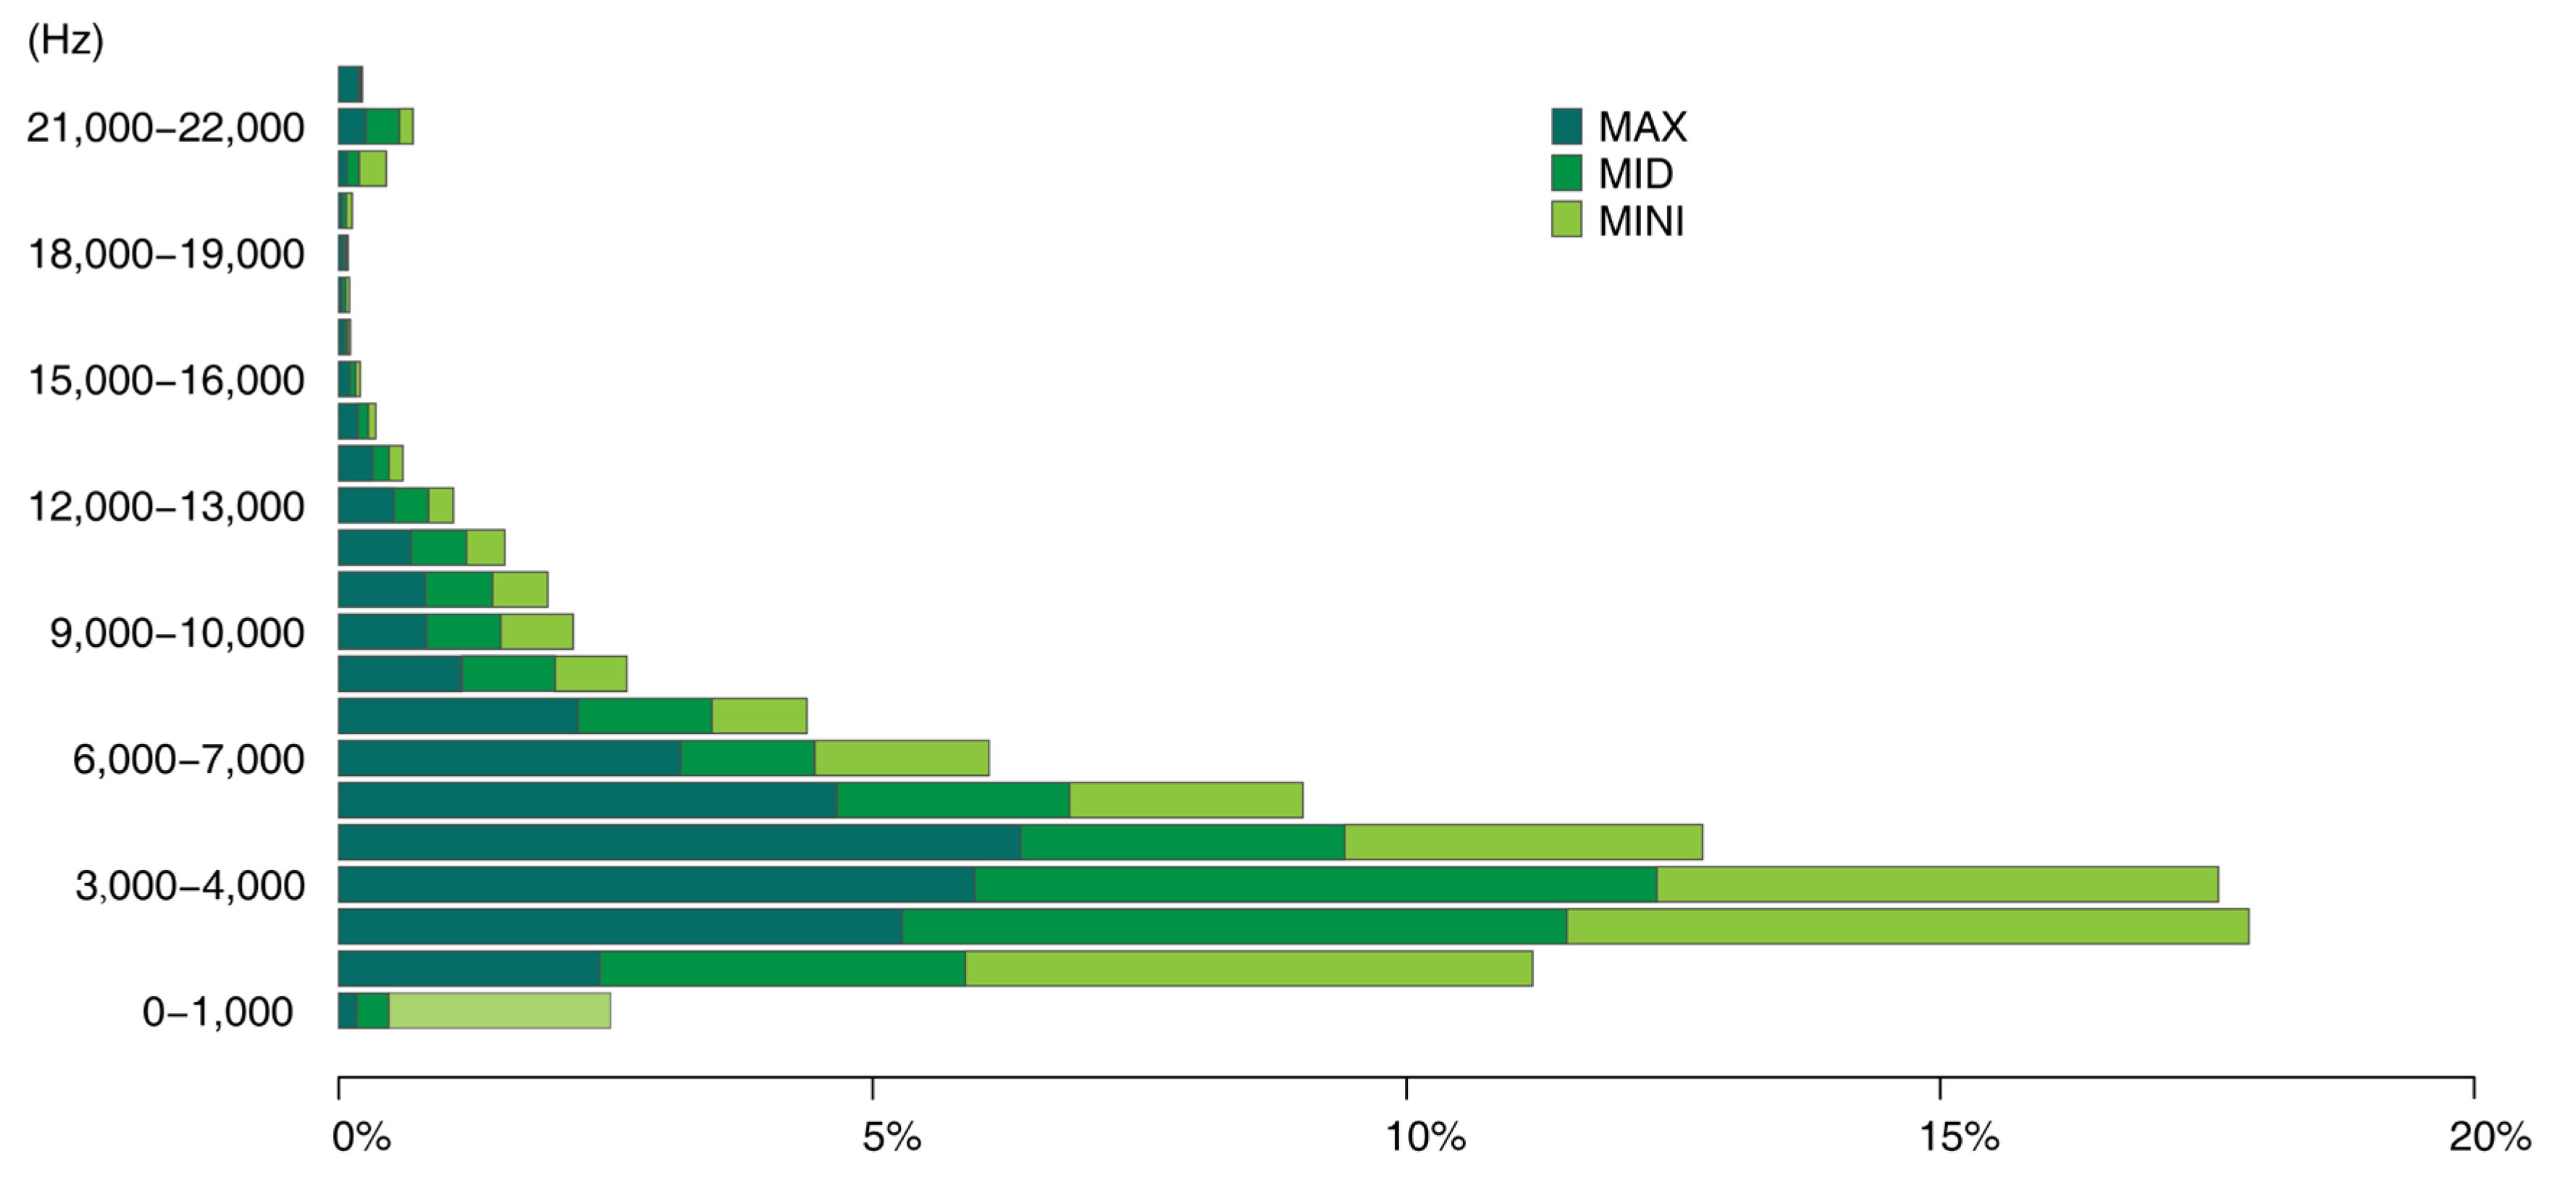
Using the proposed approach, we could collect a series of data including acoustic traits on the time–frequency scale (
Figure 8), such as duration and mean, maximum, and minimum frequency of acoustic events, and morphological characteristics of acoustic events (
Figure 9), such as the size and shape characteristics for each syllable patch. Such features (i.e., SFMs) may contribute to a more nuanced understanding of the acoustic environment of the study area from multiple perspectives. In
Figure 8, the frequency patterns of syllable patches are shown across frequency intervals. The soundscape was dominated by mid-frequency sounds (3–5 kHz); syllable patches were over 50%. Mid-frequency sounds are generally attributed to biophony, especially bird species ranging from larger birds such as the Eurasian magpie (
Pica pica) to smaller species such as the Oriental reed warbler (
Acrocephalus orientalis). At the other end of the frequency spectrum, the number of patches within individual high-frequency intervals was quite low (biophony patches in the highest four frequency intervals accounted for 1.5%) and were mainly within 20–22 kHz, which may be attributed to some night-flying moths of the family Noctuidae or to mating calls from grasshoppers. In
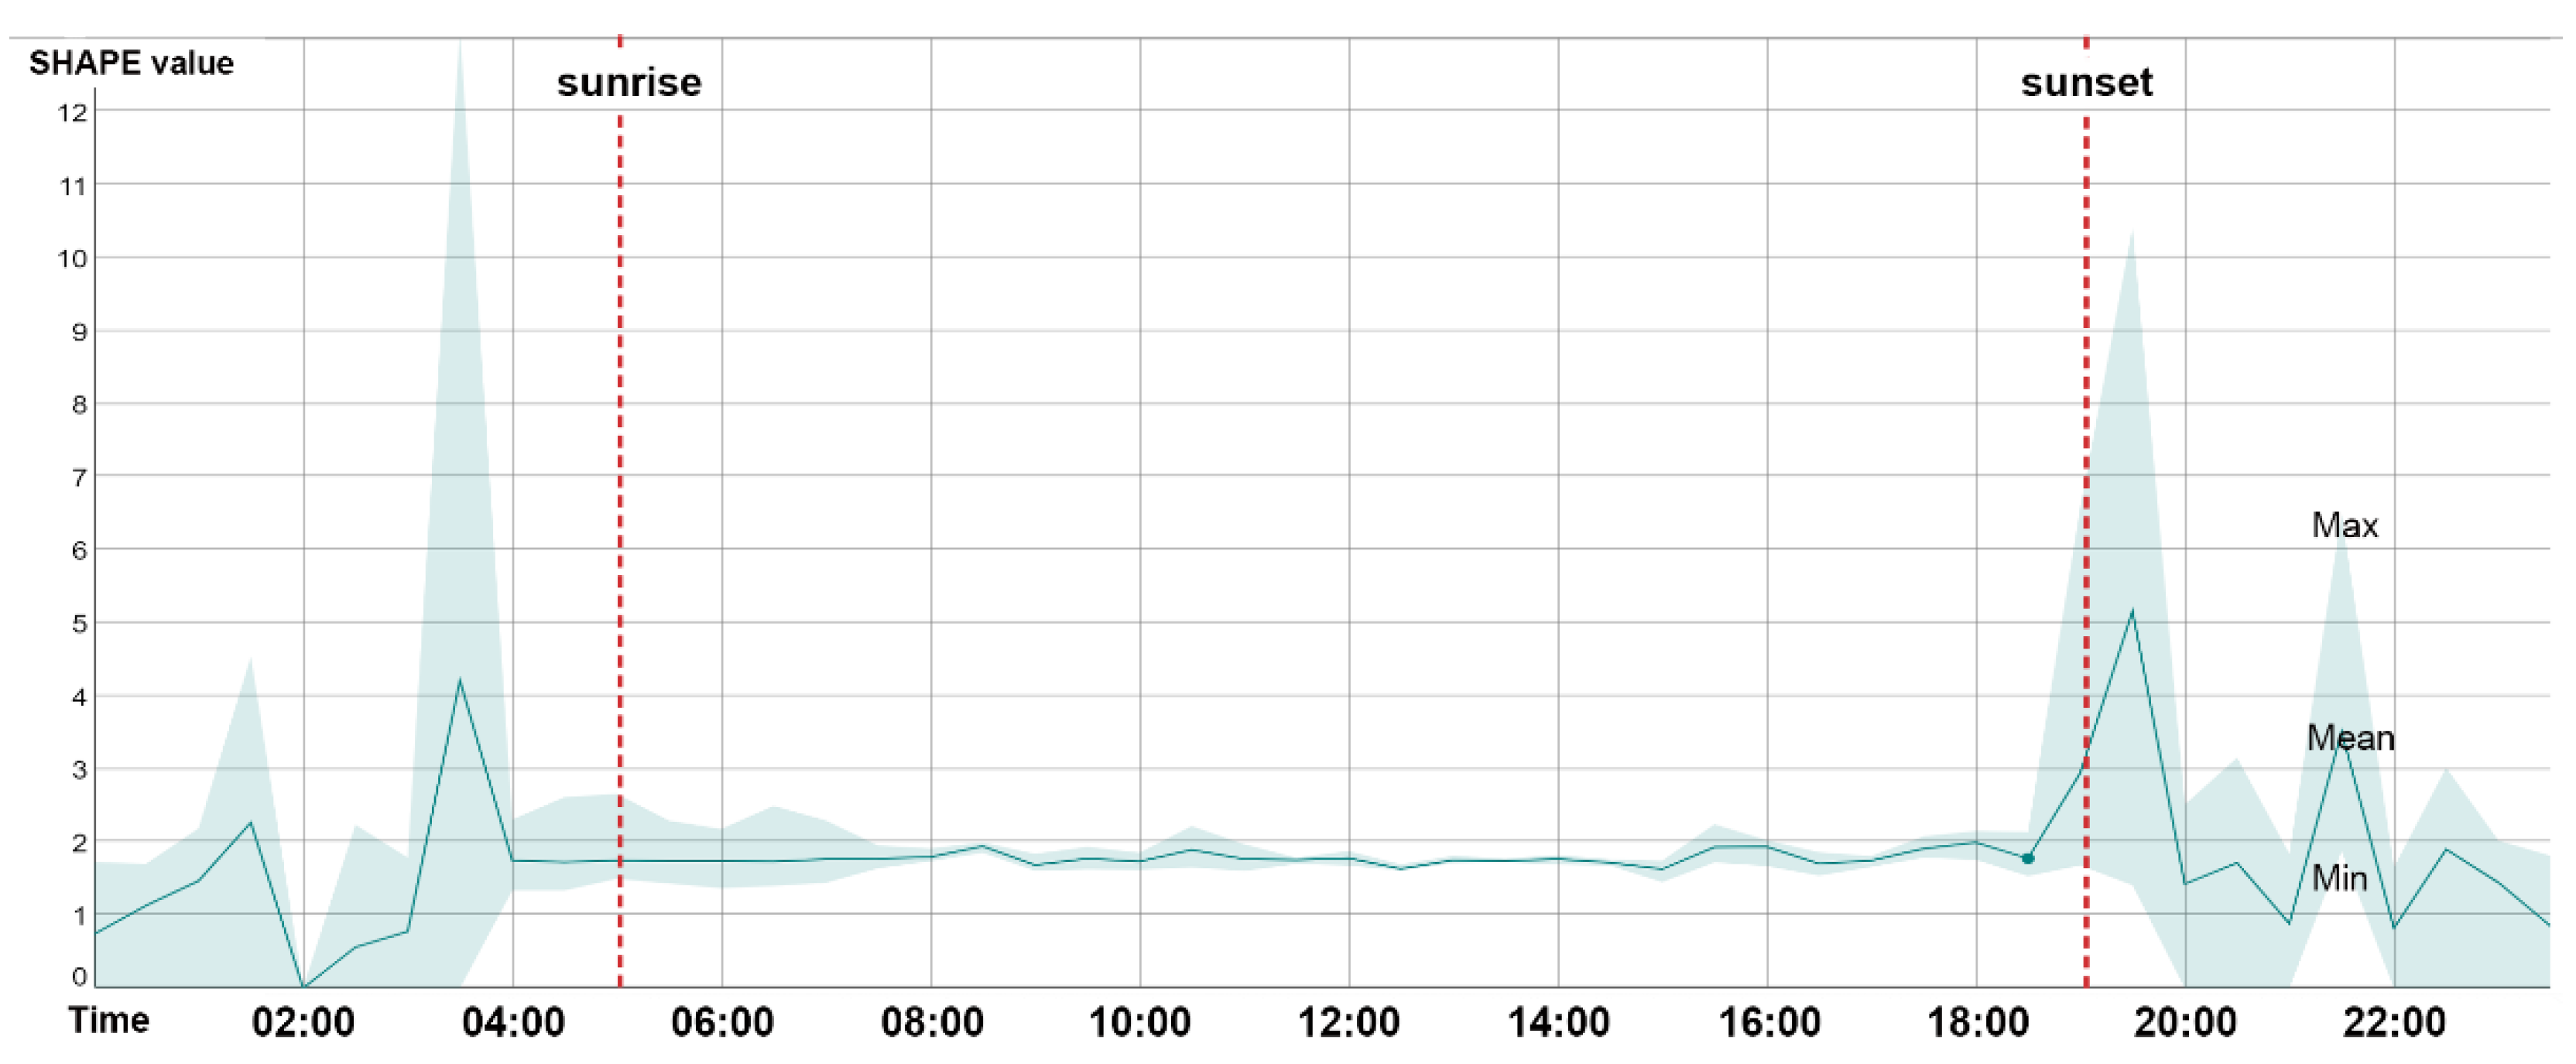
Figure 9, the average shape index (SHAPE) over 24 h was shown to rise rapidly at dawn chorus to reach the peak of the day, falling rapidly and remaining steady until dusk, when the chorus rose rapidly again, and then fluctuated and fell until the morning. The daily pattern of SHAPE is consistent with previous studies of other acoustic indices [
27,
31,
102,
103], thus reflecting a daily activity pattern and highlighting distinct dawn and dusk bird choruses. However, compared to other indices that only focus on sound intensity, SHAPE provides a new perspective on patterns of complexity of bird songs: songs of the dawn and dusk choruses tended to be more complex and elaborate than daytime songs. This is mainly related to defending territory and/or attracting a mate [
104].
Borrowing a framework from landscape ecology, many types SFMs can effectively be used to interpret different aspects of acoustic information and different components of the soundscape, which is presumably attributed to the mathematical properties of SFMs and to the introduction of a spatial concept. SFMs calculated in this study, such as area, compactness, roundness, and shape index of the patches, could be easily generated in eCognition developer. In addition, many existing open-source platforms (e.g., package landscapemetrics in R) or software have integrated huge workflows, which can provide similar functions (e.g., QGIS). Measurement of biophony from multiple dimensions has been considered useful for detecting variations in the behavior and composition of acoustic communities and, as a result, to better monitor their dynamics and interactions with habitats [
29]. These results support the possibility that PAM could potentially offer a more comprehensive picture of biodiversity than traditional inspection [
63].
Under the high pressure of a surplus of data, and facing the lack of technology, funding and standardized protocols [
11], most passive monitoring now lasts one to three years at most [
105], while ecosystem conservation and ecological change detection usually require at least ten years. In particular, there is usually a lag period when measuring the benefits of planted forests, as individual trees need to grow and stands need to mature to form a stable structure [
4]. Short-term monitoring may lead to a reduction in the quality and reliability of data [
106]. This emphasizes the significance of utilizing and applying PAM within the framework of a monitoring strategy, with defined objectives, effective indicators, and standardized protocols [
20].
There is developing acknowledgment from governments and related sectors that urban greenery is not monitored adequately to satisfy its crucial roles in biodiversity provisioning and ecosystem support [
33,
107]. A rich and diverse biophony usually indicates a stable and healthy ecosystem [
26]. With its government-led design, planning, and implementation, the in-depth greening project in Beijing has indeed enhanced green space in the plain area, if only considering the total increased amounts of trees and connected urban forest and park patches [
108]. However, the large-scale transition between cropland and forest generated by the afforestation process has the potential to lead to original wildlife habitat loss. By long-term monitoring of biodiversity patterns and processes, we can better assess the positive and negative impacts of afforestation projects.
According to our preliminary results, the proposed approach (with high computational efficiency and accuracy) may benefit further research on the rapid assessment and prediction of biodiversity in urban forests, providing an indirect but immediate measurement of bird activity dynamics across enhanced spatio-temporal scales. This would facilitate the application of PAM and the formulation of a standardized sampling protocol. Furthermore, a robust automated approach could support PAM as part of citizen science research. This would benefit developing countries that lack financial budgets, experts, and capacity for massive data processing. Globally, only 5% of PAM studies are conducted in regions of Asia, western Oceania, northern Africa, and southern South America, where some countries still have no record of using PAM [
20]. As our approach does not require a priori data, it facilitates the implementation of long-term ecosystem monitoring in developing countries where baseline data are not available.


