Abstract
Open-cast coal mining in China has developed rapidly due to its obvious advantages over underground mining. However, it may have negative ecological effects, such as biodiversity loss, water shortage, and soil erosion. Identifying and protecting the key areas with high importance for ecological sustainability are great challenges. The construction of an ecological security pattern (ESP) can improve landscape connectivity and reduce the fragmentation of ecological patches. Thus, it can be seen as an effective measure to protect regional ecological sustainability. In this study, taking the Pingshuo open-cast mining area as a case study area, ecological sources are identified through ecosystem structure and function, and corridors are extracted by constructing an ecological resistance surface, thus forming a valid ecological network. The results show that in 2018, the ESP in the study area included 11 sources with an area of 147.74 km2 and 17 corridors with a length of 92.11 km. Specifically, the ecological sources are mainly distributed in Taocun Township, Jingping Township, and Xiangyangbao Township. Among these 11 sources, sources 7 and 8 are reclaimed waste dump land, meaning that the land reclamation work in Pingshuo greatly promotes connectivity. Furthermore, dump 1 can be restored in the future by constructing three new corridors, which will greatly improve the landscape connectivity of Yuling Township. Overall, this study not only provides an effective framework for constructing and optimizing ESPs in ecologically fragile coal mining areas, but it also adds new insights to the concept of land reclamation in these areas.
1. Introduction
Mineral resources are an important and basic part of promoting economic development and social progress [1]. However, intensive mining activities have changed the characteristics of the land surface, destroyed the natural vegetation, and led to landscape fragmentation, connectivity decline, and biodiversity loss [2]. Due to this over exploitation, China has large tracts of damaged land, resulting from excavation, collapse, and occupation [3], which have caused the loss of regional natural ecosystems and the degradation of ecosystem functions. Therefore, understanding how to achieve stable ecosystems and enhance the functioning of the ecosystems in mining areas is imperative. Potential spatial pattern, called ecological security pattern (ESP), exists in landscapes. This is composed of strategic portions of, and positions in, a landscape that have critical significance in safeguarding and controlling certain ecological processes [4]. According to the feedback from the landscape pattern and ecological process, the ESP is an effective approach for supporting biological species, maintaining natural ecological processes, improving regional ecological security, and achieving ecological security [5,6]. At present, the construction of an ESP mainly consists of three parts: identifying ecological sources, constructing ecological resistance surfaces, and extracting ecological corridors.
Ecological sources are important ecological patches that provide critical ecosystem functions and are necessary for ensuring the structural integrity of ecosystems [7,8]. There are two main methods of identifying ecological sources. One is to directly select natural reserves, scenic areas, large areas of ecological land, and species habitats by their land-use types as ecological sources [9]. The other method is to identify sources via a more quantified, functional approach [7]. This is achieved by assessing ecological functions, such as habitat importance, ecological importance, and service value. However, these two methods have limitations. The former is mainly characterized by qualitative analysis, so it is difficult to extract all the critical ecological function patches using this method. The latter identifies ecological sources using purpose-oriented evaluation system construction, which may neglect the integrity of ecological patches from the perspective of ecosystem structure. Thus, this study attempts to identify ecological sources by comprehensively considering ecosystem structure and function.
Ecological resistance surfaces reflect the extent to which species migration is hindered in different patches [7], and are mainly affected by landscape heterogeneity [10]. At present, ecological resistance surface settings based on land-use types are widely used in research [11,12]. Although this method is universal, it does not consider the influence of ecological risk and regional characteristic geo-ecological resistance factors, especially in open-cast mining areas [13]. Therefore, the disaster disturbance risk index, which comprises risks of waste dump distance and slope, is used to modify the basic ecological resistance coefficients assigned based on land-use types in coal mining areas. Ecological corridors link the ecosystem elements effectively, improve the connectivity and integrity of the ecosystem, and enhance the regional ecological security and ecological carrying capacity [14,15,16]. They can be extracted using several methods, such as the minimum cumulative resistance (MCR) model [7], the patch gravity model [9], or by directly selecting important landscape elements as ecological corridors. The MCR model not only expresses the potential possibility and tendency of species’ movement [13], but also simulates different ecological flows across different landscape surfaces by establishing a minimum cumulative resistance path [17,18]. Thus, this study extracts ecological corridors using MCR.
The Pingshuo open-cast mining area is located in a typical arid/semi-arid ecologically fragile region [19] belonging to the Jinbei coal base area in western China [13]. In an area such as this, mining activities will inevitably affect the landscape pattern, even disastrously in some cases [20]. Ecological sources with strong ecological functions must be identified and protected to ensure the supply capacity of the ecosystem service. In addition, it is difficult for small-scale ecological restoration to ensure the ecological security of the whole area due to a lack of spatial coordination [21]. Therefore, suggestions for the future are urgently needed for ecological restoration from a macroscopic perspective. In this study, the four specific objectives are as follows: (1) to identify the ecological sources by evaluating the ecosystem function and structure for protection; (2) to build resistance surfaces based on the MCR model to extract ecological corridors that can strengthen the material and energy flow between the ecological sources and provide an important channel for species migration; (3) to optimize the current ESP based on the spatial pattern of landscape elements; and (4) to put forward corresponding countermeasures and suggestions for future ecological restoration and land reclamation from the perspective of the ESP.
2. Materials and Methodology
2.1. Study Area
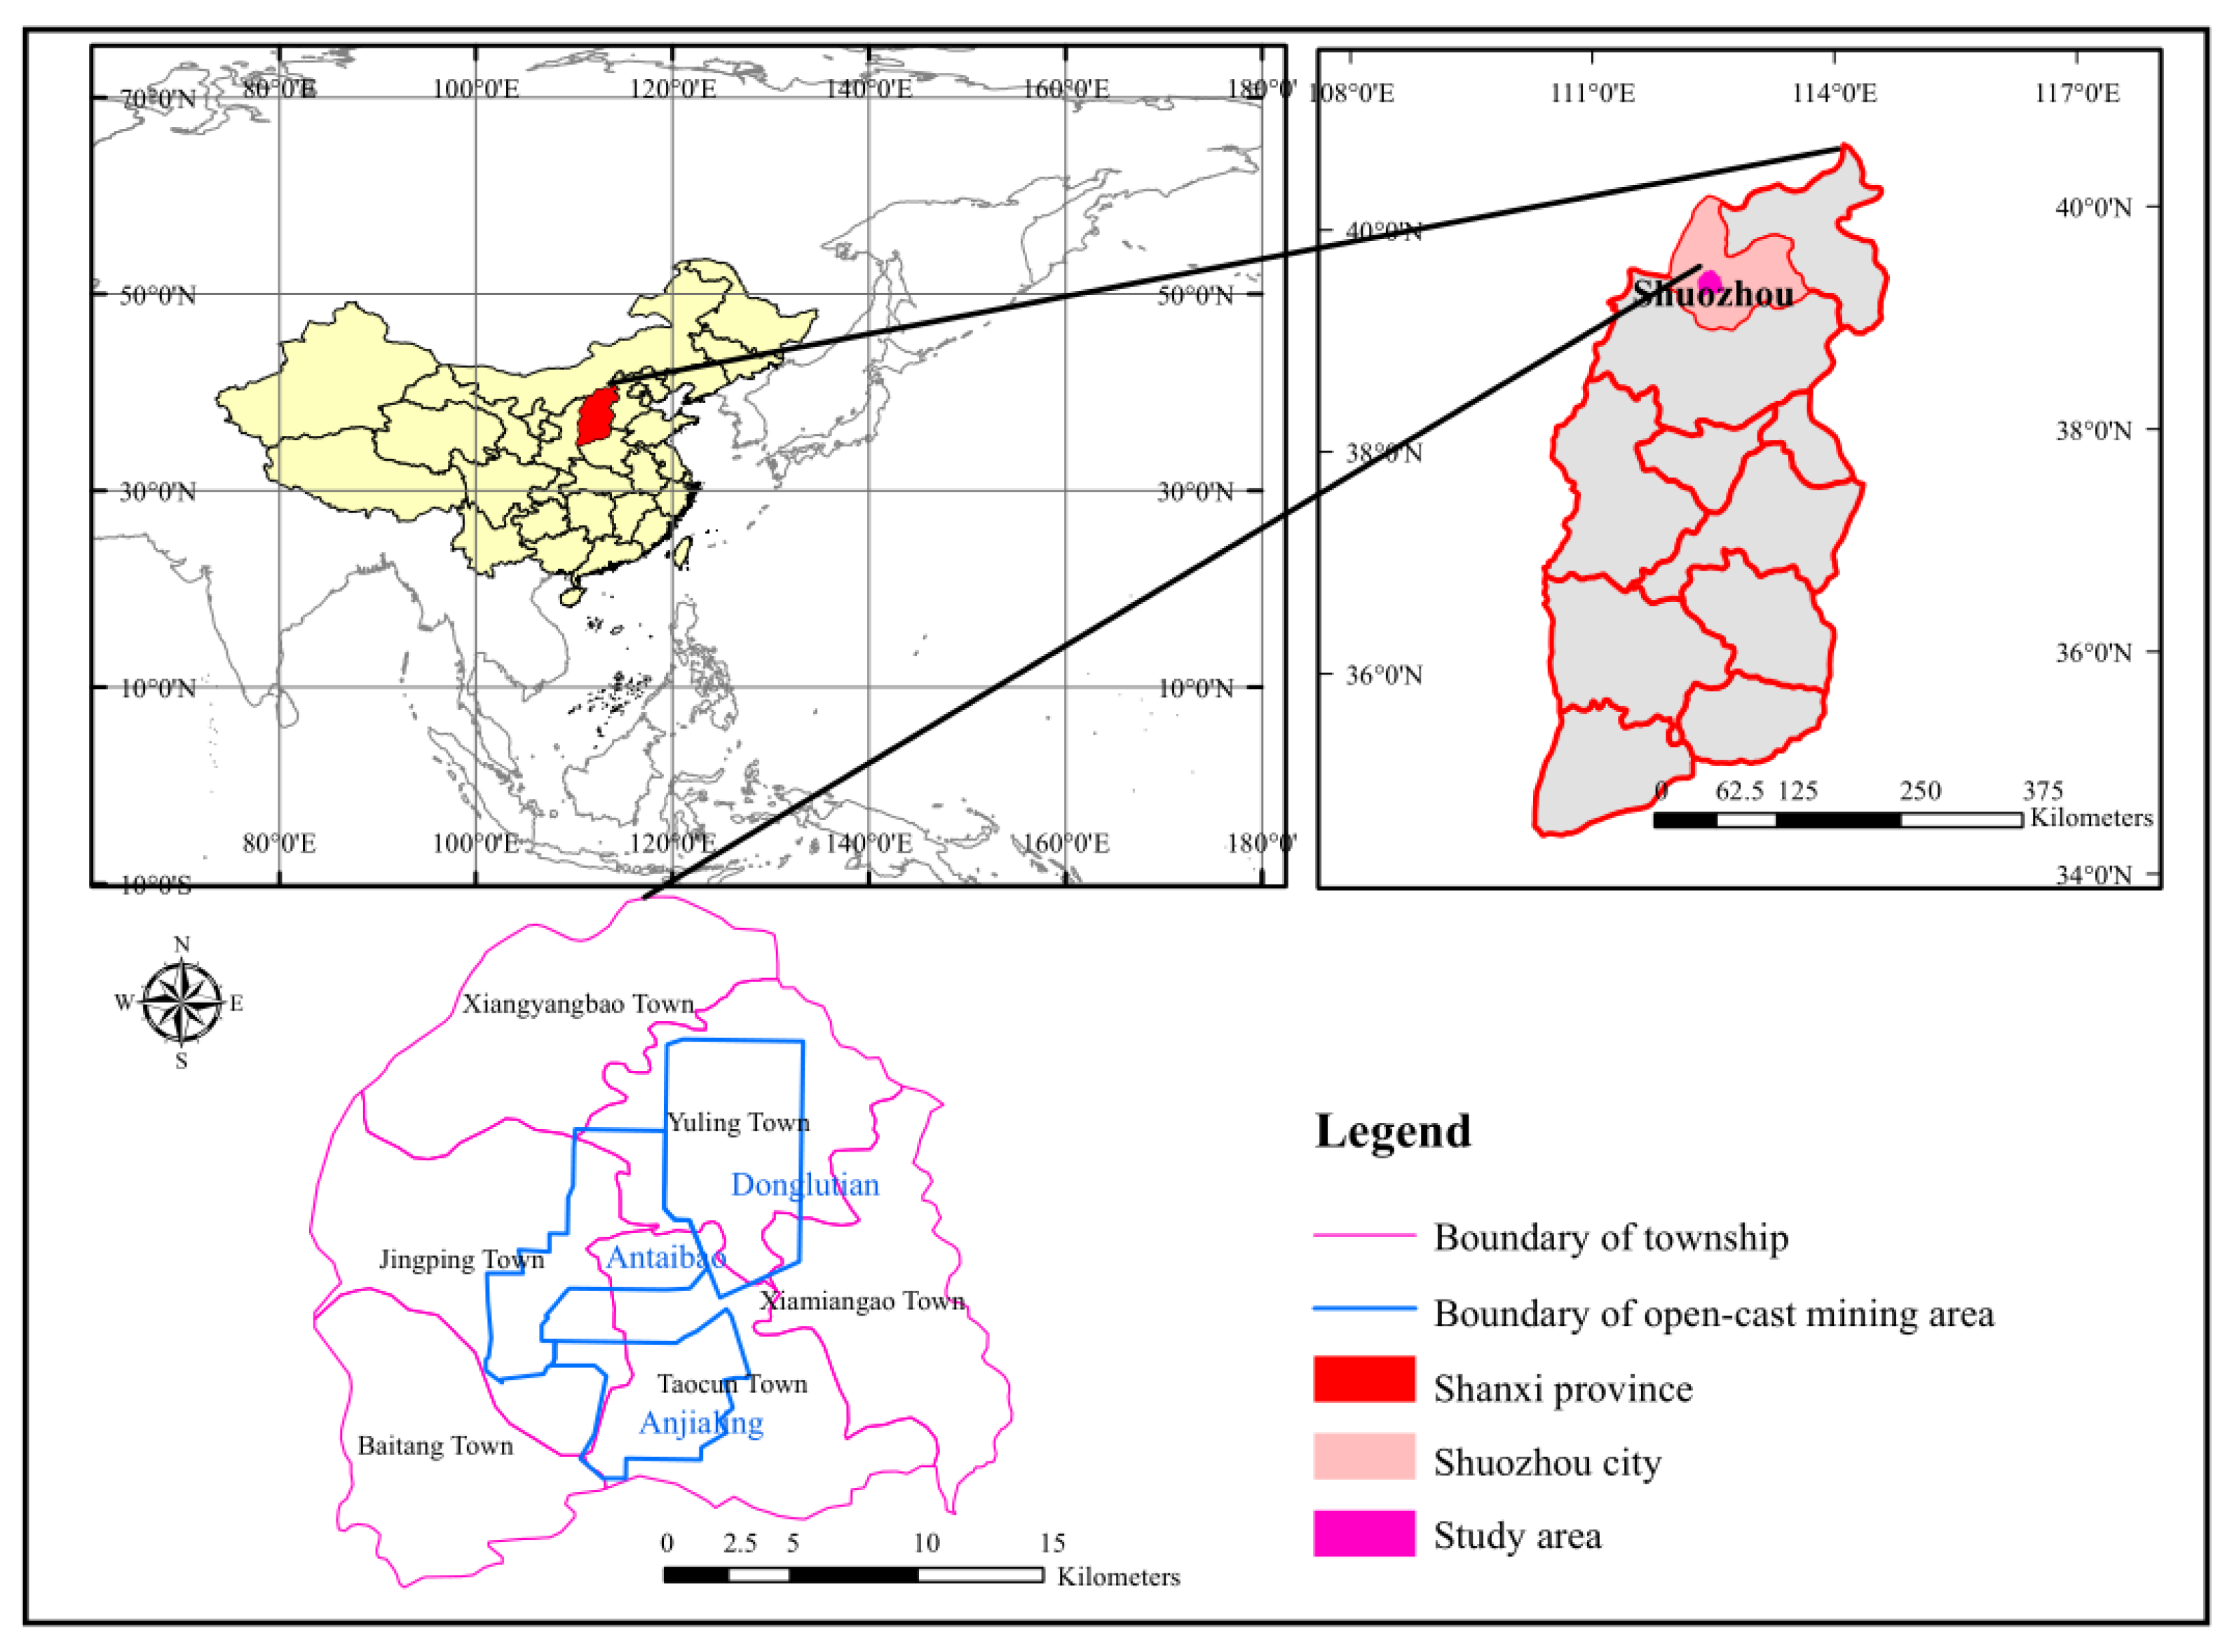
As show in Figure 1, the study area is located in the Pinglu District, Shuozhou City, Shanxi Province, between 111°52′–112°41′ E and 39°21′–39°58′ N. The area is 67.9 km wide from east to west and 69.5 km long from northwest to southeast, with an area of 517.48 km2. The region has a typical arid/semi-arid temperate continental monsoon climate with average annual precipitation of 428.2–449.0 mm and evaporation of 1786.6–2598.0 mm, resulting in drought and rain erosion [20]. The zonal soil is a transition between chestnut soil and chestnut cinnamon soil with low organic matter content and inferior structure. Besides the harsh natural conditions, disasters such as landslides and collapses are easily caused by the production process due to the impact of the slope and other environmental factors, as well as mining earthquakes caused by blasting, exploiting, and other mining activities [20]. Furthermore, the negative effects of mining operations, such as soil erosion, vegetation degradation, and surface water pollution [22], can spread rapidly in the area.
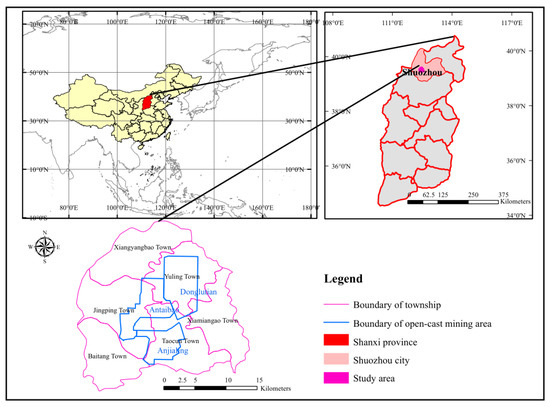
Figure 1.
Location of the study area.
According to the administrative division, the study area encompasses Jingping Township, Xiangyangbao Township, Baitang Township, Yuling Township, Taocun Township, and Xiamiangao Township. The key industries in this study area include mineral resource exploitation, processing and service industries, agricultural production, and biological resource utilization. As a large-scale centrally developing coal mine in China [22], the mining area is 23 km long and 22 km wide, with a prospecting area of 380 km2 and proven geological reserves of 12.75 billion tons. At present, there are three national oversize open-cast mines, namely Antaibao open-cast mine, Anjialing open-cast mine, and East open-cast mine [23].
2.2. Data Sources
(1) The land cover information (with a resolution of 30 m × 30 m) was obtained through the interpretation of Landsat TM images in 2018, and was used to calculate the erosion control practice factor P, habitat quality, ecological resistance coefficient, and extracted ecological patches. The land-use types were reclassified as cultivated land, forest land, grassland, water, construction land, and damaged land (open-cast area, stripped area, and waste dump). (2) A digital elevation model (DEM. http://www.gscloud.cn, accessed on 21 March 2021) with a resolution of 30 m × 30 m provided the terrain factors LS and slope. (3) Precipitation, evapotranspiration, and other meteorological data were derived from the annual meteorological statistics of the National Meteorological Science Data Sharing Service Platform (http://data.cma.cn, accessed on 15 February 2021) and were calculated to water conservation. (4) Soil dataset data were obtained from World Soil Database (http://westdc.westgis.ac.cn, accessed on 7 March 2021), which was used to calculate the erosion control practice factor K.
2.3. Methodology
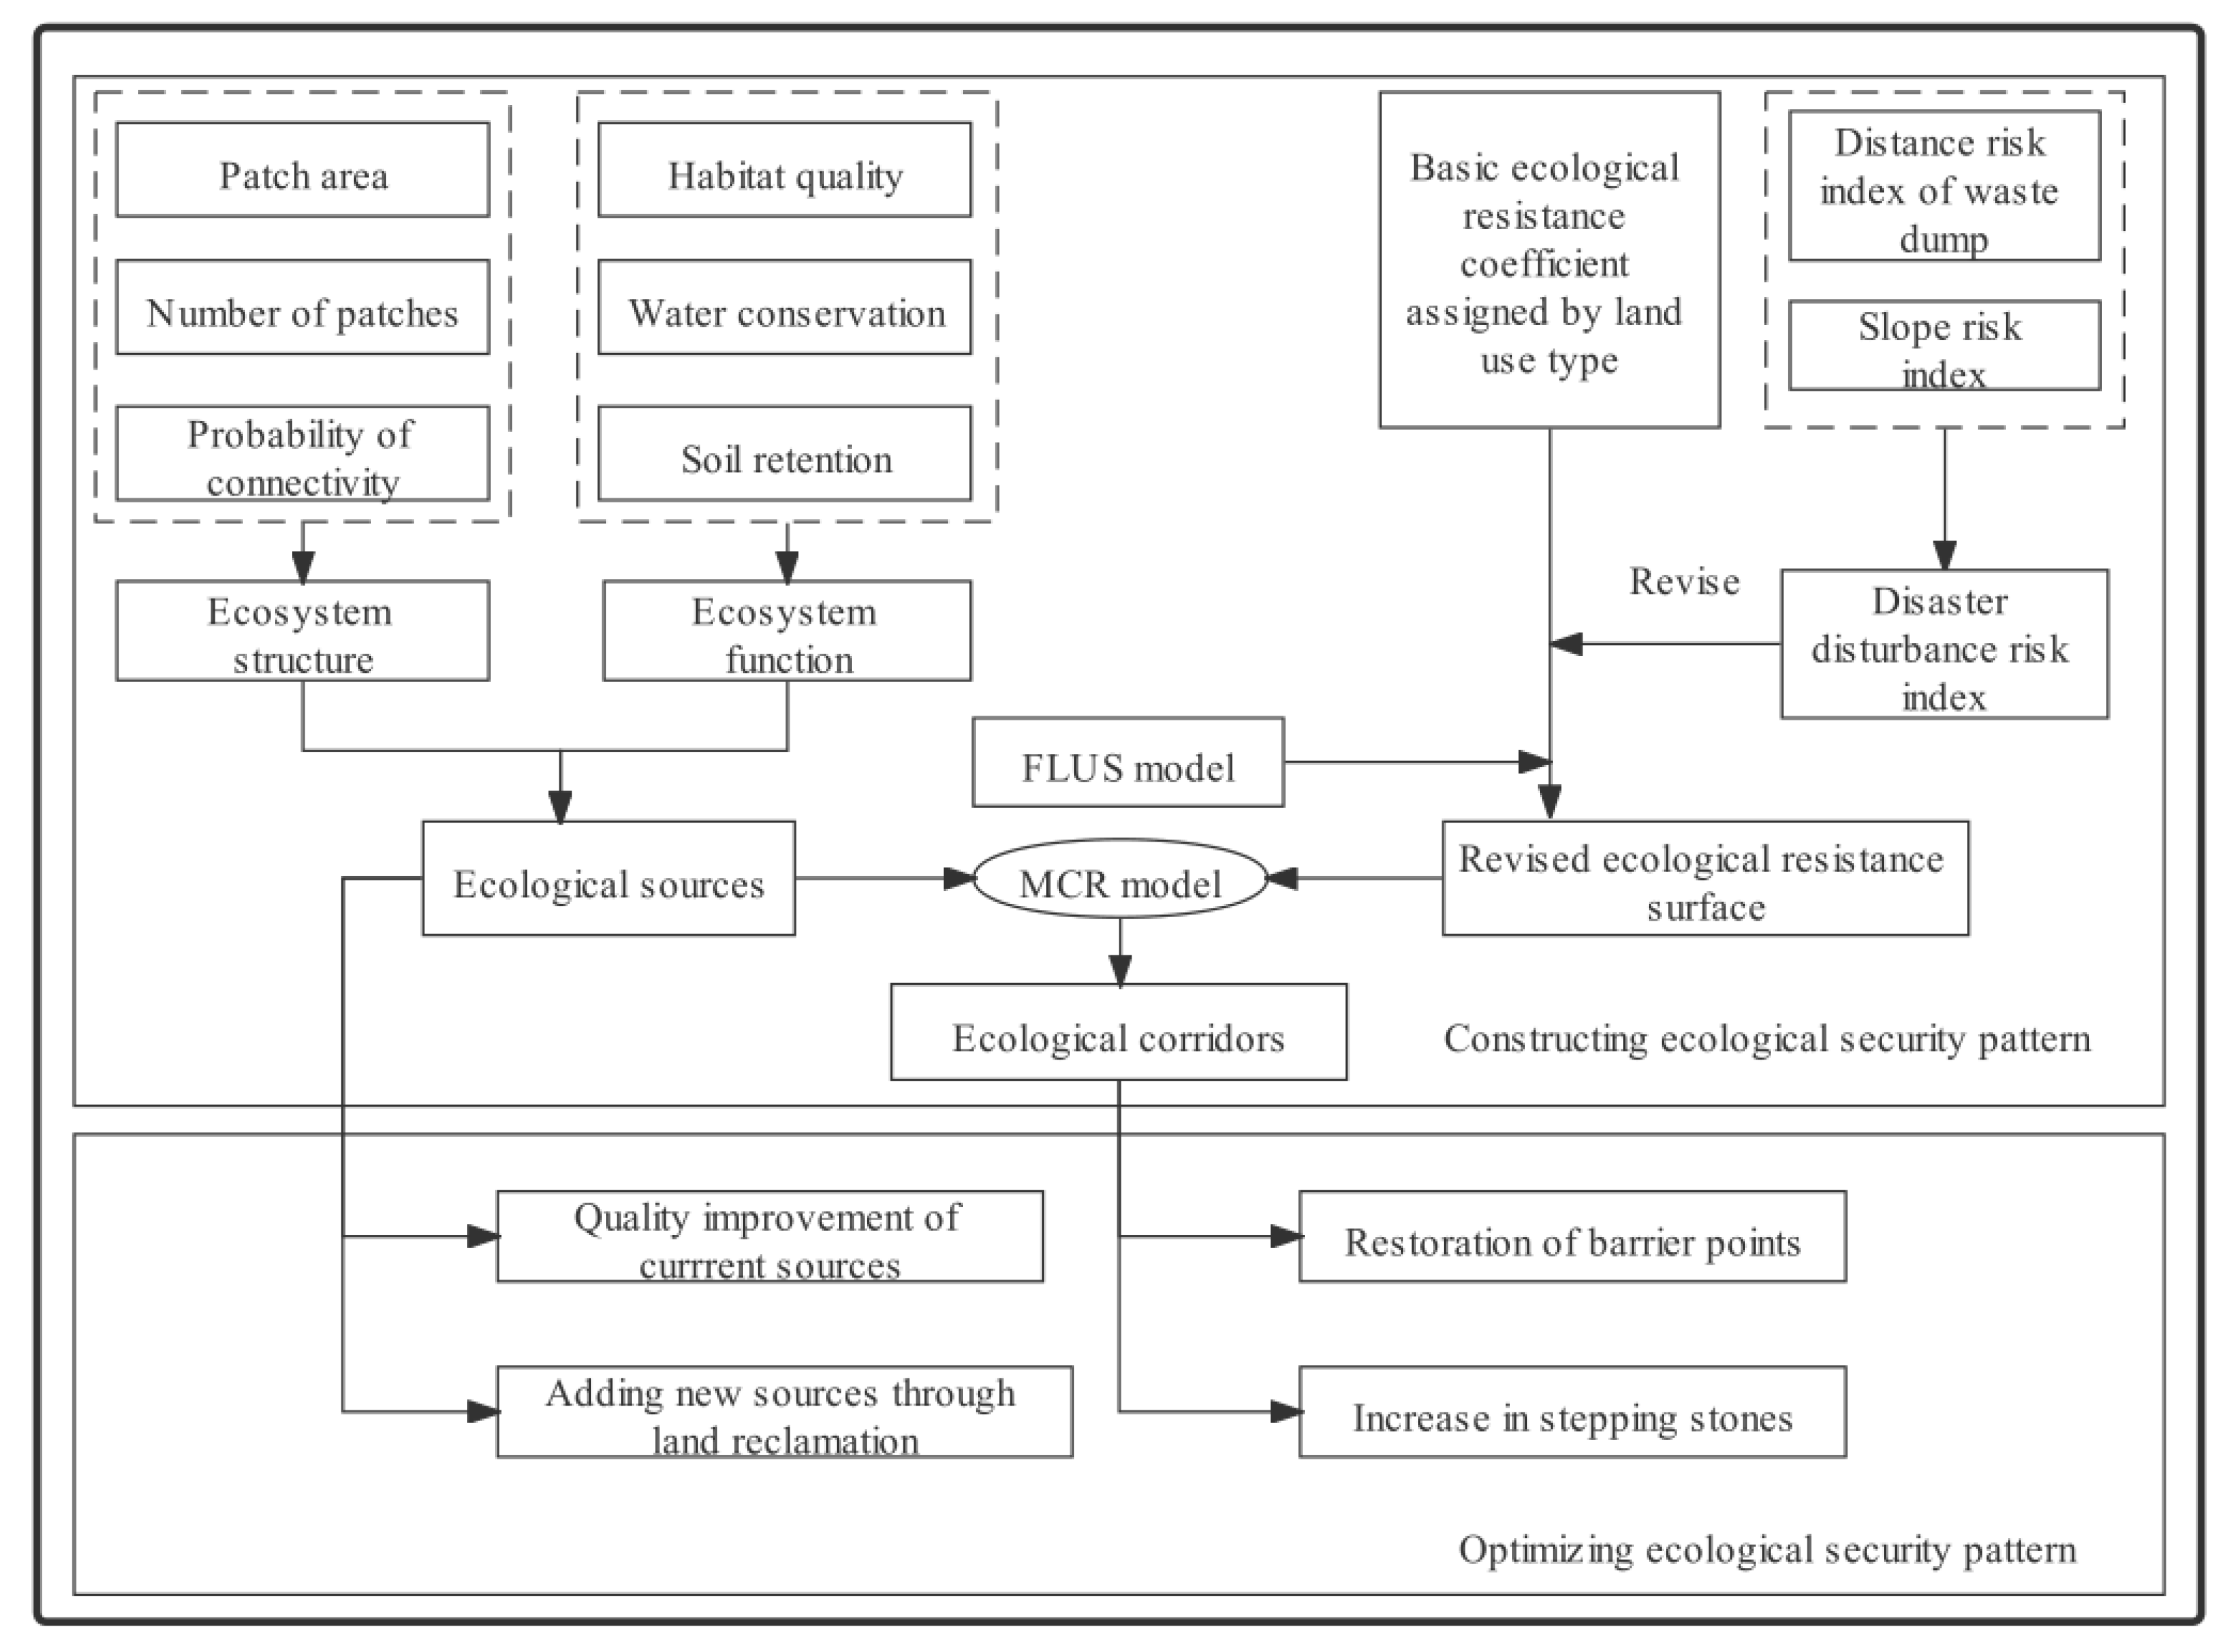
The methodological framework is shown in Figure 2. Firstly, the ecological sources were identified by comprehensively analyzing the ecosystem structure and function. Secondly, the ecological resistance surface based on land-use type assignment was revised with a disaster disturbance risk index. Thirdly, potential ecological corridors were obtained with the MCR model. Finally, we proposed a number of reasonable suggestions to optimize the current ESP. The methodology is described in more detail in Section 2.3.1, Section 2.3.2, Section 2.3.3 and Section 2.3.4.
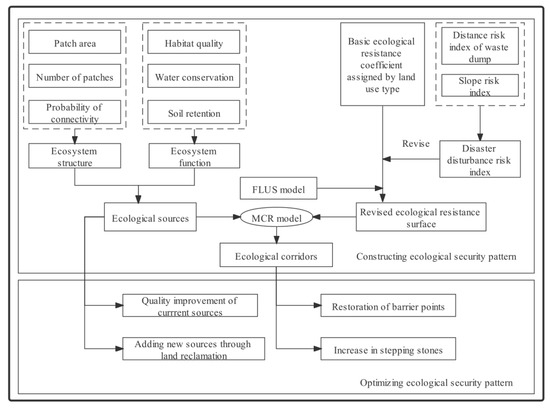
Figure 2.
Methodological framework used to construct and optimize ESP.
2.3.1. Identifying Ecological Security Sources
Ecological sources are the core ecological patches that promote ecological processes, maintain ecosystem integrity, and supply ecosystem services [5,7]. Namely, the structure stability and supply capacity of an ecosystem service should be preferentially considered for the selection of ecological sources. Therefore, this study identified ecological sources by comprehensively considering ecosystem structure and function. The specific steps involved in identifying the ecological sources were as follows.
- (1)
- Measuring ecosystem structure
Ecosystem structure is represented by the type, area, number, spatial distribution, and configuration of an ecosystem or landscape patch at the macro scale [8,24]. It is closely related to ecological processes, having a significant influence on the capacity to maintain ecosystem stability and integrity [25]. Multiple original lands in the Pingshuo mining area have been damaged by long-term surface mining activity, resulting in a change in the ecosystem structure and a decline in ecosystem functions [26]. Coal mining activities usually result in an increase in the number of ecological patches and a decrease in the size of ecological patches, which increases landscape fragmentation and decreases landscape connectivity in the overall landscape [27]. To promote the sustainability of ecosystem functions, the first and most important step in constructing an ESP is to identify ecological sources based on the integrity of ecological land patches and landscape connectivity. The method of ensuring the integrity of ecological sources is by restricting each ecological source to a single ecological land patch. In this study, forest patches, grassland patches, and water patches were considered as ecological patches. As the source patch area was not smaller than 0.12 km2 [9,13], ecological patches above the threshold were regarded as potential ecological sources. Ecological patches with small areas provide greatly limited ecosystem services, which are not conducive to the flow of material and energy [15,28]. Thus, the remaining patches were removed due to their low impact on the overall study area.
The interior ratio was the ratio between the perimeter and the area, and it reflected the edge effect of the patches. A high ratio value means a large edge contact area with the outside environment, resulting in a small patch core area. Thus, a relatively stable patch should have a lower interior ratio value. The area is one of the most important structure indexes of ecological patches. Generally speaking, larger areas mean richer biodiversity, which promotes the extension of ecological sources effectively.
The probability of connectivity PC was the best index for evaluating connectivity. The PC is based on a rich connection model and was not affected by the presence of adjacent habitat patches or cells in the analyzed dataset [29]. The value of the PC was between 0 and 1, with the PC increasing as connectivity improved. The dPC(%) value indicated the importance of an existing node for maintaining landscape connectivity, and was used to represent the importance of each patch. The PC and dPC(%) were given by:
where m was the total number of habitat nodes in the landscape; and were the attributes of nodes i and j, respectively; referred to the maximum landscape attribute; and represented the maximum product probability of all paths between patches i and j.
- (2)
- Measuring ecosystem function
Ecosystem function refers to a comprehensive characterization of various ecological processes [25] that indicate the capacity for providing services for human demands. Since there were natural disturbances and intense coal mining activities in the study area, ecological issues, such as biodiversity loss, water resources shortage, and soil erosion, hindered ecological process to some extent. Therefore, habitat quality, water conservation, and soil retention in this study area were qualified to select the important multifunctional ecological sources.
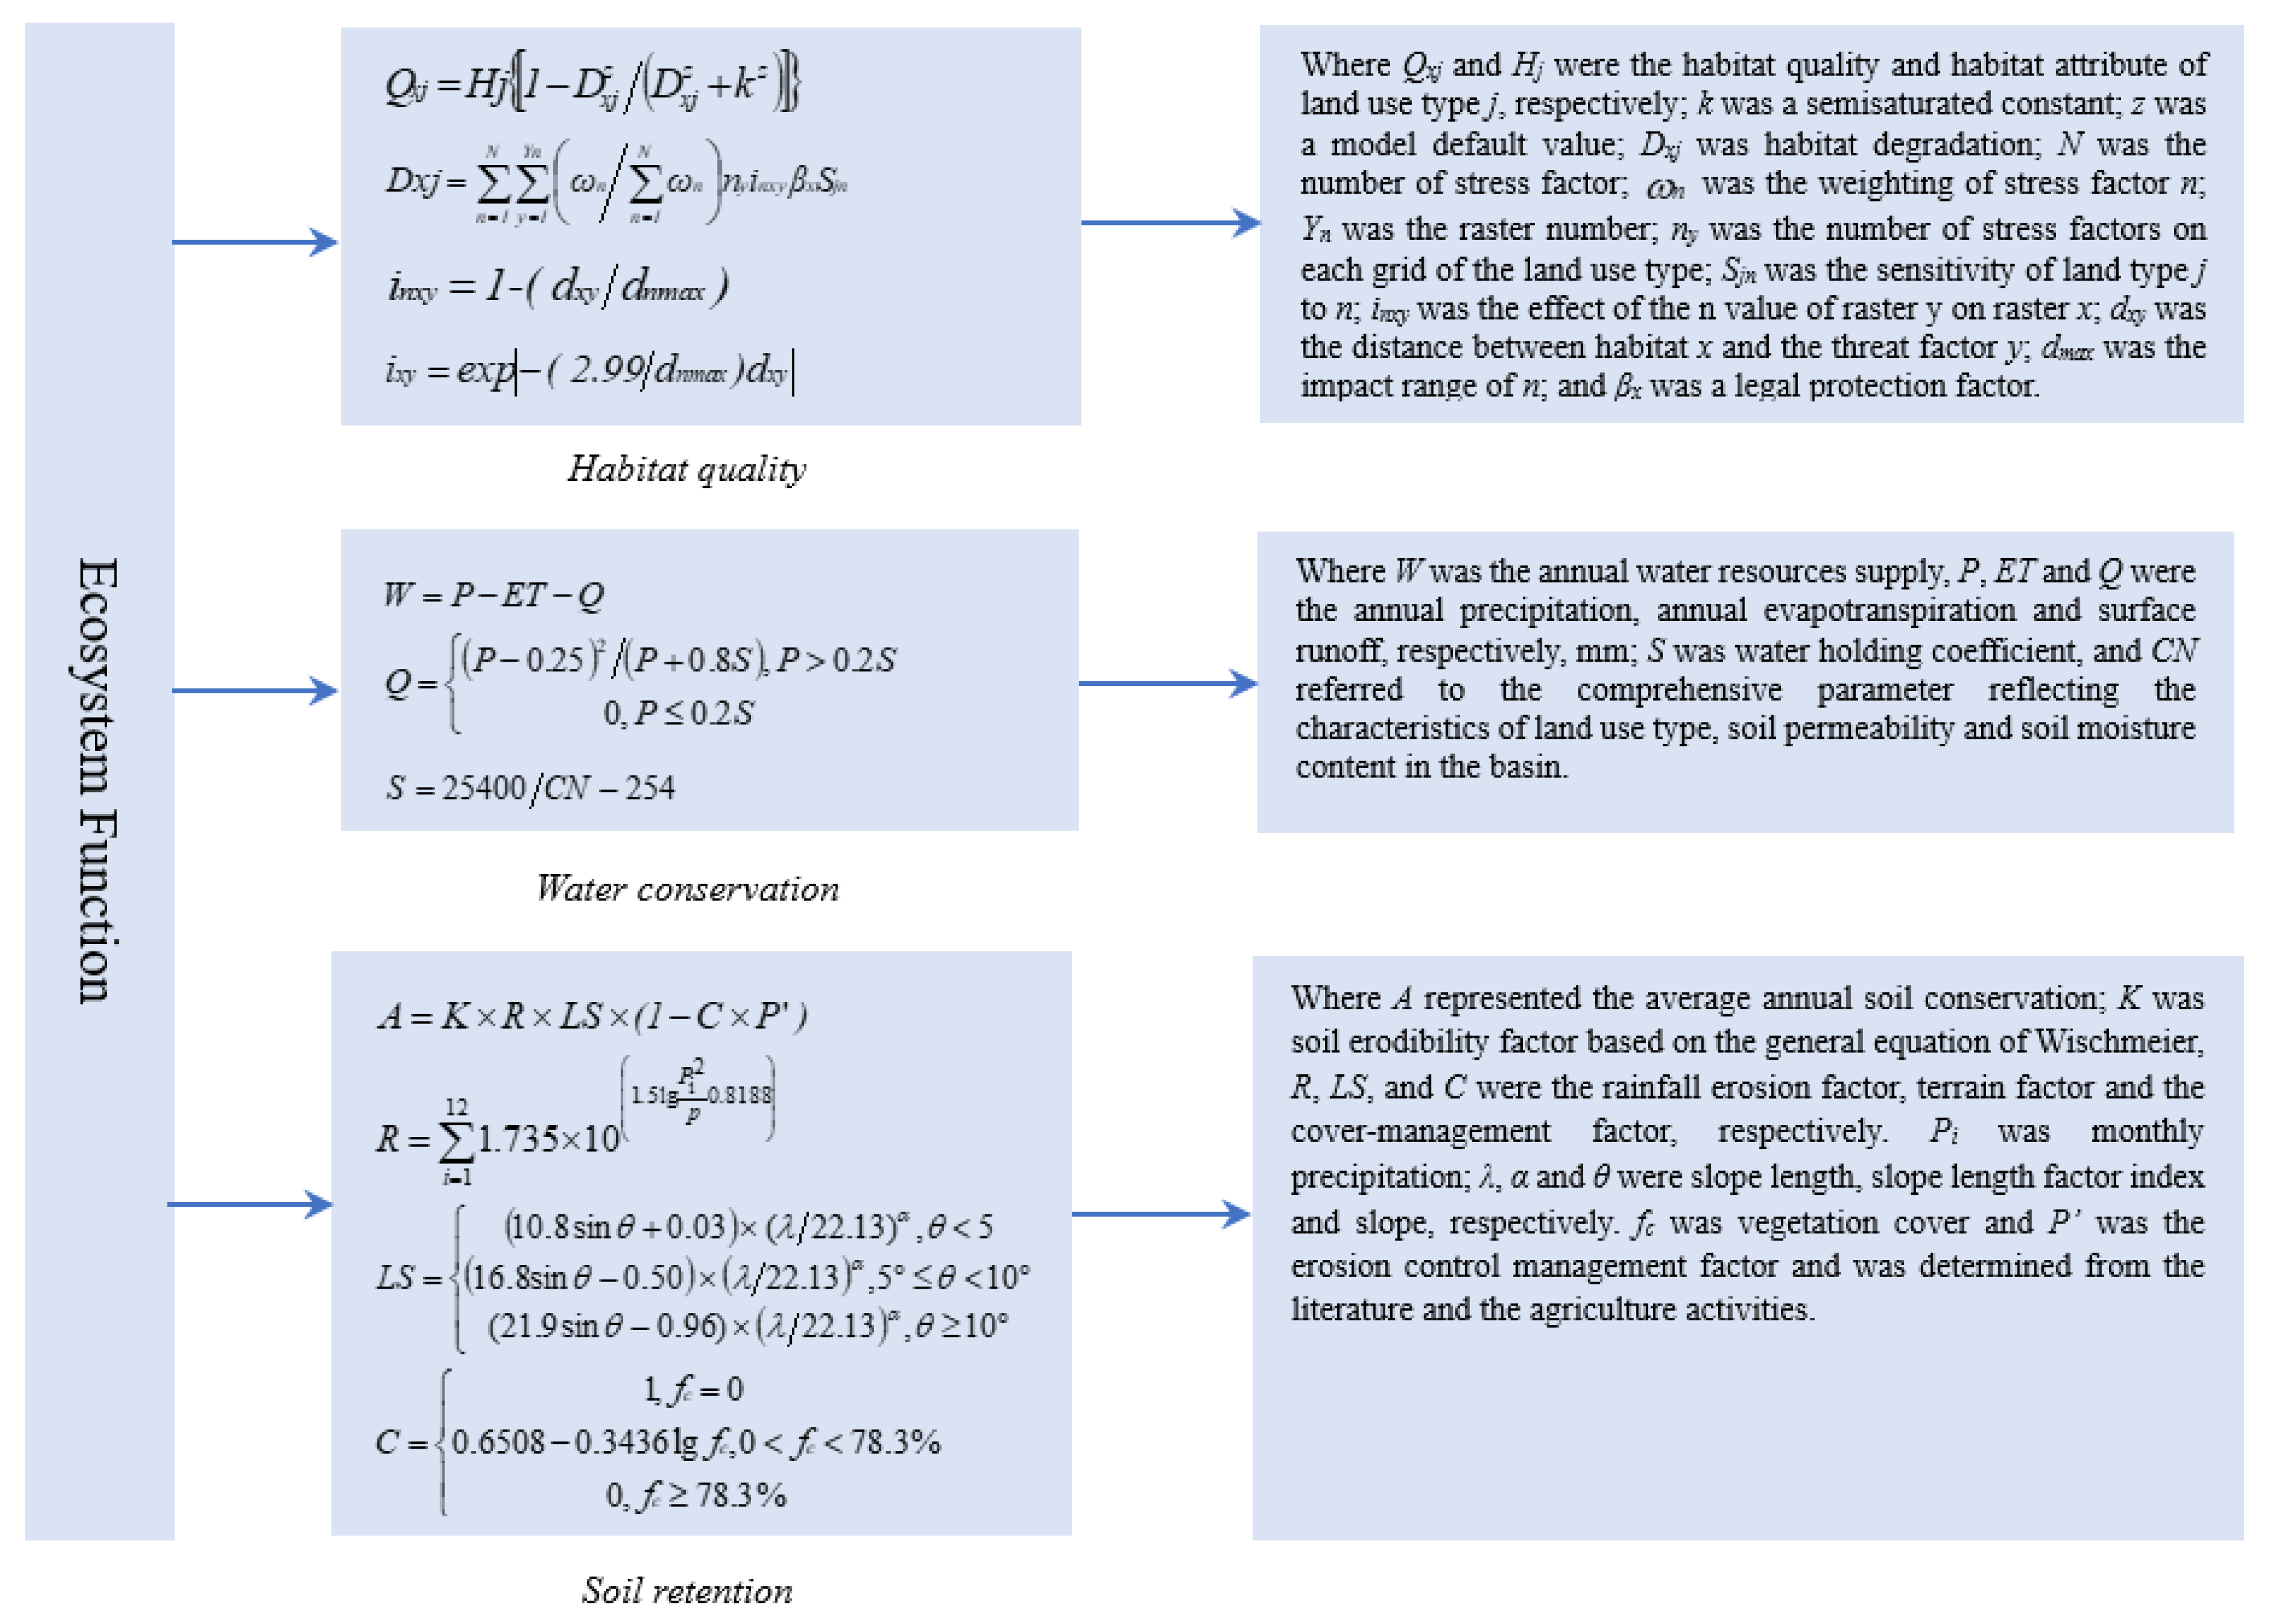
As shown in Figure 3, habitat quality refers to the ability of the ecosystem to provide appropriate conditions for individual and population persistence [30], and plays an essential role in the effectiveness of the biodiversity conservation status [31,32,33]. The InVEST model was used to assess the habitat quality in the study area, and was estimated based on information concerning land use/land cover and threats to biodiversity. In this study, stress factors included cultivated land, construction land, damaged land, and various parameters. The maximum influence distance, weight, spatial decay type, and sensitivity were determined specifically from the literature [8,34]. Water conservation refers to an ecosystem’s retention and interception of precipitation, meaning the ability to regulate runoff and river discharge [7]. Water conservation was calculated using a water balance model in this study. Soil retention refers to indicators with the capacity to reduce soil loss and maintain soil fertility [35]. Revised universal soil loss equation (RUSLE) is an empirically based model that can forecast a long-time mean annual amount of soil erosion on a ground slope as a consequence of precipitation arrangement, topography, soil type, administration practices, and crop system, and can quantify the soil erosion risk index well. Thus, soil retention was analyzed using the RUSLE model.
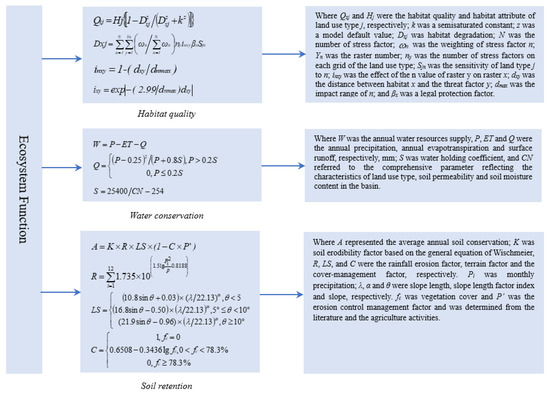
Figure 3.
Ecosystem function.
- (3)
- Selecting ecological sources comprehensively considering structure and function
In this study, we extracted ecological sources with six indicators, namely interior ratio, area, dPC, habitat quality, water conservation, and soil retention. The values of these six indicators were normalized to eliminate the influence of unit and scale differences. Considering that each ecological source patch was restricted as a single ecological patch in this study, the second step was to calculate the mean value of each ecosystem function in different patches separately. The purpose was to analyze the importance of each patch based on these three functions. The last step was to calculate the final score of every ecological patch with the following formula:
where was the final score of patch i, which could determine the final priority of the patch for the selection of ecological sources. denoted the standardized reciprocal of interior ratio; and indicated the standardized values of area and ; and , , and were the mean values of habitat quality, water conservation, and soil retention of patch i. These three values were standardized before calculating the mean values of patch i.
2.3.2. Revising Ecological Resistance Surface Using Disaster Disturbance Risk Index
The ecological resistance coefficient indicates the degree to which species are hindered from moving through different landscape units or habitat patches [7]. Species and energy are affected by natural interference and human activity when they migrate in space, and the differences in the various influence approaches are mainly attributed to different land-use types [8]. Therefore, the method of assigning land-use types to the ecological resistance coefficient value has been widely used [11]. However, it is difficult to reflect human disturbance and regional ecological risk within the same land-use type when constructing ecological resistance surfaces using the differences in various land-use types; therefore, we must find a way to embody the internal differences.
The study area was a fragile ecological environment system that was sensitive to the environment; that is, a loess-strong erosion ecological fragile system. To reflect the typical characteristics of the study area, an ecological risk index was used to modify the basic ecological resistance surface assigned based on land-use type. The ecological risk index was mainly constructed by comprehensively considering the effects of the slope risk index and the disaster disturbance risk index. This could better reflect the ecological processes associated with the material circulation and energy flow both between different land-use types and within the same land-use type. These calculations were performed using the following formulas:
where was the ecological resistance coefficient of raster ; was the ecological resistance coefficient assigned based on land-use type; , was the average ecological risk index of land-use type ; , , , and denoted the ecological risk index, mine distance risk index, normalized mine distance risk index, and slope risk index of raster , respectively; was the waste dump area of the open-cast mine ; n denoted the number of waste dumps in the study area; and was the distance risk index of the waste dump of raster .
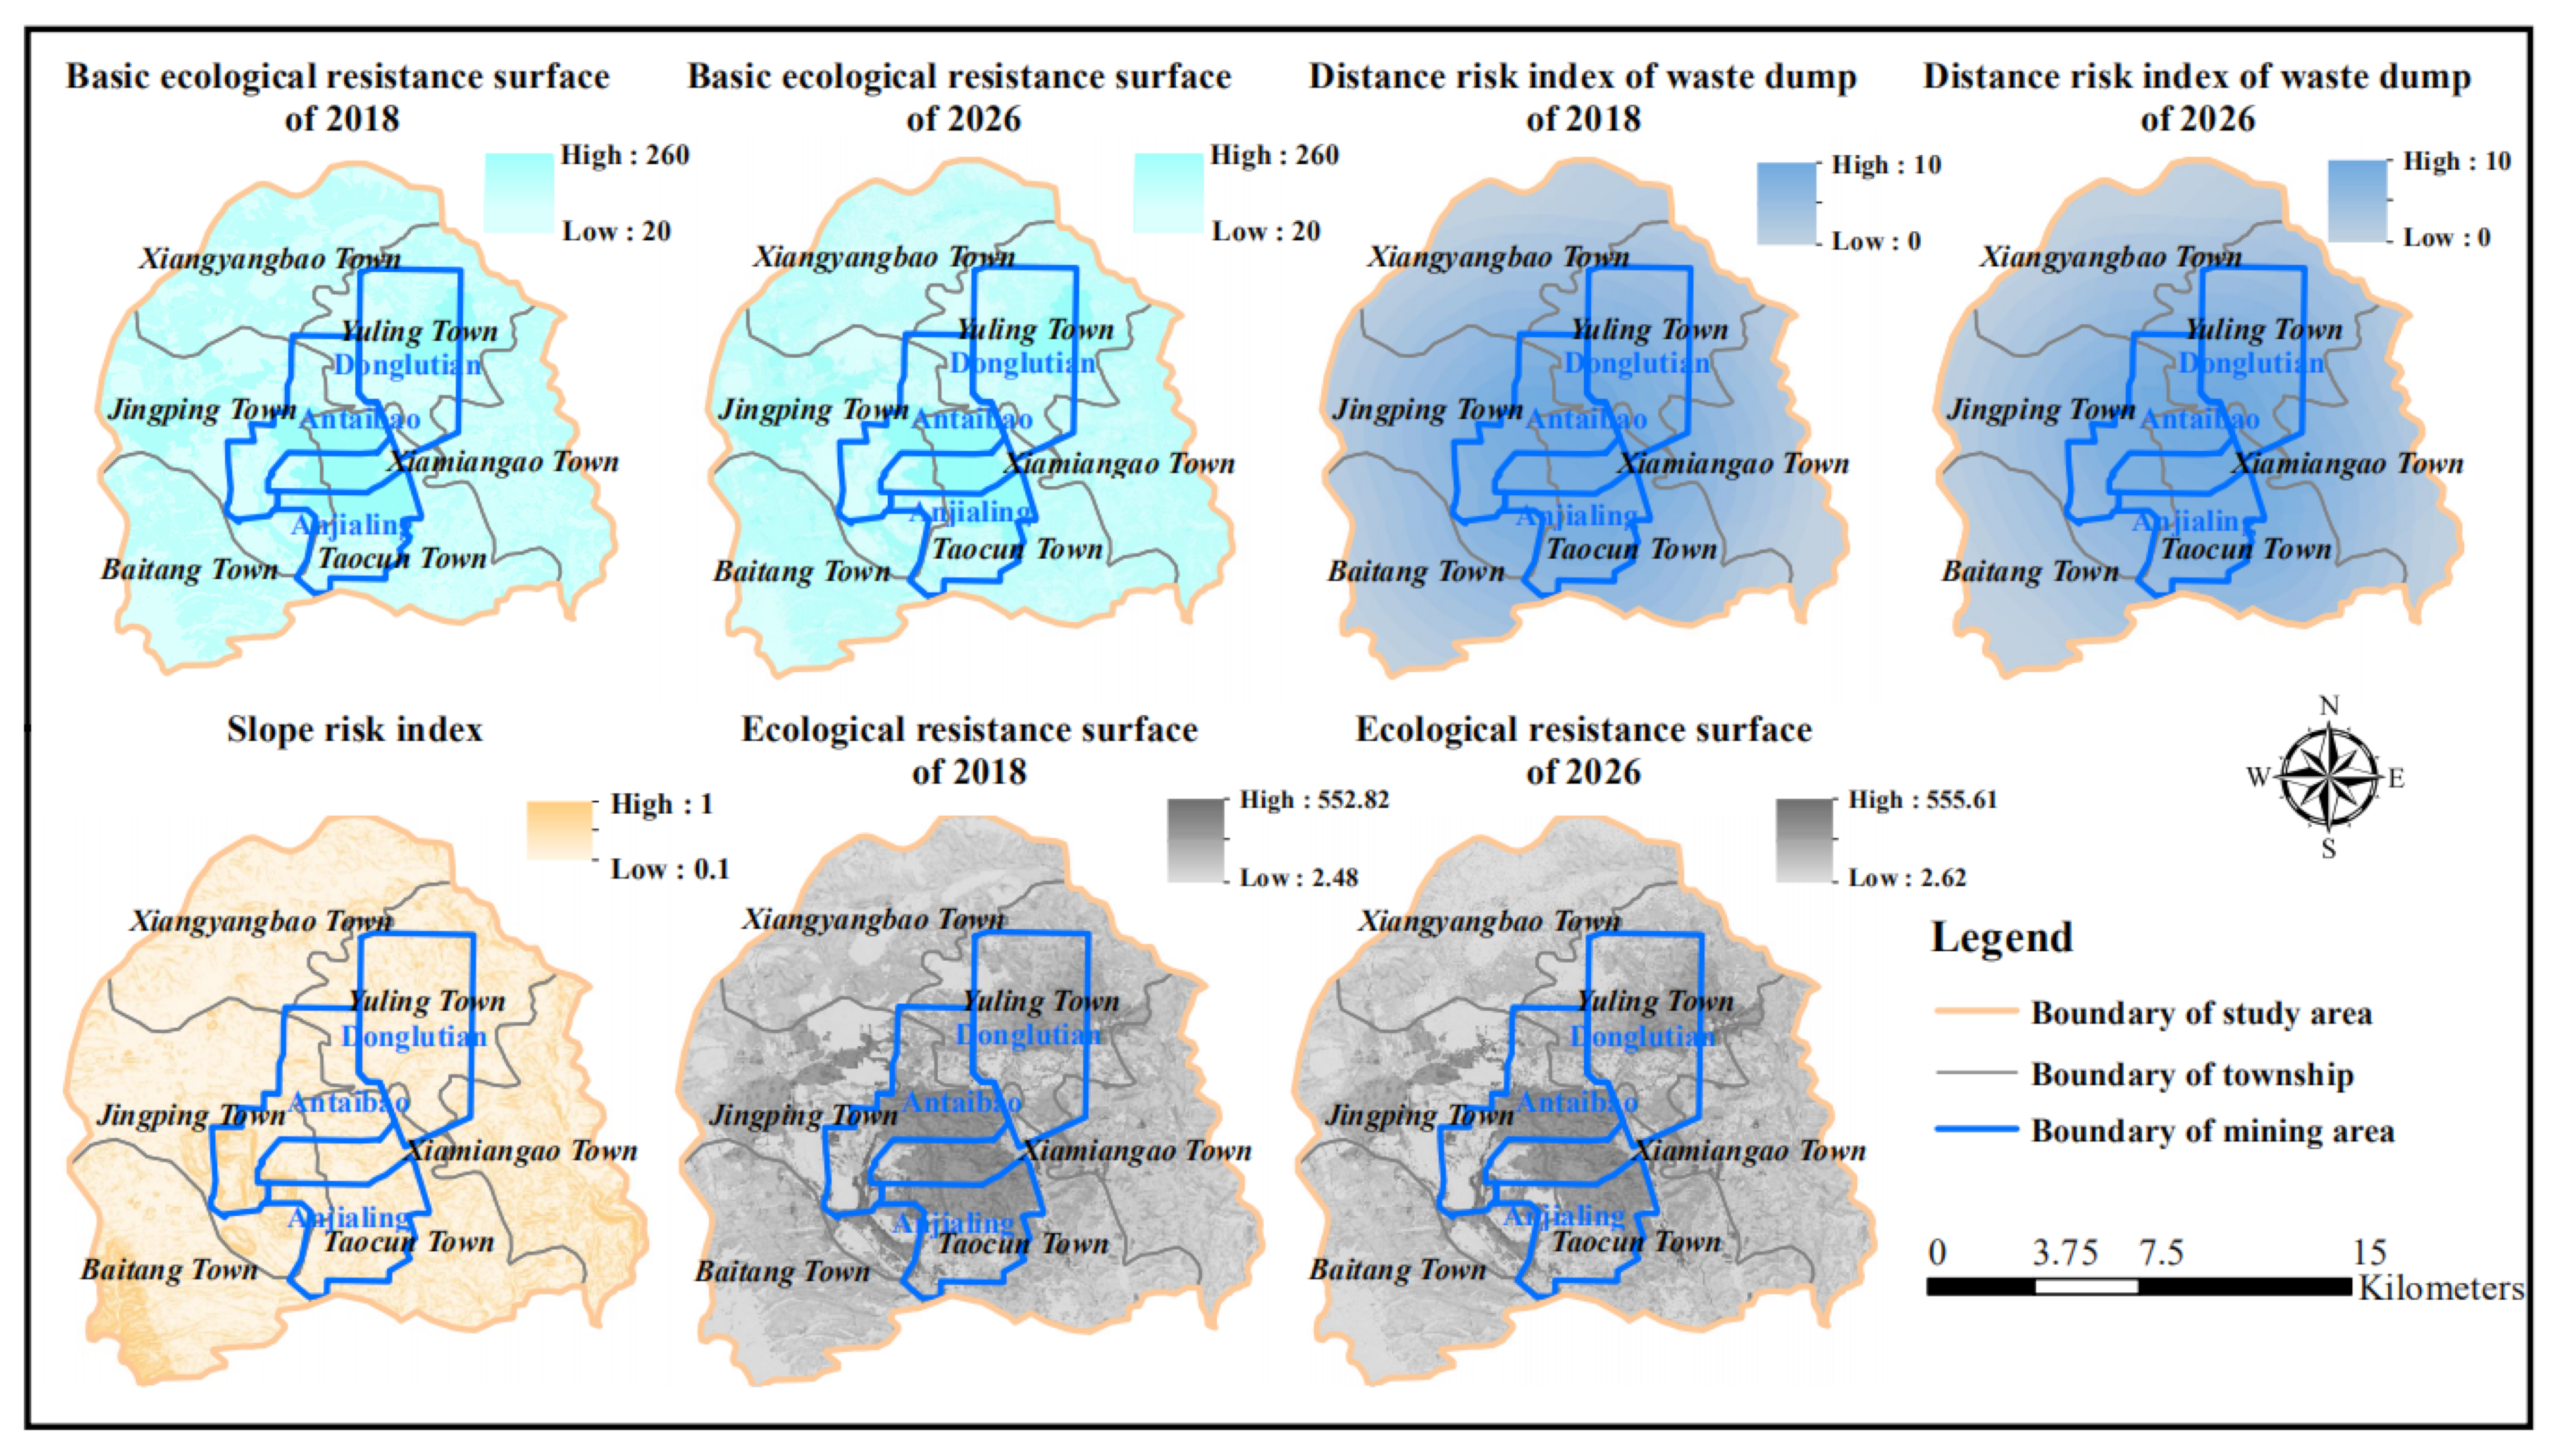
Basic ecological resistance coefficients for cultivated land, forest land, grassland, water, construction land, and damaged land were assigned values of 120, 20, 80, 20, 240, and 260, respectively. The specific resistance coefficients were determined using an expert scoring method based on existing research [8,12]. The ecological risk index was established by comprehensively considering the effects of the slope risk and mine distance risk indexes. As the major element of geomorphic characteristics, slope has a prominent impact on soil erosion. Generally speaking, a steeper slope triggers stronger soil erosion. Therefore, a steep slope was assigned a higher risk value in this study. The slope risk index was calculated by assigning risk values based on the natural breakpoint method. This divided the study area into 10 internals: 0–3.1°, 3.1–5.3°, 5.3–7.3°, 7.3–9.5°, 9.5–11.9°, 11.9–14.8°, 14.8–18.6°, 18.6–23.6°, 23.6–31.1°, and >31.1°. Corresponding risk values were assigned as 1, 2, 3, 4, 5, 6, 7, 8, 9, and 10. As a significant element of the damaged land, waste dumps occupied numerous parts of the study area, which resulted in less biodiversity, water and soil erosion, and land degradation [36]. Furthermore, the waste dump was the highest ecological risk region in the Pingshuo open-cast area [37]. Generally, the adverse impacts on the surrounding environment were inversely proportional to the distances to the waste dumps. Thus, buffer radii of 1, 2, 3, 4, 5, 6, 7, 8, 9, and 10 km from each large waste dump were used to construct multiple buffer zones. This study divided the research area into 11 regions: 0–1 km, 1–2 km, 2–3 km, 3–4 km, 4–5 km, 5–6 km, 6–7 km, 7–8 km, 8–9 km, 9–10 km, and >10 km from each large waste dump. A larger waste dump indicated a larger impact on the surroundings. Therefore, the ratio between a single waste dump area and the total waste dump area in the study region was used to judge the disturbance capacity of each dump. A larger ratio indicated a larger mine distance risk value. The spatial distribution of the mine distance risk index was obtained with the inverse distance weighted.
2.3.3. Extraction of Potential Ecological Corridors Using the MCR Model
Ecological corridors connect different ecological patches and provide channels for the migration of species and ecological flow between sources [5]. Ecological corridors convey the transfer of ecological flow, ecological processes, and ecological functions in a region [5]. In this paper, the minimum cumulative resistance model was applied to establish the ESP, with the specific formula as follows:
where was the minimum cumulative resistance value; indicated the positive correlation between the ecological process and the minimum cumulative resistance; was the spatial distance from the ecological source patch to the landscape unit ; and was the resistance coefficient of the landscape unit to the species movement.
2.3.4. Ecological Risk Prediction Based on a Future Land-Use Simulation Model (FLUS)
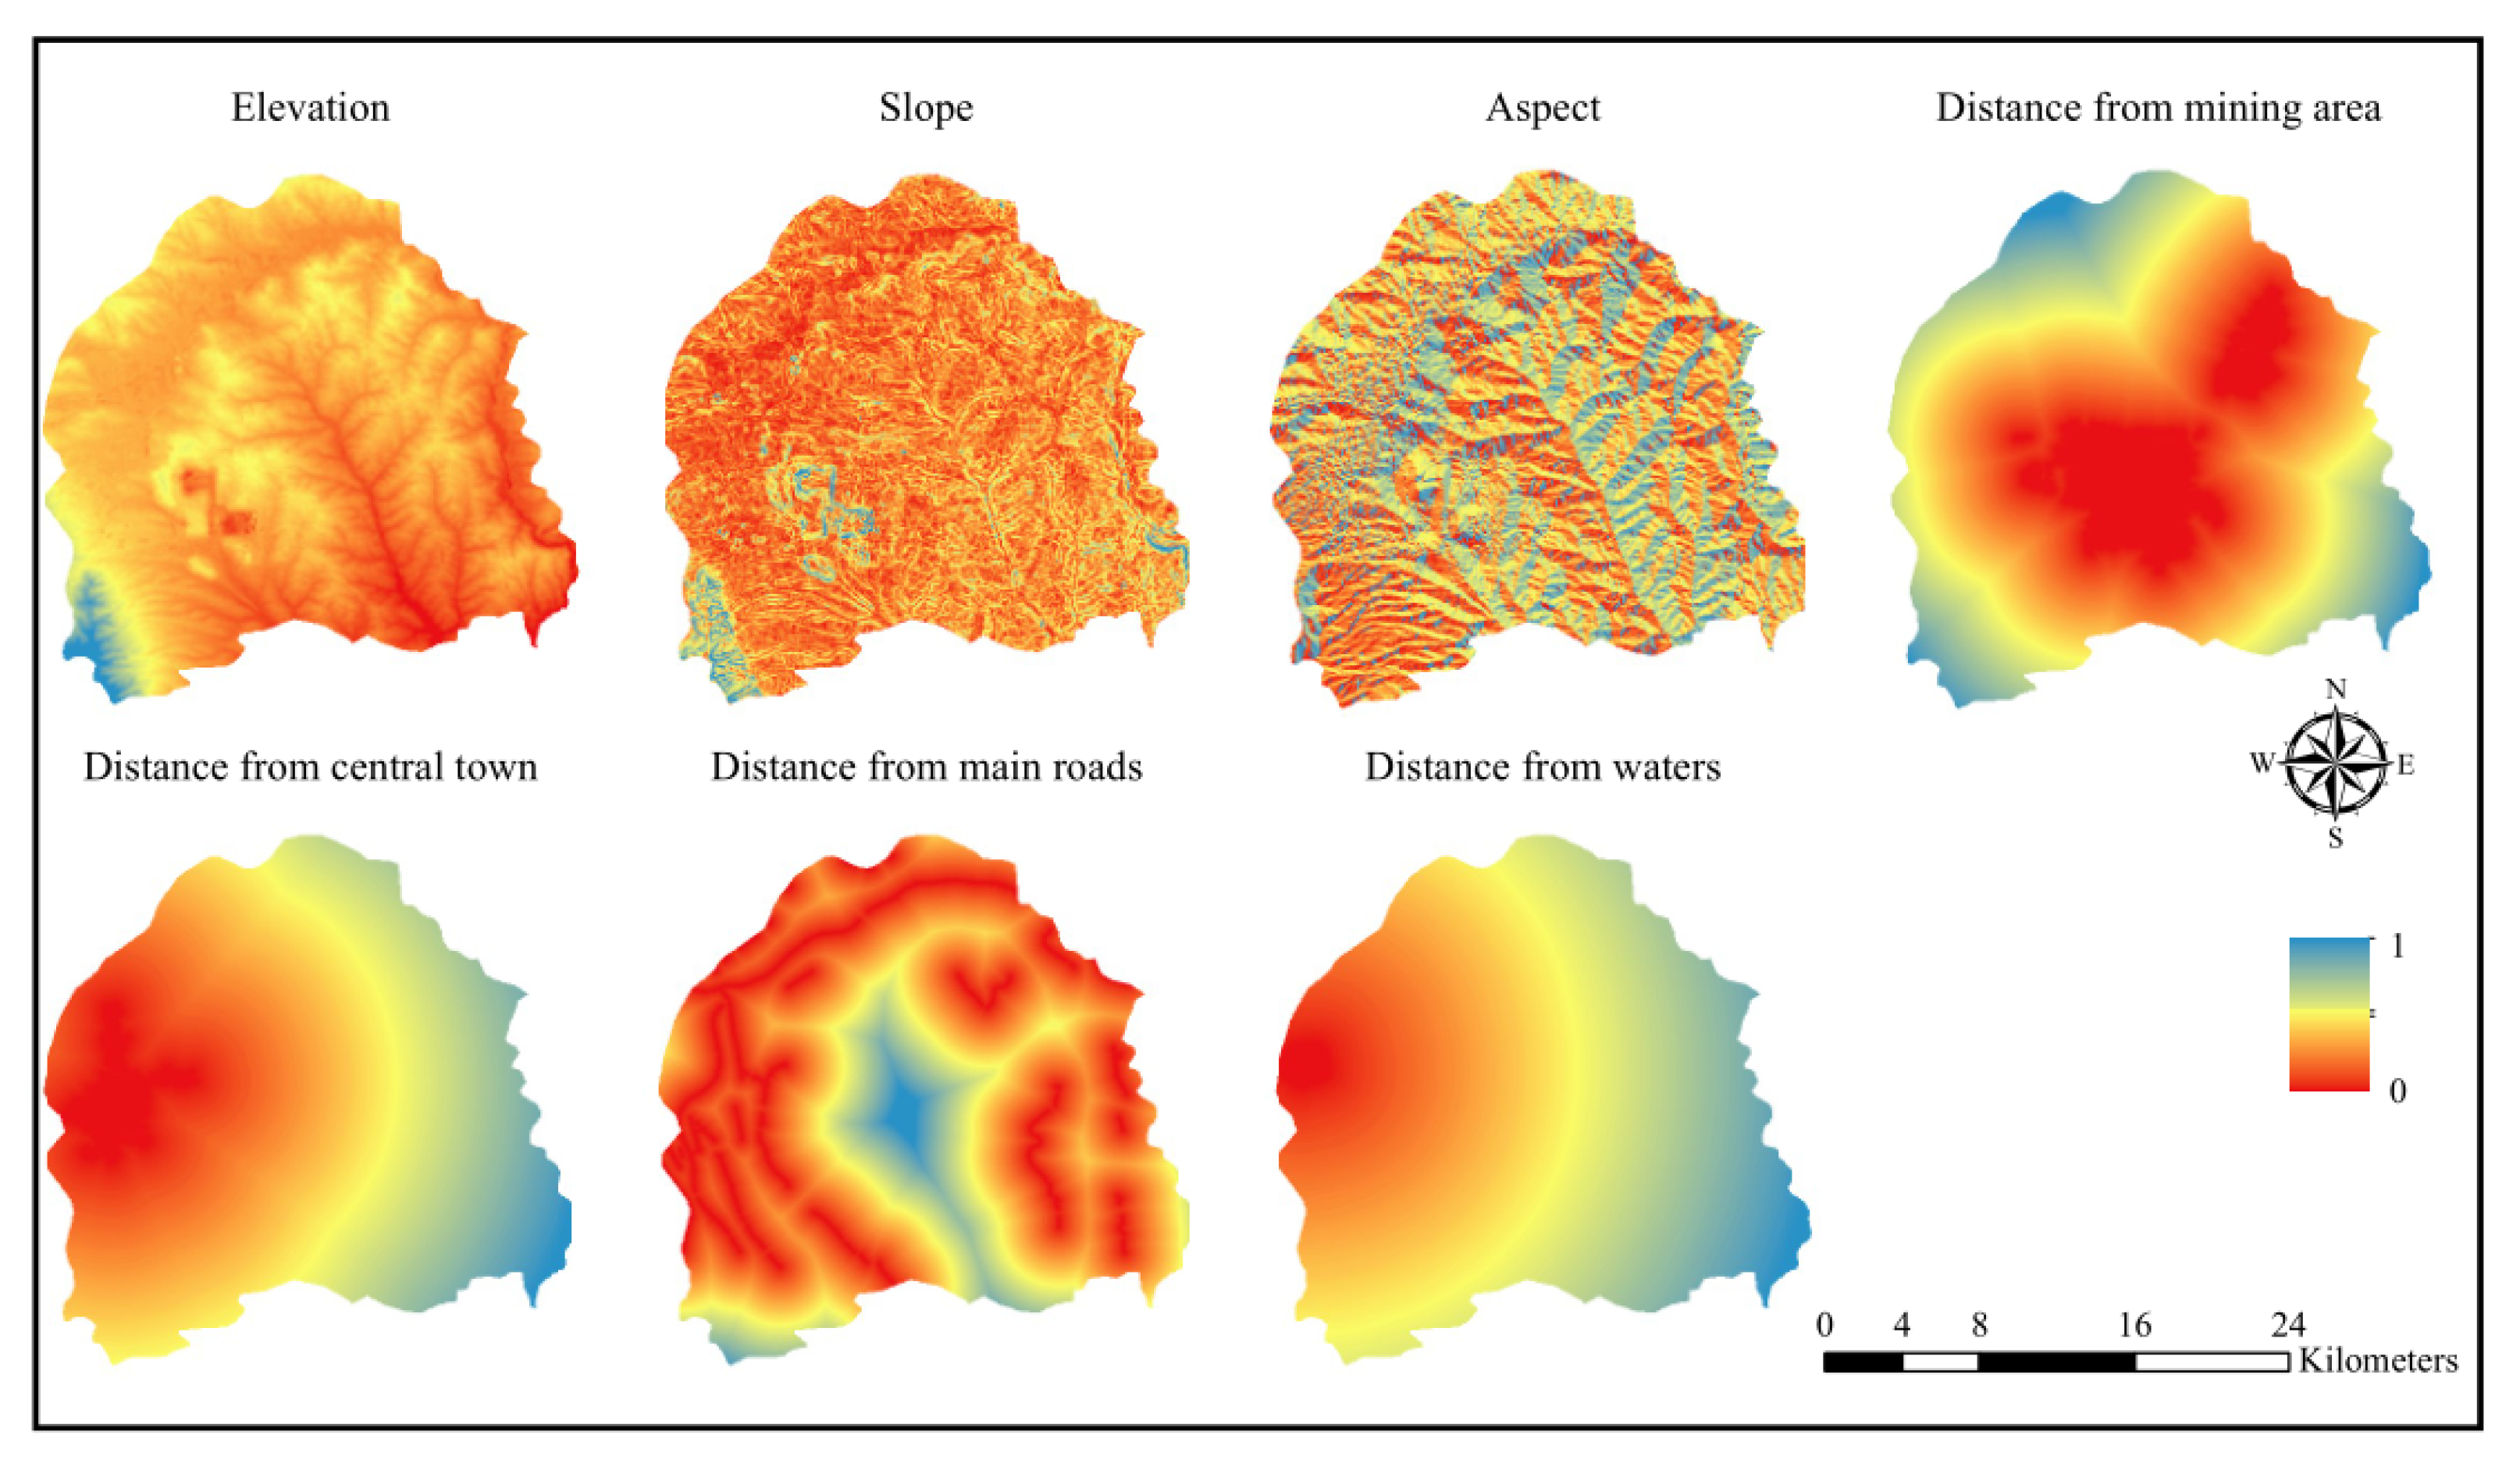
Land use and land cover change (LUCC) simulation models are effective, reproducible tools for analyzing both the causes and consequences of future landscape dynamics under various scenarios [38]. In this paper, we predicted the future ecological risk and constructed the future ecological resistance surface using a future land-use simulation (FLUS) model. The proposed model was an integration of a top-down system dynamic (SD) model and bottom-up cellular automata (CA). The SD model was used to project the land-use scenario demands under various socio-economic and natural environmental driving factors at the national/regional scale. A self-adaptive inertia and competition mechanism was developed within the CA model to process the complex competitions and interactions among the different land-use types. The specific contents of the FLUS model referred to Liu’s research [38]. In our study, the demand of all the land-use types for 2026 was projected through the configured SD model using the actual land-use pattern in 2018 and the influence of both human and natural factors during this time interval. The trained multiple CA model then simulated the local competition and interactions iteratively and generated the land-use pattern for 2026, which met the projected demand derived from the SD model. In our study, the limiting factors of the FLUS model included elevation, slope, aspect, distance from mining area, distance from central town, distance from main roads, and distance from waters (Figure 4). All of these limiting factors would affect the result of the probabilistic performance of the Artificial Neural Network (ANN). Moreover, we examined the limiting factor validity by testing the matching degree between the simulation results and the real land-use types in 2018. Comparing the real land-use types with the simulation results in 2018, the Kappa index was 0.808, which shows that the FLUS model simulated the LUCC of Jincheng in 2018 well. Thus, this model could predict further land-use patterns for 2026 in order to analyze the future ecological risk and construct an ecological resistance surface.
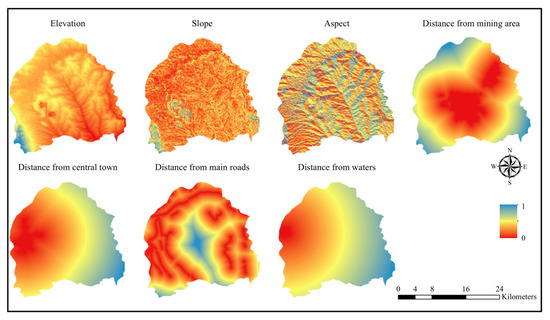
Figure 4.
Limiting factor maps used for simulating land-use type conversion.
3. Results
3.1. The Values of Potential Ecological Sources Based on Structure and Function
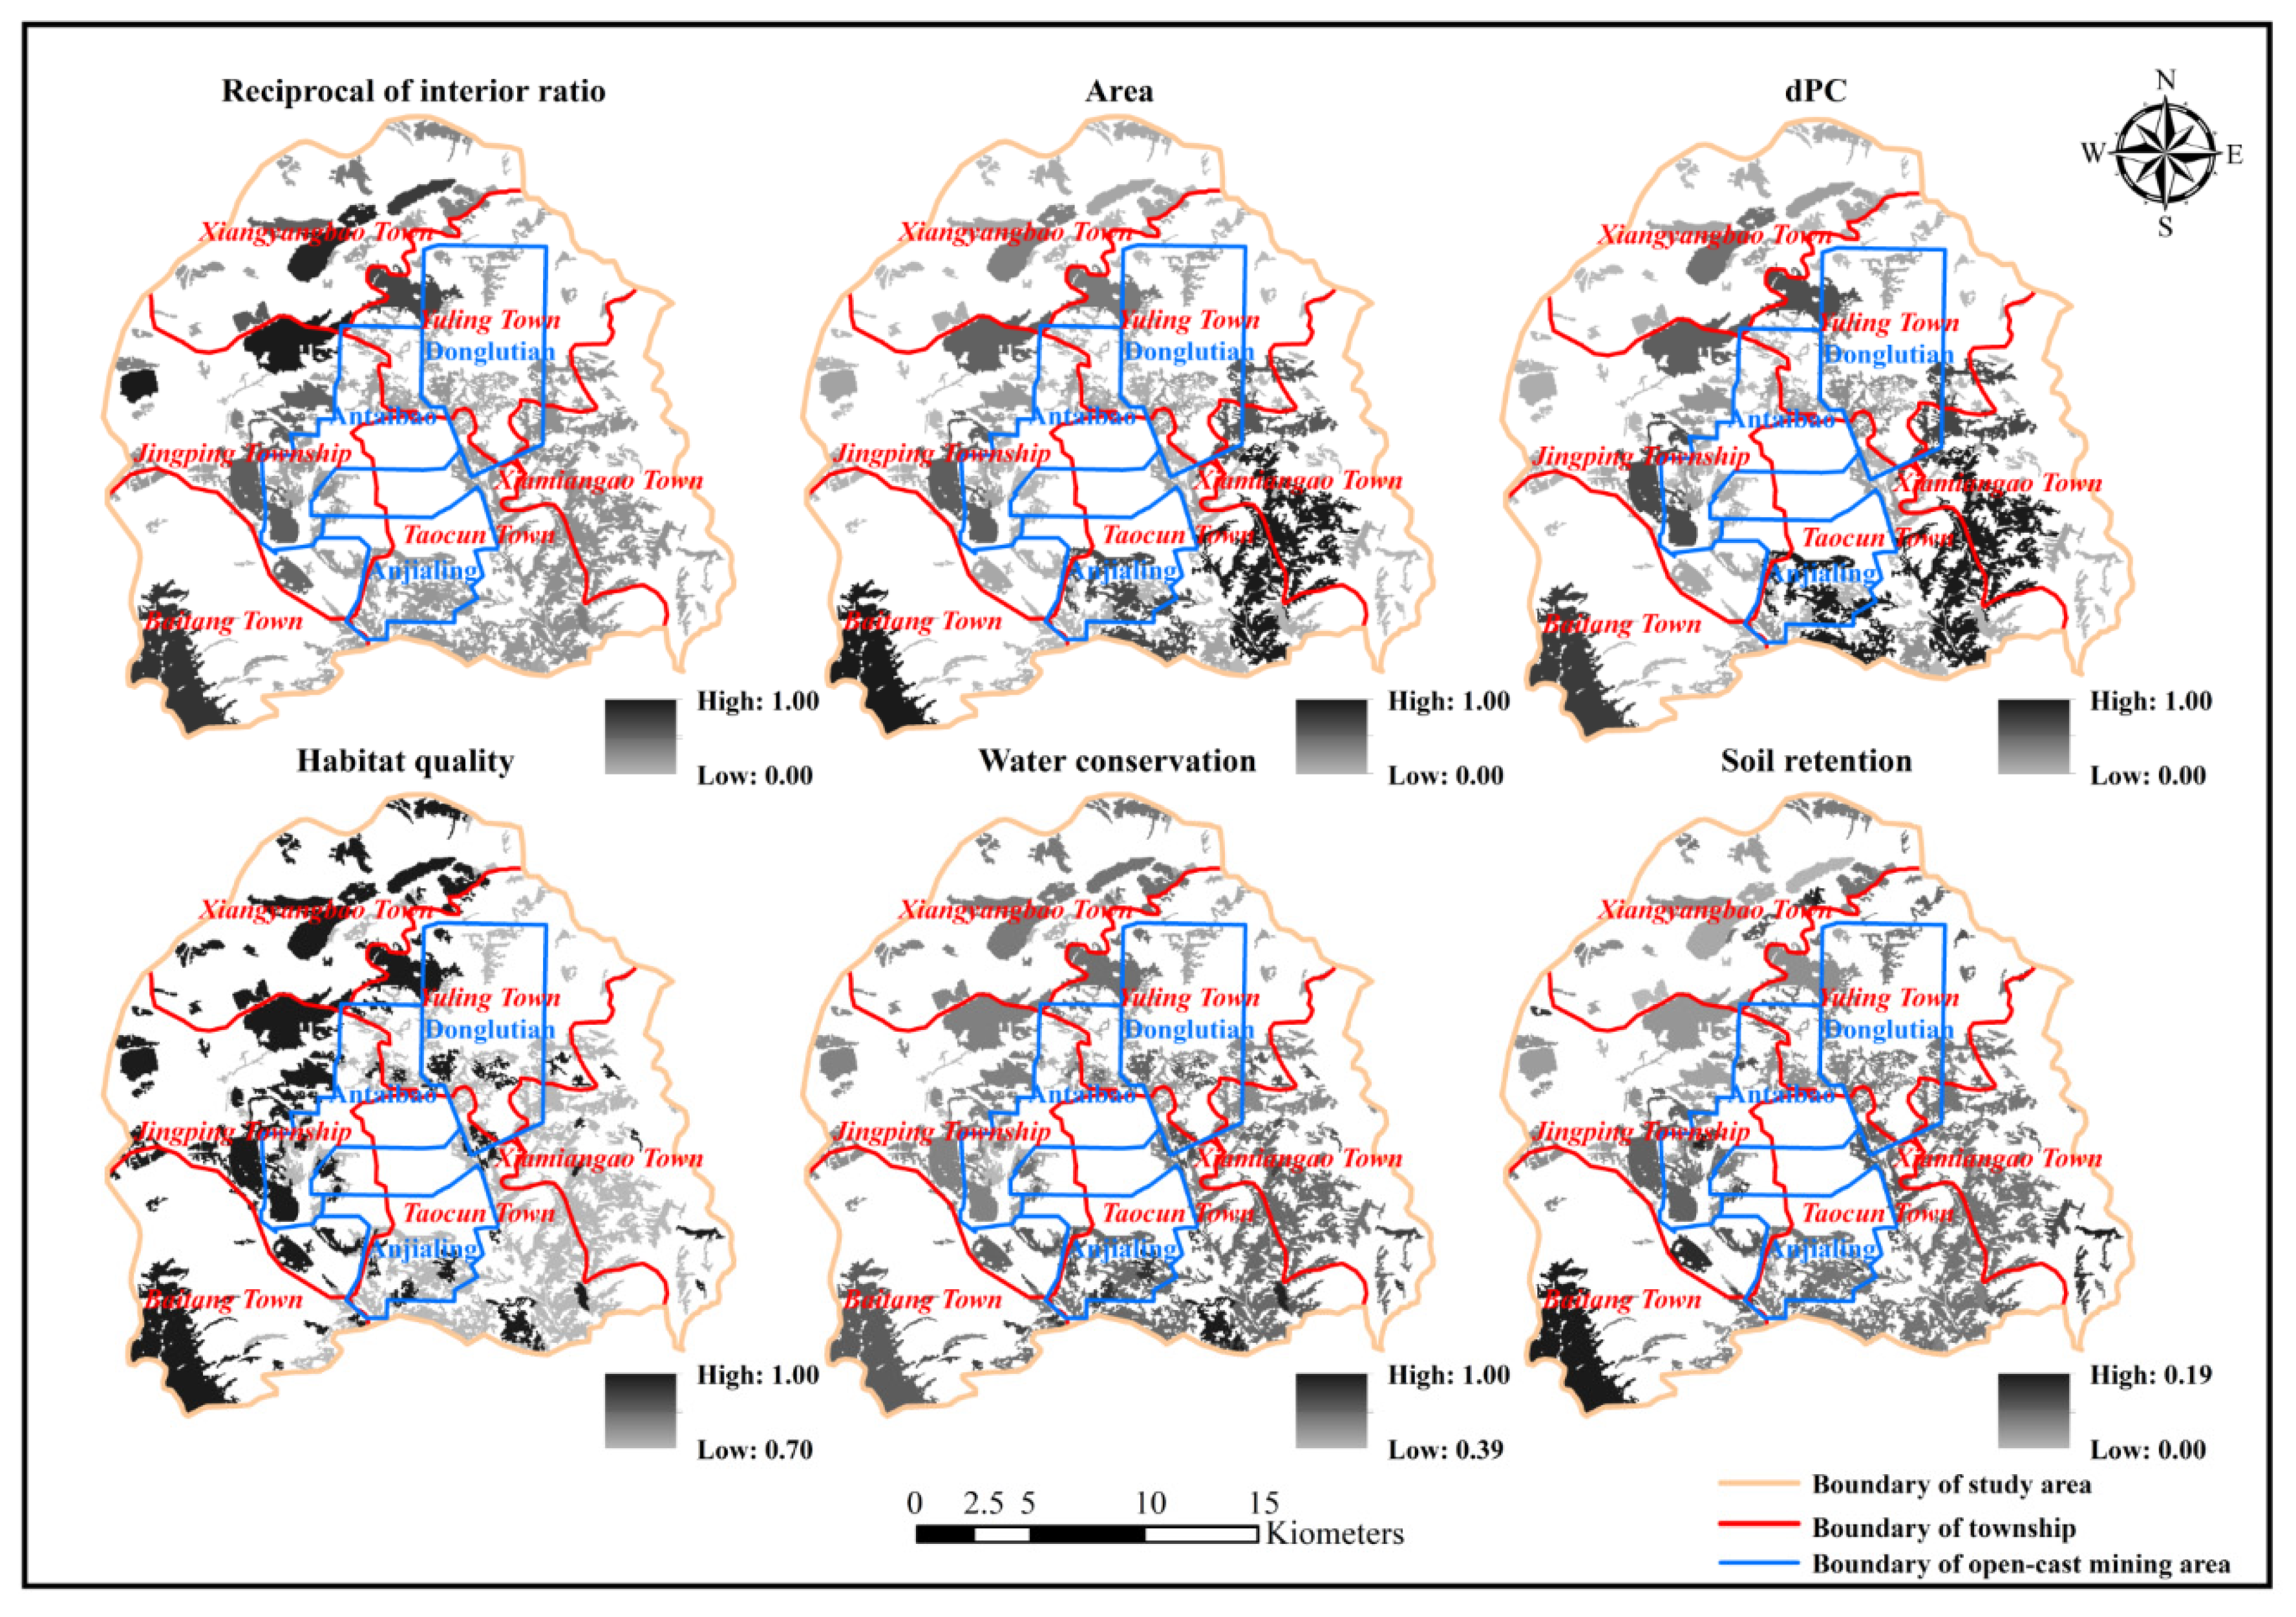
After processing the layer of land-use type data, a total of 171 potential ecological sources with an area of 147.74 km2 were identified. As shown in Figure 5, the six indicators were calculated to qualify the ecosystem structure and function of these patches. In addition, all of these indicators were considered when selecting ecological sources. From the perspective of ecosystem structure, most of the potential ecological sources had a relatively high interior ratio and a small area, indicating that these potential sources were relatively small and fragmented. This was particularly so in the eastern study area, where many small patches were widely distributed, some of which lacked a core ecological area due to large edge contact areas with the outside environment. As the spatial scale of the study area was relatively small (a total of 517.48 km2), the dPC value mainly depended on the area of each patch; a patch with large area tended to get a high dPC value. Overall, the high dPC value areas were located north of the mining boundary and south of the study area.
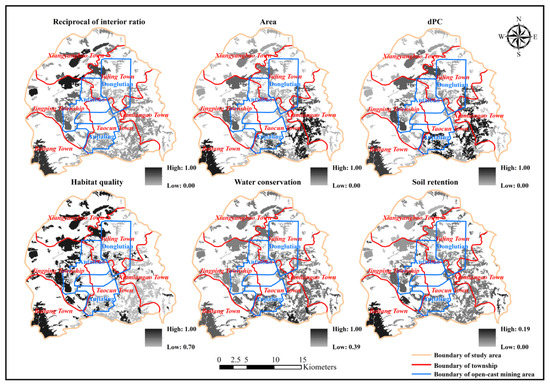
Figure 5.
Values of potential ecological sources.
The average habitat quality value in the study area was 0.87, with a maximum value of 1 and a minimum value close to 0. High values of habitat quality were mainly located in the north and southwest of the study area, which were far away from the open-cast mine and covered by abundant vegetation. In addition, reclamation lands near the southern boundary of the Antaibao mine were also important habitats. The low values of habitat quality were mainly distributed in the east and southeast of the study area, which could be attributed to relatively small core habitat areas. The average water conservation value in the study area was 0.65, with a maximum value of 1 and a minimum value close to 0.39. Overall, the study area lacked potential ecological sources with strong water conservation capacity. The range of soil retention values varied from 0 to 0.19, with an average of 0.05. The high values of soil retention were distributed in the southwest of the Baitang Township and the reclamation lands, and this phenomenon could be attributed to the high vegetation cover, little human disturbance, and strict land management in these areas.
3.2. Ecological Sources
Although the potential ecological sources were ranked by calculating the final score, there was still no consensus on how to establish the number and area of ecological sources. In order to balance the needs of human settlements for ecosystem services and regional socio-economic development, most studies construct an ESP with the least amount and the smallest area of landscape elements [15]. Similarly, this study established the optimal threshold of source number by adding and deleting ecological patches based on the ranking sequence. Ultimately, 11 potential ecological sources were established as ecological sources. The reasons were as follows: (1) these 11 ecological patches were ranked as the top 11 according to the ranking of the final score, meaning that they had the greatest potential to be ecological sources; (2) the total area of these 11 ecological patches was 74.44 km2, accounting for 50.38% of the potential ecological sources (147.74 km2), which could represent the status of most of the potential ecological sources with the minimum threshold of patch number based on ranking; and (3) to ensure that the ecological networks were across the entire study area, the ecological elements needed to be distributed in all the townships.
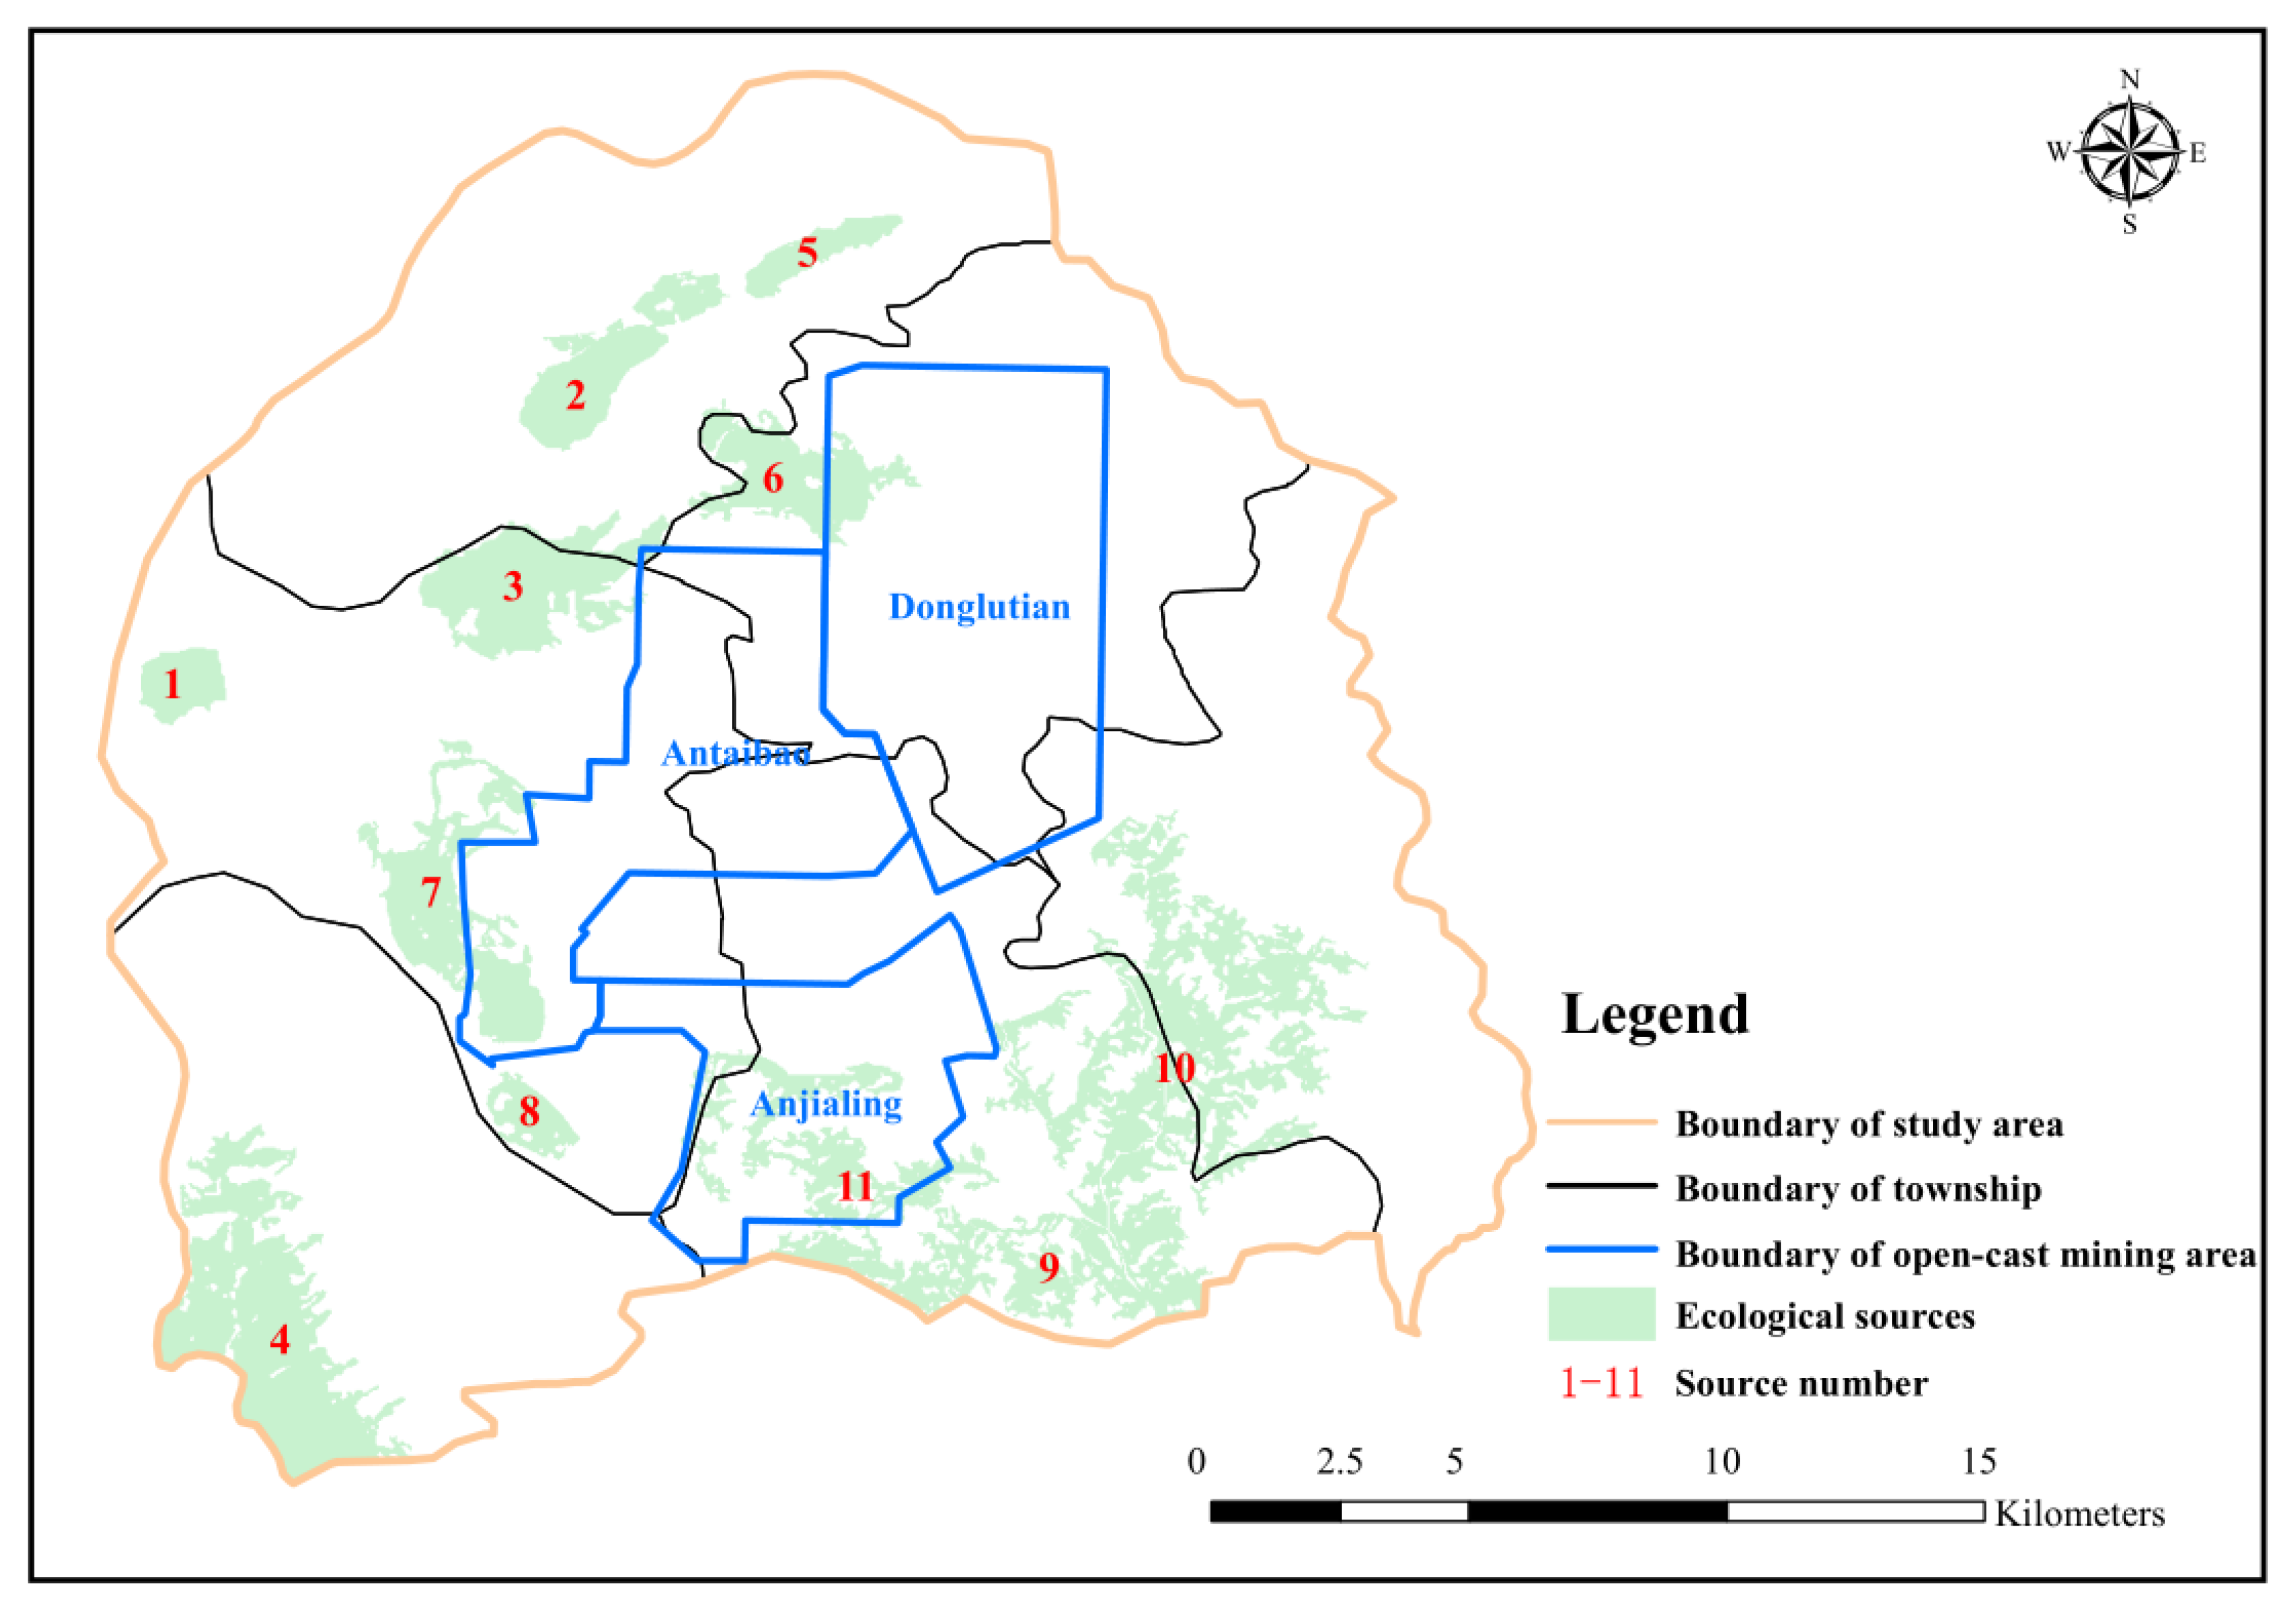
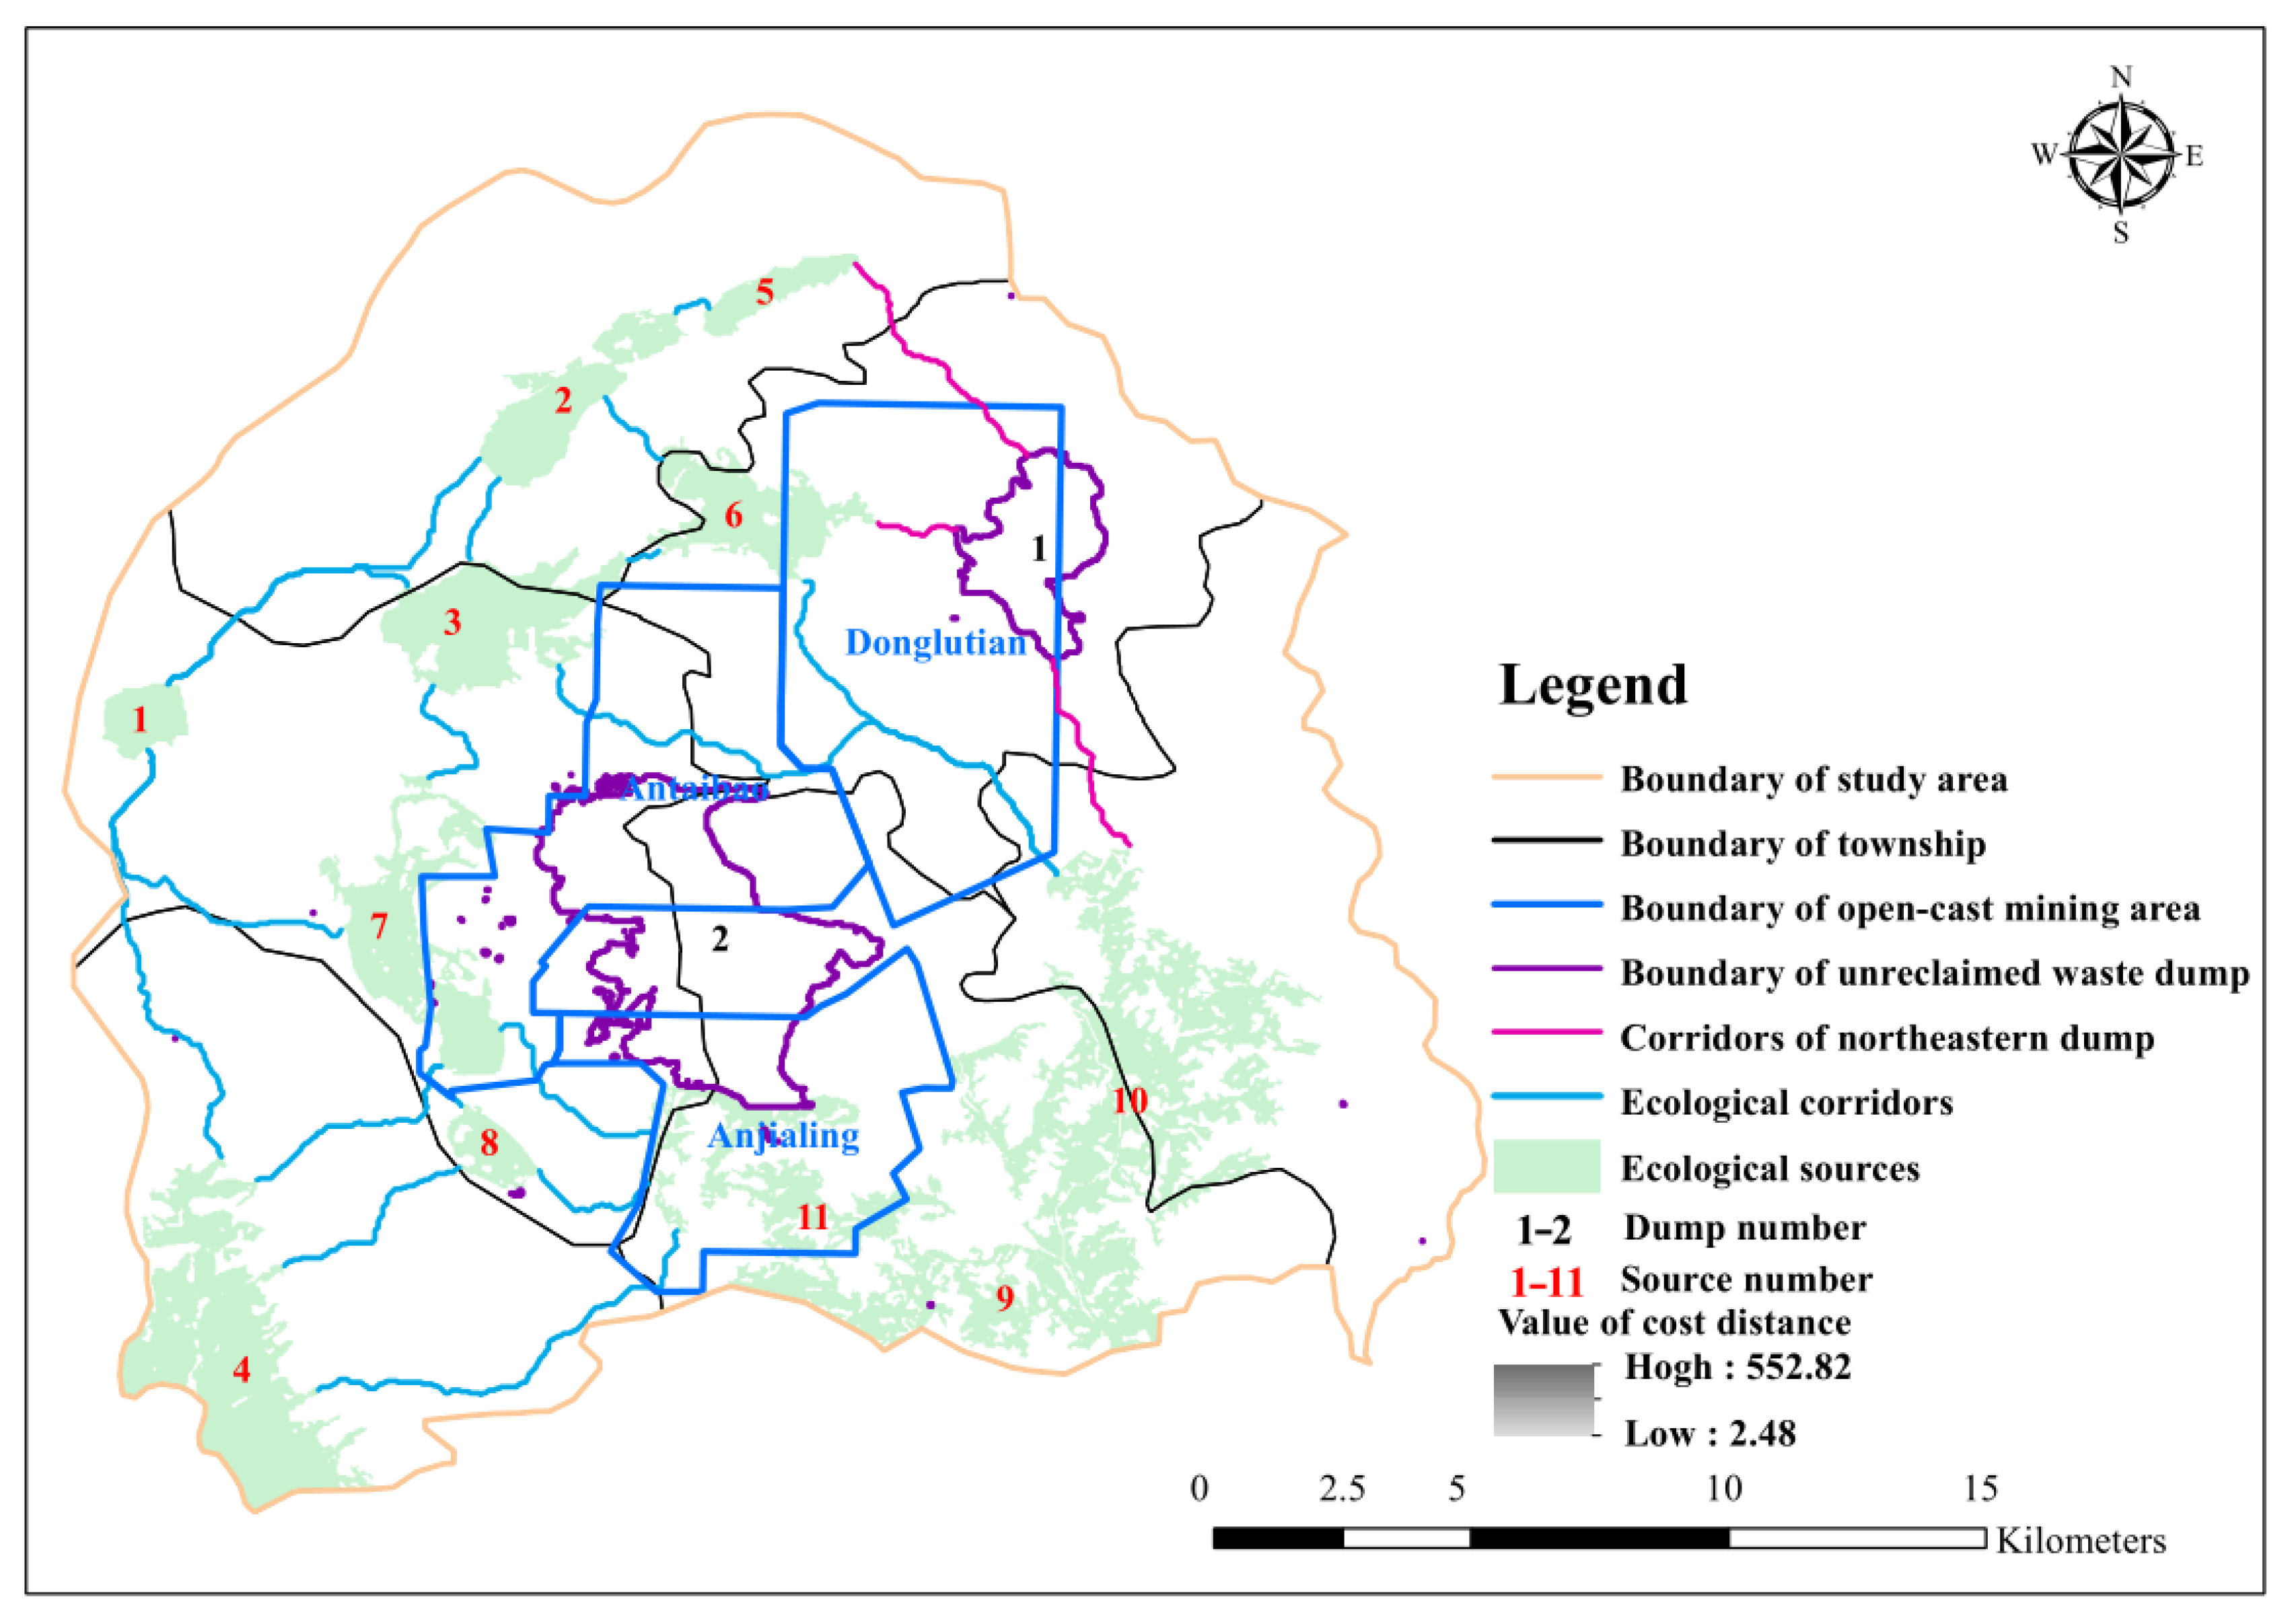
As shown in Figure 6, a total of 11 ecological sources were identified in this the study area. The largest ecological source was source 10, which was located in the southeastern study area with an area of 20.80 km2. The smallest ecological source was source 7, which was the reclamation land from a waste dump with an area of 1.52 km2. From the perspective of the administration region, the Taocun Township had the largest area of ecological sources (20.82 km2), while the Yuling Township had the smallest area of ecological sources with an area of 4.85 km2. As shown in Figure 6, the Donglutian open-cast mine was mainly located in the Yuling Township, covering most of the town. The construction of the Donglutian mine was initiated in 2009, and a large amount of ecological land was damaged in the initial construction phase. Although small-scale ecological restoration projects exist, it was difficult to form new ecological sources in a short period of time. Jingping Township had the most ecological source patches, the total area of which was 17.33 km2. Furthermore, the area of source in Baitang Township, Xiamiangao Township, and Xiangyangbao Township were 13.01 km2, 10.49 km2 and 7.94 km2, respectively.
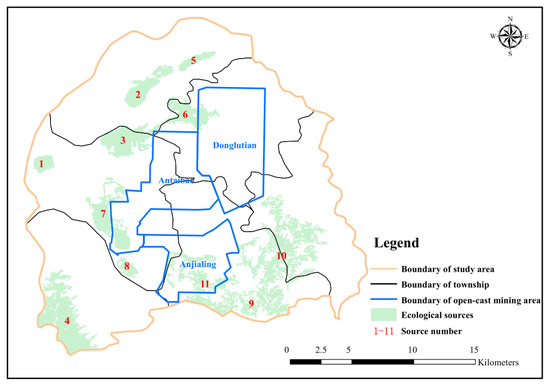
Figure 6.
Ecological sources in the study area.
In Figure 6, sources 2 to 6 and source 9 are original forest patches, while sources 7 and 8 are reclaimed waste dumps. Source 7 is mainly composed of the Antaibao mine inner dump and west dump, which have been reclaimed since 1993 and 1995, respectively. Source 8 is mainly composed of the Antaibao mine south dump, the reclamation work of which was initiated in 1997. These three are the earliest reclaimed dumps in the study area. We set a unified standard for each ecological patch when selecting the ecological sources, so the final ecological sources identified have strong ecosystem functions and a stable ecosystem structure. This also indicates that both reclamation land sources and original land sources are of great significant in the ecological security pattern. For the sake of examining the restoration effects of reclamation lands, we calculated the mean value of each indicator based on the different source types. In Table 1, we set every indicator value of the original forest source as 1.00, and the values of the reclaimed dump sources increase in the same proportion. The values of the reclaimed dump sources vary from 0.71 to 0.97, with an average of 0.83. From the perspective of ecological sources, the values of the reclaimed dumps are very close to the original forest sources, especially for ecosystem function. This phenomenon indicates that the results of ecological restoration greatly contribute to addressing practical ecological problems and eliminating ecological risks in this area. However, compared with the original forest sources, the reclaimed dump sources have relatively small areas and high interior ratios, both of which improve the edge effects of ecological patches and reduce the biomass of marginal areas. Thus, the reclaimed dump sources should expand properly and decrease the edge effects in the future.

Table 1.
Mean value of each source indicator based on different source type.
3.3. Ecological Resistance Surface
As shown in Figure 7, from the ecological resistance surface in 2018, the areas of high ecological resistance coefficient were distributed in the areas around the three open-cast mines, and the ecological resistance coefficient decreased moving away from the open-cast mines. This phenomenon was related to the high-intensity human interference activities and the land cover changes of the open-cast mines. In order to predict the future scenarios of ecological risk, we constructed ecological resistance surfaces for 2026 based on land-use change simulation. From the spatial pattern of the ecological resistance surfaces, the most obvious changes are in the three open-pit mining areas and their surrounding areas. The area east of the open-cast mining area would increase as a newly developed mining area, while the Antaibao and Anjialing mining area would decrease due to land reclamation, which would result in a reduction in ecological risk in the eastern Anjialing open-cast mining area and an increase in ecological risk around the Donglutian open-cast mining area.
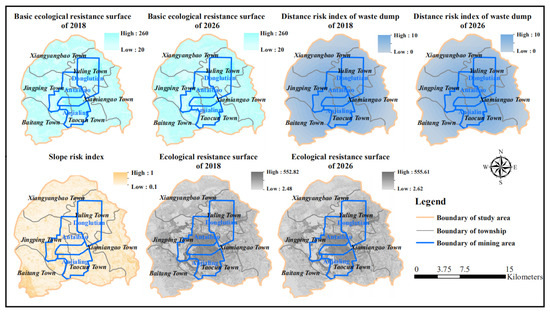
Figure 7.
Spatial patterns of ecological resistance surface.
3.4. Ecological Corridors
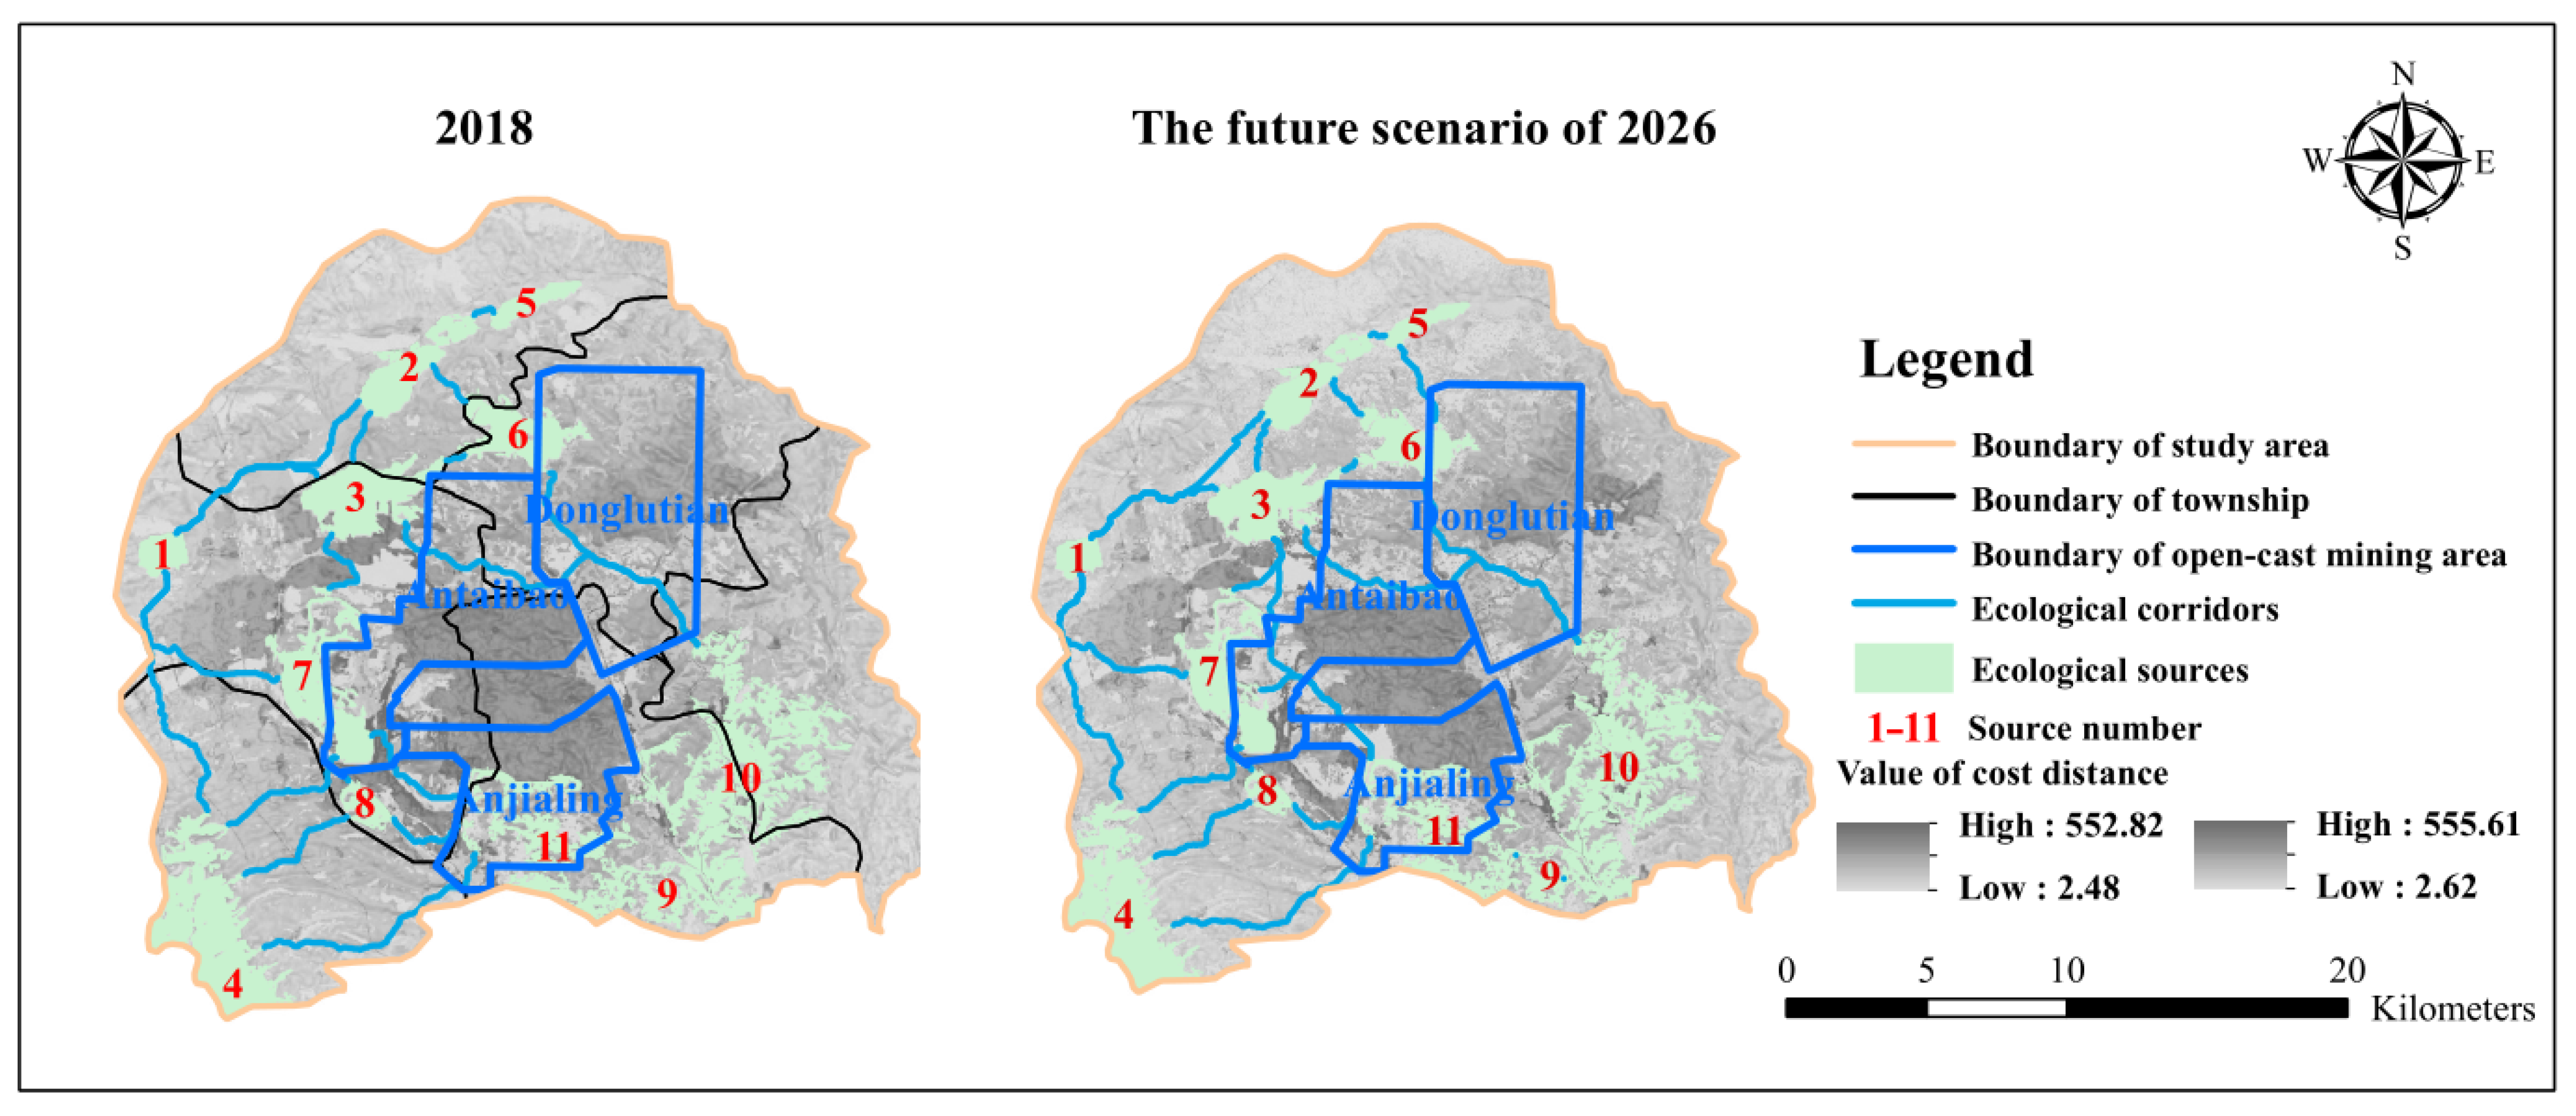
In Figure 8, a total of 17 ecological corridors with a length of 92.11 km were extracted in 2018. These corridors ranged in length from 0.70 to 13.63 km with an average of 5.41 km. From spatial distribution, the ecological corridors were mainly located in Xingyangbao Township, Jingping Township, and Baitang Township. A total of 14 ecological corridors were in these three areas, accounting for 82.35% of all the corridors in this study area. Among the three areas, Xiamiangao Township and Taocun Township had few ecological corridors, which could be attributed to the spatial distribution of ecological sources in Xiamiangao Township and Taocun Township. In these two areas, the ecological source patches were relatively close, resulting in sources 9, 10, and 11 being connected without ecological corridors. Moreover, the corridors in Yuling Township were mainly used to connect the ecological sources of other zones due to the lack of ecological sources in this town. Compared with the ecological network layer in 2018, four new ecological corridors would be added in 2026, such as the corridor connecting sources 5 and 6, 3 and 11, etc. As the number of ecological corridors increases, the landscape connectivity will be greatly improved in the study area.
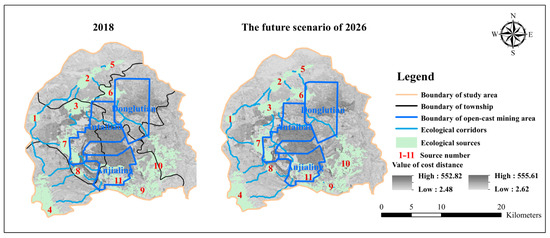
Figure 8.
Spatial patterns of ecological network.
3.5. Optimization of ESP
The land reclamation technique has been applied in vegetation restoration on a number of waste dumps in recent years, which has had a positive effect. Thus, this technique could be applied to other unreclaimed dumps to improve the entire level of ecological security. Considering a situation where a relatively complete ecological network has been constructed, newly reclaimed dumps should also be integrated into the ecological network. As shown in Figure 7, there are a total of 41 unreclaimed dumps in the study region, with an area of 28.56 km2. Dump 1 and dump 2 are the largest two waste dumps, the areas of which are 21.83 km2 and 6.56 km2, respectively. Thus, these two dumps are the main restoration objects. As per the analysis in Section 3.2, the source area of Yuling Township is far below the average value of all the towns, so it is difficult to guarantee the quality of ecosystem services in Yuling Township. Therefore, new ecological sources and corridors should be added to this area through land reclamation work. If dump 1 becomes a new ecological source in the future, it could connect sources 5, 6, and 10 with its corridors, which in turn could greatly improve the landscape connectivity of Yuling Township. Dump 2 is the largest unreclaimed dump in the study area, accounting for 76.44% of the overall unreclaimed dumps. As we can see in Figure 9, there are no corridors crossing dump 2, which means a high resistance value in this area. In addition, compared with other waste dumps, dump 2 is too large to restore at one time. If this dump is restored by stages, the first restored part should be integrated into the current ecological network if possible. The south of dump 2 connects to source 11, thus having an obvious impact on the quality of this source. In addition, the restoration of southern dump 2 could not only decrease the ecological risk of this area, but also improve the ecological stability of source 11 by adding source area. Therefore, the restoration of this area should be preferentially considered. Except for the two dumps, there are 39 small unreclaimed dumps. Some of them are close to ecological sources and corridors, threatening the ecological security of these ecological elements. These dumps also need restoring in stages according to the scale and distance to ecological elements.
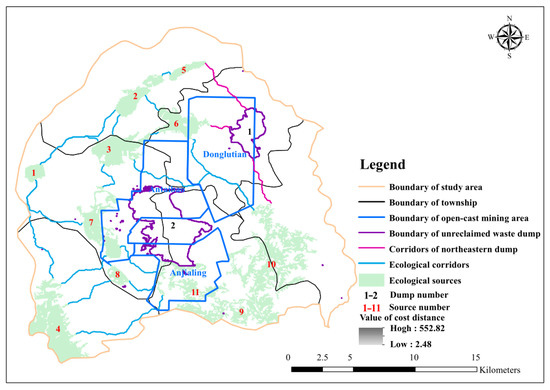
Figure 9.
The optimization of stripped area.
In addition to the unreclaimed dumps, the original landscape elements also need protecting and restoring. The ecological corridor links the ecosystem elements effectively, enhancing the connectivity and integrity of the ecosystem, and improving the regional ecological security and ecological carrying capacity [14,39,40]. To better promote the connectivity function of ecological corridors, human activities should be decreased in the areas near these corridors. In this study, we overlayed the layers of land-use–type data and corridors to identify the main corridor disturbance factors. The results show that many intersections of roads and corridors exist. In other words, despite being very convenient for humans, these roads hinder the migration and energy of species at the same time. Furthermore, the intersections become the barrier points of ecological corridors. Thus, we need to take the necessary measures to improve the current status, such as building underground passages for migrating animals, planting vegetation along roadways, and so on. Moreover, some corridors with a high resistance value could be improved by adding “stepping stones”, which can play a “springboard” role in species’ migration.
Compared with the landscape connectivity of ecological corridors, the restoration of original landscape sources should focus on the stability of the structure. Some relatively fragmented sources exist, such as sources 9, 10, and 11. These sources could be improved by removing inner artificial disturbance patches. In addition, the edges of these sources should be strictly protected to decrease the edge effect and human disturbance. Furthermore, these original landscape sources need to strengthen the supply capacity of ecosystem services. We can attempt to enhance the biological diversity of the sources by bringing in the successful configuration modes of artificial vegetation in reclaimed dumps. Moreover, serious soil erosion can be caused by the largely undulated terrain, large slope, and greater intensive runoff, which can take away the nutrient-rich topsoil, resulting in a decline in soil productivity and biodiversity. Thus, it is also important to take effective measures, such as terracing combined with planting of different species to reduce soil erosion.
4. Discussion
To promote the ecological restoration of the mining area, this study aims to construct an ESP with the least amount and the smallest area of landscape elements, the core of which is the selection of ecological sources [15]. Comprehensively considering the values of the interior ratio, area, dPC, habitat quality, water conservation, and soil retention, a total of 11 ecological sources were extracted (see Figure 5). These ecological sources contain many important ecological function zones in the study area. Source 1 is the Daliang Reservoir, which is the largest water area in the study region. According to the Land Use Planning of Pinglu District (2006–2020), the Daliang Reservoir is the only ecological redline zone in this area, indicating that it will be strictly protected by the local government. Thus, it plays an important role in water conservation for the study area. In addition, the remaining ecological sources are essential for ecological security in this area. Among sources 2 to 11, the areas of source 10 and source 11 are 20.80 km2 and 9.13 km2, respectively, and are the two largest grassland patches in the study area. Generally speaking, the total amount of energy and mineral nutrients in patches is proportional to their area, and the species diversity and productivity level also increase with an increase in area [39], meaning that two ecological sources present better landscape connectivity and ecological service functions compared with non-ecological sources. According to the vegetation coverage map of the Pingshuo mining area [41], source 2 to source 9 are forest patches with high vegetation coverage, thus they can be seen as the most important ecological land in this area. Through superposition analyses of the layers of ecological redline and vegetation, it was found that it essentially covers the core areas of the ecological redline zone, ecological function zone, etc. Thus, the result obtained is more reasonable and accurate, and not only provides important ecosystem services, but also enhances the internal landscape connectivity.
The critical links of land reclamation and ecological restoration in Pingshuo include geomorphic reshaping, soil reconstruction, and vegetation restoration, among which soil reconstruction is the core phase [42]. These phases of reclamation should be viewed not as a simple combination of separated steps, but as a systematic process [43]. In reclamation practices, geomorphic reshaping is a critical step of high-quality reclamation, as it is the foundation for all the following reclamation phases. The open-cast mining caused serious disturbances on the original land, which in turn formed a waste dump with an unstable base, inhomogeneous sedimentation, and water loss. Thus, the main purposes of geomorphic reshaping is to construct a hydrophobic base and water storage landform. In addition, in order to reduce the inhomogeneous sedimentation of the waste dump, rock and soil were discharged and mixed through stacking and compacting layer by layer [44]. The process of soil reconstruction focuses on decreasing negative effects by limiting factors, and one major target is to restore the soil quality and productivity of the reclaimed mine. The soil in Pingshuo is mainly sandy clay loam, which suits most crops grown in northern China. However, a number of defects still exist after geomorphic reshaping, such as higher apparent density, lower enzymatic activity, and soil nitrogen loss. Thus, topsoil stripping technology was widely used in this area, and large machinery and equipment were prohibited in landform construction. These measures greatly improved the quality of the landform, the apparent density of which reduced to 1.4 g/cm3 from 1.8 g/cm3 [44].
The original vegetation in the waste dump was destroyed after open-cast working, and it is difficult to restore these plants through natural recovery. Thus, the first step of vegetation restoration is to improve soil condition with pioneer plants. Meanwhile, adaptive plants should be selected to enhance the stability of the artificial ecosystem. Considering the characteristics of reconstructing soil and the soil erosion risks of waste dumps, the pioneer plants should have strong nitrogen-fixation abilities and soil retention. In addition, these pioneer plants need to adapt to a severe climate and environment, such as drought, poor soil, and salinization. Finally, arbors such as Robinia pseudoacacia and Pinus tabuliformis, and herbs such as Poa sphondylodes, Calamagrostis epigeios, Elymus dahuricus, Medicago sativa, and Roegneria kamoj were selected as the pioneer plants. From the perspective of artificial vegetation configuration, Robinia pseudoacacia, Pinus tabulaef ormis and Caragana korshinskii; Robinia pseudoacacia and Pinus tabulaef ormis; Robinia pseudoacacia and Hippophae rhamnoides; and a single Robinia pseudoacacia are the successfully deployed models of artificial vegetation in this study area [45]. The mining area has more than 60 kinds of adaptive plants. The herbs mainly comprise Astragalus adsurgens, Awnless brome, Medicago sativa, white sweet clover, yellow sweet clover, and sainfoin. The major arbuscles are Caragana korshinskii (seed), Elaeagnus angustifolia, Hippophae rhamnoides, Salix psammophila, Amorpha fruticose, and Rhus typhina. The arbors are mainly Chinese pine, Populus xiaohei, Populusopera, Populus bolleana, Robinia pseudoacacia, Salix babylonica, Salix matsudana, and ulmus pumila [44].
5. Conclusions
In the study area, a total of 11 ecological sources and 17 corridors were identified by evaluating the ecosystem function and structure, which are the main elements of an ecological network. The area of sources and the length of corridors were 147.74 km2 and 92.11 km, respectively. Among the 11 ecological sources, sources 7 and 8 were composed of reclaimed dumps, which means that both reclamation land sources and original land sources are of great significant in the ecological security pattern. Compared with the original forest sources, the reclamation land sources have relatively small areas and high interior ratio values, which has an adverse impact on the stability of the ecosystem structure. Therefore, it is important to adjust the structure of the reclamation land sources and reduce the edge effects as much as possible. Overall, the land reclamation work in Pingshuo greatly promotes ecological restoration, which improves the supply capacities of ecosystem services and the landscape connectivity of ecological networks with reclamation land sources. It also indicates that the current reclamation mode can be applied to other unreclaimed dumps to support further restoration of the study area. The current largest unreclaimed dumps are dump 1 and dump 2, accounting for 22.91% and 76.44% of the total area of unreclaimed dumps, respectively. Thus, the reclamation of these two dumps is vital to the future ESP. From an ecological network perspective, we suggest that dump 1 should be restored as a new ecological source, which can link sources 5, 6, and 10 with three new corridors. Furthermore, the south area of dump 2 connects to source 11, thus it should be preferentially restored in future restoration work. This study can effectively serve as a significant reference to support improvements in mineral resource planning and ecological planning of territorial space.
Author Contributions
Conceptualization, Y.C. and K.Y.; methodology, K.Y. and S.L. (Shengpeng Li); formal analysis, W.Z.; data curation, S.W.; writing—original draft preparation, K.Y. and S.W.; writing—review & editing, K.Y. and S.L. (Shihan Liu); visualization, K.Y.; supervision, Y.C. and Z.B. All authors have read and agreed to the published version of the manuscript.
Funding
This work was funded by the National Natural Science Foundation of China (U1810107 and 41701607) and the Fundamental Research Funds for the Central Universities (2-9-2018-025 and 2-9-2019-307).
Data Availability Statement
Not applicable.
Acknowledgments
Thanks to Yining Zhuang and Huihui Wang for technical support.
Conflicts of Interest
The authors declare no conflict of interest.
References
- Asr, E.T.; Kakaie, R.; Ataei, M.; Mohammadi, M.R.T. A review of studies on sustainable development in mining life cycle. J. Clean. Prod. 2019, 229, 213–231. [Google Scholar] [CrossRef]
- Su, W.; Liu, D.; Chang, Q. Urban land use optimization in mining area from the perspective of maximizing ecosystem services. In Proceedings of the 3rd International Conference on Energy Engineering and Environmental Protection (EEEP), Sanya, China, 19–21 November 2019. [Google Scholar]
- Xia, K.; Chen, C.; Zheng, Y.; Zhang, H.; Liu, X.; Deng, Y.; Yang, K. Engineering geology and ground collapse mechanism in the Chengchao Iron-ore Mine in China. Eng. Geol. 2019, 249, 129–147. [Google Scholar] [CrossRef]
- Yu, K. Landscape ecological security pattern in biological conservation. Acta Ecol. Sin. 1999, 19, 10–17. [Google Scholar]
- Peng, J.; Yang, Y.; Liu, Y.; Hu, Y.N.; Du, Y.; Meersmans, J.; Qiu, S. Linking ecosystem services and circuit theory to identify ecological security patterns. Sci. Total Environ. 2018, 644, 781–790. [Google Scholar] [CrossRef] [Green Version]
- Su, Y.; Chen, X.; Liao, J.; Zhang, H.; Wang, C.; Ye, Y.; Wang, Y. Modeling the optimal ecological security pattern for guiding the urban constructed land expansions. Urban For. Urban Green. 2016, 19, 35–46. [Google Scholar] [CrossRef]
- Peng, J.; Pan, Y.; Liu, Y.; Zhao, H.; Wang, Y. Linking ecological degradation risk to identify ecological security patterns in a rapidly urbanizing landscape. Habitat Int. 2018, 71, 110–124. [Google Scholar] [CrossRef]
- Li, S.; Xiao, W.; Zhao, Y.; Lv, X. Incorporating ecological risk index in the multi-process MCRE model to optimize the ecological security pattern in a semi-arid area with intensive coal mining: A case study in northern China. J. Clean. Prod. 2020, 247, 119143. [Google Scholar] [CrossRef]
- Kong, F.; Yin, H.; Nakagoshi, N.; Zong, Y. Urban green space network development for biodiversity conservation: Identification based on graph theory and gravity modeling. Landsc. Urban Plan. 2010, 95, 16–27. [Google Scholar] [CrossRef]
- Beier, P.; Majka, D.R.; Spencer, W.D. Forks in the road: Choices in procedures for designing wildland linkages. Conserv. Biol. 2008, 22, 836–851. [Google Scholar] [CrossRef]
- Pickett, S.T.A.; Cadenasso, M.L.; Rosi-Marshall, E.J.; Belt, K.T.; Groffman, P.M.; Grove, J.M.; Irwin, E.G.; Kaushal, S.S.; LaDeau, S.L.; Nilon, C.H.; et al. Dynamic heterogeneity: A framework to promote ecological integration and hypothesis generation in urban systems. Urban Ecosyst. 2017, 20, 1–14. [Google Scholar] [CrossRef] [Green Version]
- Wang, C.; Yu, C.; Chen, T.; Feng, Z.; Hu, Y.; Wu, K. Can the establishment of ecological security patterns improve ecological protection? An example of Nanchang, China. Sci. Total Environ. 2020, 740, 140051. [Google Scholar] [CrossRef]
- Li, S.; Zhao, Y.; Xiao, W.; Yue, W.; Wu, T. Optimizing ecological security pattern in the coal resource-based city: A case study in Shuozhou City, China. Ecol. Indic. 2021, 130, 108026. [Google Scholar] [CrossRef]
- Zhang, L.; Peng, J.; Liu, Y.; Wu, J. Coupling ecosystem services supply and human ecological demand to identify landscape ecological security pattern: A case study in Beijing-Tianjin-Hebei region, China. Urban Ecosyst. 2017, 20, 701–714. [Google Scholar] [CrossRef]
- Fu, Y.; Shi, X.; He, J.; Yuan, Y.; Qu, L. Identification and optimization strategy of county ecological security pattern: A case study in the Loess Plateau, China. Ecol. Indic. 2020, 112, 106030. [Google Scholar] [CrossRef]
- Yang, K.; Cao, Y.; Feng, Z.; Geng, B.; Feng, Y.; Wang, S. Research Progress of Ecological Security Pattern Construction Based on Minimum Cumulative Resistance Model. J. Ecol. Rural Environ. 2021, 37, 555–565. [Google Scholar]
- Rabinowitz, A.; Zeller, K.A. A range-wide model of landscape connectivity and conservation for the jaguar, Panthera onca. Biol. Conserv. 2010, 143, 939–945. [Google Scholar] [CrossRef]
- Hepcan, C.C.; Ozkan, M.B. Establishing ecological networks for habitat conservation in the case of CeAYme-Urla Peninsula, Turkey. Environ. Monit. Assess. 2011, 174, 157–170. [Google Scholar] [CrossRef]
- Cao, Y.; Bai, Z.; Zhou, W.; Zhang, X. Characteristic analysis and pattern evolution on landscape types in typical compound area of mine agriculture urban in Shanxi Province, China. Environ. Earth Sci. 2016, 75, 585. [Google Scholar] [CrossRef]
- Wu, J.; Zhu, Q.; Qiao, N.; Wang, Z.; Sha, W.; Luo, K.; Wang, H.; Feng, Z. Ecological risk assessment of coal mine area based on “source-sink” landscape theory e A case study of Pingshuo mining area. J. Clean. Prod. 2021, 295, 126371. [Google Scholar] [CrossRef]
- Wang, H.; Li, H.; Xie, M.; Xu, M.; Li, S.; Bai, Z. Construction of ecological security pattern for systematic restoration of industrial and mining land in resource-based cities. J. Nat. Resour. 2020, 35, 162–173. [Google Scholar]
- Zhou, W.; Yang, K.; Bai, Z.; Cheng, H.; Liu, F. The development of topsoil properties under different reclaimed land uses in the Pingshuo opencast coalmine of Loess Plateau of China. Ecol. Eng. 2017, 100, 237–245. [Google Scholar] [CrossRef]
- Yang, B.; Bai, Z.; Cao, Y.; Xie, F.; Zhang, J.; Wang, Y. Dynamic Changes in Carbon Sequestration from Opencast Mining Activities and Land Reclamation in China’s Loess Plateau. Sustainability 2019, 11, 1473. [Google Scholar] [CrossRef] [Green Version]
- Zhao, C.; Wang, C.; Yan, Y.; Shan, P.; Li, J.; Chen, J. Ecological Security Patterns Assessment of Liao River Basin. Sustainability 2018, 10, 2401. [Google Scholar] [CrossRef] [Green Version]
- Peng, J.; Ma, J.; Du, Y.; Zhang, L.; Hu, X. Ecological suitability evaluation for mountainous area development based on conceptual model of landscape structure, function, and dynamics. Ecol. Indic. 2016, 61, 500–511. [Google Scholar] [CrossRef]
- Dun, Y.; Wang, J.; Bai, Z.; Chen, X.; Guo, Y. Changes in Pingshuo opencast mining area ecosystem service values based on grey prediction modeling. Resour. Sci. 2015, 37, 494–502. [Google Scholar]
- Yang, Z.; Li, W.; Pei, Y.; Qiao, W.; Wu, Y. Classification of the type of eco-geological environment of a coal mine district: A case study of an ecologically fragile region in Western China. J. Clean. Prod. 2018, 174, 1513–1526. [Google Scholar] [CrossRef]
- Raatikainen, K.J.; Olden, A.; Kayhko, N.; Monkkonen, M.; Halme, P. Contemporary spatial and environmental factors determine vascular plant species richness on highly fragmented meadows in Central Finland. Landsc. Ecol. 2018, 33, 2169–2187. [Google Scholar] [CrossRef] [Green Version]
- Saura, S.; Pascual-Hortal, L. A new habitat availability index to integrate connectivity in landscape conservation planning: Comparison with existing indices and application to a case study. Landsc. Urban Plan. 2007, 83, 91–103. [Google Scholar] [CrossRef]
- Hall, L.S.; Krausman, P.R.; Morrison, M.L. The habitat concept and a plea for standard terminology. Wildl. Soc. Bull. 1997, 25, 173–182. [Google Scholar]
- Maes, J.; Paracchini, M.L.; Zulian, G.; Dunbar, M.B.; Alkemade, R. Synergies and trade-offs between ecosystem service supply, biodiversity, and habitat conservation status in Europe. Biol. Conserv. 2012, 155, 1–12. [Google Scholar] [CrossRef]
- Moreira, M.; Fonseca, C.; Vergilio, M.; Calado, H.; Gil, A. Spatial assessment assessment of habitat conservation status in a Macaronesian island based on the InVEST model: A case study of Pico Island (Azores, Portugal). Land Use Policy 2018, 78, 637–649. [Google Scholar] [CrossRef]
- Zhu, C.; Zhang, X.; Zhou, M.; He, S.; Gan, M.; Yang, L.; Wang, K. Impacts of urbanization and landscape pattern on habitat quality using OLS and GWR models in Hangzhou, China. Ecol. Indic. 2020, 117, 106654. [Google Scholar] [CrossRef]
- Fu, B.; Chen, L. Landscape diversity types and their ecological significance. Acta Ecol. Sin. 1996, 5, 454–462. [Google Scholar]
- Peng, J.; Hu, X.; Qiu, S.; Hu, Y.N.; Meersmans, J.; Liu, Y. Multifunctional landscapes identification and associated development zoning in mountainous area. Sci. Total Environ. 2019, 660, 765–775. [Google Scholar] [CrossRef] [Green Version]
- Wang, J.; Guo, L.; Bai, Z.; Yang, R.; Zhang, M. Succession law of reclaimed soil and vegetation on opencast coal mine dump of loess area. Trans. Chin. Soc. Agric. Eng. 2013, 29, 223–232. [Google Scholar]
- Sun, Q.; Bai, Z.; Cao, Y.; Xie, M.; Hu, X.; Jiang, Y.; Lu, Y. Ecological risk assessment of land destruction in large open-pit mine. Trans. Chin. Soc. Agric. Eng. 2015, 31, 278–288. [Google Scholar]
- Liu, X.; Liang, X.; Li, X.; Xu, X.; Ou, J.; Chen, Y.; Li, S.; Wang, S.; Pei, F. A future land use simulation model (FLUS) for simulating multiple land use scenarios by coupling human and natural effects. Landsc. Urban Plan. 2017, 168, 94–116. [Google Scholar] [CrossRef]
- Dakos, V.; Soler-Toscano, F. Measuring complexity to infer changes in the dynamics of ecological systems under stress. Ecol. Complex. 2017, 32, 144–155. [Google Scholar] [CrossRef]
- Gong, J.-Z.; Liu, Y.-S.; Xia, B.-C.; Zhao, G.-W. Urban ecological security assessment and forecasting, based on a cellular automata model: A case study of Guangzhou, China. Ecol. Model. 2009, 220, 3612–3620. [Google Scholar] [CrossRef]
- Yang, G.; Cao, Y.; Zhuang, Y.; Zhang, Z.; Bai, Z. Study on ecosystem resilience of large-scale open pit mining area in north Shanxi. J. Agric. Resour. Environ. 2020, 37, 562–573. [Google Scholar]
- Hu, Z.; Wei, Z.; Qin, P. Concept ofand methods for soil reconstruction in mined land research. Soils 2005, 37, 8–12. [Google Scholar]
- Feng, Y.; Wang, J.; Bai, Z.; Reading, L. Effects of surface coal mining and land reclamation on soil properties: A review. Earth-Sci. Rev. 2019, 191, 12–25. [Google Scholar] [CrossRef]
- Coal Industry Committee of Technology. Key Technology and Engineering Practice of Green Ecological Environment Reconstruction in Pingshuo Open-Pit Mining Area; China Coal Industry Publishing House: Beijing, China, 2019; pp. 37–55. [Google Scholar]
- Hao, R.; Bai, Z.; Zhao, J.; Peng, S.; Soun, Y. Vegetation dynamics during plant rehabilition in degraded mined land of large opencast coal mine within loess area. Acta Ecol. Sin. 2003, 23, 1470–1476. [Google Scholar]
Publisher’s Note: MDPI stays neutral with regard to jurisdictional claims in published maps and institutional affiliations. |
© 2022 by the authors. Licensee MDPI, Basel, Switzerland. This article is an open access article distributed under the terms and conditions of the Creative Commons Attribution (CC BY) license (https://creativecommons.org/licenses/by/4.0/).

