Article

Land Vulnerability, Risk Zoning, and Ecological Protection in the Protection Forest of Pagaibamba (Peru)

by
María Antonieta Escobedo-Monge
1,2,*,
Santiago Aparicio
1,
Manuel Valencia Ramos
2,
Marlene Fabiola Escobedo-Monge
3,
Joaquín Parodi-Román
4,
Luis Felipe García-Llatas
5 and
Rubén Marquina Pozo
2
1
Department of Chemistry, University of Burgos, Plaza Misael Banñuelos s.n., 09001 Burgos, Spain
2
Soil Department, Agrarian University La Molina, La Molina, Lima 15024, Peru
3
Faculty of Medicine, Valladolid University, Avenida Ramón y Cajal, 7, 47005 Valladolid, Spain
4
Science Faculty, Cadiz University, Paseo de Carlos III, 28, 11003 Cádiz, Spain
5
National Service of Natural Areas Protected by the State (SERNANP), Calle Diecisiete 355, Lima 06683, Peru
*
Author to whom correspondence should be addressed.
Forests 2022, 13(3), 436; https://doi.org/10.3390/f13030436
Submission received: 17 January 2022 / Revised: 28 February 2022 / Accepted: 3 March 2022 / Published: 10 March 2022
(This article belongs to the Section Forest Ecology and Management)

Abstract

:
The protection of natural areas is considered an essential strategy for environment conservation. The objective of this work was to determine the level of vulnerability, considering the characterization and identification of the risk zones and ecological protection of the Pagaibamba Protection Forest (PPF, Peru). To determine the vulnerable areas, Landsat ETM satellite images, topographic, geological, ecological, and vegetation cover maps were used. Geological, physiographic, edaphological, vegetation cover, and land use potential characteristics, were analyzed. Three Ecological Protection and Risk Zones were identified, with the largest extension of the PPF corresponding to lands of very high and high vulnerability and high ecological risk, which include >85% of Protected Natural Areas (PNA) and 54% of the Buffer Zone (BZ). Moderate risk areas represent 30% of the Buffer Zone (BZ) and 13% of the PNA, and the low-risk areas (represent 15% of the BZ and 2% of the PNA). Biogeographically, the PPF was related to the Cloudy Montane Forests Ecoregion of the Andes Mountains, standing out the Tropical Montane Cloud Forest (TMCF) and the Tropical Lower Montane Cloud Forest (TLMCF). These forests are a global conservation priority due to their great biodiversity, high level of endemicity of flora and fauna, and the crucial hydrological function they fulfill.

Graphical Abstract

1. Introduction

Soil loss due to erosion is tolerable when the rate of soil renewal is not exceeded. Most of the degradation and loss of soil is due to deforestation, overgrazing, and agricultural activities. However, depending on the erosive agent, soil degradation occurs mainly by water erosion [1,2], followed by wind, chemical, and physical factors [3]. The vegetation protects the soil from damage against erosion and reduces the disaggregation and transport capacity of the edaphic material, intervening at the beginning of a rain event and intercepting part of the water that falls on the leaves and branches of the plant [4]. It has been claimed that any land use that modifies the type and density of the original plant populations and exposes the soil leads to its degradation [5]. This risk situation has developed the need to protect natural areas in many countries as a strategy, to save habitats or landscapes from the destruction that receive the social and legal consideration of natural heritage [6,7].
Despite the great complexity in the identification of risk areas and ecological protection within PNAs and BZ, the use or remote sensing and Geographic Information Systems (GIS) [8] has facilitated and improved the analysis and characterization of the physical environment, types, and classes of plant cover, soil, etc. Using sophisticated means of spatial analysis, improving the evaluation and efficiency of large volumes of available information, associated above all with land use planning studies [9,10]. Thus, the combination of remote sensing, GIS, and the Global Positioning System (GPS), allow incorporating and associating field information, digital cartography, and remote sensors, which facilitates the spatial and integrated treatment of existing information [11].
Protected natural spaces (PNS) in Europe or Protected Natural Areas (PNA) in Latin America, are environmental policy instruments that support environmental conservation strategies [12]. PNAs are the cornerstone of the strategy for the conservation of biological diversity, by maintaining the integrity of the ecosystems of a region, therefore they play a central role in the greater objective of achieving a sustainable society [13]. These PNAs and their BZs (buffer zones) are not isolated units, but rather linked to their geographic environment by ecological, economic, political, and cultural factors, with the possibility of reconciling the integrity of the ecosystems [14,15]. Within them, the Protection Forests are natural areas established to protect the upper or collecting basins, the riverbanks, and other watercourses, against the erosion [13,16,17].
In Peru, the PNAs together form the National System of Natural Protected Areas by the State (SINANPE), under the jurisdiction of the Ministry of Agriculture through the National Service of Natural Protected Areas (SERNANP) by the State. The PNAs with definitive status (SINANPE) are classified into nine categories: National Reserves, National Parks, Protection Forests, Game Preserves, Community Reserves, Landscape Reserves, Wildlife Refuges, National Sanctuaries, and Historic Sanctuaries [18,19,20]. In addition, the Reserved Zone is considered ANP with transitory status [21,22].
Due to its structure and composition, each protected area will have specific degrees of ecological vulnerability that must be identified and analyzed, since they will have different levels of resilience to these threats [23]. The climate, the life zones, the lithology, the physiography, the soils, the vegetation, and the current use serve as the basis for carrying out the analysis of the soil erosion risks [24]. Furthermore, reducing vulnerability means reducing risk, thereby decreasing the possibility of future disasters [25,26]. Sustainable development is not possible if there is no effective risk prevention and reduction strategy from the planning perspective [26]. For this reason, it is essential to identify and reduce the vulnerability of areas at risk, as an explicit and unavoidable purpose in development planning and in the management of these territories. Therefore, the main objective was to determine the level of vulnerability, considering the characterization and identification of the risk zones and ecological protection of the Pagaibamba Protection Forest in Peru.

2. Materials and Methods

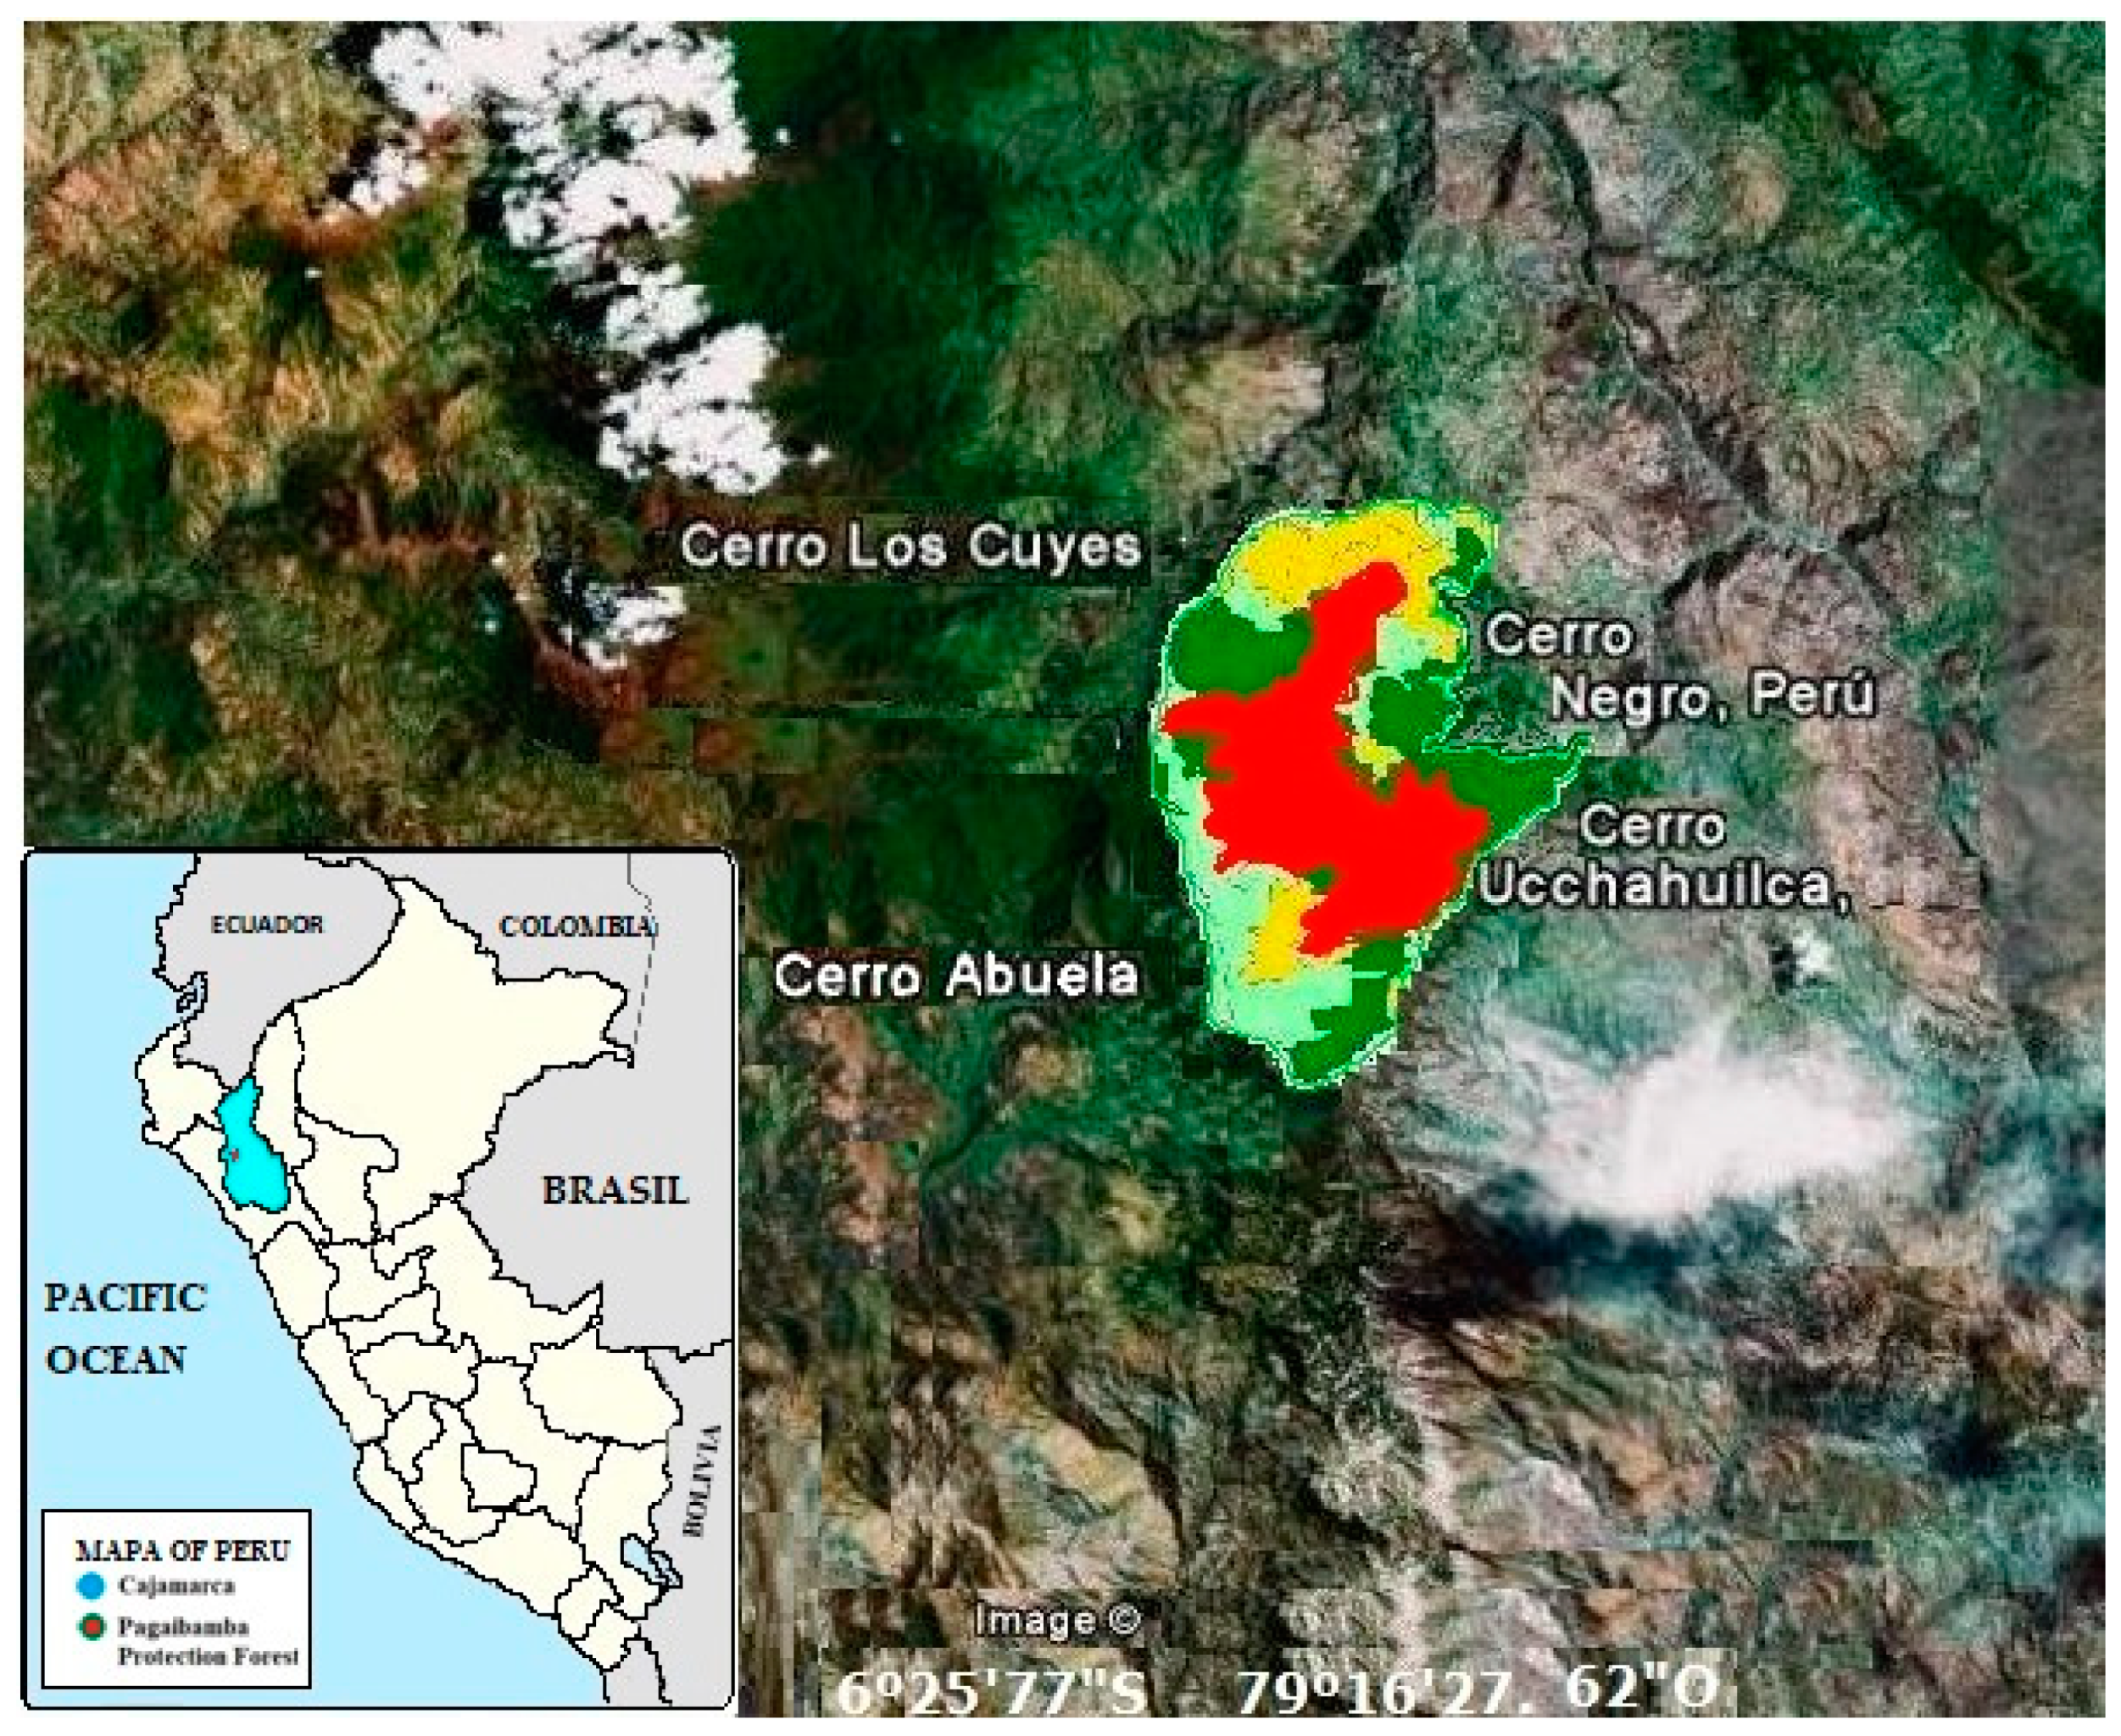
2.1. Site Description

An evaluation and identification study of risk areas was carried out in the Pagaibamba Protection Forest, located in the district of Querocoto, Province of Chota, department of Cajamarca, at an altitude of 2200 to 3800 m. This forest is part of the Andean ecosystems in northern Peru. It was established as PNA for hosting a great diversity of important natural resources for the population of the districts of Querocoto, Llama, and Huambos, by R. S. No. 0222-1987-AG/DGFF on 19 June 1987. This PNA has a surface area of 2078.38 ha (shaded area in red), Figure 1. For cartographic purposes, 2023.20 ha were considered (1:25,000 scale map). The BZ has 4165.71 ha (shaded area in green).
The climatological parameters vary from the warm temperate semi-arid climate with an annual average temperature of 14 to 16 °C and average annual rainfall of 600 to 700 mm to the semi-cold temperate humid climate with temperatures ranging between 7.3 and 13 °C and rainfall of 500 to 1150 mm generating regimes of temperature and humidity, isomesic and ustic, respectively [27].
The ecological characteristics were valued according to the Life Zone Classification System proposed by Holdridge [28,29]. The following zones were inferred: The Tropical Montane Cloud Forest (TMCF) (2700–3800 masl), steep in relief, is located at the top of the slopes that frame the inter-Andean valleys. The annual average temperature is 10.4 °C and the total precipitation per year is 600 to 1000 mm. The Tropical Low Montane Cloud Forest (TLMCF) (2300–2700 masl) is a rugged area with slopes of 50–75% and steep slopes. The mean annual temperature is 14.5 °C and the total annual precipitation is 1400 mm. The Tropical Low Montane Dry Forest (TLMDF) (below 2300 masl), rugged area, steeply sloping mountain slopes. The annual average temperature is 14.0 to 16.0 °C and the total precipitation per year is 600 to 700 mm.
Concerning geological characteristics, the area is formed by lithological formations belonging to the Mesozoic and Cenozoic eras with volcanic and sedimentary materials (sandstones). It is characterized by the following formations: Huambo Volcanic Formation and Llama Volcanic Formation belongs to the Upper and Middle Tertiary, respectively within the Cenozoic, and Pulluicana Formation belongs to the Upper Cretaceous within the Mesozoic.

2.2. Cartographic Materials

The chief sources of information were the following: National Charter sheet 13e II SE, and sheet 13e II NE, as a cartographic base, at 1:25,000 scale, PSAD56, Zone 17 UTM, for the determination and delimitation of protection zones. The ecological map scale 1:1,000,000, with an explanatory guide. The departmental physical-political map, prepared by the National Geographic Institute of Peru (IGN). Geological map scale 1:25,000, developed based on the information registered by INGEMMET, in the respective geological quadrangle. The National Charter of the department of Cajamarca, Peru, scale 1:100,000 (IGN). The Rural Cadastre Sheets 1:25,000 (Rural Cadastre Office of the Ministry of Agriculture) Datum PSAD 56.

2.3. Remote Sensing Cartographic Materials
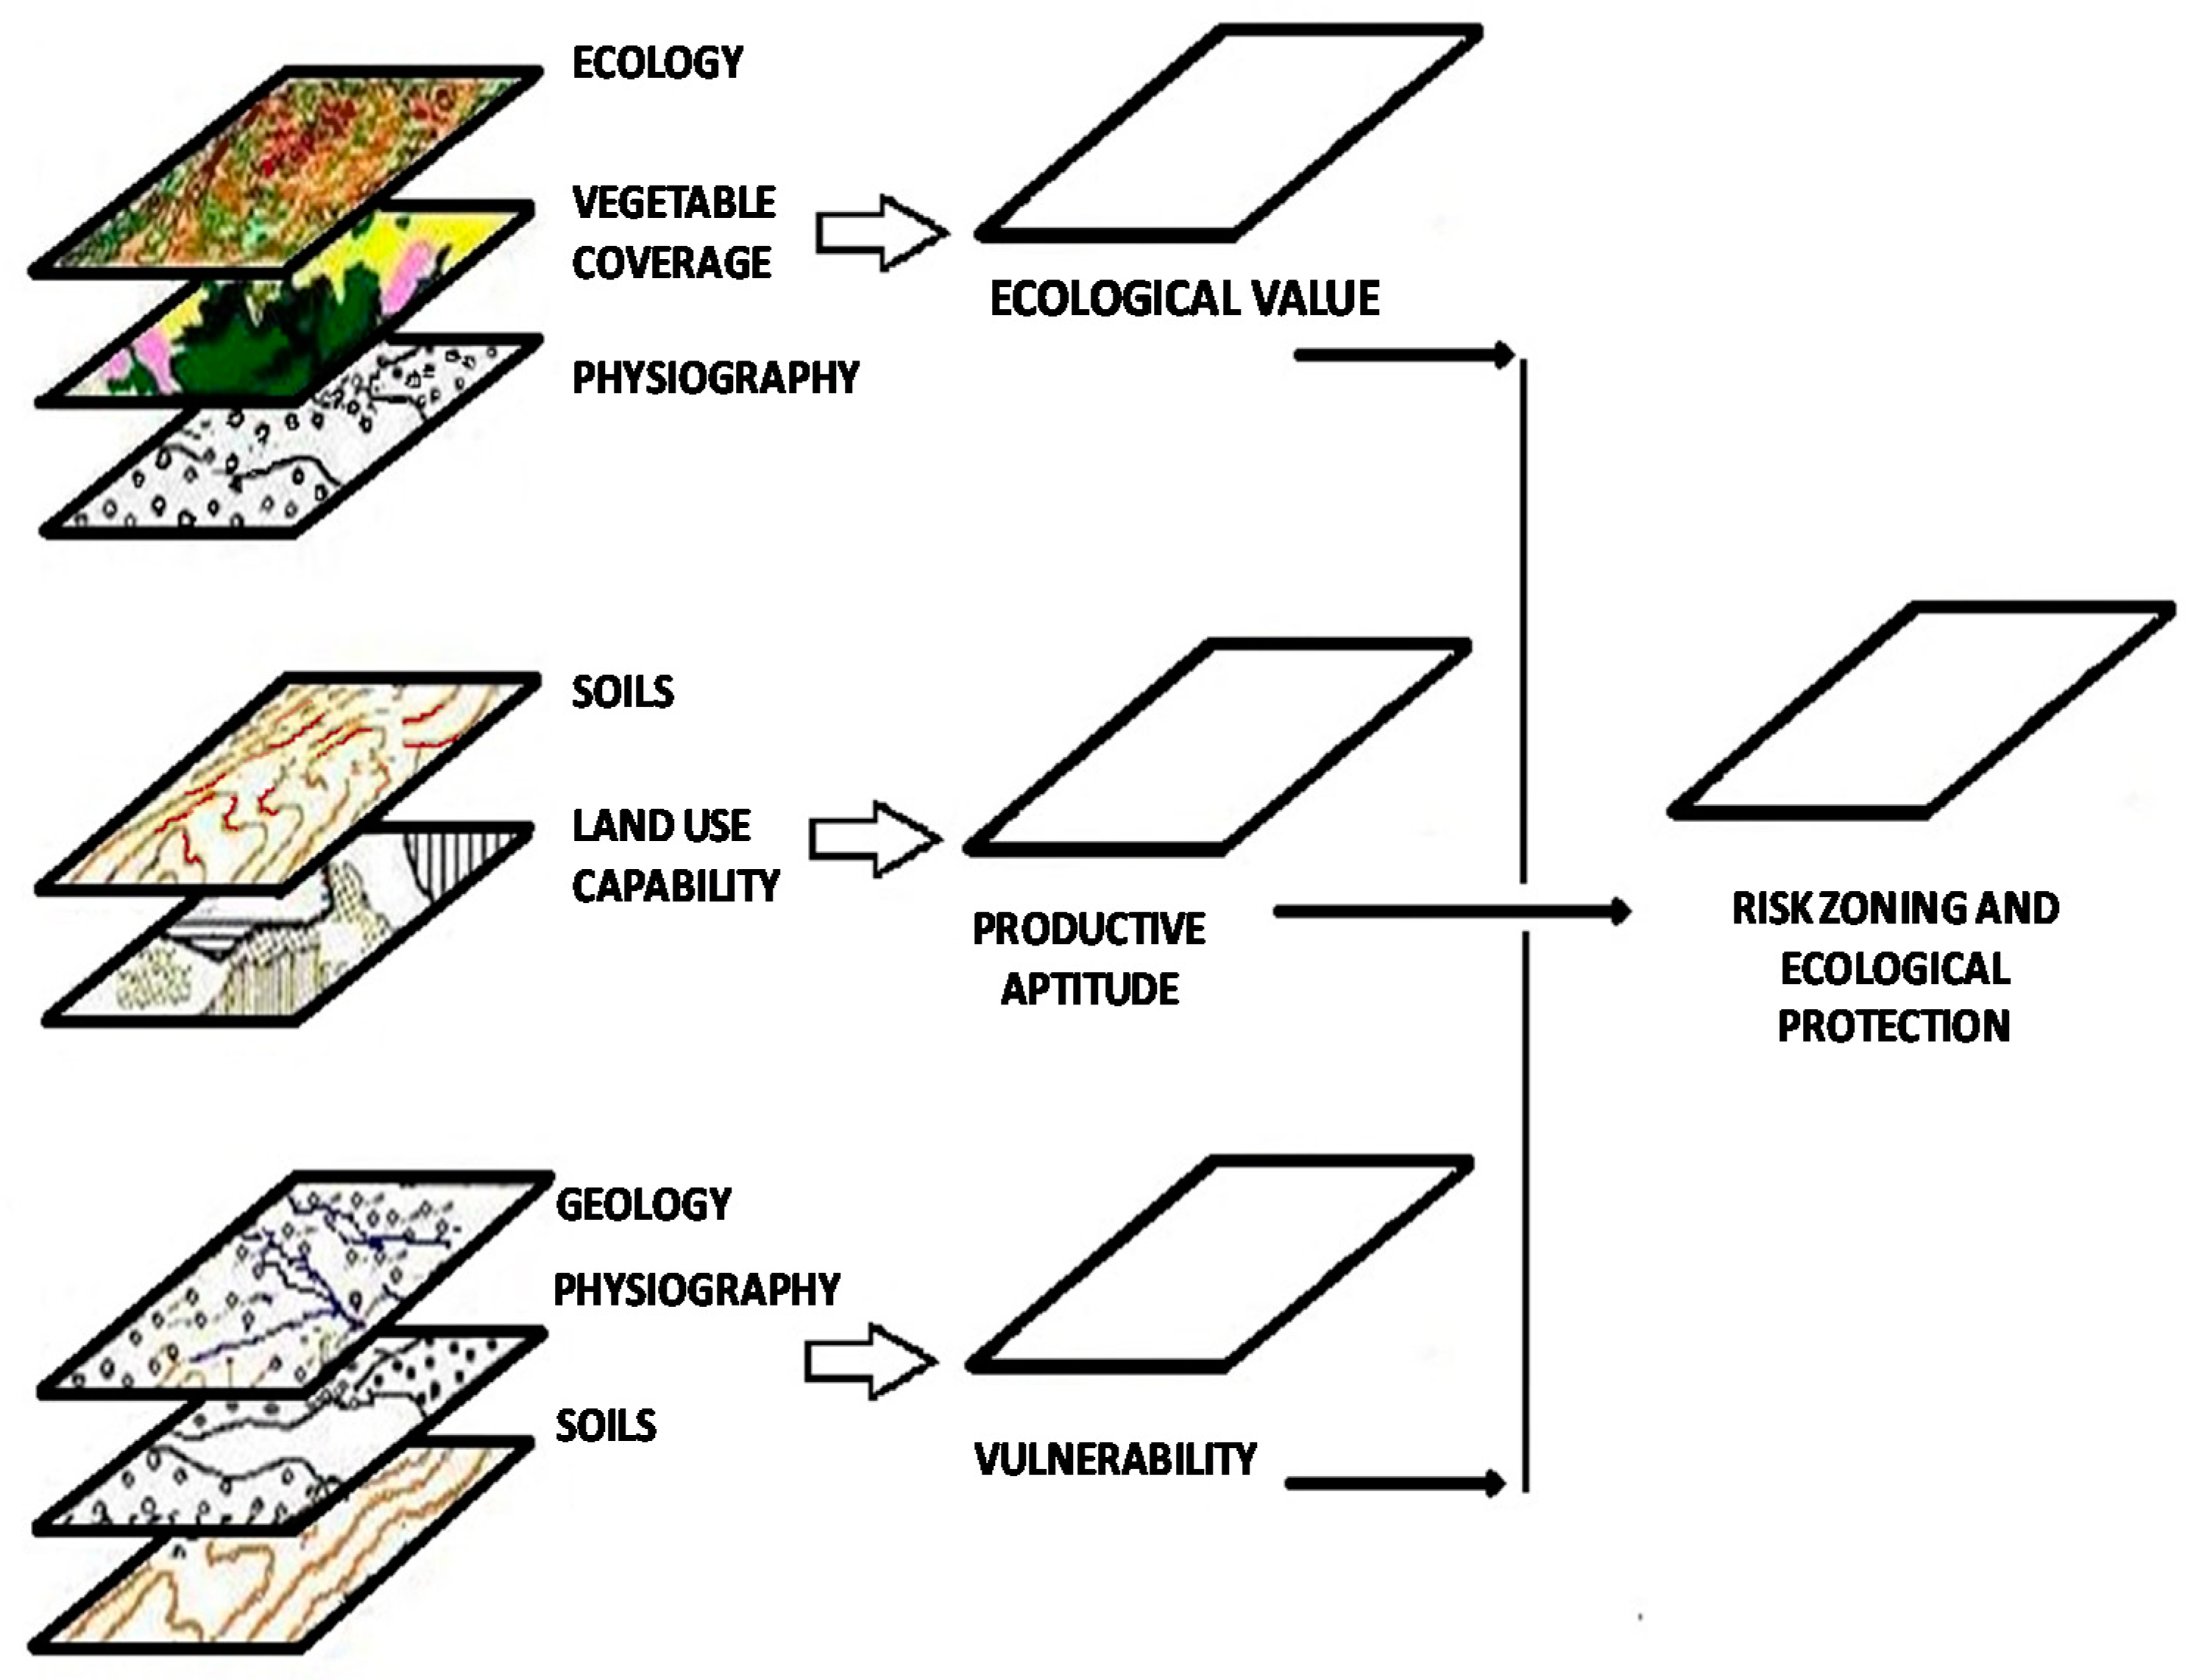
The main sources were the following: Landsat ETM 8 satellite images, 20 m resolution, on-base cartography at scale 1:25,000, PSAD 56, Zone 17UTM, corresponding to sheets 13e II SE and sheet 13e II NE. Digital base cartography, IGN source, scale 1:100,000, with digital National Charts at scale 1:100,000 (IGN-INRENA)—Datum WGS 84. Landsat TM and Landsat ETM satellite images, which includes the study area, as well as SPOT XS satellite images. Digital thematic cartography at a scale of 1:250,000 (MINAGRI). These materials can be found at [30,31,32,33,34,35,36,37].

2.4. Design

The multidisciplinary method developed by our research group consists of a series of sequential phases. In Phase 1, all available digital thematic and cartographic information was collected and selected for further processing [7]. The base information was taken as criteria regarding the base cartography (rivers, roads, lakes, contour lines, populated centers, etc.,) and the territorial delimitation with the analysis and demarcation of forest covers, uses, etc.
In Phase 2, all the information applied to the physiography, soils, and potential land use of the study area was generated at a semi-detailed level. For this, the physiographic units were identified and delimited. In this phase, an ETM satellite image and a topographic map at the same scale were used as cartographic material. A map of slopes was made to know the possible risks of erosion present and to determine the possible limitations that these lands present. Following the physiographic analysis method described by Villota in 1992 [38], the satellite images were analyzed and interpreted, specifying the various forms of relief that the soil presented, as well as the different geological formations, slopes, and the climate of the study area. A hierarchical land classification system was established, placing these physiographic units (Large Landscape, Landscape, Sub-landscape and Landscape Elements) in different categories related to the scale of available satellite images and the level of detail required, which was represented in a physiographic map at a scale of 1:25,000, which served for the constitution of the following maps [32,33,39].
In Phase 3 the soil units were identified and delimited (semi-detailed soil study), fieldwork was carried out to compare the information collected in the physiographic units delimited in the preliminary map. Soil samples were taken, which were located in landscapes of the high, medium, and low terraces, classified by their height concerning a local base level, generally a river. A careful evaluation and examination of the soils were carried out through wells (57 sampling points) that allowed a description of the soil horizons with depths of 2.00 m or as far as the soil conditions allowed. The horizons were characterized following the guidelines proposed by Soil Survey Staff (2017) [40].
The basic characteristics of the field study were thickness, color, structure, texture, rock fragments, consistency, pH, porosity, internal drainage, permeability, presence of roots, and organic debris. The samples were analyzed using the standard procedures used by the Soil, Water, Plant and Fertilizer Analysis Laboratory, of the Soil Department of the La Molina National Agrarian University, Lima-Peru. Below with the field information and the data obtained in the laboratory, the existing soils were identified, following the definitions and nomenclatures established in the Keys to Soil Taxonomy [41], which considers six categories: order, suborder, great -group, subgroup, family, and series. In the present study, the taxonomic unit considered was the subgroup [40,41]. With the information obtained and processed in the previous stages, and with the help of maps and auxiliary geomorphological and geological information (lithological formations), the soil map was generated.
In Phase 4, with the purpose of identifying and delimiting the land units, the National Land Use Capability Classification System (LUCC) was established according to DS No. 017-2009-AG, of 2 September 2009, was used [42], whose main objective is to determine the appropriate use for agricultural, livestock, forestry, and protection purposes, as well as defining the most appropriate management and conservation practices to avoid its degradation. This system, based on a multidisciplinary methodology that mainly combines attributes/components of the land (relief, climate -life zones-, geomorphology, and soil types), establishes three categories: group, class, and subclass. In the present study, the subclass was considered as an identifier of the land units, established in function of the limiting factors and risks that restrict the use of the land for a long time (Table S1).
In Phase 5, the treatment of the SIG-PNA Information was carried out. In this phase, we use the GIS, which works as a database that handles geographic information. The GIS separates and stores information in different layers or thematic layers, which allows different maps to be viewed quickly and easily at the same time. New information is produced by merging the original sources, facilitating the establishment of relationships between the different coverages, through the use of spatial analysis or the simple superimposition of information [43,44,45].
In Phase 6, risk zoning and ecological protection criteria are established and the ecological value, productive aptitude, and vulnerability of the lands were taken into consideration. For the ecological value the methodology established in the Guide Evaluation of the State of Dry Forest Ecosystems, approved by Ministerial Resolution No. 183-2016-MINAM, was followed [46]. The productive aptitude, which considers the potential or natural aptitude of the lands, indicating their limitations, is derived from the information obtained from the soil maps and the Land Use Capacity map, following the LUCC system (Table S1) [42].
The vulnerability of the lands is established in reference to the instability of the landscapes, caused by the processes of natural erosion and those that can be induced and accelerated by the activities of the local population, cultivation work in areas of steep slopes, overgrazing, etc. It is obtained using the methodology and criteria of the Physical Vulnerability Map of Peru [26]. Next, the different georeferenced thematic layers were superimposed, previously worked on in the GIS (Figure 2), are superimposed, obtaining at a 1:25,000 scale the maps of ecological value (Figure 3), productive aptitude (Figure 4), and vulnerability (Figure 5).
In Phase 7, the Risk Zoning and Ecological Protection Map are generated (Figure 6), which were achieved with the digital integration of the aforementioned thematic and spatial information, and with the interaction of the Ecological Value, Productive Aptitude, and Vulnerability (Figure 2). Finally, the map obtained was generated at a scale of 1:25,000 (Figure 6).

2.5. Analysis

The analysis comprised several stages. First, elaboration of maps, through the thematic and cartographic information obtained using the Arc Giss 10.3 software, which allows the superposition of maps in layers. Second, verification in the study area of the delimited areas. Third, statistical analysis of percentages of the study of the soils, classification of the lands according to their capacity for greater use, and preparation of preliminary maps. Finally, the delimitation on the maps of the areas considered vulnerable and at risk.

3. Results

The method used in our research allowed us to identify the physiographic units and the soil units, carry out the proper checks in the field, and carry out the respective analyses, taxonomically classifying the soils that develop within the PPF.

3.1. Delimitation and Identification of Physiographic Units

The physiographic units and the surface of the PPF are reported in Table S2, where the extensions of the land are specified for each range of slope, both for the ANP and for the BZ. The mountainous physiographic category, with heights greater than 300 m, are the ones that predominate in the department of Cajamarca, where our study area is located (landscape category: “volcanic-sedimentary mountain”). Where it can be seen that 75% of the PNA is characterized by presenting a steep to very steep relief, with slopes from 25 to 75%, unlike the BZ where these only represent 42%.

3.2. Identification and Delimitation of the Soils Units

Table S3 shows the characteristics of the soil profiles that establish the potential of the PPF lands. Three soil units and a miscellaneous area, a lithic outcrop, have been found.
Soil 1 (Table S3), is moderately deep soils, formed from sedimentary sandstone deposits located on mountain slopes with slopes of 8 to 75% (Table S4). AC-type profile, with dark brown ochric epipedon, granular structure, and sandy-loam texture, which rests on yellowish-brown strata, with a sandy-loamy to a sandy texture. The presence of certain distinctive characteristics has allowed us to classify this soil as Typical Ustorthents [41], calling this soil “Cachipampa Soil”.
The Soils 2 and 3 are soils developed on residual materials of sandstones (Soil 2) and of a volcanic nature (Soil 3) located on mountain slopes with slopes of 8 to 75% (Table S4). Both soils rest on a rocky stratum of decaying sandstone. Soil 2 represents deeper soils (120 cm) than Soils 1 and 3. Soil 3 is shallower (75 cm) than Soils 1 and 2 (Table S3). Both soils have an AbwC type profile, with a dark brown and brown ochric epipedon respectively, and a loamy texture, which rests on a cambic horizon. Taxonomically, the presence of certain characteristics has identified these soils as Typic Dystrudepts, identifying these soils as “Los Molinos” and “El Tendal” soils (Tables S3 and S4) [41].

3.3. Identification and Delimitation of the Land Units

The Land Units were classified at the level of “Major Use Subclass”, according to the LUCC System (MINAG, 2009), see Table S1. This allowed us to establish 7 subclasses in our study area, whose characteristics are indicated in Table S5. Within the PNA there are no suitable lands for clean cultivation (group A), but there are in the BZ. The lands suitable for permanent crops (Class C, subclass C3se) cover a minimum extension of 1.8% of the PNA and 14.6% of the BZ. Land suitable for pasture and temporary pasture (P3, subclasses P3se and P3se (t)), represents 13 and 30% of the PNA and BZ, respectively. About 85% and 54.4% of these lands were identified as lands for forest production (F3, subclasses F3sc and F3sec) and protection lands (X, subclass Xse), respectively.

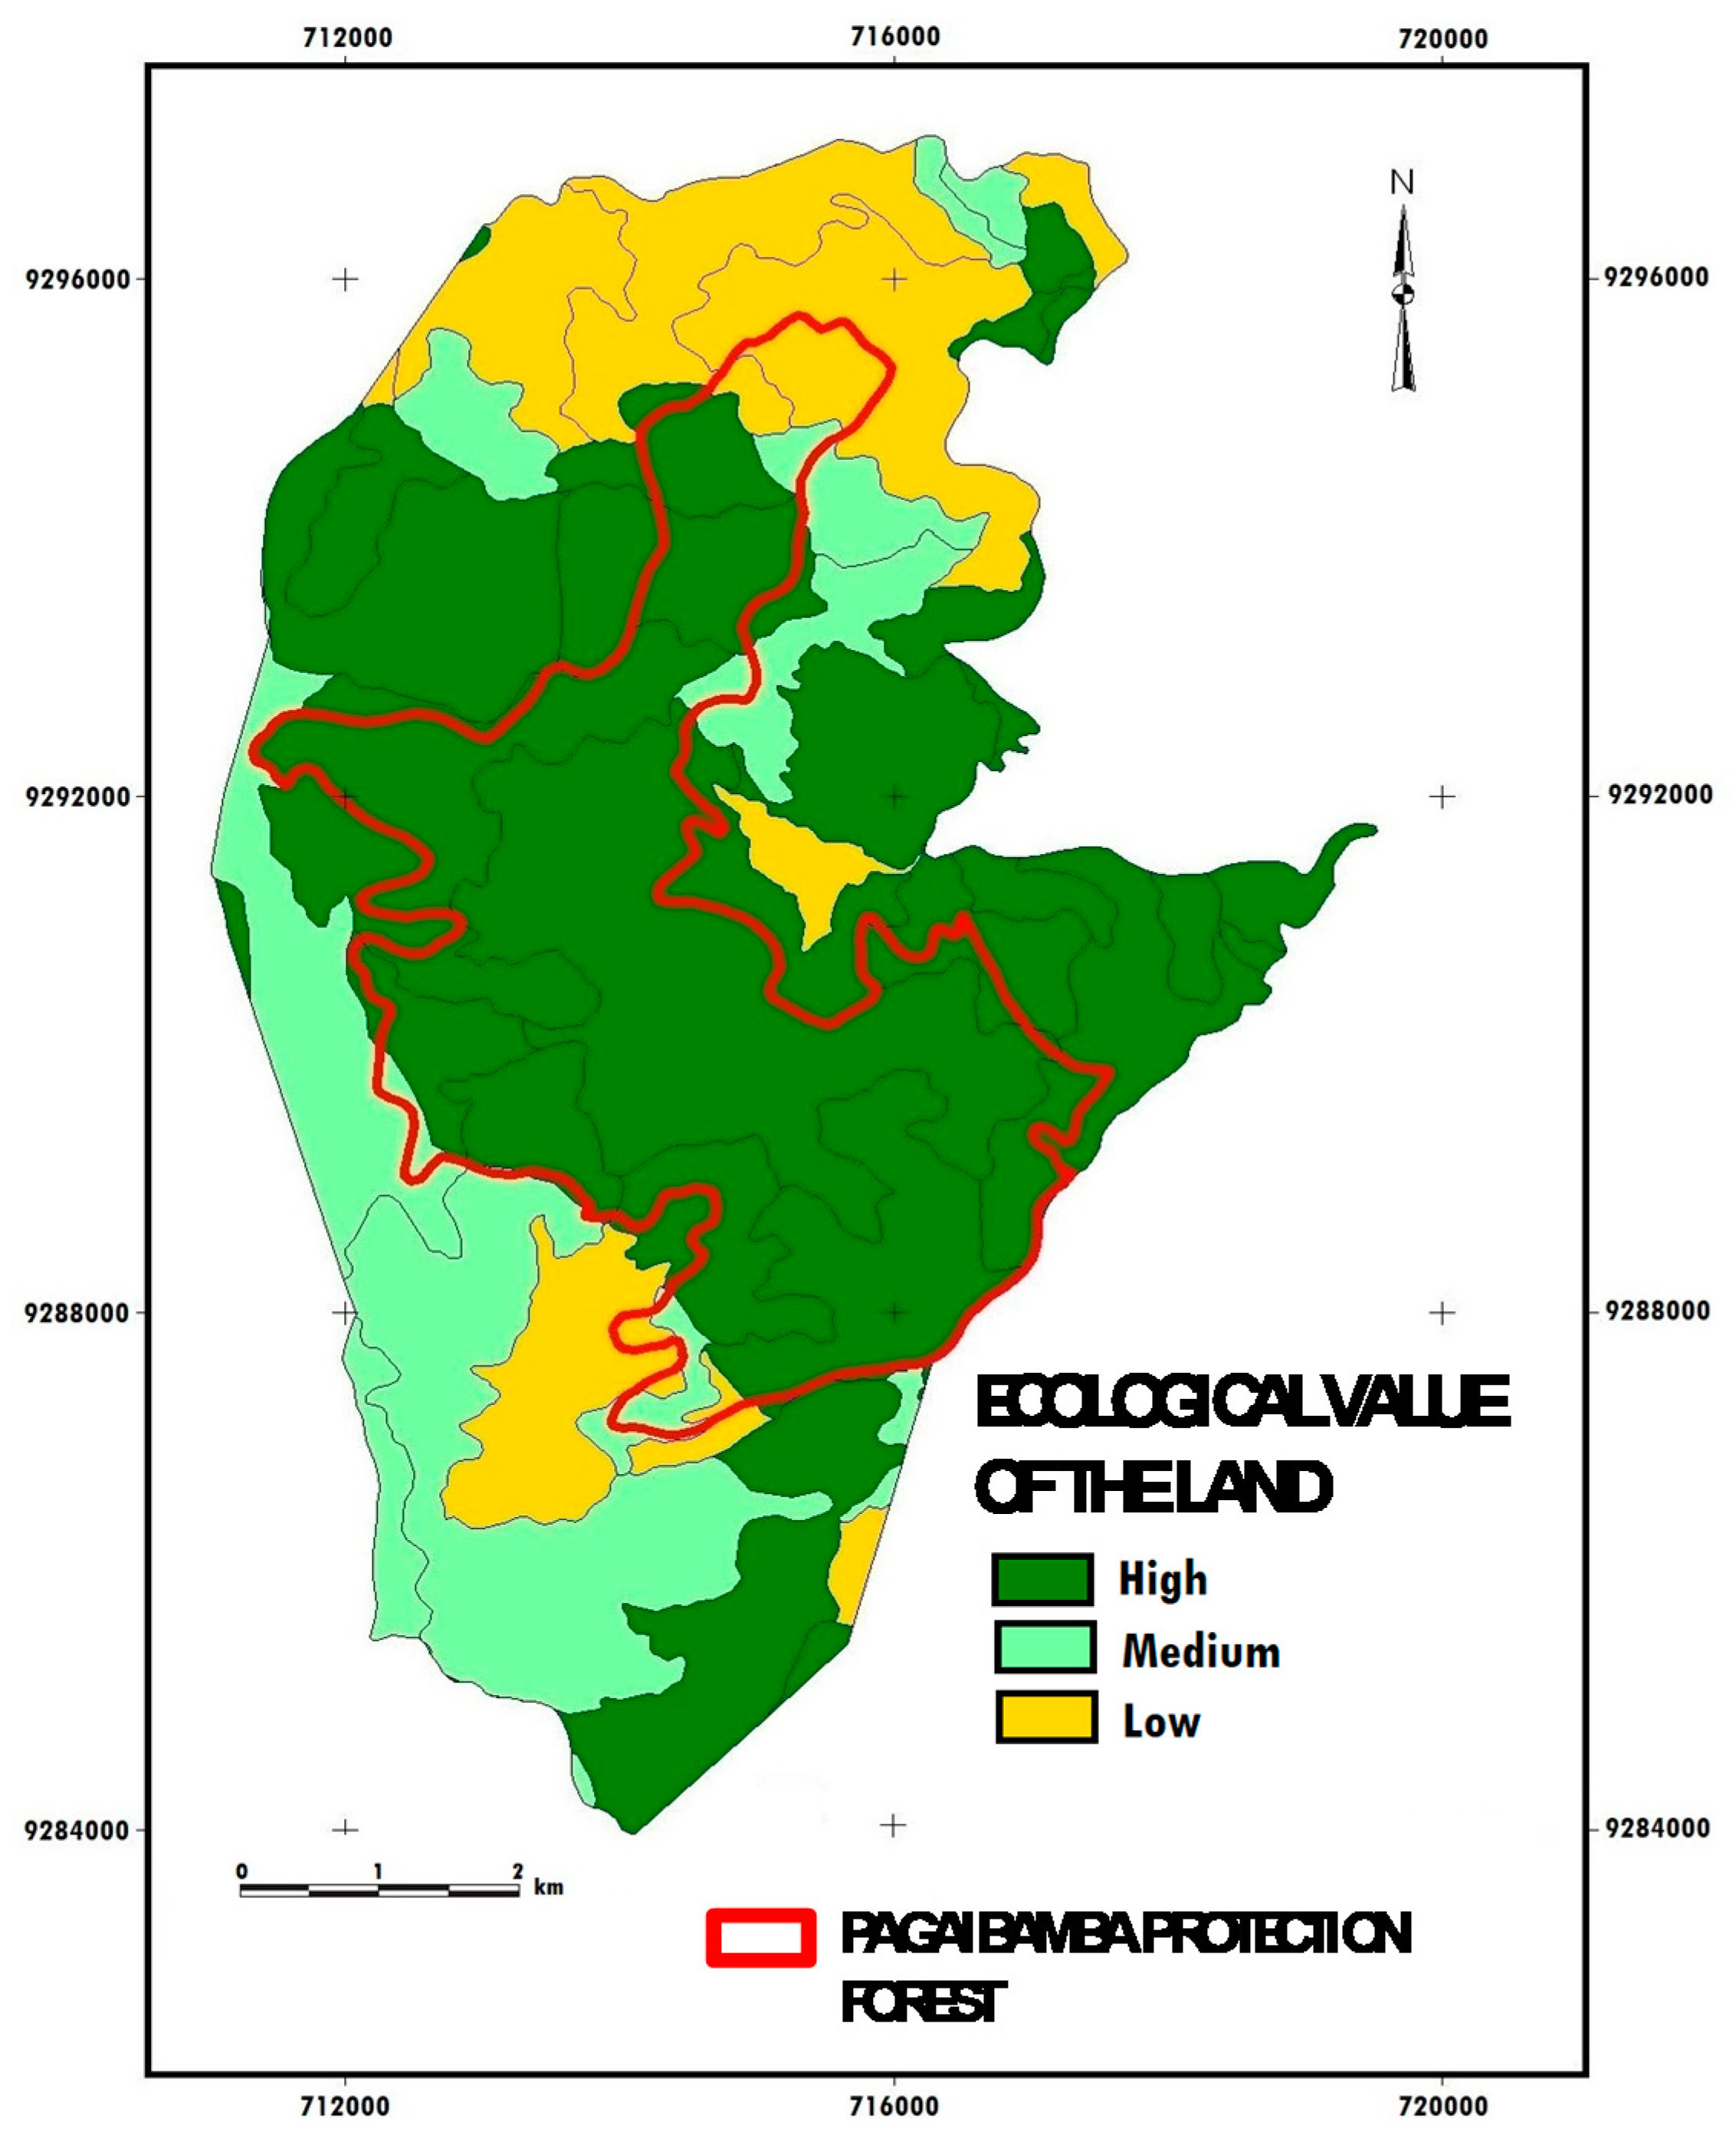
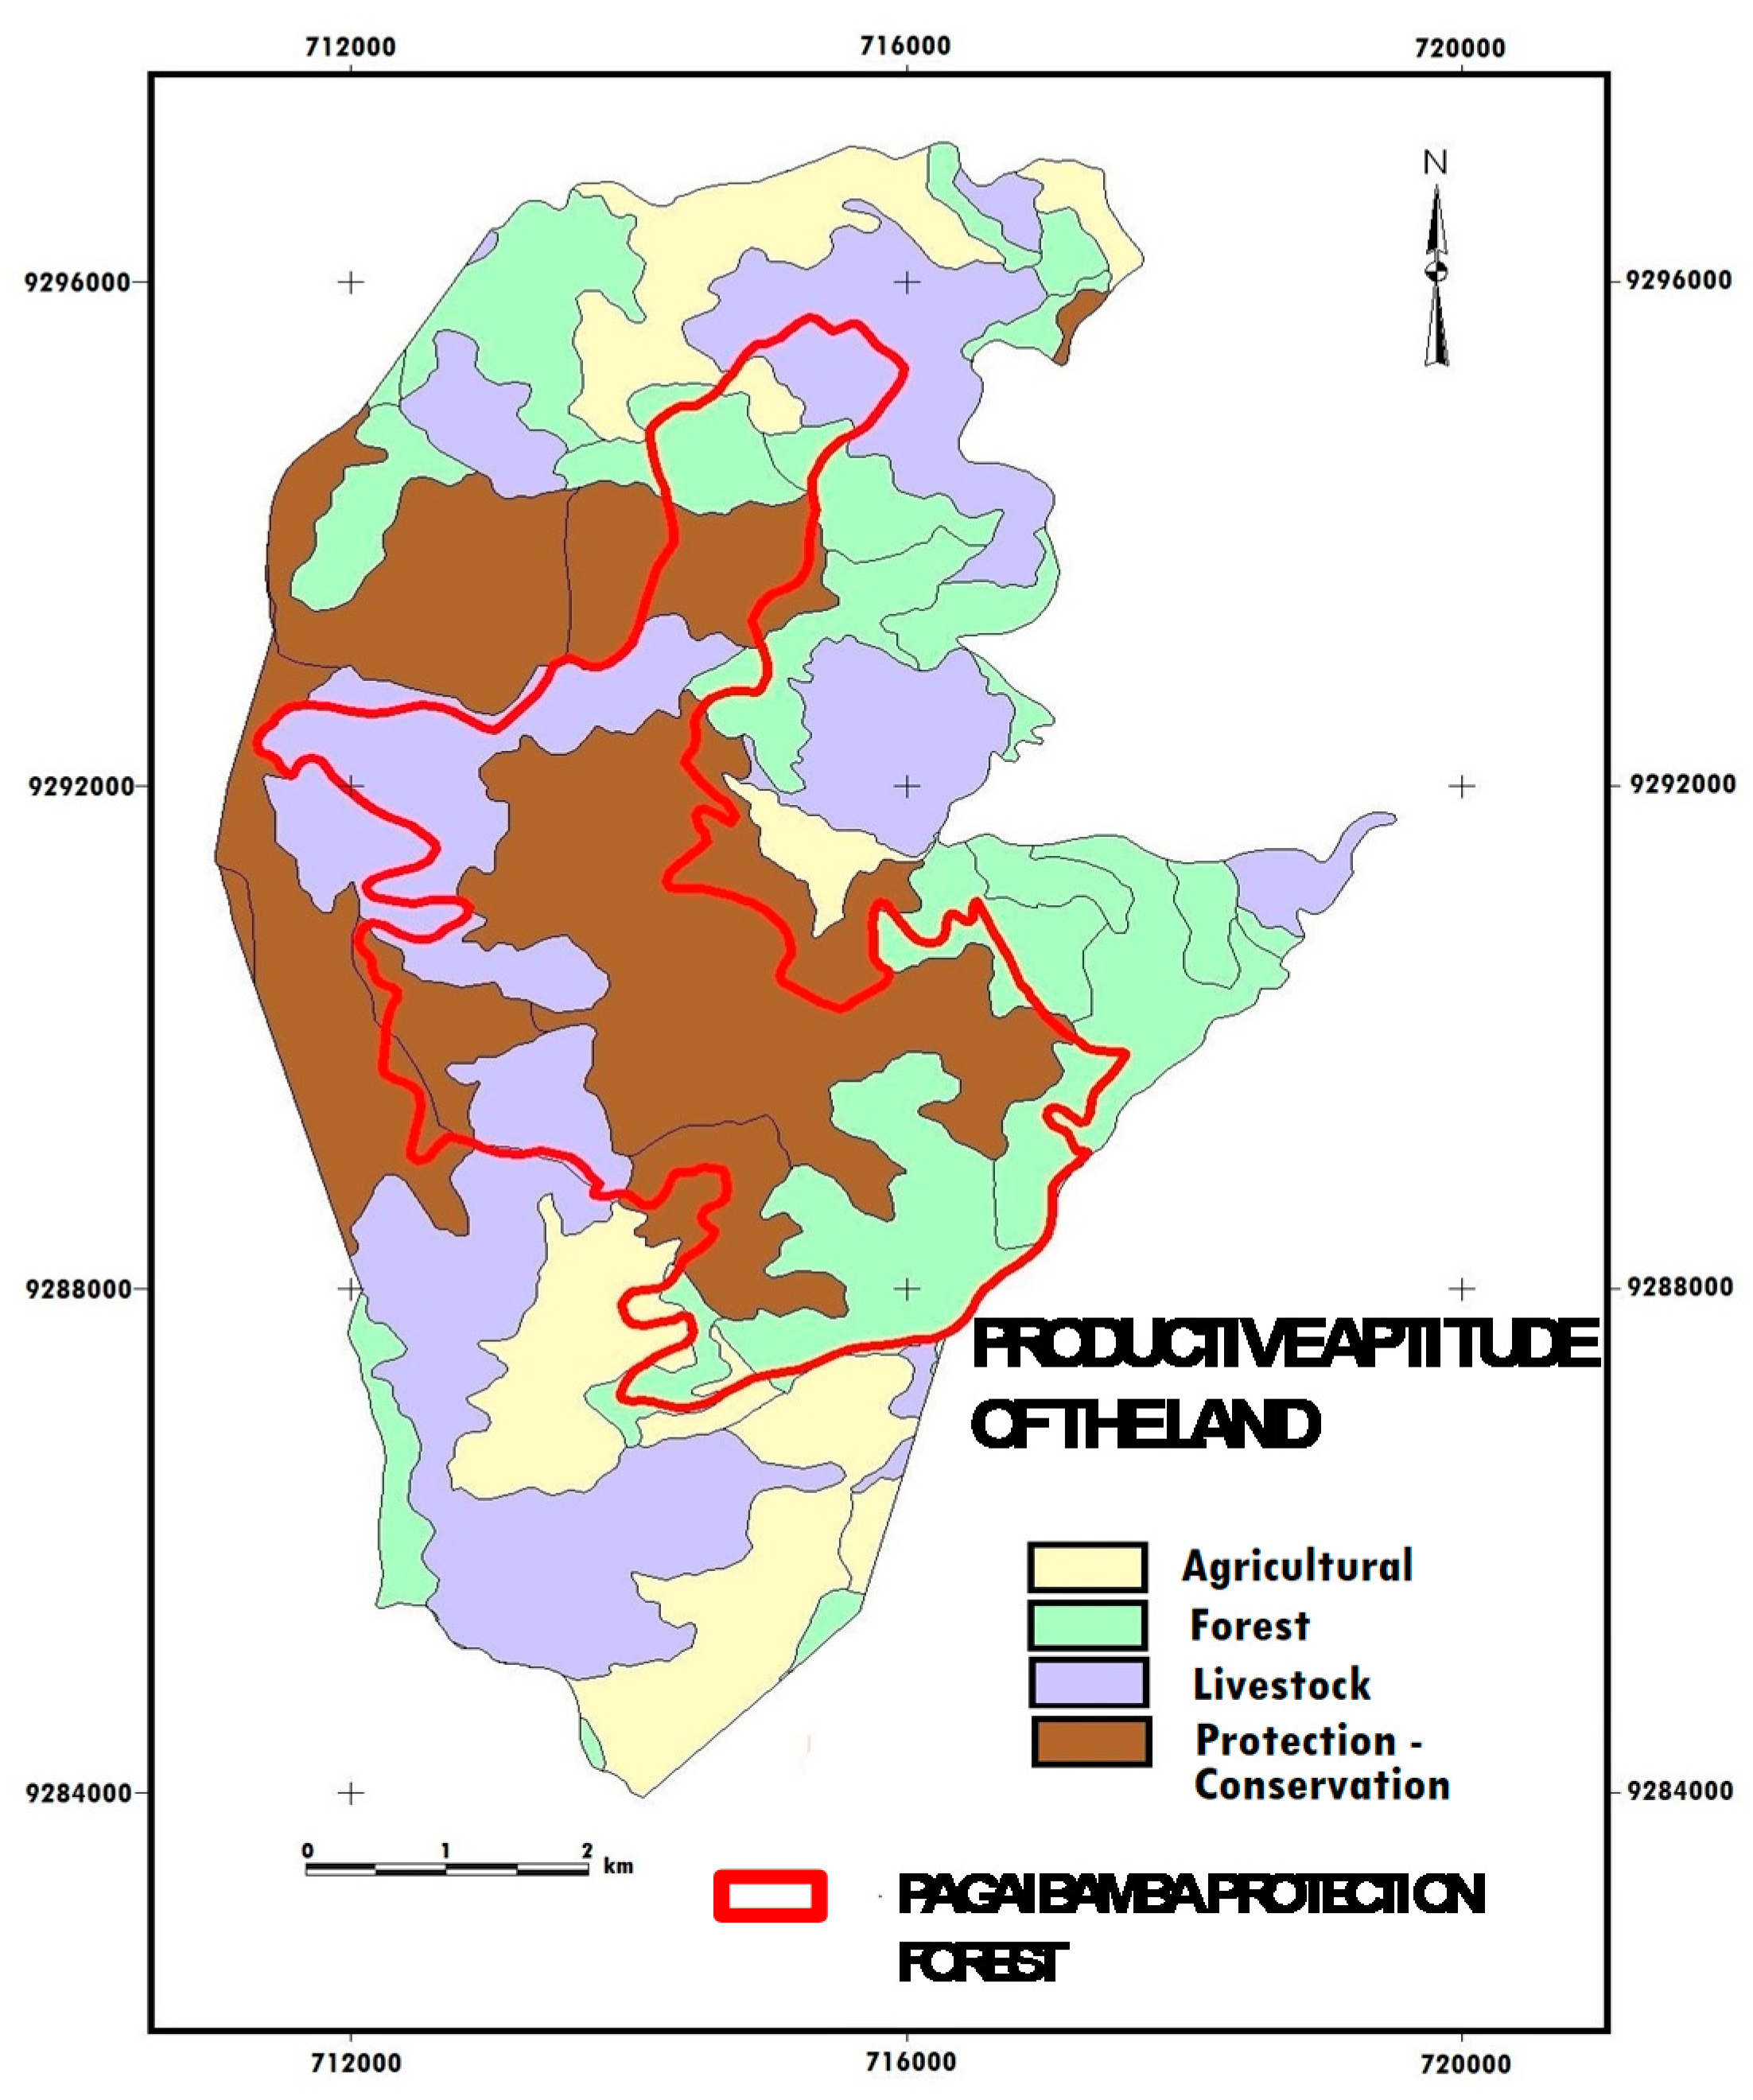
3.4. Risk Zoning Criteria and Ecological Protection

To establish these criteria, the ecological value, productive aptitude, and vulnerability of the land in our study area are taken into account. Tables S1 and S5 show the identification and delimitation of the Land Units. Table S6 and Figure 3 show the ecological value of PPF. They show that 91% of the PNAs and 45% of the BZs are of high ecological value. Table S7 and Figure 4 show the productive aptitude of the PPF. In general terms, the largest amount of land is suitable for forest production and for protection and conservation (Figure 4), since both categories cover about 85% of the area of the PNA compared to 54.4% of the ZB (Table S7). We found that the natural, edaphic, climatic, and topographic conditions suitable for the development of intensive crops or permanent crops are only found in a greater proportion in the BZ (15.4%). Moreover, conditions suitable for pastures (30%) are also found in this area compared to the PNA, which is only 13%. The levels of vulnerability of the lands of the PNA and the BZ of the PPF are indicated in Figure 5 and in Table 1 and Table 2. The following levels of vulnerability have been generated, very high, high, moderate, low, and very low.

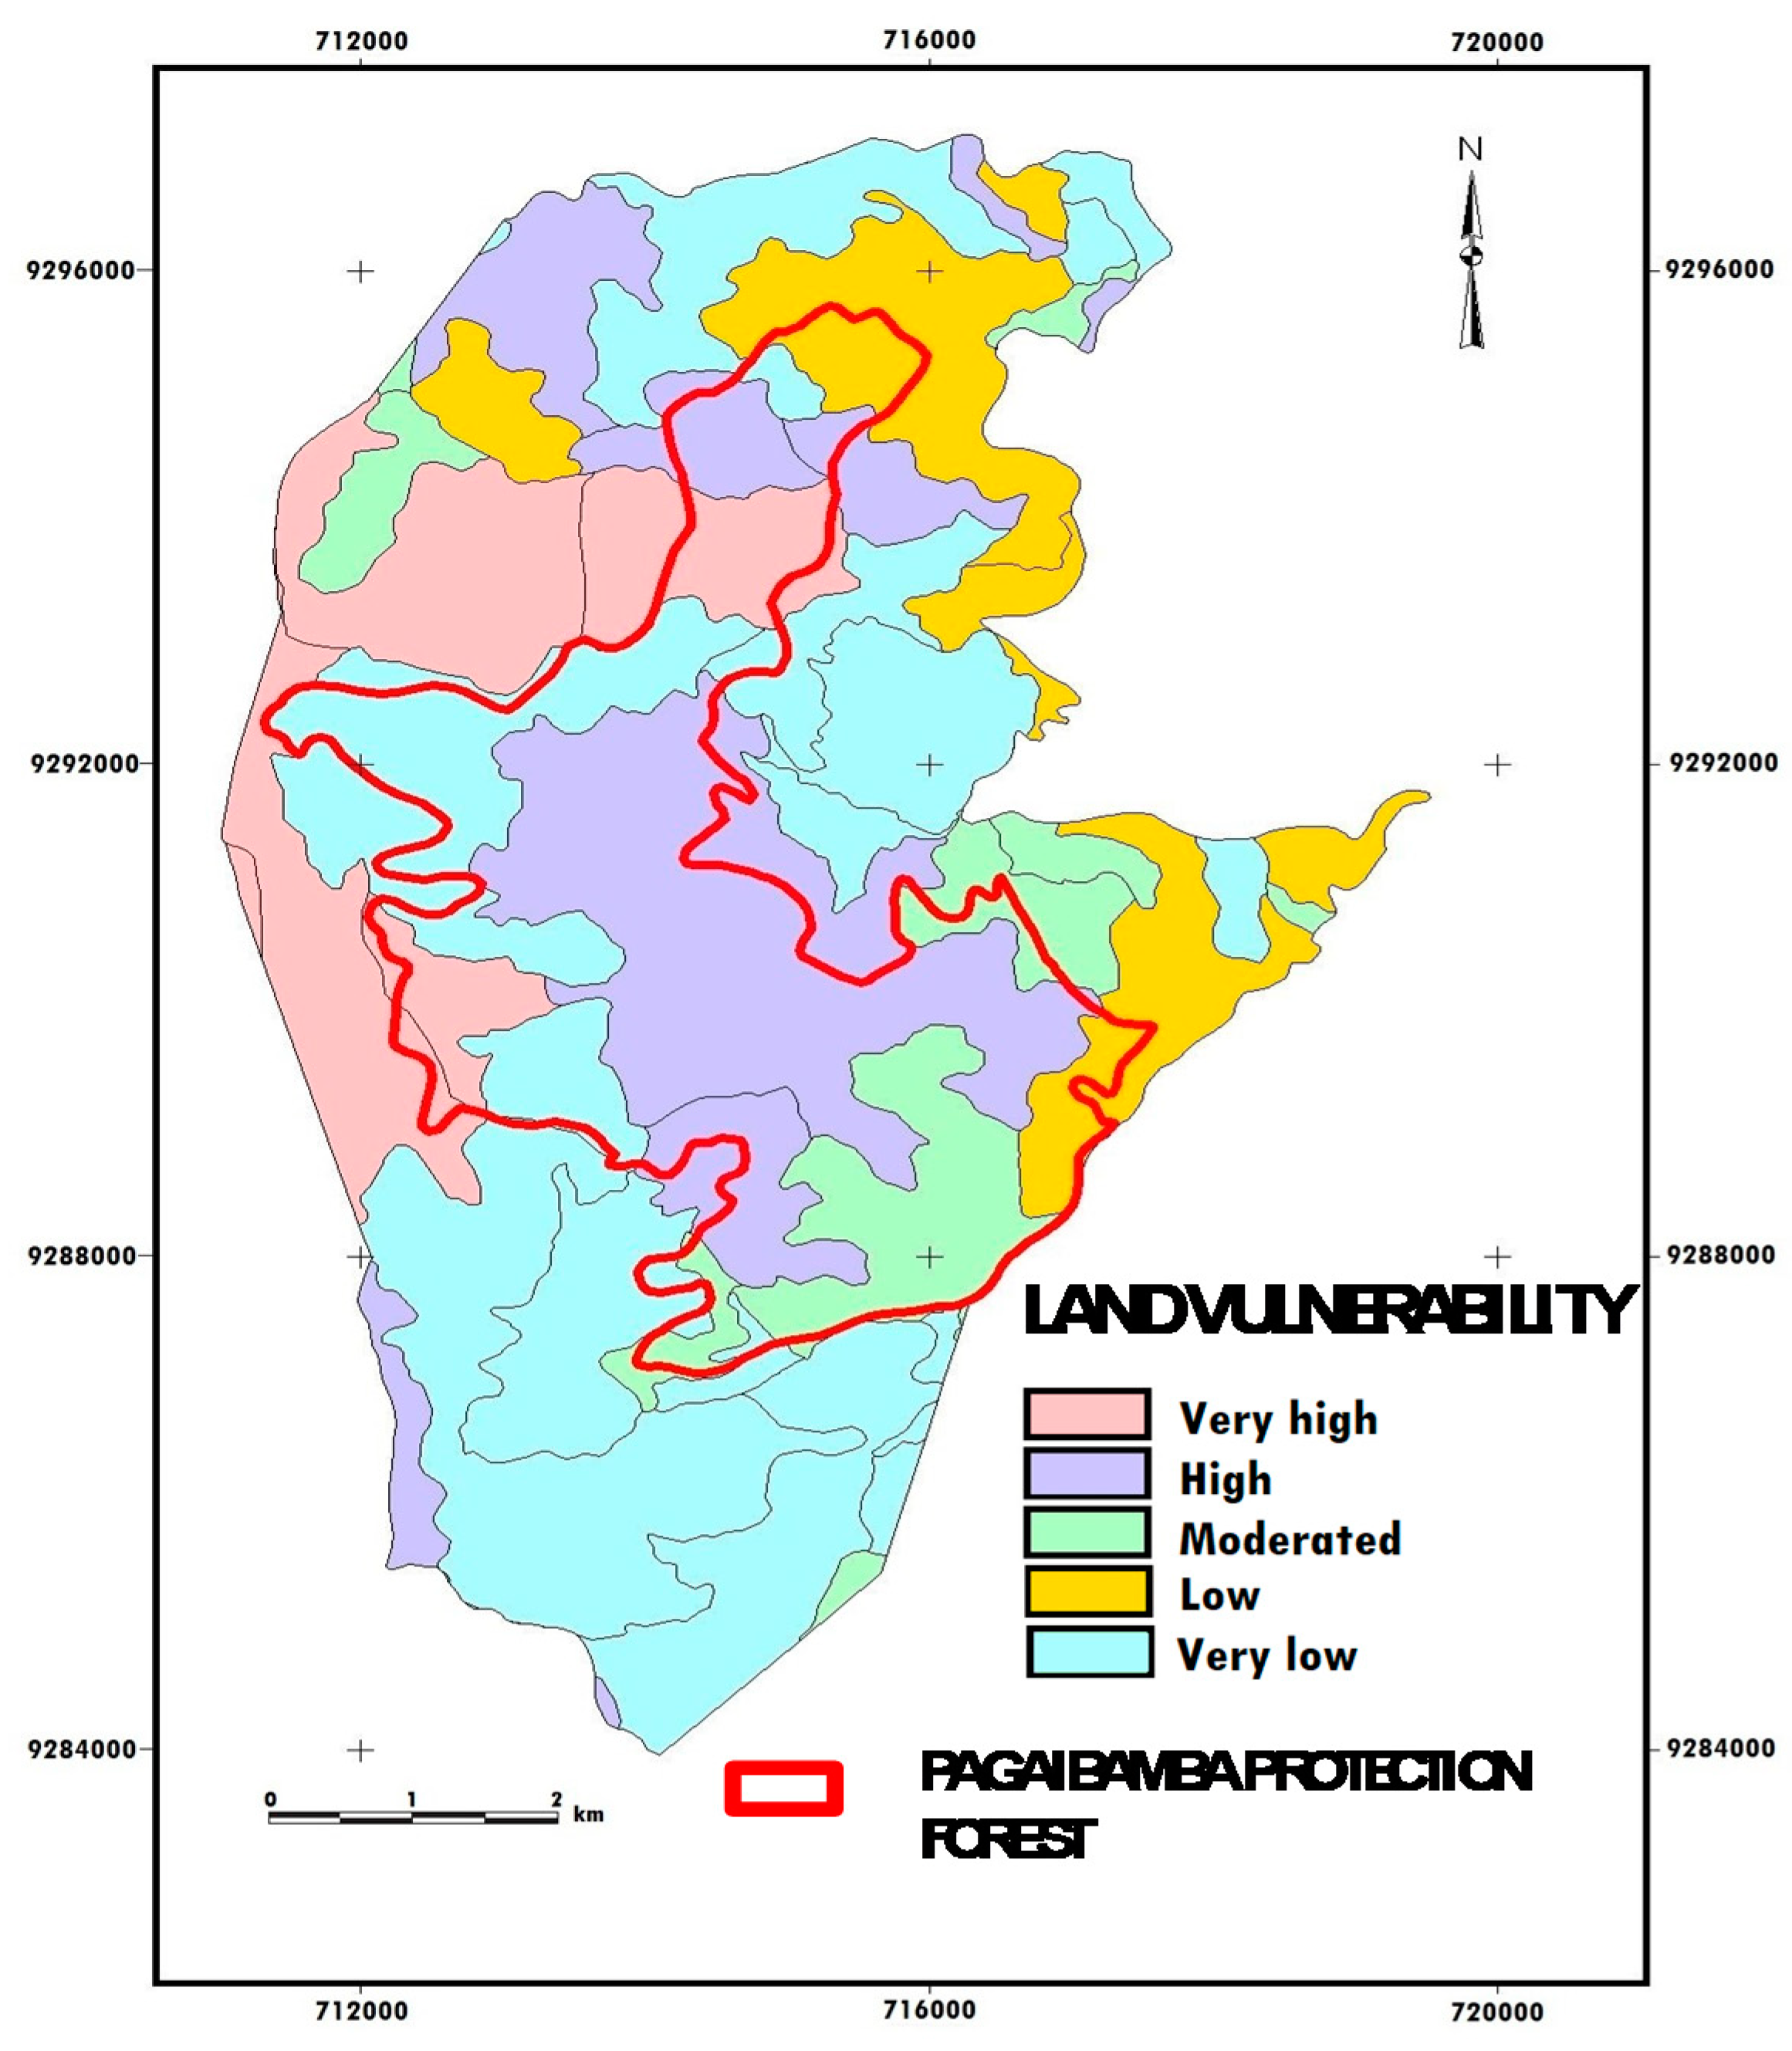
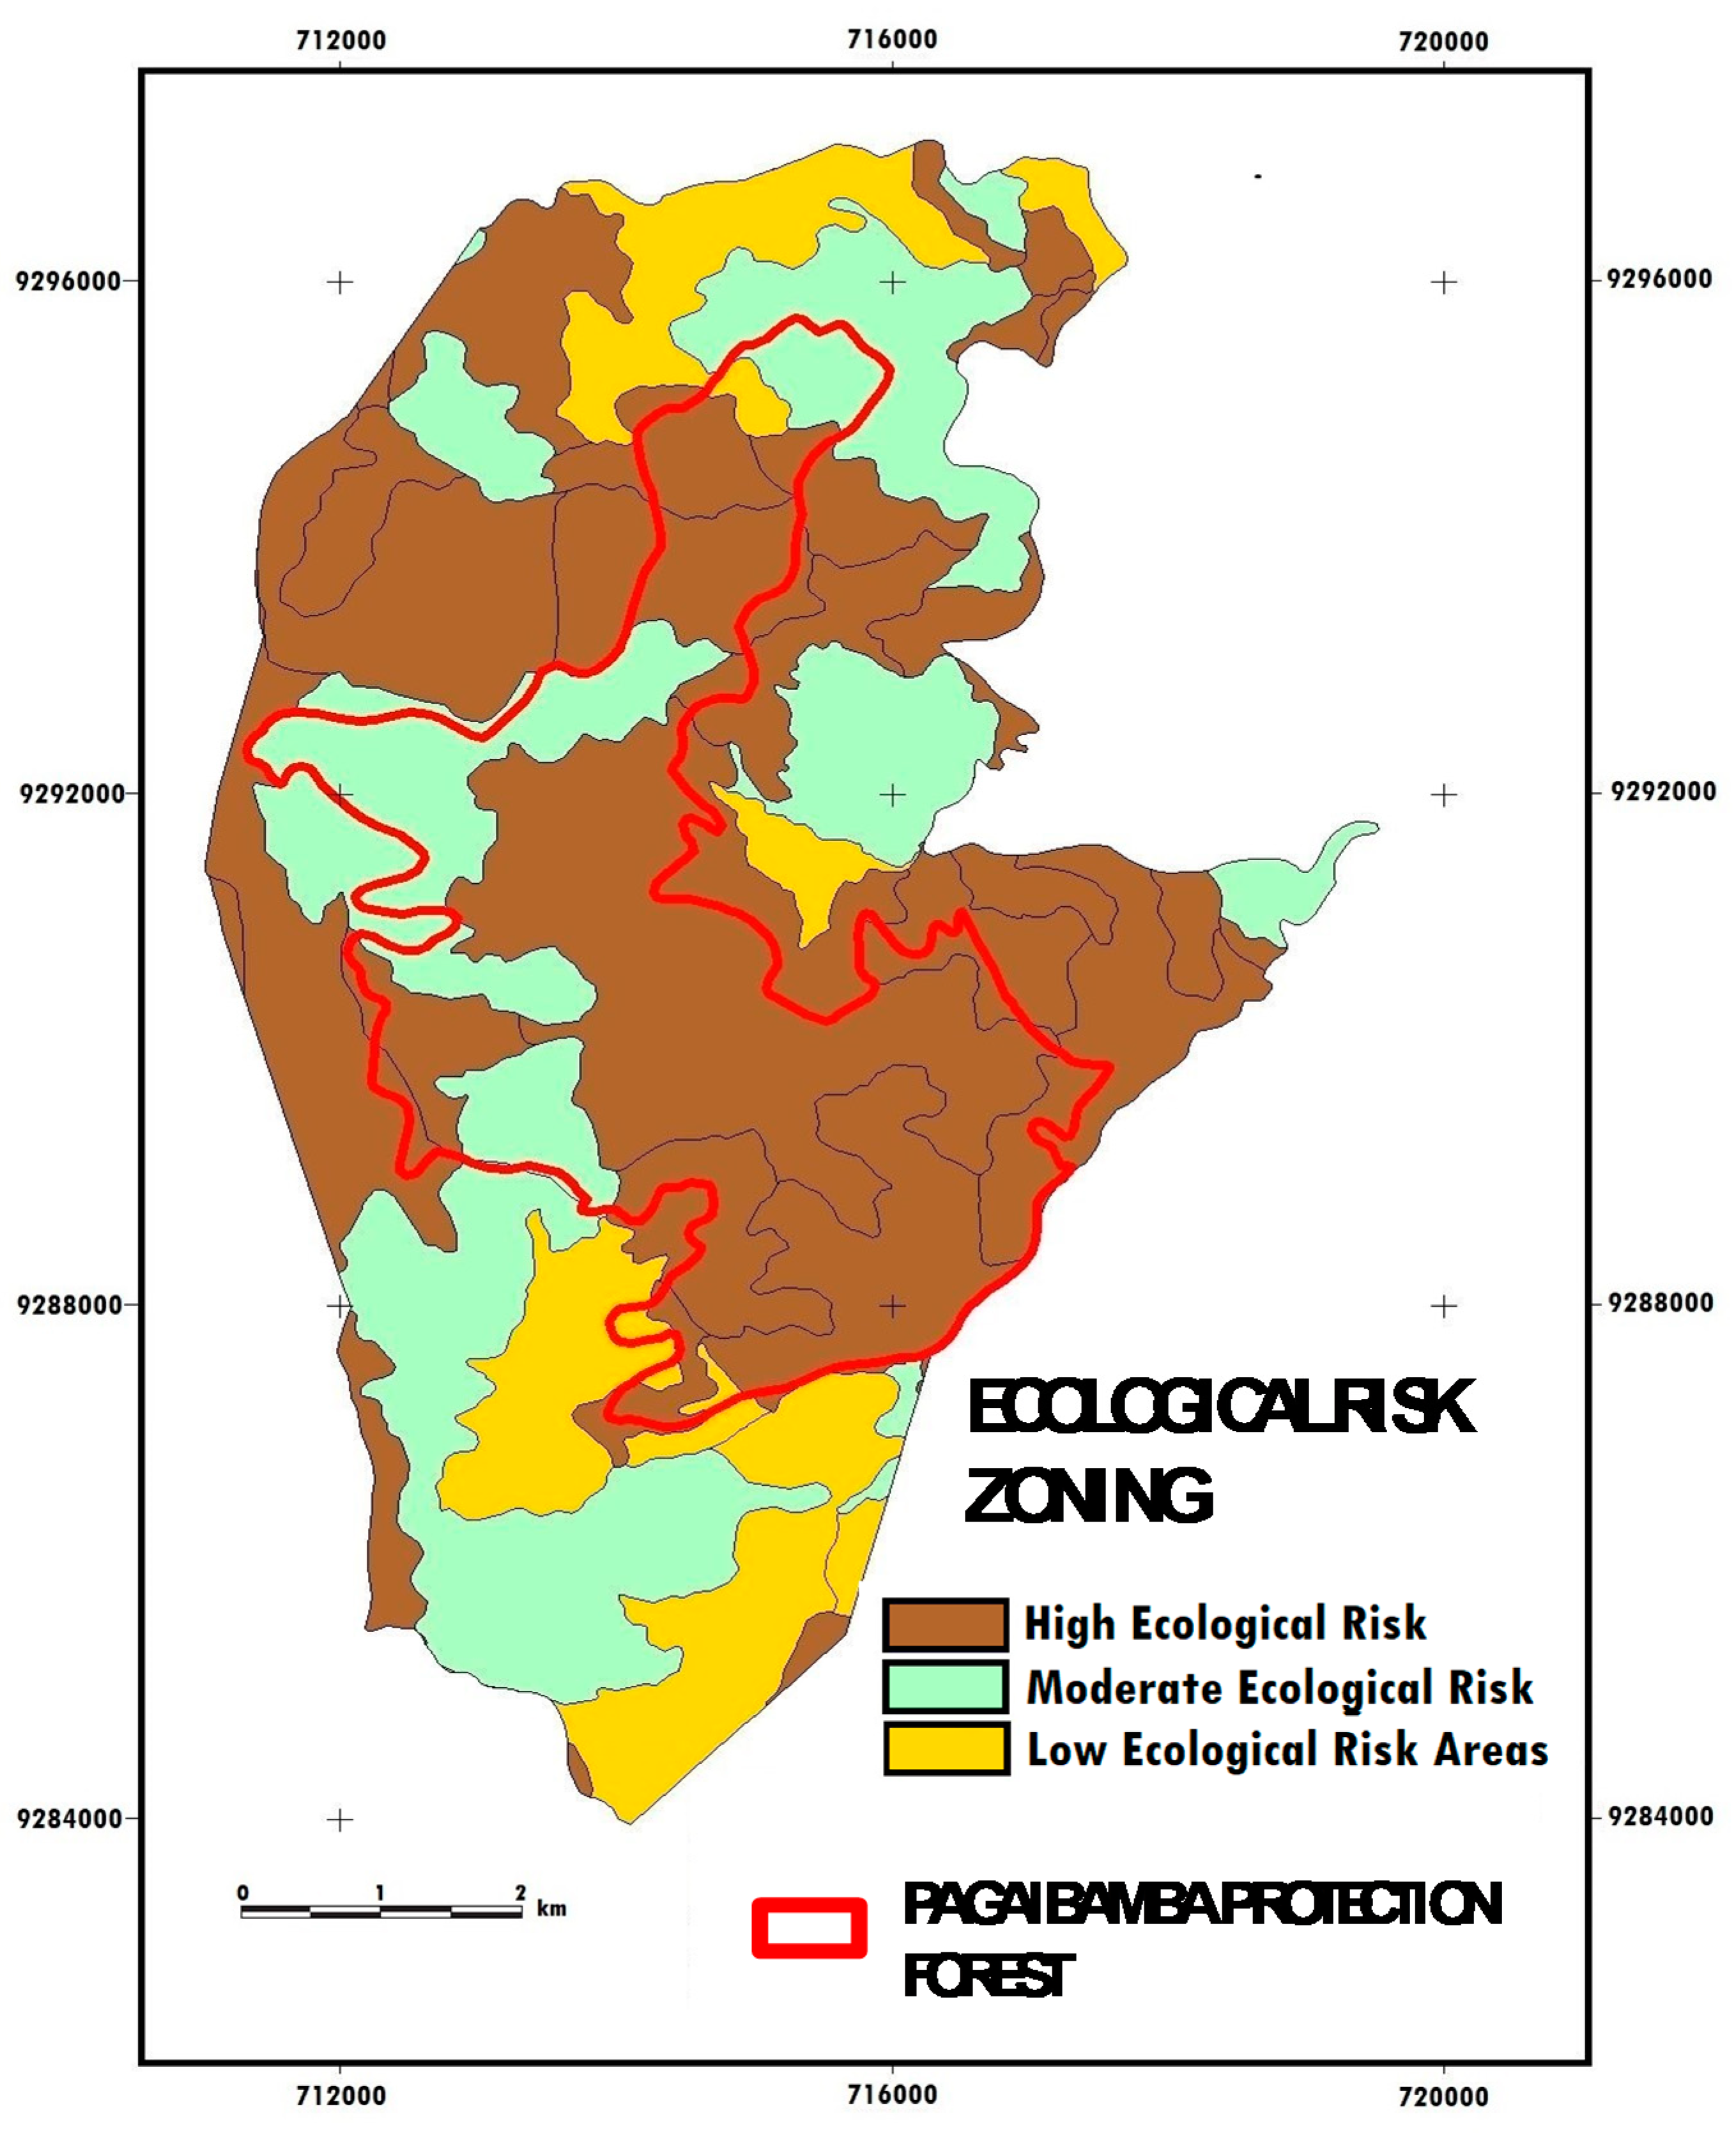
3.5. Determination of Risk Zones and Ecological Protection

The ecological risk and protection zones of the PNA and the BZ of the PPF are indicated in Table 3 and in Figure 6. Where it is observed that the lands of high and very high vulnerability dominate the agroecological scenario, grouping mostly lands of high agrological quality (Table S6, Figure 3). They are located on steep or very steep mountain slopes, with slopes of 25–75%; which represent 85% of the PNA compared to 54.4% of the BZ (Table 1 and Table 2). As can be seen in Table 3, 85% and 54.4% of the total PNA and BZ are considered high risk, respectively, and therefore classified as high and very high vulnerability (Figure 6), 13% of the PNA and 30% of the BZ are considered to be of moderate-risk and therefore of medium vulnerability, and 2% of the PNA and 15.4% of the BZ of low risk and therefore of low vulnerability (Table 3). Their qualification has focused on the agrological quality of the lands involved, their ecological value, as well as their vulnerability (Table 1 and Table 2).

4. Discussion

This research contributes to the existing literature in several ways. To our knowledge, this is the first study that presents a multidisciplinary method that combines field measurements and observations, remote sensing, and geographic information systems to determine the level of vulnerability, considering the characterization and identification of risk zones and ecological protection of the Pagaibamba Protected Forest in Peru. The results confirm a greater susceptibility of the ANP compared to the BZ due to their intense exposure to climatic and topographic factors.
The role of PNAs in maintaining biodiversity and territorial balance acquires importance in the current global context of climate change. The PNAs are not isolated spaces in the territory that can be planned and managed as a particular and limited case, but natural spaces closely linked to their environment [13,14,15]. Most of these PNAs protect ecosystems of biological, social, and economic importance. The size, location, and continuity of these appear to be insufficient from the perspective of the protection of many of these ecosystems [47,48], being essential to maintaining the intangibility of the PNAs. To identify these areas, the study of the climate, life zones, lithology, physiography, soil, the capacity for using land, etc., have been taken into account. As far as possible, some more appropriate management practices are proposed to prevent deterioration [42], which is a priority.

4.1. Main Risk Zones Identified and Categorized in Pagaibamba Protection Forest

Our study identified three main ecological risk and protection zones within the PPF, characterized based on their ecological value, productive aptitude, and vulnerability. The zone of high risk and ecological protection covers the largest extension of the PPF, representing 85% of the PNA and 54% of the BZ (Table 3, Figure 6) and includes the lands of very high and high vulnerability (Table 1 and Table 2).
In the PNA and the BZ, Soil 1 and Soil 3 are characteristic, respectively, which generate a high susceptibility to erosion in both areas, with the formation of frequent gullies in clay and loamy materials [49]. The problem increases in the PNA, as these soils are spread over steep slopes with slopes of 50–75% [50].
They are areas with very rugged topography, subject to a very high potential for water erosion, and of high agrological quality (Table S6, Figure 3). They are covered by scrub and humid mountain forest, still in its natural state of conservation, due to which they fulfill the role of protecting the soil from the direct impact of raindrops, reducing the disaggregation and transport capacity of runoff [51]. They also exert a process of holding the soil by the roots of the plants [52] and constitute an adequate refuge for wild fauna [29,53].
This zone comprises two units. The first unit is protection and conservation. Although it has a natural vegetation cover, it is unsuitable for agricultural purposes, as it presents very severe limitations, such as rocky outcrops, high hills with steep slopes, etc. Its use would correspond to the protection of watersheds and wildlife, recreational purposes, and others that imply some collective benefit or social interest [54]. The second unit is forest production. It is the group land that is not suitable for any agricultural activity, being relegated to forestry exploitation and production.
Regarding the zone of moderate-risk and ecological protection (Table 3 and Figure 6), this unit is considered as a livestock exploitation zone. The use of these lands should be oriented toward the conservation and protection of natural resources, with emphasis on the preservation of the vegetation cover, essential to controlling natural erosion processes, as well as for the promotion of the regeneration of the natural vegetation of the area. Finally, the low-risk and ecological protection areas (Table 3, Figure 6), due to their characteristics, can be used for agricultural activities, also for other uses following social interest policies, under the principles of sustainable use [54,55].

4.2. Activities for the Conservation and Protection of PPF Buffer Zone

Since the main objective of the BZs is to minimize the negative impact of human activities within the PNA, the activities and uses of these areas must be subject to strict regulations that avoid putting them in danger. In this way, the conservation of natural resources is ensured, and the protection of many ecosystems is safeguarded. In addition to the water resources provided by these areas. We must emphasize that the need to carry out conservation and protection agricultural practices is focused only on the Buffer Zone, not on the Protected Natural Area of the Pagaibamba Protection Forest. Considering that it is essential to maintaining the intangibility of these natural areas, which due to their conditions, deserve extraordinary respect and cannot and should not be used or modified in any case.
From the point of view of environmental conservation (Figure 7), in the areas where it is possible to install crops (0.82% of the BZ; Tables S5 and S7), importance should be given to native or introduced species adapted to the ecological zone (Table S8) [55,56]. These are essential to establishing socio-economically and environmentally sustainable agriculture [42,57], on land suitable for permanent crops that are not suitable for periodic and continuous soil removal (15% of the BZ; Tables S5 and S7). It would be convenient to install permanent crops (herbaceous, shrubby, or arboreal) as well as forages, under economically accessible techniques for local farmers without deterioration of the productive capacity of the soil or alteration of the hydrological regime of the basin (Table S9) [54,55].
In the areas of livestock use, 30% of the BZ (P3se, P3se(t)) (Tables S5 and S7), it would be convenient to produce natural pastures or cultivated with direct sowing, correcting the low fertility with the use of organic matter, which allows continuous or temporary grazing without deterioration of the soil resource, taking advantage of the residues of the agricultural exploitation. It is also convenient to use controlled or rotational grazing practices to avoid soil compaction (especially in the rainy season), in this way, the soil is left to rest, and the regrowth of the meadows is improved. Another appropriate practice would be the silvopastoral systems implementation and others that we suggest in Table S9 [54,56,58,59].
The forestry production areas, 31% of the BZ (Tables S5 and S7), due to the fragility of the soils (steep slope, texture, weak structure, low content of organic matter), group together those lands that, due to their severe limitations, are not suitable for any type of agricultural activity, by fundamentally relegating to forest use and production. They require complex conservation practices, such as the planting of tree and shrub species (following the contour lines), and the planting of live barriers to control soil erosion. These living barriers will protect the soil from climatic phenomena and help retain the sediments from being washed away by rains, favoring the protection and conservation of biological diversity, without forgetting the revegetation of slopes to maintain soil stability and geological structure, and other practices that we indicate in soil and geological structure (Table S9), seeking, as far as possible, a better use and management of these resources under the physical reality of the environment, avoiding deforestation [54,55,56,60]. The conservation of its biodiversity and the mitigation of the negative impact of climate change will depend on the protection of forests. Native species plantations should be preferred to exotic plantations, due to their inherent capacity to host biodiversity [17,22,61,62]. Planting native species ensures that they do not disappear, their study being necessary for optimal use of resources [17,48].
Considering this problem and for preserving these areas, we propose some native species that can serve to conserve these forests (Table S8).
The protection and conservation zones (24% of the BZ; Tables S5 and S7) group the lands that are characterized by their very severe to extreme limitations (climatic, edaphic, topographic, etc.), which are inappropriate for agricultural purposes and even for forestry purposes, and their use is not economic and they should be managed for the protection of hydrographic basins, wildlife, research, etc. On Hillsides and areas with steep slopes, it is important to implement the installation of live barriers at contour lines using native forest species [3,54,56,60,63].

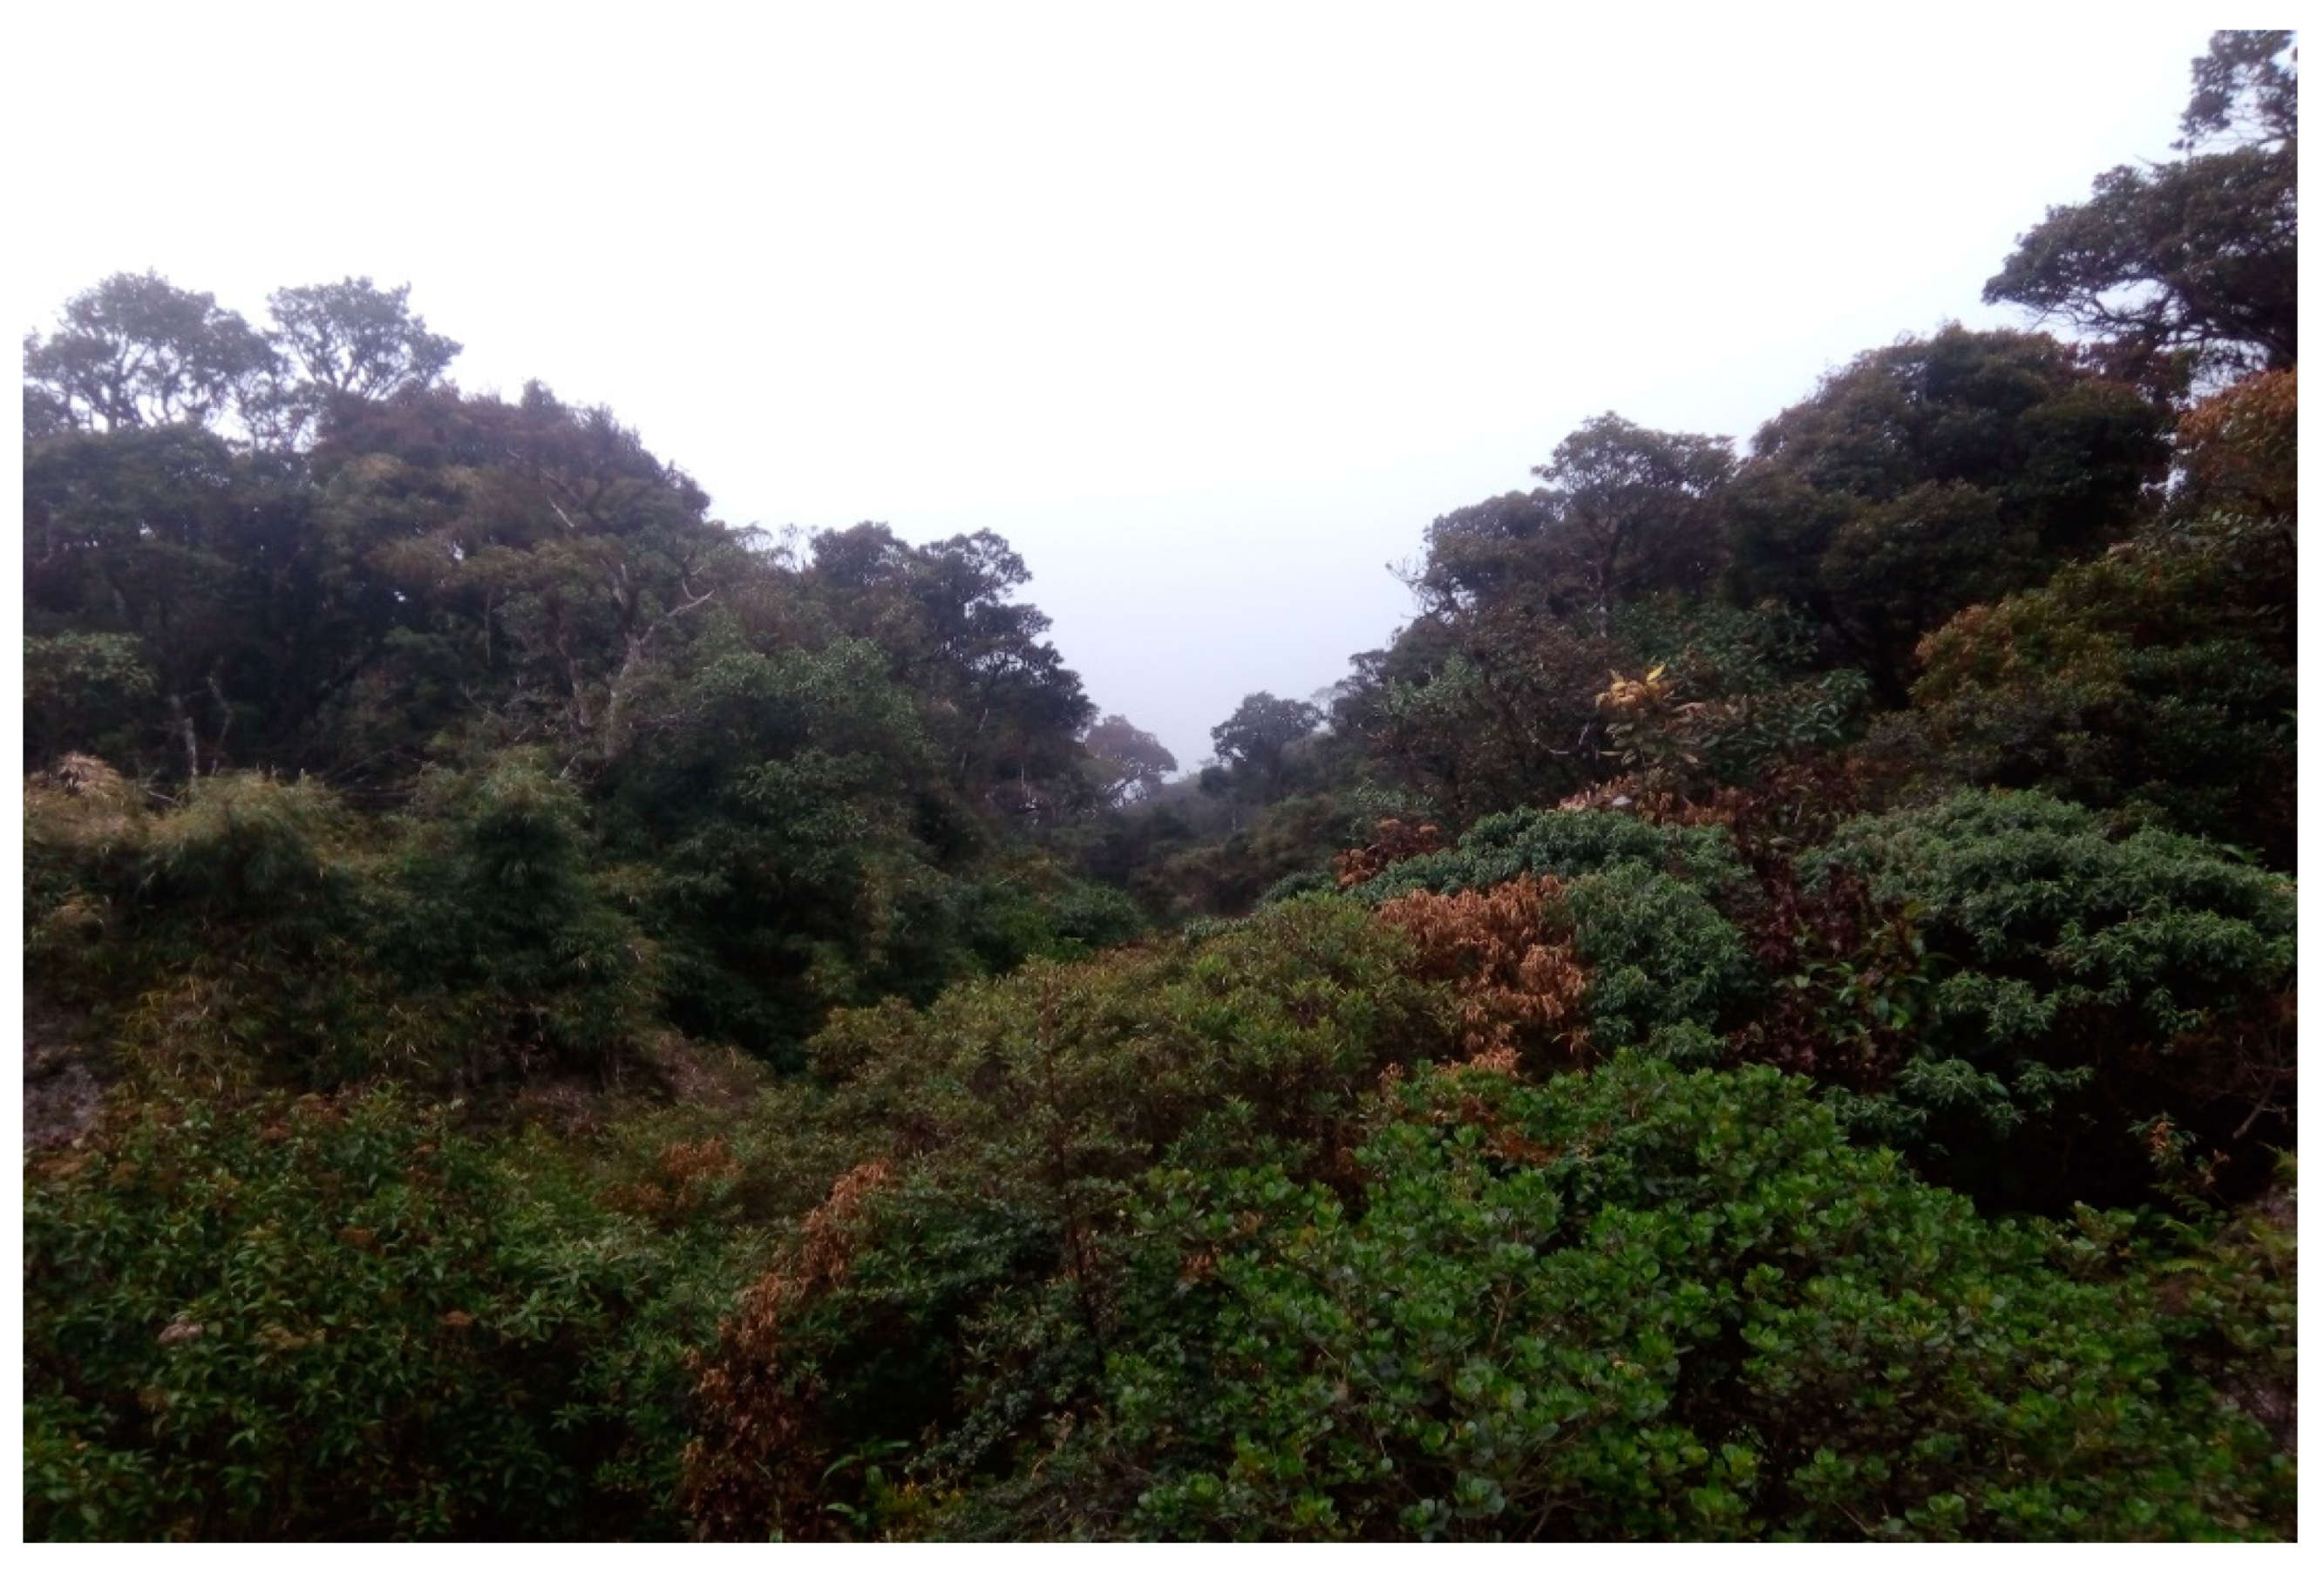
4.3. Why Is It Important to Maintain the Montane Forest Ecosystem in the PPF

The Tropical Montane Forests (TMF), particularly the humid ones (Tropical Montane Cloud Forest), are home to the highest concentration of species with restricted distribution areas in South America [64,65]. This characteristic is manifested in the high number of flora and fauna endemism [29,66,67]. The conservation of the montane forests of the tropical Andes is a priority, due to their great biodiversity and high level of endemicity [48,67,68]. However, they are one of the least known and most threatened ecosystems in the tropics [62,69], because of high rates of deforestation and degradation. The ecological research works on these forests are fewer at the national level [62] and scarce at the regional level [70].
Within the PPF, we have the Tropical Montane Cloud Forest (TMCF) (Figure 8) and the Tropical Lower Montane Cloud Forest (TLMCF). They are unique ecosystems that host a wide variety of highly specialized organisms, often adapted to foggy conditions [48,64,65,67,71,72,73]. These forests comprise a complex of physiognomically different biological forms. It is dominated by trees between 6 and more than 35 m tall and undergrowth with an abundance of lichens, mosses, and herbaceous plants [29]. The main water inlet is the precipitation, but also receives additional inputs by interception of fog and wind-borne rain. Vegetation is key in this process, with evergreen tree species (Table S8) helping accomplish this task [17,29,64,65,71]. Zones are considered of utmost importance for providing hydrological services, which gives it a connotation of hydrological hierarchy [72,74].

4.4. Endemic Flora and Fauna Species That Protect the Montane Forests of the PPF

Of the 5509 plants species endemic to Peru, 948 are typical of the Department of Cajamarca, of which 296 endemic species are exclusive to this region and are the montane cloud forests, jalcas, and páramos of the PPF, which contain these unique genetic resources [29,48]. In addition, the PPF provides refuge to a total of 110 species of birds [29]. Of these species, 29 are registered as CITES II type species. An endemic species of the Andes has been found in a very vulnerable situation, the “bearded turkey” Penelope barbata, both for the IUCN (2017) [75], and for the Wild Fauna and Flora Protection laws (Supreme Decree 004-2014—MINAGRI) [76]. Among the species of mammals in danger of extinction to consider, are the “puma” Puma concolor, the “Andean tapir” Tapirus pinchaque, the “tiger” Leopardus pardalis, the “spectacled bear” Tremarctos ornatus among others.

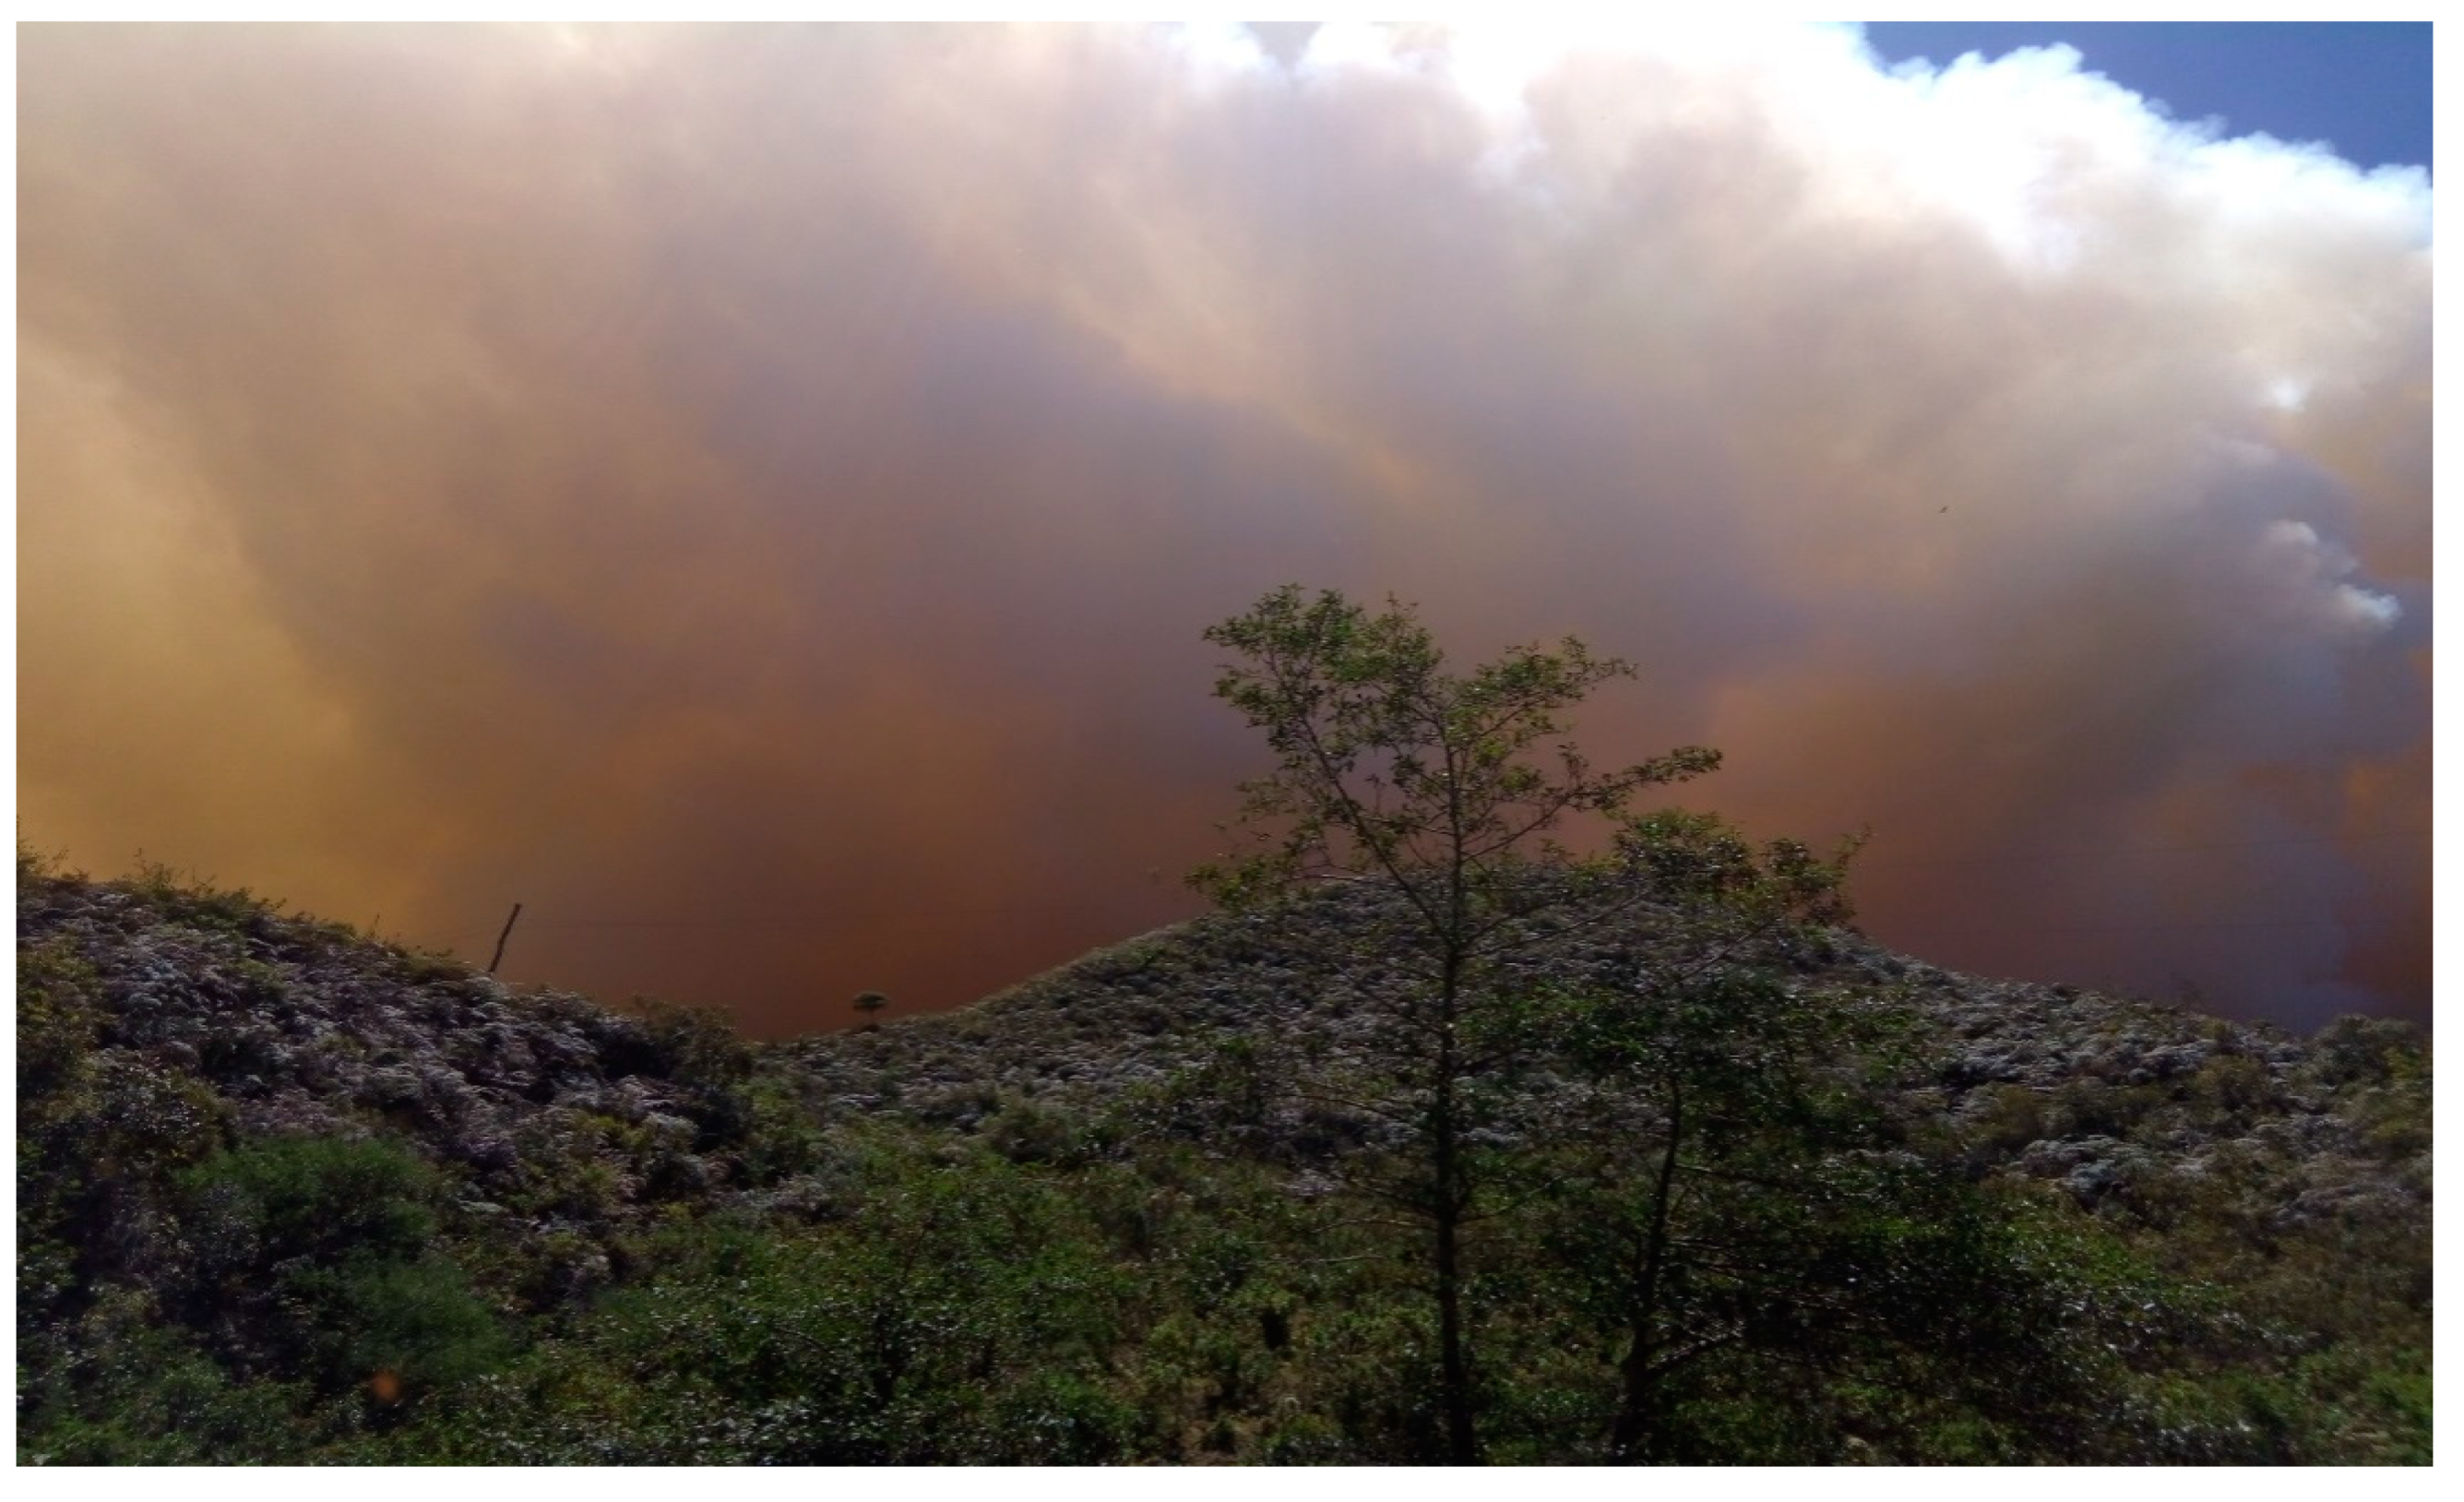
4.5. Changes in Land Use Natural and Man-Made Threat

In addition to the danger of climate change, there are serious natural and anthropic threats that are affecting the ecosystems of the cloud forests ((TMCF and TLMCF), as well as the dry forest (TLMDF) of the PPF, such as the loss of habitats due to the illegal logging, burning, opening of bridle paths, itinerant agriculture, overgrazing (Figure 9), lack of good forest management and conservation, excessive hunting, and illegal trafficking of wild species.
At this point, we must consider some highlights by establishing the criteria for zoning the study area, considering its ecological value, productive aptitude, and levels of vulnerability. Our study confirms that the largest extension of the Pagaibamba Protection Forest corresponds to lands of very high and high vulnerability (>85% of the PNA and 54% of the BZ), and of high ecological risk. Areas located for the most part on mountain slopes, which present severe edaphic and topographic limitations, are not suitable for agricultural activities.
We must also highlight the fundamental need to maintain the intangibility of the PNA, which must be protected and not used under any circumstances. It is recommended that 54% of the BZ be used for conservation or forest production, following the guidelines recommended in Table S9. In zones of moderate ecological risk (30% of the BZ), we recommend the application of systems of controlled grazing and pasture rotation, to favor their regeneration by improving soil cover, avoiding compaction, and overgrazing. For low-risk areas (15% of the BZ) it would be convenient to adapt them to agrosilvopastoral systems, due to their enormous potential to improve soil fertility.
Our findings have important implications when determining the areas of high vulnerability where intervention is a priority. It should be noted that, although the level of threats varies in different areas, livestock, deforestation for agriculture, timber extraction and fragmentation, are the main threats that loom over the PPF and especially in the ecosystems of cloud forests, considered the most vulnerable. Furthermore, climate change could hurt the water balance of the forests TMCF, TLMCF, TLMDF, of the PPF. Changes in temperature and in precipitation patterns could negatively affect the cycle and availability of water and would be harmful to both plant and animal communities since many of them have limited adaptation. It is a priority within regional development programs, the educational aspect of the inhabitants (awareness, training) on the conservation and protection of these areas, to identify threats and avoid future disasters, considering an effective strategy in development planning, and in the management of these vulnerable zones, Table S9.

5. Conclusions

In the Pagaibamba Protection Forest, 54% of the lands of the Protected Natural Area are considered very high vulnerability, while in the Buffer Zone only 23% are very high vulnerability lands. Eighty-five per cent of the lands in the Protected Natural Area and 54% of the lands in the Buffer Area are within the High Risk and Ecological Protection Zone. The lands located within the Low Risk and Ecological Protection Zone represent 2% of the lands in the Protected Natural Area and 15% in the Buffer Area. The use of GIS was of great importance for the spatial analysis of the cartography generated during the process of establishing the Hazard Zoning and Ecological Protection map, especially due to the large amount of information that overlap implies cartographic variables.
The Pagaibamba Protected Forest is home to a high biological diversity and a large proportion of endemic species; many species in danger of extinction and many still unknowns to science, in terms of their properties and potential uses. The hydrological function of these tropical Montane Forests, especially in the Tropical Montane Cloud Forest, is very important due to their role in the stable supply of water to their surroundings, therefore soil conservation and protection of slopes against erosion are fundamental. Potential threats such as climate change can negatively affect the cycle and availability of water since many sources originate in the PPF, which make its protection urgent to guarantee the supply of water to the communities that use water as a resource.

Supplementary Materials

The following supporting information can be downloaded at: https://www.mdpi.com/article/10.3390/f13030436/s1, Table S1: Categories of the National System of Land Use Capability Classification (LUCC); Table S2. Physiographic and Surface Units of the Pagaibamba Protection Forest; Table S3. Soil Classification in the Pagaibamba Protection Forest; Table S4. Soil units of the Pagaibamba Protection Forest; Table S5. The National System of Land Use Capability Classification of the Pagaibamba Protection Forest; Table S6. The ecological value of the lands of the Pagaibamba Protection Forest; Table S7. The productive aptitude of the Pagaibamba Protection Forest; Table S8. Native tree species in the Pagaibamba Protection Forest. Important in reforestation programs; Table S9. Agricultural Practices in the Conservation of Risk Zones within the Buffer Zones of the Pagaibamba Protection Forest.

Author Contributions

M.A.E.-M., conceptualization, methodology, software, validation, formal analysis, investigation, data curation, writing original draft preparation, visualization, writing, review and editing, project administration; S.A., project administration; validation, supervision, formal analysis, funding acquisition, writing, review and editing; M.V.R., project administration; formal analysis, data curation, visualization, validation; M.F.E.-M., project administration, visualization, writing, review and editing; J.P.-R., writing, review and editing. L.F.G.-L., visualization, validation; R.M.P., methodology, software, formal analysis, validation, data curation, visualization. All authors have read and agreed to the published version of the manuscript.

Funding

This research received no external funding.

Institutional Review Board Statement

Not applicable.

Informed Consent Statement

Not applicable.

Data Availability Statement

Not applicable.

Acknowledgments

We are grateful to the staff of Chemistry Department of the Burgos University. We would like to especially thank Carmen Escobedo Monge and Abudemio Calvo Calvo for their technical support in the preparation and presentation of this article.

Conflicts of Interest

The authors declare no conflict of interest.

References

  1. Morgan, R.P.C. Soil Erosion and Conservation, 2nd ed.; Longman Group and J. Wiley & Sons: Essex, UK, 1997; p. 198. [Google Scholar]
  2. Oldeman, L.R. The Global Extent of Soil Degradation. In Soil Resilience and Sustainable Land Use; Greenland, D.J., Szabolcs, I., Eds.; CAB International: Wallingford, UK, 1994; pp. 99–118. [Google Scholar]
  3. FAO; ITPS. The Status of the World’s Soil Resources (Main Report); Food and Agriculture Organization of the United Nations: Rome, Italy, 2015; Available online: https://www.fao.org/3/i5199e/I5199E.pdf (accessed on 7 January 2022).
  4. Regoyos Sáinz, M. Metodología Para la Evaluación de la Erosión Hídrica Con Modelos Informáticos. Aplicación del Modelo Geowepp a dos Pequeñas Cuencas en Madrid. Ph.D. Thesis, Universidad Politécnica de Madrid, ETSIA, Madrid, Spain, 2003; p. 466. [Google Scholar]
  5. Bathurst, J.C.; Moretti, G.; El-Hames, A.; Beguería, S.; García-Ruiz, J.M. Modelling the impact of forest loss on shallow landslide sediment yield, Ijuez river catchment, Spanish Pyrenees. Hidrol. Earth Syst. Sci. 2007, 11, 569–583. [Google Scholar] [CrossRef]
  6. Valle, R.S. Las Áreas Naturales Protegidas en México. Un Ejemplo de Propuesta de Gestión de un Área Protegida y Plan de Manejo en “La Sierra de Monte Escobedo” (Zacatecas, México). Ph.D. Thesis, Universitat Autónoma de Barcelona, Barcelona, Spain, 2006. [Google Scholar]
  7. MINAM. Patrimonio Forestal a Nivel de Grandes Paisajes. Región Amazónica. Informe I. Ministerio del Ambiente. Vice-Ministerio de Desarrollo Estratégico de Recursos Naturales; Dirección General de Evaluación, Valoración y Financiamiento del Patrimonio Natural: Lima, Perú, 2009. [Google Scholar]
  8. DPOUT. Dirección Provincial de Ordenamiento Urbano y Territorial. Sistemas de Información Geográfica para el Ordenamiento Territorial. Subsecretario de Urbanismo y Vivienda; Ministerio de Infraestructura: Buenos Aires, Argentina, 2011; p. 94. [Google Scholar]
  9. Eastman, J. IDRISI Taiga Guide to GIS and Image Processing; Clark Labs, Clark University: Worcester, MA, USA, 2009. [Google Scholar]
  10. Valdez, M.E.; Mireles, P.; Orozco, M.E. Aplicación de los Sistemas de Información Geográfica para Ordenamientos Ecológicos en Áreas Naturales Protegidas. Rev. Geográfica América Cent. 2011, 2, 1–19. [Google Scholar]
  11. Ranjan, A.K.; Vallisree, S.; Singh, R.K. Role of Geographic Information System and Remote Sensing in Monitoring and Management of Urban and Watershed Environment: Overview. J. Remote Sens. GIS 2016, 7, 1–14. [Google Scholar]
  12. CONANP. 100 Años de Conservación en México. Áreas Naturales Protegidas 1917–2017. Comisión Nacional de Áreas Naturales (CONANP) Secretaría de Medio Ambiente y Recursos Naturales. Primera Edición. Ejército Nacional 223, Miguel Hidalgo, México. 2018. Available online: https://www.conanp.gob.mx/pdf/100AñosConservación.pdf (accessed on 8 January 2022).
  13. SERNANP. Análisis de la Vulnerabilidad de las Áreas Naturales Protegidas Frente al Cambio Climático al 2030, 2050 y 2080. Servicio Nacional de Áreas Naturales Protegidas por el Estado—SERNANP; World Wildlife Fund, WWF: Lima, Perú, 2015; p. 87. Available online: http://sis.sernanp.gob.pe/biblioteca/index.jsp?publicacion=595 (accessed on 7 January 2022).
  14. Sherbinn, A.; Freudenberger, M. Migration to protected areas and buffer zones: Can western the tide? PARKS 1998, 8, 38–53. [Google Scholar]
  15. Muñoz, F.; Navarro, R. El Empleo de Sensores Remotos Como Herramienta Para la Generación de Cartografía de Usos del Suelo en el Entorno de Áreas Naturales Protegidas: Aplicación al Bosque de Protección de Alto Mayo y su Zona de Amortiguamiento(Perú). In Las Zonas de Amortiguamiento: Un Instrumento Para el Manejo de la Biodiversidad. El Caso de Ecuador, Perú y Bolivia; Blanes, J., Navarro, R., Drehwald, U., Eds.; Comisión Europea: Bruselas, Bélgica, 2003; pp. 215–234. [Google Scholar]
  16. MINAG. Ley de Áreas Naturales Protegidas, Ley 26834; Congreso de la República del Perú: Lima, Peru, 1997. [Google Scholar]
  17. SERNANP. Plan Maestro del Bosque de Protección Pagaibamba 2017–2021; Servicio Nacional de Áreas Naturales Protegidas por el Estado (SERNANP): Cajamarca, Perú, 2017; p. 70. [Google Scholar]
  18. Díaz, R.; Miranda, J. Áreas Naturales Protegidas en el Perú: Efectos Sobre la Deforestación y su Relación con el Bienestar de la Población Amazónica; IEP, Instituto de Estudios Peruanos: Lima, Peru, 2012; p. 46. [Google Scholar]
  19. SERNAMP. Servicio Nacional de Áreas Naturales Protegidas por el Estado. 2013. Available online: https://www.sernanp.gob.pe (accessed on 6 June 2021).
  20. GEO-ANP. Información Geográfica de las Áreas Naturales Protegidas del Peru. 2021. Available online: https://www.gob.pe/8532geo-anp (accessed on 7 June 2021).
  21. Zonas Reservadas. 2020. Available online: https://www.sernanp.gob.pe/el-sinanpe (accessed on 24 December 2021).
  22. SERNANP. 2017. Available online: http://www.sernanp.gob.pe/de-pagaibamba (accessed on 19 April 2021).
  23. Hansen, A.J.; Piekielek, N.; Davis, C.; Haas, J.; Theobald, D.M.; Gross, J.E.; Monahan, W.B.; Olliff, T.; Running, S.W. Exposure of U. S. National Parks to land use and climate change 1900–2100. Ecol. Appl. 2014, 24, 484–502. [Google Scholar] [CrossRef] [PubMed]
  24. IIAP. Zonificación Ecológica Económica de la Cuenca del Río Aguaytía. Cap 5 Potencial y Limitaciomes del Territorio y de sus Recursos Naturales; Instituto de Investigación de la Amazonía Peruana: Iquitos, Peru, 2000. [Google Scholar]
  25. UNDRO. Preliminary Study on the Identification of Disaster-Prone Countries Based on Economic Impact; United Nations Disaster Relief Organisation: New York, NY, USA; Geneva, Switzerland, 1990. [Google Scholar]
  26. MINAM. Memoria Descriptiva del Mapa de Vulnerabilidad Física del Peru. Ministerio del Ambiente (MINAM). Viceministerio de Gestión Estratégica de Recursos Naturales. Dirección General de Ordenamiento Territorial; Equipo Técnico de Vulnerabilidad: Lima, Peru, 2011; Available online: https://repositoriodigital.minam.gob.pe/handle (accessed on 18 February 2021).
  27. Senamhi. Servicio Nacional de Meteorología e Hidrología del Peru. 2014. Available online: http://www.senamhi.gob.pe (accessed on 24 March 2021).
  28. Holdridge, L.R. Life Zone Ecology; Tropical Science Center: San José, Costa Rica, 1967; p. 210. [Google Scholar]
  29. Roncal, M.R. Bosque de Protección Pagaibamba. Estudio de línea Base. Línea Base de Flora y Fauna del Bosque de Protección Pagaibamba. Gobierno Regional de Cajamarca. Prov. Chota; Departamento de Cajamarca: Cajamarca, Peru, 2018; p. 224. Available online: https://siar.regioncajamarca.gob.pe/documentos/linea-base-flora-fauna-bosque-proteccion-pagaibamba-marco-proyecto (accessed on 3 June 2021).
  30. IGN. Instituto Geográfico Nacional. Gobierno del Peru. 2013. Available online: https://www.gob.pe/ign (accessed on 13 January 2021).
  31. INGEMMET. Instituto Geológico Minero y Metalúrgico del Peru. Available online: https://www.gob.pe/ingemmet (accessed on 23 December 2021).
  32. IDERC. Infraestructura de Datos Espaciales Regionales de Cajamarca; Gobierno Regional de Cajamarca: Cajamarca, Peru, 2016; Available online: https://www.geoidep.gob.pe/gobierno-regional-cajamarca (accessed on 23 December 2021).
  33. GORECajamarca. Gobierno Regional Cajamarca: Cajamarca, Peru, 2016. Available online: https://www.regioncajamarca.gob.pe (accessed on 24 December 2021).
  34. MINAGRI. Ministry of Agriculture and Irrigation at Present MIDAGRI, Ministry of Agrarian Development and Irrigation. 2014. Available online: https://www.limaeasy.com/peru-guide/business-guide-peru/peruvian-ministries/ministry-of-agrarian-development-and-irrigation-midagri (accessed on 28 May 2021).
  35. INRENA. Instituto Nacional de Recursos Naturales ahora Ministerio de Desarrollo Agrario y Riego. MIDAGRI. Available online: https://siea.midagri.gob.pe/portal/ (accessed on 30 November 2021).
  36. GeoIDEP. Información del IDEP. Infraestructura de Datos Espaciales del Peru (IDEP). 2014. Available online: https://www.geoidep.gob.pe/ign (accessed on 19 June 2021).
  37. WMS. Web Map Service. Servicios WMS para Visualizar Mapas. Visor de la IDEP. Gobierno del Peru. 2015. Available online: https://www.geoidep.gob.pe/servicios-idep/catalogo-nacional-de-servicios-web (accessed on 23 December 2021).
  38. Villota, H. El Sistema CIAF de Clasificación Fisiográfica del Terreno. Rev. CIAF 1992, 13, 55–70. [Google Scholar]
  39. Alcántara, G.H. Fisiografía del departamento de Cajamarca; Gobierno Regional de Cajamarca: Cajamarca, Peru, 2011; p. 28. [Google Scholar]
  40. United States Department of Agriculture. Natural Resources Conservation Service: Division of Soil Survey. Soil Survey Manual. In USDA Handbook 18; United States Department of Agriculture: Washington, DC, USA, 2017; p. 593. [Google Scholar]
  41. Soil Survey Staff. Keys to Soil Taxonomy, 12th ed.; USA Department of Agriculture Natural Resources Conservation Service: Washington, DC, USA, 2014; p. 340. [Google Scholar]
  42. MINAG. Reglamento de Clasificación de Tierras; D.S 017-2009-AG; Gobierno del Peru: Lima, Peru, 2009. [Google Scholar]
  43. Rodríguez, E.M. GIS Techniques Potential for Environmental Management: An Application to Erosion Assessment. Rev. Electrónica Medioambiente 2007, 5, S76. [Google Scholar]
  44. Nagata, S.M. Los Sistemas de Información Geográfica SIG. Una Herramienta en la Gestión del Espacio Propuesta un Mapa de Aptitud de Suelos en la Cuenca Hidrográfica del Colca. Arequipa, Peru. 1996. Available online: http://Dialnet-LosSistemasDeInformaciónGeográficaSIG-5339434%20 (accessed on 10 April 2021).
  45. Rigaux, P.; Scholl, M.; Voisard, A. Spatial Data Base with Applications to GIS; Morgan Kaufmann Publishers: Burlington, MA, USA, 2002; p. 440. [Google Scholar]
  46. MINAM. Guía de Evaluación del Estado de Ecosistemas de Bosque Seco: Bosque Estacionalmente Seco de Llanura y Bosque Estacionalmente Seco de Colina y Montaña. Ministerio del Ambiente (MINAM). Viceministerio de Desarrollo Estratégico de los Recursos Naturales; Dirección General de Ordenamiento Territorial Ambiental (DGOTA) Dirección de Monitoreo y Evaluación de los Recursos Naturales del Territorio: Lima, Peru, 2019; p. 60. Available online: https://sinia.minam.gob.pe/documentos/guia-evaluacion-estado-ecosistemas (accessed on 18 February 2021).
  47. López, M.J.; Bertoni, M.; Testa, J. Importance of natural protected areas in coastal tourism in Province of Buenos Aires. FACES 2012, 38–39, 173–189. [Google Scholar]
  48. Sánchez, I.; Sánchez, A. La Diversidad Biológica en Cajamarca, 1st ed.; Proyecto Determinación del Potencial de la Biodiversidad Regional de Cajamarca: Cajamarca, Peru, 2012; p. 208. [Google Scholar]
  49. Mararakanye, N.; Sumner, P.D. Gully erosion: A comparison of contributing factors in two catchments in South Africa. Geomorphology 2017, 288, 99–110. [Google Scholar] [CrossRef] [Green Version]
  50. Paino, M.; Rienzi, E.A. Erosión Hídrica y Selectividad en Cultivos en Contorno en un Suelo de Textura Franco-Limosa; Cátedra de manejo y Conservación de Suelos de la UBA: Buenos Aires, Argentina, 2008; p. 37. [Google Scholar]
  51. Liu, Y.F.; Liu, Y.; Shi, Z.H.; Lopez-Vicente, M.; Wu, G.L. Effectiveness of re-vegetated forest and grassland on soil erosion control in the semi-arid Loess Plateau. Catena 2020, 195, 104787. [Google Scholar] [CrossRef]
  52. Li, Q.; Liu, G.B.; Zhang, Z.; Tuo, D.F.; Bai, R.R.; Qiao, F.F. Relative contribution of root physical enlacing and biochemistrical exudates to soil erosion resistance in the Loess soil. Catena 2017, 153, 61–65. [Google Scholar] [CrossRef]
  53. Rodríguez, D.; D’Elía, G.; Ortega, H.; Aguilar, C. Taxonomic evaluation of the marsupial frog Gastrotheca peruana (Amphibia: Hemiphractidae) based on mitochondrial 16S rRNA gene. Rev. Peru. Biol. 2019, 26, 461–468. [Google Scholar] [CrossRef] [Green Version]
  54. FAO. Guía de Buenas Prácticas Para la Gestión y uso Sostenibles de los Suelos en Áreas Rurales. 2018. Available online: http://www.fao.org/3/i8864es/I8864ES.pdf (accessed on 18 April 2021).
  55. Escobedo Torres, R.; Rabanal Rosillo, H. Capacidad de uso Mayor de las Tierras. Diagnóstico y Plan de Ordenamiento Territorial en el Ámbito del Proyecto de Caficultura Sostenible de Alto Valor para Pequeños Agricultores; Dpto: San Martín, Peru, 2009; p. 66. [Google Scholar]
  56. FAO. El Estado de los Bosques del Mundo. Los Bosques y la Agricultura; Desafios y Oportunidades en Relación con el uso de la Tierra. 2016. Available online: http://www.fao.org/3/i5588s/i5588s.pdf (accessed on 19 April 2021).
  57. Servidoni, L.E.; Ayer, J.E.B.; Silva, M.L.N.; Spalevic, V.; Mincato, R.L. Land Use Capacity and Environment Services. Rev. Bras. Geogr. Física 2016, 9, 1712–1724. [Google Scholar] [CrossRef] [Green Version]
  58. FAO. Basic Principles of Conservation Agriculture. 2015. Available online: http://www.fao.org/3/i7480e/i7480e.pdf.FAO (accessed on 8 January 2021).
  59. Escobedo-Monge, M.A.; Aparicio, S.; Escobedo-Monge, M.F.; Marugán-Miguelsanz, J.M. Long-Term Effects of the Application of Urban Waste Compost and Other Organic Amendments on Solanum tuberosum L. Agronomy 2020, 10, 1575. [Google Scholar] [CrossRef]
  60. FAO. Las Amenazas a Nuestros Suelos. 2015. Available online: https://www.fao.org/3/mn997s/mn997s.pdf (accessed on 18 July 2021).
  61. MINAM. Estrategia Regional de Biodiversidad de Cajamarca al 2021. Ministerio del Ambiente (MINAM) Gerencia de Recursos Naturales y Gestión del Medio Ambiene del Gob; Regional de Cajamarca: Cajamarca, Peru, 2010; p. 153. [Google Scholar]
  62. Tejedor, N.; Garavito, E.; Álvarez, S.; Arango Caro, A.; Araujo Murakami, C.; Blundo, T.E.; Boza, T.E.; La Torre, M.A.; Gaviria, J.; Gutíerrez, N.; et al. Evaluación del Estado de Conservación de los Bosques Montanos en los Andes tropicales. Ecosistemas 2012, 21, 148–166. [Google Scholar]
  63. FAO. Carta Mundial de los Suelos; Organización de las Naciones Unidas para la Alimentación y la Agricultura: Roma, Italia, 2015. [Google Scholar]
  64. Bruijnzeel, L.A.; Kappelle, M.; Mulligan, M.; Scatena, F.N. Tropical Montane Cloud Forests: State of Knowledge and Sustainability Perspectives in a Changing World. In Tropical Montane Cloud Forests: Science for Conservation and Management; Bruijnzeel, L.A., Scatena, F.N., Hamilton, L.S., Eds.; Cambridge University Press: Cambridge, UK, 2010; pp. 691–700. [Google Scholar]
  65. Bruijnzeel, L.A.; Scatena, F.N.; Hamilton, L.S. Tropical Mountain Cloud Forests; Cambridge University Press: Cambridge, UK, 2011; Available online: https://www.cambridge.org/core/books/tropical-montane-cloud-forests (accessed on 18 May 2021).
  66. Jørgensen, P.M.; Ulloa, C.; León, B.; León-Yánez, S.; Beck, S.G.; Nee, M.; Zarucchi, J.L.; Celis, M.; Bernal, R.; Gradstein, R. Regional Patterns of Vascular Plant Diversity and Endemism. In Climate Change and Biodiversity in the Tropical Andes; Herzog, S.K., Martínez, R., Jørgensen, P.M., Tiess, H., Eds.; Inter-American Institute for Global Change Research (IAI) and Scientific Committee on Problems of the Environment (SCOPE): Singapore, 2011; pp. 92–203. [Google Scholar]
  67. De Rutte, J.; Reynel, C. Composición y Diversidad Arbórea en la Cumbre del Bosque Montano Nublado Puyu Sacha, Chanchamayo. Junín, Peru, 1st ed.; Centro de Estudios Dendrología-Fundación para el Desarrollo Agrario CED-FDA: Lima, Peru, 2016; p. 110. [Google Scholar]
  68. Anderson, E.P.; Marengo, J.; Villalba, R.; Halloy, S.; Young, B.; Cordero, D.; Gast, F.; Jaimes, E.; Ruiz, D. Consequences of Climate Change for Ecosystems and Ecosystem Services in the Tropical Andes. In Climate Change and Biodiversity in the Tropical Andes; Herzog, S.K., Martínez, R., Jørgensen, P.M., Tiessen, H., Eds.; Inter-American Institute for Global Change Research (IAI) and Scientific Committee on Problems of the Environment (SCOPE): Montevideo, Uruguay, 2011; pp. 1–18. Available online: http://www.iai.int/index.php?option=com_content&view=article&id=24&Itemid=73 (accessed on 9 January 2021).
  69. Helmer, E.H.; Gerson, E.A.; Scott Baggett, L.; Bird, B.J.; Ruzycki, S.; Vogesser, S.M. Neotropical cloud forests and p’aramo to contract and dry from declines in cloud immersion and frost. PLoS ONE 2019, e0213155. [Google Scholar] [CrossRef] [Green Version]
  70. Quenta-Herrera, E.; Crespo-Pérez, V.; Mark, B.; Gonzales, A.; Kulonen, A. Mountain freshwater ecosystems and protected areas in the tropical Andes: Insights and gaps for climate change adaptation. Environ. Conserv. 2022, 49, 17–26. [Google Scholar] [CrossRef]
  71. Bruijnzeel, L.A.; Scatena, F.N.; Hamilton, L.S. Tropical Montane Cloud Forests. In Science for Conservation and Management; Cambridge University Press: Cambridge, UK, 2010. [Google Scholar]
  72. Los, S.O.; Street-Perrott, F.A.; Loader, N.J.; Froyd, C.A. Detection of signals linked to climate change, land-cover change and climate oscillators in Tropical Montane Cloud Forests. Remote Sens. Environ. 2021, 260, 112431. [Google Scholar] [CrossRef]
  73. Los, S.O.; Street-Perrott, F.A.; Loader, N.J.; Froyd, C.A.; Cuní-Sanchez, A.; Marchant, R.A. Sensitivity of a tropical montane cloud forest to climate change, present, past and future: Mt. Marsabit, N. Kenya. Quat. Sci. Rev. 2019, 218, 34–48. [Google Scholar] [CrossRef]
  74. Bruijnzeel, L.A. Hydrological functions of tropical forests: Not seeing the soil for the trees? Agric. Ecosyst. Environ. 2004, 104, 185–228. [Google Scholar] [CrossRef]
  75. UICN. Unión Internacional para la Conservación de la Naturaleza. 2017. Available online: https://www.iucn.org/es (accessed on 24 April 2021).
  76. Decreto Supremo 004-2014-MINAGRI. Clasificación de Especies Amenazadas de Fauna Silvestre. 2014. Available online: http://extwprlegs1.fao.org/docs/pdf/per132692.pdf (accessed on 10 May 2021).
Figure 1. The geographical location of the study area. PNA and BZ areas are indicated in red and green, respectively.
Forests 13 00436 g001
Figure 2. Superposition of the different georeferenced thematic layers worked with GIS interactively.
Forests 13 00436 g002
Figure 3. The ecological value of the lands of the Pagaibamba Protection Forest.
Forests 13 00436 g003
Figure 4. The productive aptitude of the lands of the Pagaibamba Protection Forest.
Forests 13 00436 g004
Figure 5. The vulnerability of the lands of the Pagaibamba Protection Forest.
Forests 13 00436 g005
Figure 6. Ecological risk zoning of the Pagaibamba Protection Forest.
Forests 13 00436 g006
Figure 7. High Risk and Ecological Protection Zone within the Pagaibamba Protection Forest. Mountainous relief, covered with humid mountain forest in its natural state of conservation, which must be protected and conserved.
Forests 13 00436 g007
Figure 8. Fog water capture in Tropical Montane Cloud Forest in the PPF.
Forests 13 00436 g008
Figure 9. Changes in land use, without considering their capacity for use, the opening of roads, overgrazing, logging, burning, etc., are promoting and accelerating the degradation of soils, triggering complex processes erosive. Good management of conservation and protection of the vegetation cover is necessary at the PPF.
Forests 13 00436 g009
Table 1. The vulnerability levels of the lands of the Protected Natural Areas of the Pagaibamba Protection Forest.
Vulnerability LevelsVariables UsedProtected Natural Areas
Physiographic—GeologicalTopographicEdaphic
ReliefSlope (%)Soil NameDepth (cm)TextureRock Fragmentsha%
LowVolcanic-sedimentary mountain slopeSI8–15Cachipampa80–90Sl/Sgravelly 15–35% 35.871.77
ModeratedMS15–25 Cachipampa80–90Sl/Sgravelly 15–35% gravel265.1613.10
SI8–15El Tendal90–100L/Sclslightly gravelly <15% gravel
HighS25–50Cachipampa80–90Sl/Sgravelly 15–35% gravel621.0630.70
MS—S15–50El Tendal90–100L/Sclslightly gravelly <15% gravel
Very highVS50–75 Cachipampa80–90Sl/Sgravelly 15–35% gravel1101.1154.43
VS50–75 El Tendal90–100L/Sclslightly gravelly <15% gravel
S—VS25–75Rocky outcrop<15 very stony35–60% stones
Total 2023.20100.00
SI: steeply inclined, MS: moderately steep, S: steep, VS: very steep, L: loam, C: clay, S: sandy, Sl: sandy loam, Scl: sandy clay loam, Cl: clay loam.
Table 2. The vulnerability levels of the lands in the Buffer Zone of the Pagaibamba Protection Forest.
Vulnerability LevelsVariables UsedProtected Natural Areas
Physiographic—GeologicalTopographicEdaphic
ReliefSlope (%)Soil NameDepth (cm)TextureRock Fragmentsha%
Very LowVolcanic-sedimentary mountain slopeSI8–15Los Molinos120–150L/Clslightly gravelly<15% gravel34.040.82
LowSI8–15Cachipampa80–90Sl/Sgravelly15–35% gravel608.2514.61
ModeratedMS15–25Cachipampa80–90Sl/Sgravelly15–35% gravel1257.9730.19
Los Molinos120–150L/Clslightly gravelly<15% gravel
SI8–15El Tendal90–100L/Sclslightly gravelly<15% gravel
HighS25–50Cachipampa80–90Sl/Sgravelly15–35% gravel1284.9730.84
S25–50Los Molinos120–150L/Clslightly gravelly<15% gravel
MS—S15–50El Tendal90–100L/Sclslightly gravelly<15% gravel
Very highVS50–75Cachipampa80–90Sl/Sgravelly15–35% gravel980.4823.54
VS50–75Los Molinos120–150L/Scslightly gravelly<15% gravel
VS50–75El Tendal90–100L/Sclslightly gravelly<15% gravel
S—VS25–75Rocky outcrop<15 very stony35–60% stones
Total 4165.71100.00
SI: steeply inclined, MS: moderately steep, S: steep, VS: very steep, loam, C: clay, S: sandy, Sl: sandy loam, Scl: sandy clay loam, Cl: clay loam.
Table 3. Risk zoning and ecological protection of the Pagaibamba Protection Forest.
Ecological Risk ZonningCriteria UsedProtected Natural AreaBuffer Zone
Ecological ValueProductive AptitudeVulnerabilityha%ha%
High Ecological RiskHighProtection ConservationXseHigh and Very high1722.1885.132265.4554.38
ForestF3se, F3secHigh
Moderate Ecological RiskMediumLivestockP3se, P3se (t)Medium, Low265.1613.101257.9730.19
Low Ecological RiskLowAgriculturalA3sec, C3seLow and Very low35.871.77642.2915.43
Total 2023.20100.004165.71100.00
Publisher’s Note: MDPI stays neutral with regard to jurisdictional claims in published maps and institutional affiliations.

