Abstract
Poplar trees (Populus spp.) are some of the fastest growing hardwoods used for biomass production. There are, however, conflicting observations about water use of poplars associated with the impact on local water resources. A STELLA (Structural Thinking and Experiential Learning Laboratory with Animation) model was modified to investigate the aboveground biomass production and water use in a mature (6 to 8 yrs. old) poplar plantation for a 3-year simulation period. The model predicted the typical annual pattern of soil evaporation, root water uptake, and leaf water transpiration in the poplar plantation increasing from winter to summer followed by respective decreases from summer to winter. Root water uptake and leaf water transpiration were proportional to the soil water content. More water was needed to produce the same amount of biomass during summer than during other seasons. Less water was consumed to produce the same amount of biomass as the age of the poplar trees increased. The net increase in biomass over the 3-year period was 0.69 × 10⁴ kg/ha, which was equivalent to a 65% increase in biomass. The average rate of daily water use to daily biomass production was 1.05 × 109 cm3 water/kg biomass/ha. A good linear correlation between cumulative biomass production (CBP) and cumulative water use (CWU) was identified: YCBP = 0.001 ∗ XCWU, R2 = 0.99, p < 0.001. This simple correlation provides a very good reference to estimate poplar water use efficiency (i.e., ratio of water use to biomass production) in growing regions where water resources are a limiting factor.
1. Introduction
Poplar trees (Populus spp.) are fast-growing and high-yielding hardwoods that are some of the most important woody plants used by man. Trees in this genus have been used for constructing homes, making tools and medicines, and protecting riverbanks for thousands of years throughout the world [1]. Poplars have been planted commercially for the pulp and paper industry prior to 1965 [2], and in recent decades, they were used for phytoremediation, soil carbon sequestration, sediment run-off reduction, water quality protection, greenhouse gas emission mitigation, and wildlife habitat improvement [3,4,5,6]. Short rotation poplars (a cycle of 3–6 years) have been included in the U.S. Department of Energy’s Bioenergy Feedstock Development Program since the late 1970s. The primary goal of this program is to produce fuel for cogeneration of heat and electricity [7]. Poplars have a high biomass production rate (10–15 × 104 kg/ha/yr) and offer an environmentally sustainable way of generating heat and electricity [8,9,10].
There are, however, conflicting observations about water consumption by poplars and its impact on local water resources [10,11]. Normally, and especially in warm climates, poplars would consume large amounts of water to produce large volumes of biomass [12,13]. This could result in a negative effect on local water resources [14]. Bungart and Hüttl [15] reported mean annual transpiration rates of 266 and 241 mm, respectively, for two different poplar clones (Beaupré, Populus trichocarpa x P. deltoides and Androscoggin, P. maximowiczii) from 1996 to 2002 in the Lusatian mining region in Germany. Several studies have concluded that water use of poplars is substantially higher than that of conventional agricultural crops or grasslands [16]. In contrast, other studies argued that water use of poplars is comparable to that of crops and grasses [17,18].
The biomass yield of poplars depends on conditions of age, climate, clone, density, and silviculture [1]. In general, poplar yield varies with location. It has been estimated that yields range from 1.25 to 3.35 × 10⁴ dry kg/acre/yr in the Lake states with a growth cycle of 5–8 years [19], 2.45 to 5.13 × 10⁴ dry kg/acre/yr in the Upper Midwest with a growth cycle of 13 years [20], 2.01–2.99 × 10⁴ dry kg/acre/yr in the Mississippi River Valley with a growth cycle of 8–10 years [21], and 3.08–8.61 × 10⁴ dry kg/acre/yr in Minnesota with a growth cycle of 6–11 years [2]. Davis [22] reported that the best way to increase the biomass of poplars is to select the best clones for site-specific conditions.
A couple of simulation models have been developed to predict short rotation poplar growth and yield. Sampson and Ceulemans [23] developed the process-based SECRETS (Stand to Ecosystem CaRbon and EvapoTranspiration Simulator) model to simulate the growth and yield of mixed forests with different species. The model incorporates several modules, including light penetration, photosynthesis, surface and soil litter, carbon and nitrogen pools, carbon storage and partitioning, and biomass. Deckmyn et al. [24] modified and applied the SECRETS model to simulate poplar growth and yield in short rotation coppice plantations in Flanders, Belgium. These authors suggested that the process-based model was useful in predicting the effects of management strategies on poplar growth and yield. Hart et al. [25] applied the 3PG (Physiological Principles in Predicting Growth) model to simulate poplar growth in the Pacific Northwest. Their results showed that an updated 3PG model can be applied for coppiced short rotation woody crop plantings and biomass yield estimates under different irrigation patterns and weather conditions.
Although the aforementioned experimental and modeling studies have provided valuable insights into our understanding of poplar growth and yield, many of the hydrological processes and poplar water use dynamics are not included in these studies. Recently, Ouyang et al. [26] developed a STELLA (Structural Thinking and Experiential Learning Laboratory with Animation) model to estimate water use, among other variables, in a poplar plantation. The goal of this study was to predict the biomass production and water use of poplars in short rotation plantations by modifying the previously developed STELLA model. STELLA is a computer software program used to develop models for research with applications in economics, sciences, and engineering. Detailed descriptions of the STELLA software can be found elsewhere [27,28] (https://www.iseesystems.com/store/products/, accessed on 25 December 2021). Our specific objectives were to (1) incorporate biomass production calculations into the previous STELLA model for simulating biomass production and water use simultaneously; (2) calibrate the modified STELLA model with field data; and (3) apply the model to estimate biomass production and water use.
2. Materials and Methods
2.1. STELLA Model Description
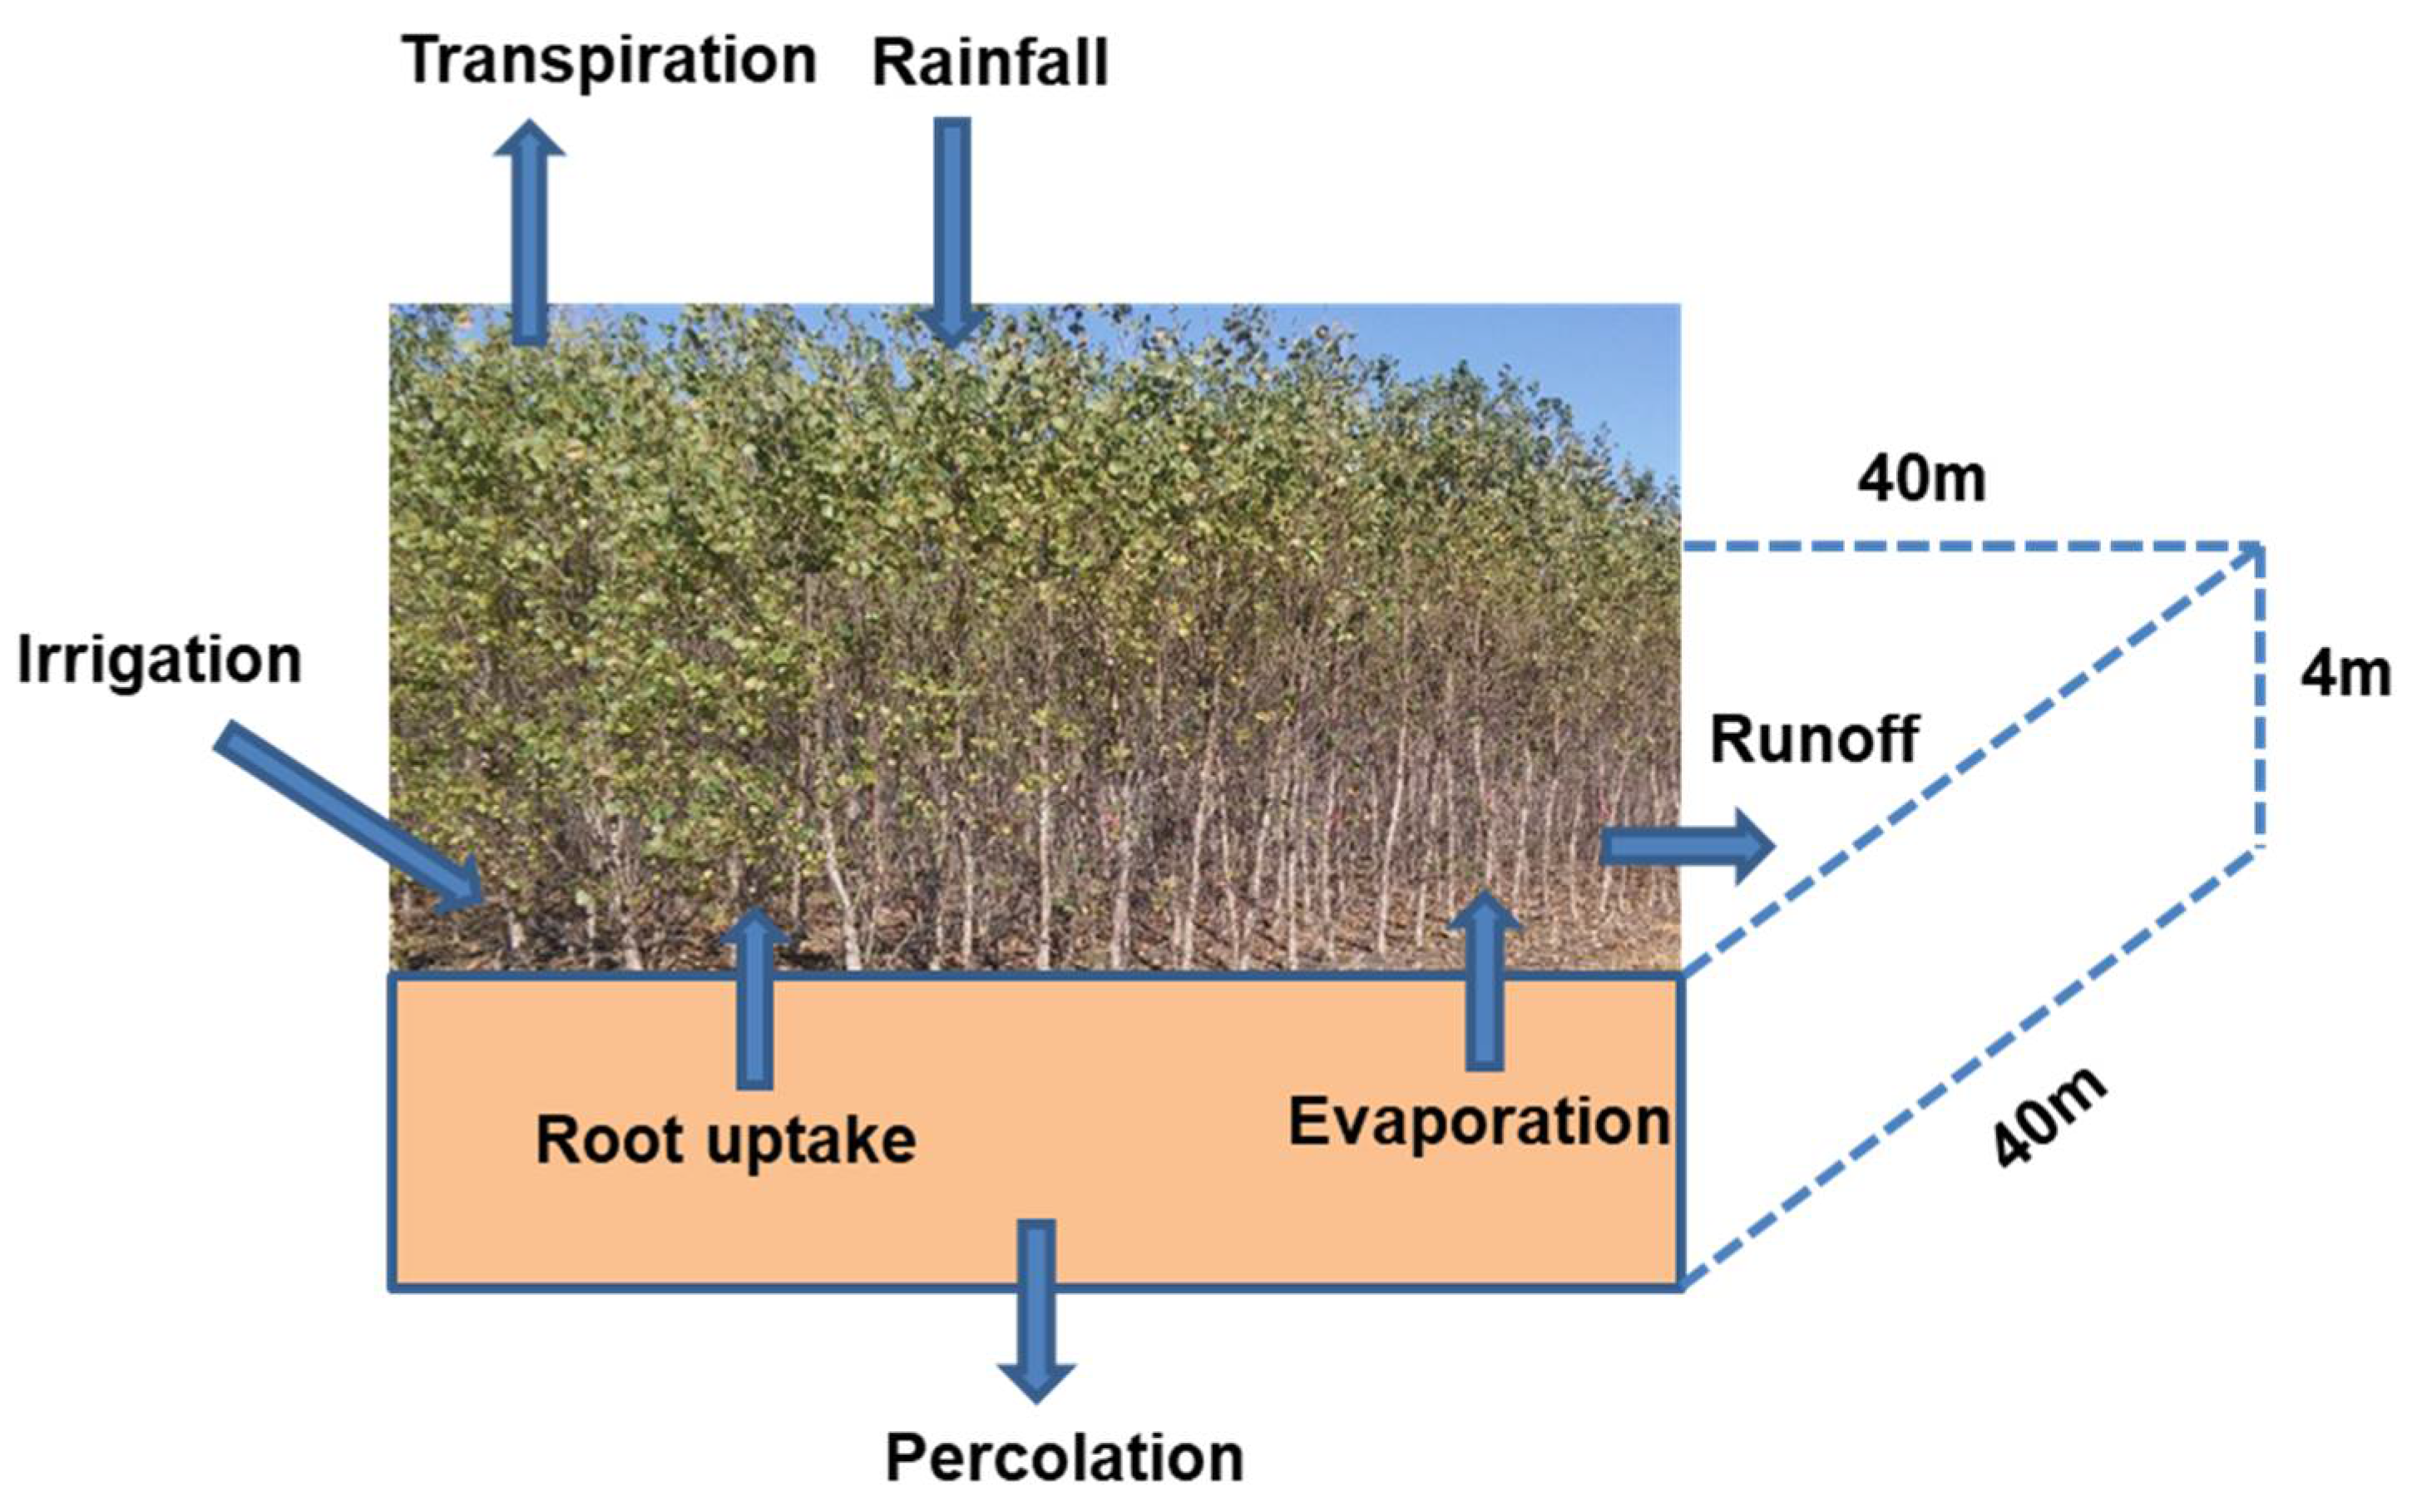
A schematic diagram showing the water dynamics in a poplar plantation is shown in Figure 1. This diagram has been used to develop a STELLA model for simulating poplar water use and nitrogen (N) uptake [26]. The hydrological process module of the previous STELLA model consists of surface runoff, rainfall/irrigation, infiltration, evaporation, percolation, and water uptake by roots as part of tree transpiration. The model was calibrated and validated for soil water drainage and nitrate concentration with good agreement [26] between model predictions and measured values reported by Lee and Jose [29]. A simulation scenario was performed to estimate the diurnal and monthly water and N dynamics of a poplar plantation. Although an elaborate description of the model is beyond the scope of this study and can be found in Ouyang et al. [26], a brief outline of the mathematical functions for the major soil physical and hydrological processes is given below for the readers’ convenience.

Figure 1.
Schematic diagram showing the soil hydrological processes in a poplar plantation.
Soil surface water runoff is estimated as [30,31]:
where Ro is the surface runoff (cm3/h), R is the rainfall rate (cm3/h) and S, the watershed retention parameter, is estimated by
where CN is the runoff curve number. Curve number is a function of soil type, soil physical properties, crop type, and management practices and is equal to 81 for the study site comparable to this research [30].
The canopy interception is calculated as [32]
where St is the storage of rainfall amount (cm3), Sc is the storage capacity (cm3), RI is the present rainfall amount (cm3), and RA is the previous rainfall amount (cm3). Equation (3) is valid if tree canopy is dry before rainfall events.
The net rainfall rate is calculated by subtracting actual rainfall with canopy interception:
Soil evaporation is estimated by fitting a Gaussian-type function to measured data from a poplar plantation [29]:
where Sevp is the soil evaporation (cm3/h), TY is the time of year (h), and a1 to a3 are the coefficients (Table 1).
Leaf water transpiration is approximated in a similar way as that of Equation (5):
where Ltrp is the leaf water transpiration (cm3/h), and a4 is the coefficient (Table 1). For transpiration of a mature plantation, a forest cover factor of 0.85 is also included in the STELLA model. For different study sites, the constants in Equations (5) and (6) are suggested to change based on measured data.
Soil water percolation is calculated as [31]
where Q is the percolation rate (cm3/h), α is the drainage coefficient (cm3/h), θ is the volumetric water content (cm3/cm3), and fc is the field water capacity (cm3/cm3).
The root water uptake is given as [26,33]
where Qroot is the soil water uptake rate (cm3/h).
Rainfall data were obtained from local weather stations, whereas irrigation rates were from Lee and Jose [29]. The reasons to select the study site used by Lee and Jose [29] for our model applications are that this site has sufficient input data for hydrologic, soil, poplar growth, and climate conditions. It should be noted that there are some assumptions for using Equations (1) and (5)–(8). These included: (1) soil evaporation was assumed to cease when the soil water content was below 0.15 cm3/cm3 because of insufficient soil water supply or when it was raining because of saturation vapor pressure; (2) leaf transpiration was assumed to cease when it was raining because of saturation vapor pressure and stomata close or near zero at night; (3) plantation irrigation started from spring to fall when soil water content is below 0.15 cm3/cm3 (wilting point); and (4) soil percolation occurred only when soil water content was greater than field capacity. All of them have been incorporated into the modified STELLA model.
In this study, a new module, i.e., the biomass production module, was added to the STELLA model as detailed below. The total aboveground biomass of a poplar tree is calculated as [34]
where Bm is the total aboveground biomass (kg) for a tree with a dbh of 2.5 cm or larger, dbh is the diameter at breast height (cm), and β0 and β1 are the coefficients characterizing biomass production of poplars (Table 1).

Table 1.
Major input parameter values used in this study.
Table 1.
Major input parameter values used in this study.
| Parameter | Value or Empirical Equation | Source |
|---|---|---|
| Curve number (CN) in Equation (2) | 81 | USDA [30] |
| Storage capacity (Sc) in Equation (3) | 3.5 | Calibrated |
| a1 in Equation (5) | 0.034 | Calculated based on data from Lee and Jose [29] |
| a2 in Equation (5) | 4345 | Calculated based on data from Lee and Jose [29] |
| a3 in Equation (5) | 2800 | Calculated based on data from Lee and Jose [29] |
| a4 in Equation (6) | 0.627 | Calculated based on data from Lee and Jose [29] |
| a5 in Equation (10) | 3.473 | Edmondson et al. [35] |
| a6 in Equation (10) | 8760 | Edmondson et al. [35] |
| a7 in Equation (10) | 0.59 | Edmondson et al. [35] |
| Rainfall (cm/h) | Time series measurements | Local weather station |
| Irrigation (cm/h) | 0.3 | Lee and Jose [29] |
| Soil area (cm2) | 1,000,000,000 (or one hectare) | Lee and Jose [29] |
| Soil depth (cm) | 200 | Lee and Jose [29] |
| Soil porosity (cm3/cm3) | 0.35 | Ouyang et al. [26] |
| Field capacity | 0.3 | Ouyang et al. [26] |
| Drainage coefficient (cm/h) | 0.005 | Calibrated |
| Initial soil water (cm3) | 33,600,000,000 | Calculated based on soil volume and water content |
| Initial root water (cm3) | 2,450,000,000 | Estimated from Jenkins et al. [35] and Lee and Jose [29] |
| Initial stem water (cm3) | 816,666,667 | Estimated from Stem volume index [29] |
| Initial leaf water (cm3) | 816,666,667 | Estimated from Jenkins et al. [35] and Lee and Jose [29] |
| Transpiration (cm3/h/tree) | 0.016 | Lee and Jose [29] |
| Plant density (tree/ha) | 229 | Lee and Jose [29] |
| Forest cover factor | 0.85 | Assumed based on our observations |
| β0 in Equation (9) | −1 | Jenkins et al. [34] |
| β1 in Equation (9) | 2.1 | Jenkins et al. [34] |
Dbh is assumed to be a function of poplar age [35] and is given as
where Age is the age of the poplar (h) and a5 to a7 are coefficients (Table 1).
The ratio of water use to biomass production for a single tree is then calculated as
where W is the ratio (cm3/kg), and Tw is the volume of transpiration water by the poplar (cm3). To calculate the ratio in a poplar plantation, Equations (9) and (11) are multiplied by the tree density of the plantation.
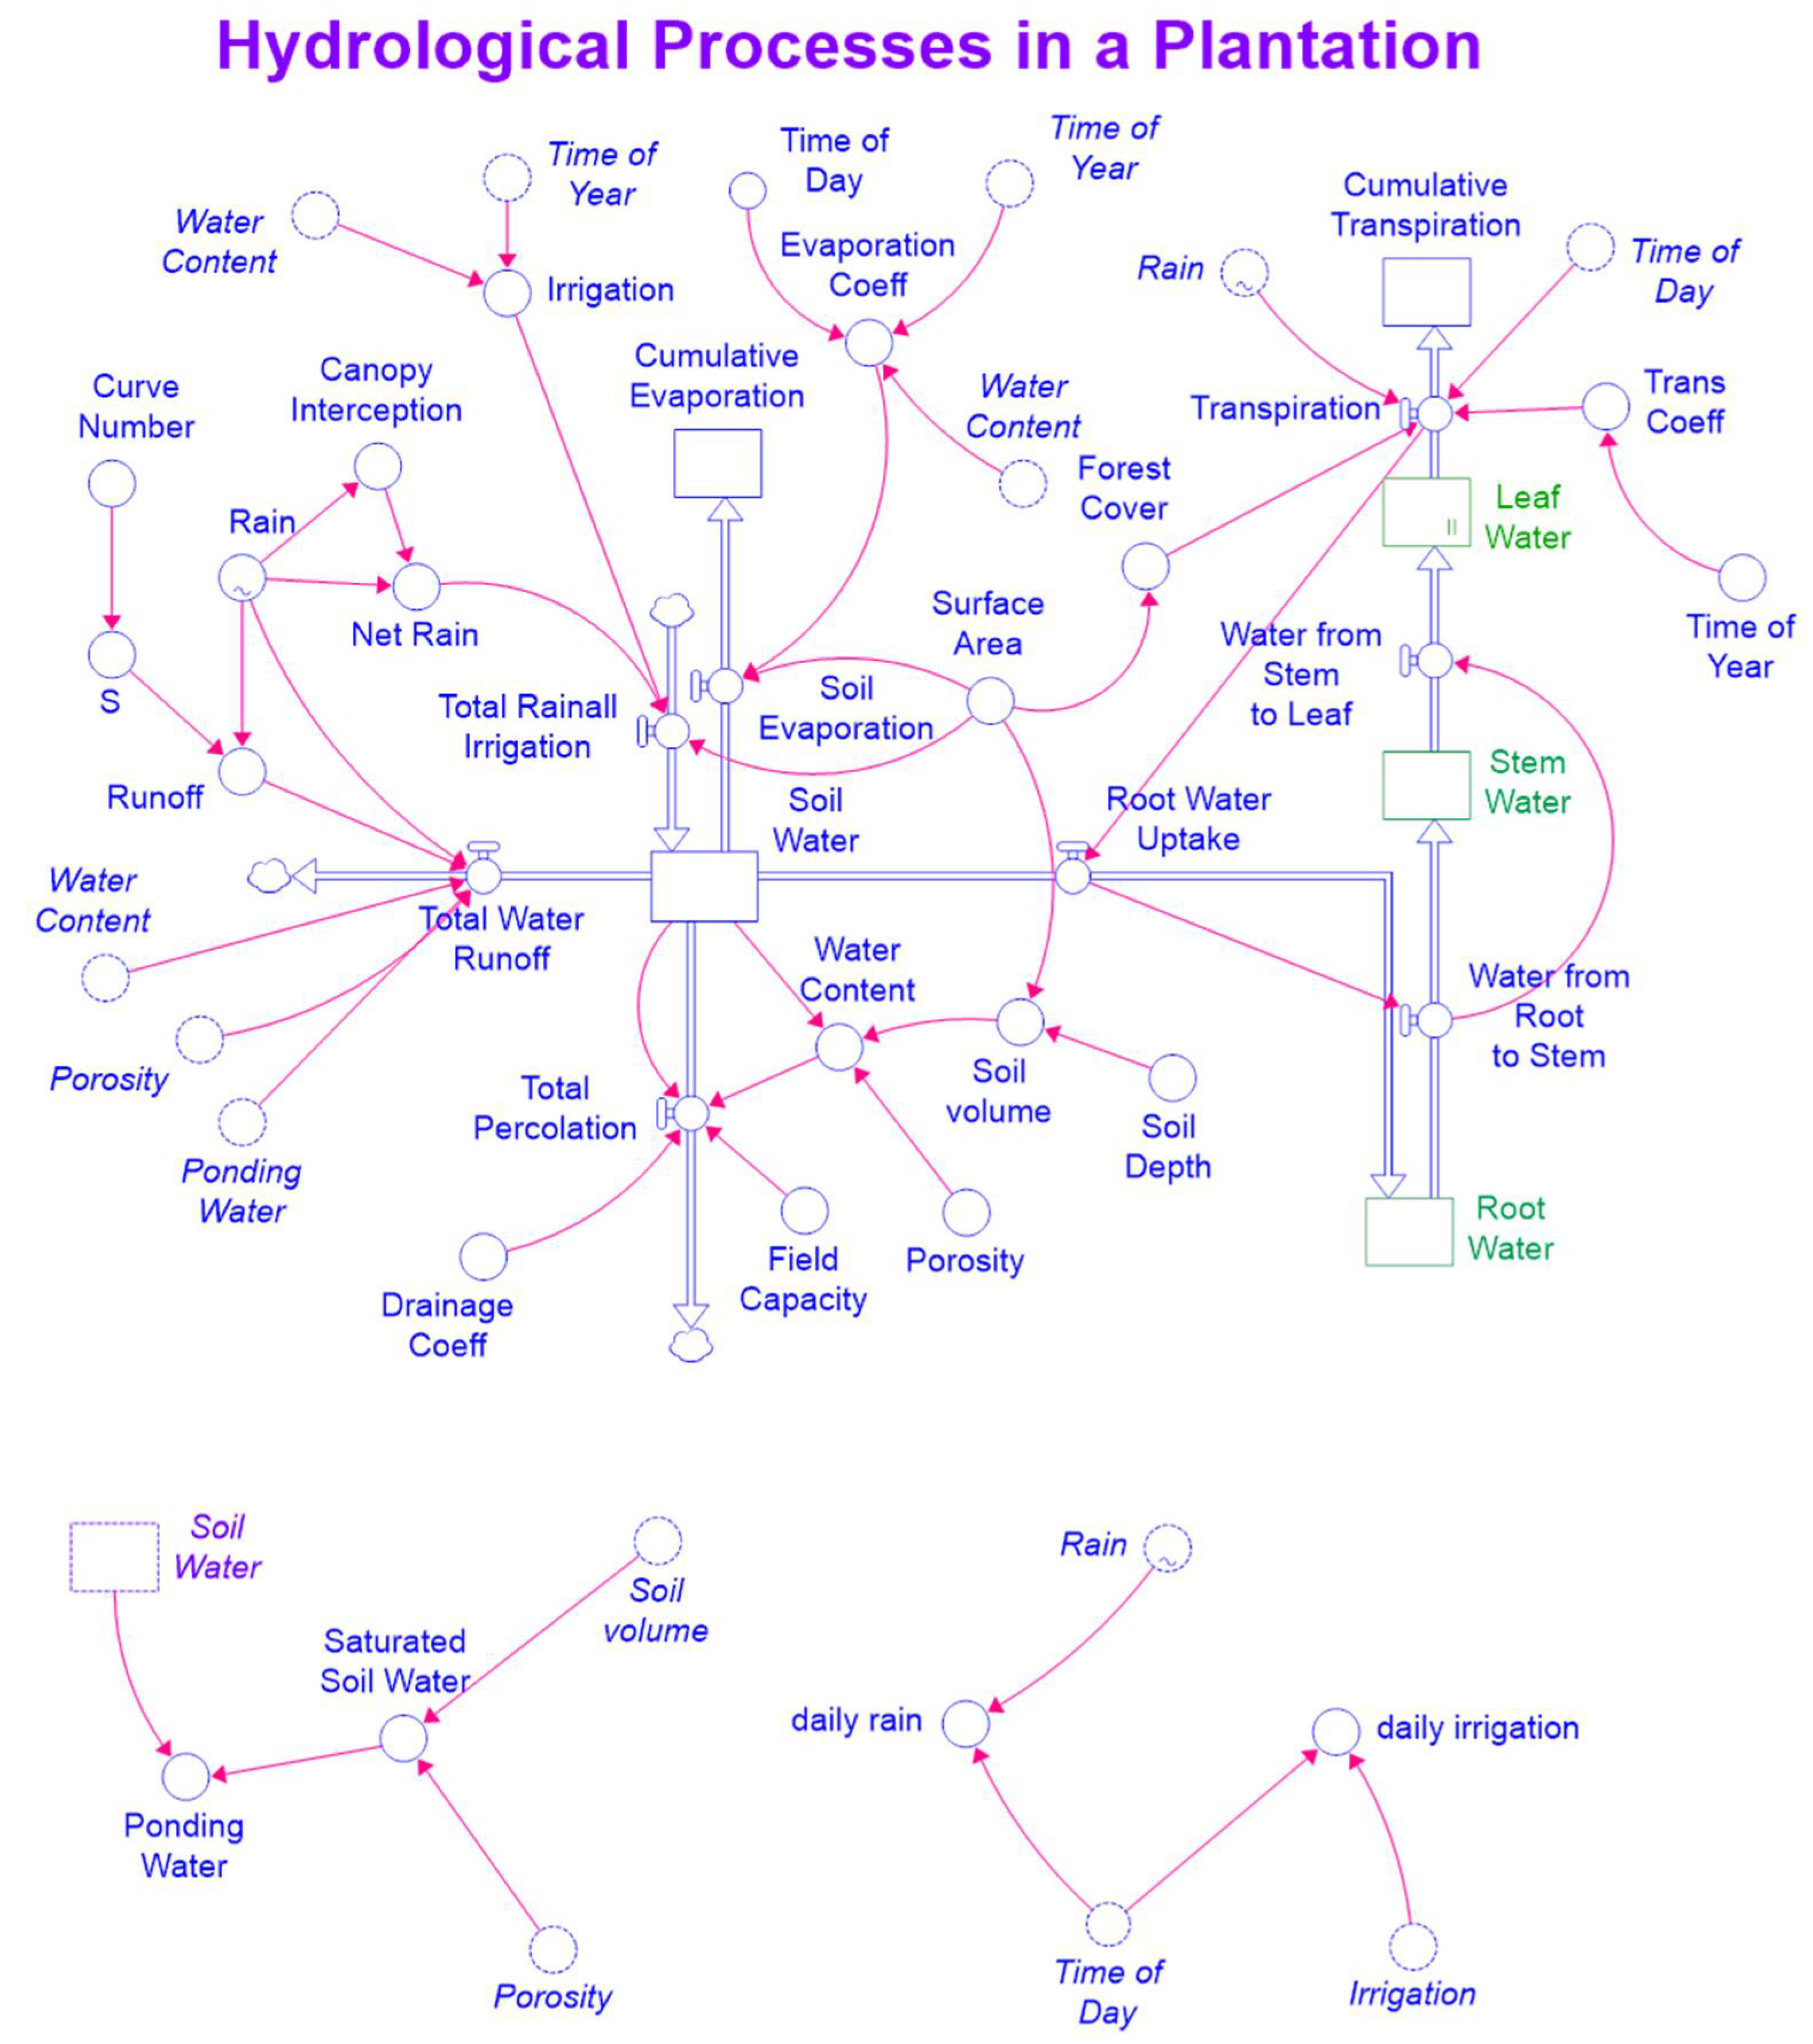
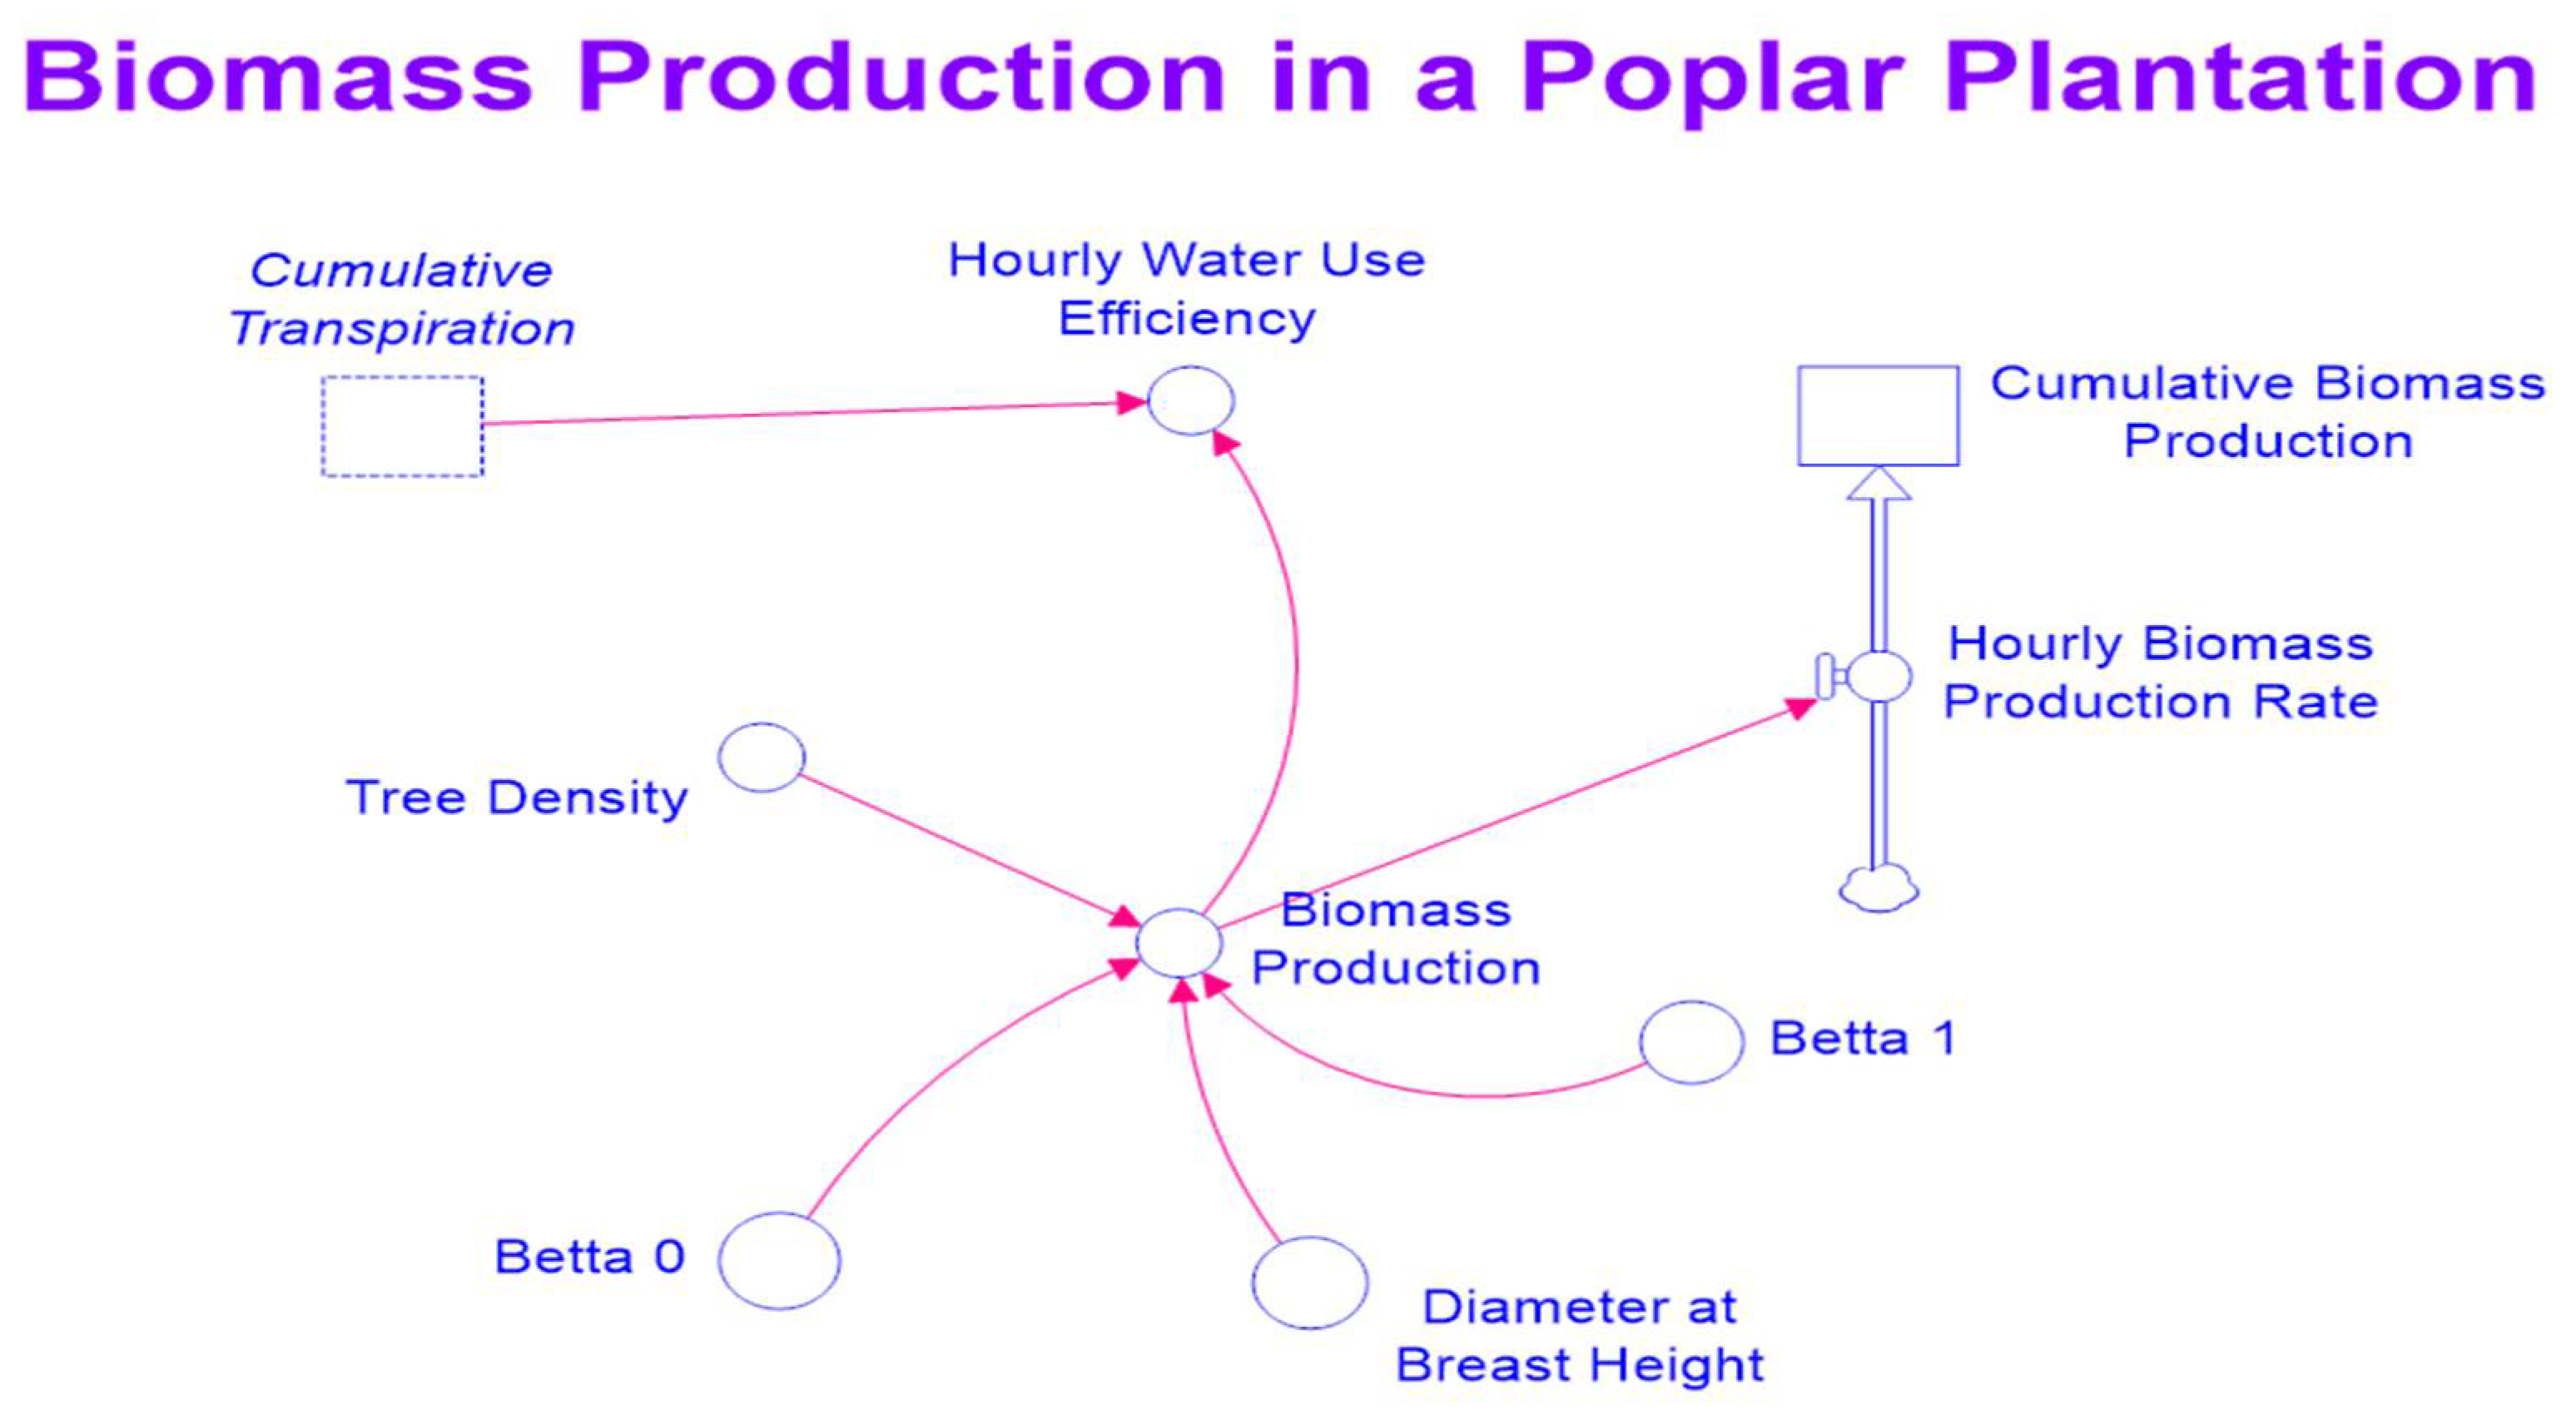
Equations (9)–(11) were incorporated into the exiting STELLA model. Figure 2 and Figure 3 are maps of the modified STELLA model for simultaneously simulating hydrological processes and biomass production.
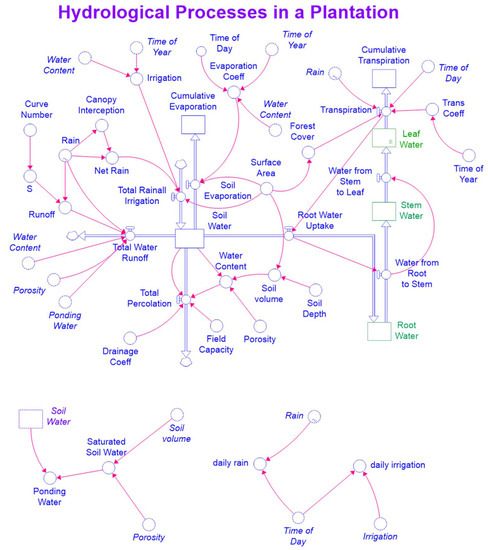
Figure 2.
A map of the STELLA model for simulating hydrological processes.

Figure 3.
A map of the STELLA model for simulating biomass production.
2.2. Data Acquisition
The majority of model input data used in this study were obtained from Lee and Jose [29] and Henderson and Jose [36]. These authors investigated soil water drainage and biomass production of three short rotation woody crop species under varying nitrogen and water availability in Santa Rosa County, FL, USA. More specifically, the input data for hydrological processes and poplar biomass production were obtained from their reports, whereas the rainfall data were obtained from the local weather station in Santa Rosa County for a period from 1 January 2001 to 31 December 2003. The input data such as soil physical property and coefficients in equations were from other studies that were cited in Table 1.
2.3. Model Calibration
Since the previous STELLA model [26] was modified to add the canopy rainfall interception and biomass production, the modified STELLA model was re-calibrated in this study. The hydrological process module was calibrated using the experimental data reported by Lee and Jose [29], whereas the biomass production module was calibrated using the experimental data reported by Henderson and Jose [36]. For the biomass production calibration, we selected the data for biomass production of poplars under two treatments (i.e., control without fertilization and applying 56 kg N/yr/ha) reported by Henderson and Jose [36]. These authors measured the annual biomass production at ages of 6, 7, and 8 (three data points) for each treatment. Two simulations were performed with one for control treatment and the other for applying 56 kg N/yr/ha treatment. Table 1 listed the major input data used during the model calibration.
Comparisons of the observed and predicted soil water drainage and biomass production of the poplars are shown in Figure 4. The regression equation for soil water drainage was YPrediction = 0.67XMeasurement with R2 = 0.76, nRMSE (normalized root mean square error) = 0.27, NSE (Nash Sutcliff efficiency) = 0.35, and p < 0.01, while the regression equation for biomass production was YPrediction = 1.002XMeasurement with R2 = 0.99, nRMSE = 0.063, NSE = 0.88, and p < 0.001. With these good statistical measures, we concluded that the modified STELLA model predicted the soil hydrological processes and biomass production of the poplars reasonably well.
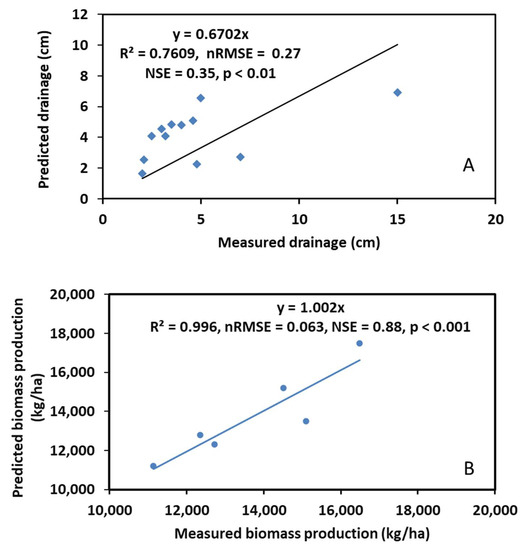
Figure 4.
Comparison of model predicted and field measured soil water drainage (A) and biomass production (B) during model calibration.
A simulation scenario was developed to assess the biomass production of the mature poplar trees (P. deltoides) and their water use for a 3-year period with the poplars starting at age 6. The modeled domain used in this study has an area of one hectare with a soil depth of 4 m (Figure 1). All the simulation conditions and input parameter values were the same as those used for the model calibration except for no fertilizer application, and the plantation was irrigated only when the soil water content was equal to or below the wilting point (0.15 cm3/cm3). This simulation scenario reflects the field study site conditions in Santa Rosa County, FL, USA, used by Lee and Jose [29]. The simulation started on January 1 and ended on December 31 of the third year with an hourly simulation time step.
3. Results and Discussion
3.1. Soil Hydrological Processes
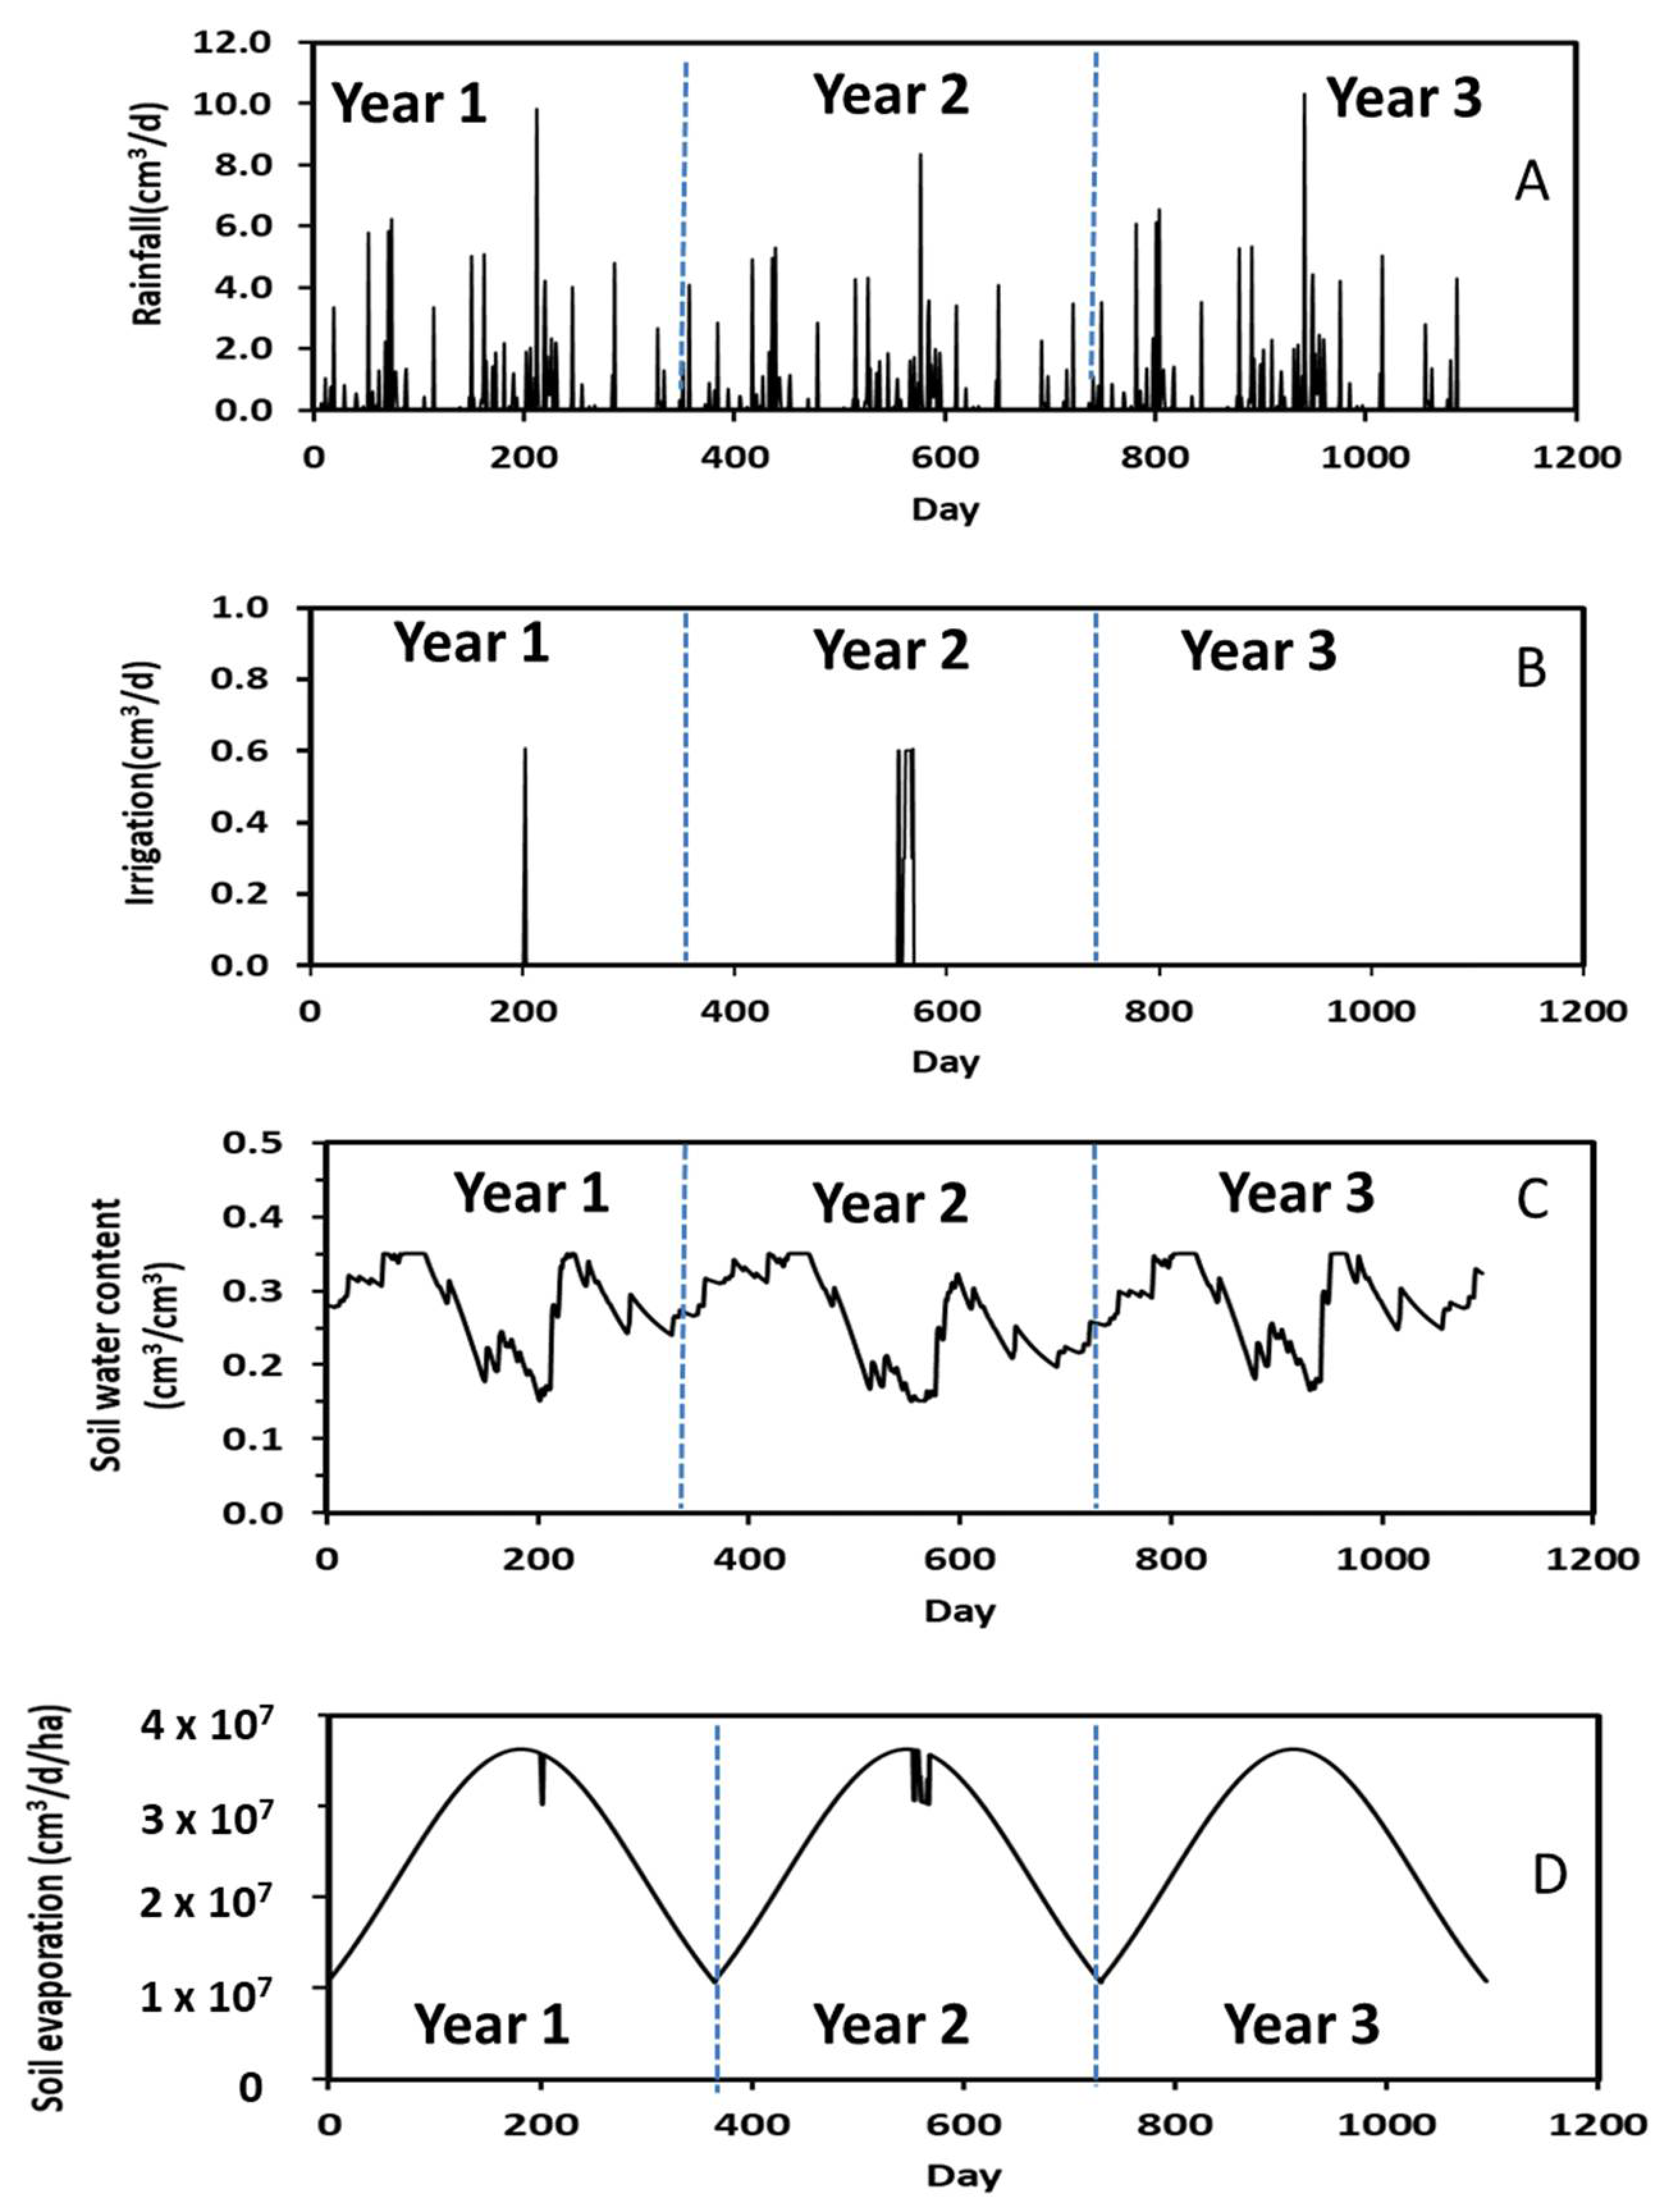
Annual variations in measured daily rainfall along with simulated irrigation, soil water content, and soil evaporation in the plantation for a 3-year simulation period are shown in Figure 5. As stated above, the plantation irrigation was turned on from spring to fall when the soil water content was equal to or less than 0.15 cm3/cm3. In other words, no irrigation occurred during winter as water use by poplars was trivial during this season. The frequencies of plantation irrigation were negatively related to rainfall events (Figure 5A,B). The number of irrigations were 2 and 3, respectively, in the first- and second-year’s simulations. As expected, more irrigations occurred in the second year because of fewer rainfall events and lower soil water content (Figure 5C). Simulation results confirmed that irrigations were sometimes required for poplars under normal growing conditions.
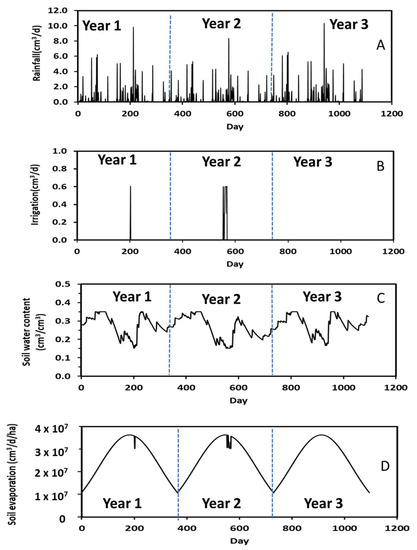
Figure 5.
Measured daily rainfall along with simulated irrigation, water content, and soil evaporation during the 3-year period.
Comparison of Figure 5A,C revealed that soil water content corresponded to rainfall events. That is, an increase in rainfall rate increased soil water content. For example, the soil water content was 0.31 cm3/cm3 at Day 850 in Year 3 when the rainfall rate was 10 cm3/d but was 0.21 cm3/cm3 at Day 951 when the rainfall rate was 5 cm3/d. A 2-fold increase in rainfall rate increased the soil water content by 1.5 times. These results suggest that the STELLA model appropriately predicted soil hydrological processes.
A typical annual soil evaporation pattern, with an increase from winter to summer followed by a decrease from summer to winter, is shown in Figure 5D. The highest rate of soil evaporation was about 3.63 × 107 cm3/d/ha during summer and occurred because of warmer summer temperatures, which was calculated by Equation (5). The abrupt changes in soil evaporation (Figure 5D) occurred when the soil water content was equal to or less than 0.15 cm3/cm3 because of insufficient soil water supply for evaporation.
3.2. Poplar Water Dynamics
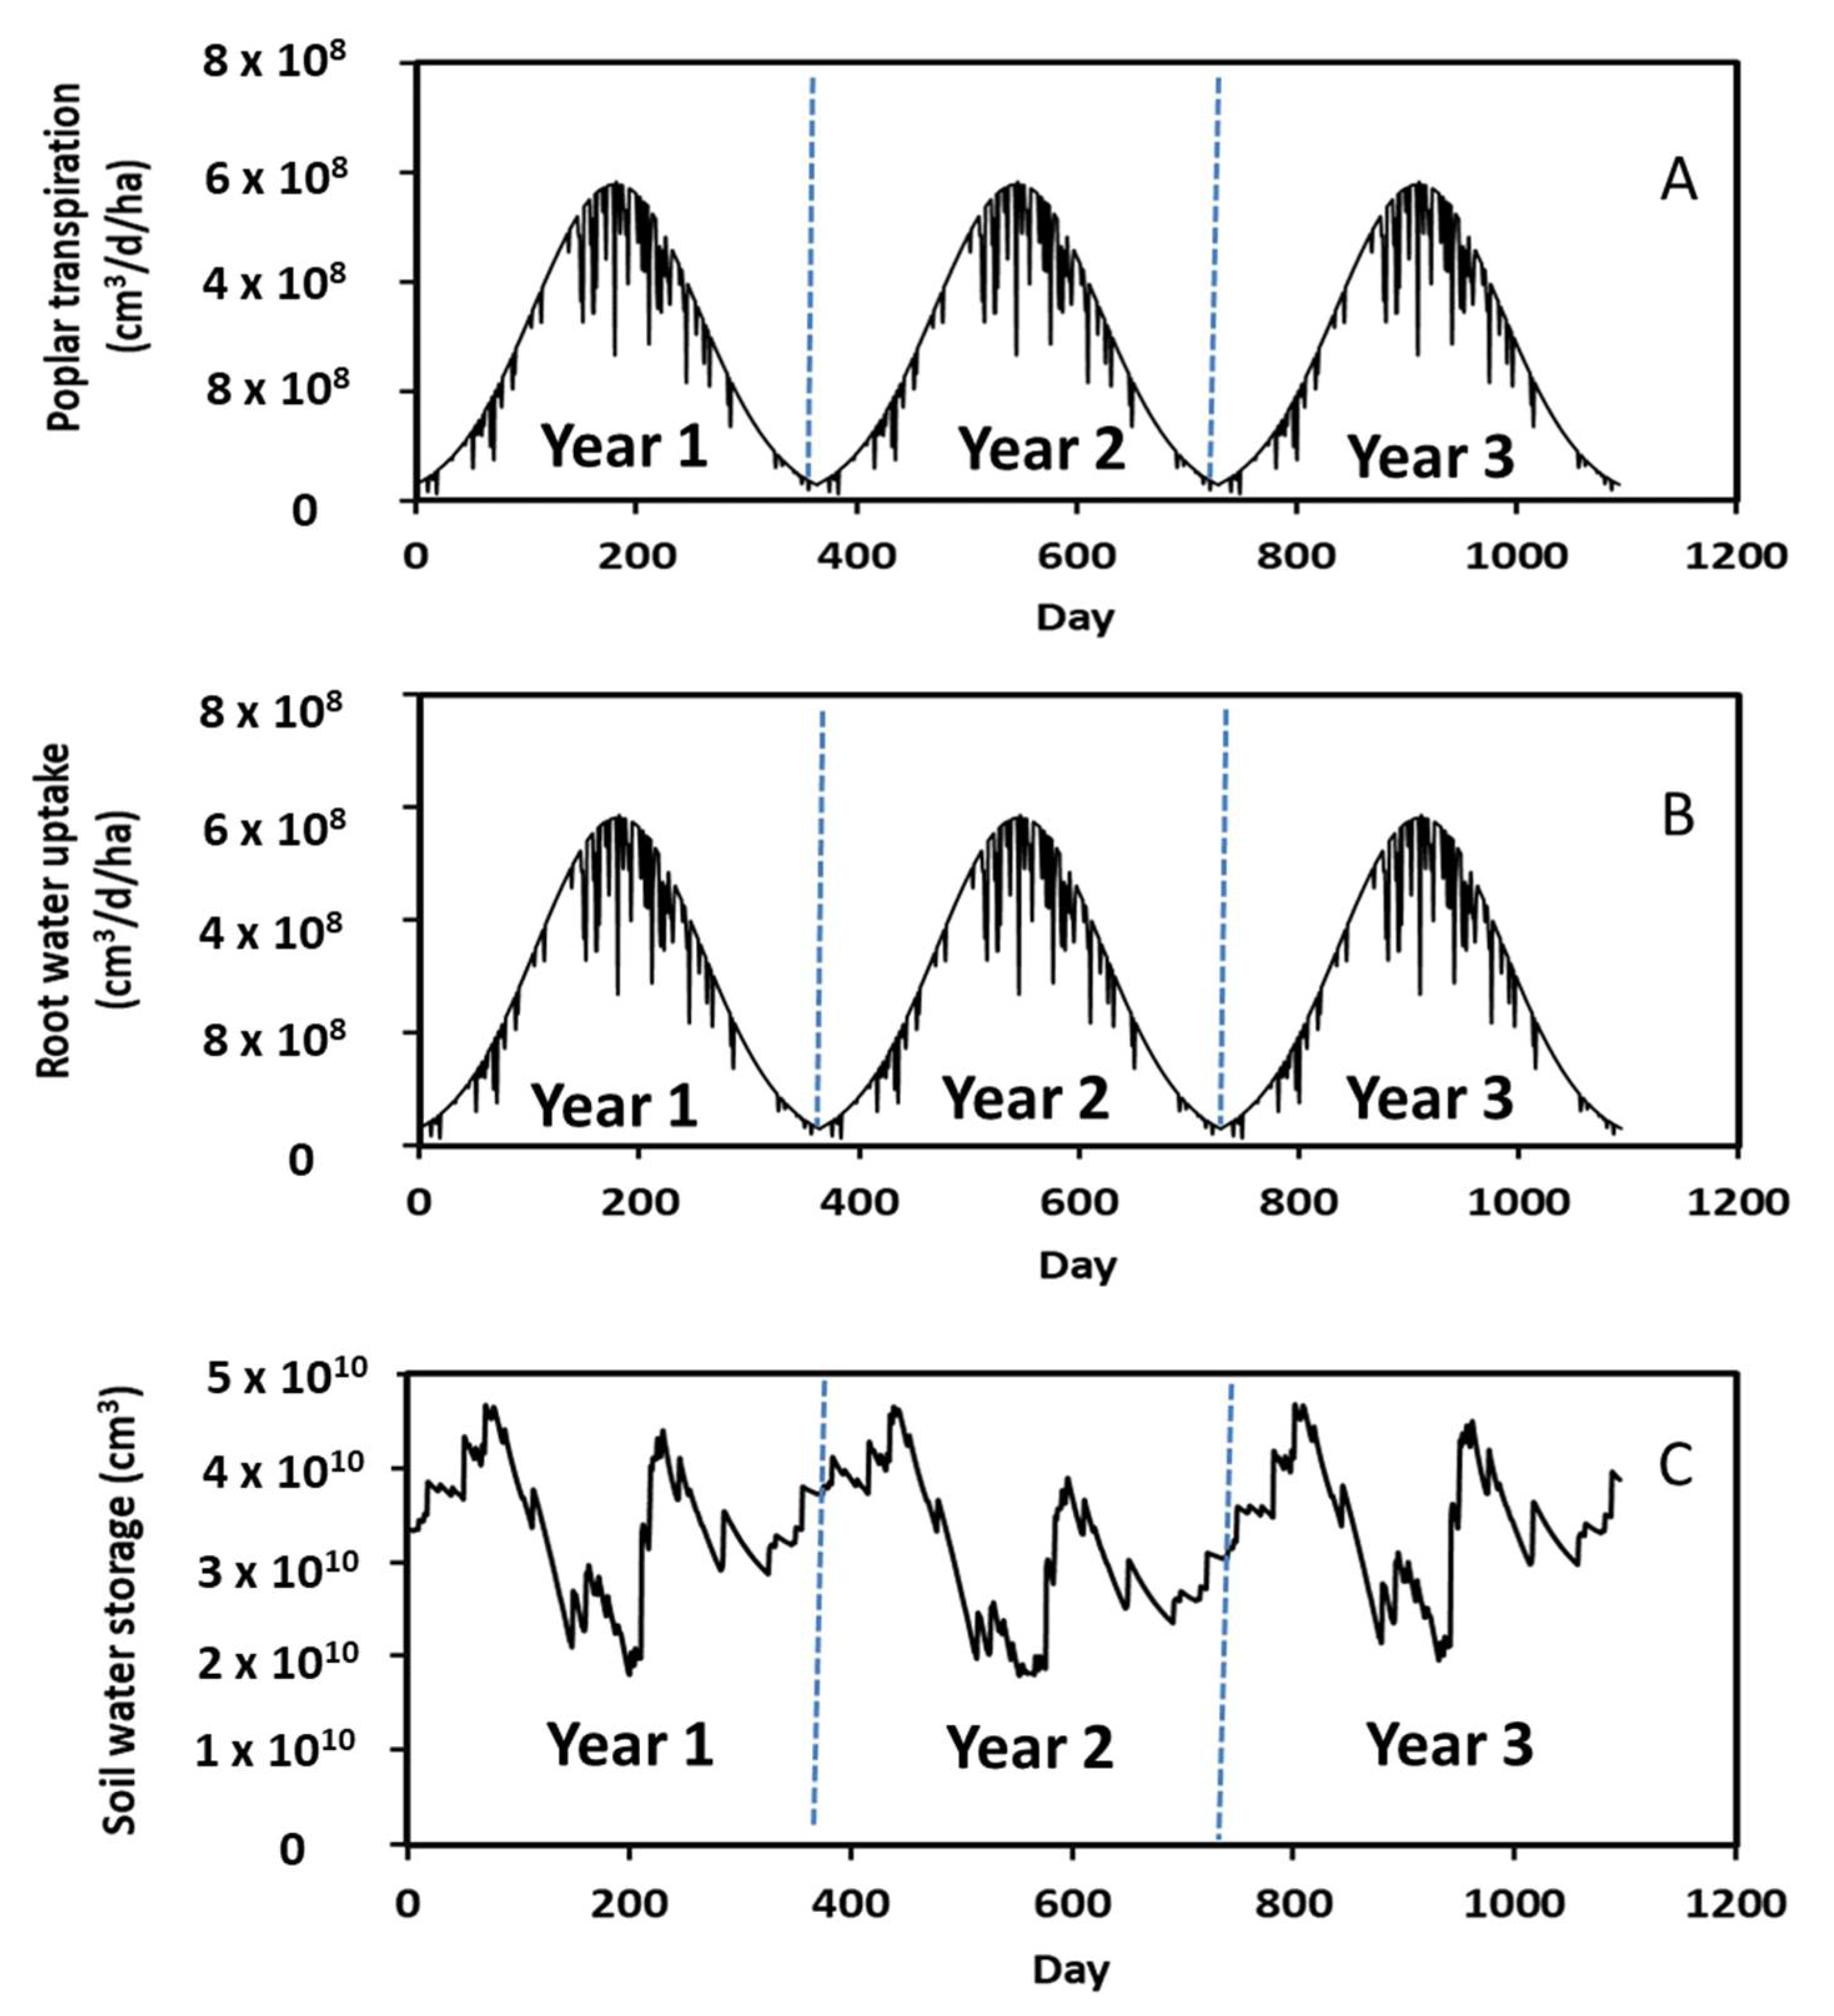
Annual changes in daily poplar leaf water transpiration, root water uptake, and soil water storage are given in Figure 6. Analogous to soil evaporation, a characteristic annual pattern was observed in leaf transpiration and root uptake, i.e., increasing from winter to summer followed by decreasing from summer to winter. The highest rate of leaf water transpiration was 5.69 × 108 cm3/d/ha during summer driven by warmer temperatures. More water is needed for leaf transpiration in summer than in fall and winter.
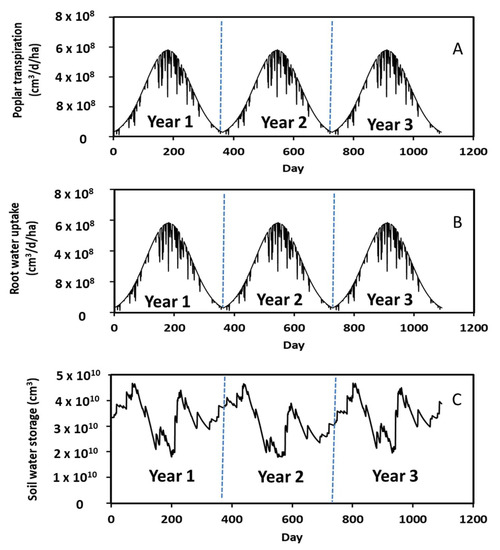
Figure 6.
Simulated daily leaf transpiration, root water uptake, and soil water storage during the 3-year period.
Leaf transpiration was affected by rainfall events and decreased with increasing rainfall rate and duration. For instance, there were more rainfall events between Days 224 to 235 in Year 1 (Figure 5A), which resulted in decreases in leaf water transpiration during this period (Figure 6A). In this study, we assumed that little to no leaf transpiration occurs during rainfall. The water vapor density is normally saturated if it is raining, and leaf transpiration ceases on a wet day [33]. Leaf transpiration was also affected by soil water storage. Analogous to rainfall events, low soil water storage reduced the leaf transpiration rates. The rate was 2.66 × 108 cm3/d/ha on Day 911 in Year 3 (Figure 6A) when the soil water storage was 1.81 × 1010 cm3 (Figure 6C), whereas the rate was 4.4 × 108 cm3/d/ha in Day 967 in Year 3 (Figure 6A) when the soil water storage was 3.42 × 1010 cm3 (Figure 6C). A 1.9-fold decrease in soil water storage decreased leaf water transpiration by a factor of 1.7. This occurred because there was less water in the soil for leaf transpiration. A similar annual pattern was observed in root water uptake. In other words, root water uptake increased from winter to summer and then decreased from summer to winter. Comparison of Figure 6B,C revealed that root water uptake was correlated to soil water storage. More specifically, an increase in root water uptake decreased soil water storage. Additionally, the daily leaf water transpiration rate (Figure 6A) had a similar variation pattern but slightly lower as compared to the root water uptake rate (Figure 6B). This occurred because 99% of water taken up by roots was lost through leaf transpiration based on Equation (8).
3.3. Biomass Production and Water Use Efficiency
Simulated biomass production of poplars over a 3-year period (i.e., between ages 6 and 8) is shown in Figure 7A. This figure shows the annual growth pattern, increasing from winter to summer and then decreasing from summer to next winter. Overall, the biomass production increased with ages. The net increase in biomass over the three years was 0.69 × 10⁴ kg/ha, a 65% increase. The 3-year average annual biomass production was 2.3 × 10⁴ kg/ha. This finding was comparable to that reported by Henderson and Lee [36]. These authors stated that the average annual biomass production of poplars from ages 6 to 8 is 1.37 × 10⁴ kg/ha.
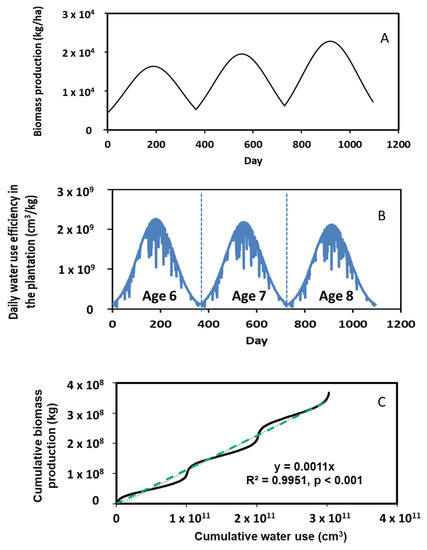
Figure 7.
Simulated biomass production, water use efficiency, and relationship of cumulative biomass and water use during the 3-year period.
Daily water use efficiency (WUE) over the 3-year simulation period is given in Figure 7B, which was calculated by dividing daily leaf water transpiration with daily biomass production. A typical annual pattern in WUE was predicted with more water being consumed to produce poplar biomass during summer. The average daily WUE was 1.05 × 109 cm3/kg/ha over the 3-year simulation period. Our simulations further revealed that the maximum annual water use decreased as the poplars aged. For instance, the maximum daily water use was 2.23 × 109 cm3/kg/ha at age 6, 2.19 × 109 cm3/kg/ha at age 7 and 2.07 × 109 cm3/kg/ha at age 8. It is apparent that less water was consumed to produce the same amount of biomass as time elapsed. This might be because there was an increasing WUE as the trees grow, but WUE plateaued upon maturity.
A linear correlation between cumulative biomass production and cumulative water use was identified (see the dashed line in Figure 7C) as
where YCBP is the cumulative biomass production (kg), and XCWU is the cumulative water use (cm3). Our literature search showed that no simulation has been accomplished to establish such a correlation. This correlation created a good reference for estimating the production of bioenergy plants in response to their water use, which could be useful for biomass producers to assess WUE in regions where overuse of water resources is a concern.
YCBP = 0.001 ∗ XCWU (R2 = 0.995, p < 0.001)
4. Conclusions
A typical annual variation pattern was simulated for soil evaporation, root water uptake, and leaf water transpiration, all of which increased from winter to summer followed by a decrease from summer to winter.
Water use efficiency revealed that more water was consumed to produce the same amount of biomass during summer than other seasons, whereas less water was consumed to produce the same amount of biomass as time elapsed and tree age increased, although the reasons for this phenomenon remain to be investigated.
A very good linear correlation between cumulative biomass production and cumulative water use was identified in this study. Our literature search showed that few studies have been conducted to establish such a correlation. This correlation revealed a good reference for estimating production of bioenergy plants in response to their water use.
It should be noted that groundwater and vadose zone water interaction was not included although the STELLA model covered soil water percolation. We also want to caution readers that the STELLA model was not validated because insufficient measured data are available for this purpose. Although most of the model input data were obtained from the same study site, there were some input data from other locations. Further study is, therefore, warranted to add the interaction for those plantations with shallow groundwater aquifer and validate the model using all of the input data from the same study site.
Author Contributions
Conceptualization, Y.O.; methodology, Y.O.; software, Y.O.; validation, Y.O.; data curation, Y.O.; writing—original draft preparation, Y.O.; writing—review and editing, S.D., J.M.G.III, D.M.A., and T.D.L. All authors have read and agreed to the published version of the manuscript.
Funding
This research received no external funding.
Informed Consent Statement
Not applicable.
Data Availability Statement
All data are reported in the manuscript.
Conflicts of Interest
The authors declare no conflict of interest.
References
- Farm Energy and Wood Energy, Poplar (Populus spp.) Trees for Biofuel Production. Farm Energy, Wood Energy 6 May 2014 (20140506). Available online: https://farm-energy.extension.org/poplar-populus-spp-trees-for-biofuel-production/ (accessed on 27 September 2021).
- Berguson, W.E.; Eaton, J.; Stanton, B. Development of hybrid poplar for commercial production in the United States: The Pacific Northwest and Minnesota experience. In Sustainable Alternative Fuel Feedstock Opportunities, Challenges and Roadmaps for Six U.S. Regions; Braun, R., Karlen, D., Johnson, D., Eds.; Soil and Conservation Society: Ankeny, IA, USA, 2010. [Google Scholar]
- Stanton, B.; Eaton, J.; Johnson, J.; Rice, D.; Schuette, B.; Moser, B. Hybrid poplar in the Pacific Northwest: The effects of market-driven management. J. Forestry 2002, 100, 28–33. [Google Scholar]
- González-García, S.; Gasol, C.M.; Gabarrell, X.; Rieradevall, J.; Moreira, M.T.; Feijoo, G. Environmental profile of ethanol from poplar biomass as transport fuel in Southern Europe. Renew. Energy 2010, 35, 1014–1023. [Google Scholar] [CrossRef]
- Langeveld, H.; Quist-Wessel, F.; Dimitriou, I.; Aronsson, P.; Baum, C.; Schulz, U.; Bolte, A.; Baum, S.; Köhn, J.; Weih, M.; et al. Assessing Environmental Impacts of Short Rotation Coppice (SRC) Expansion: Model Definition and Preliminary Results. BioEnergy Res. 2012, 5, 621–635. [Google Scholar] [CrossRef]
- Rizvi, R.H.; Singh, M.; Kumar, A.; Srivastava, S. Valuation of carbon sequestration by poplar based agroforestry systems in Yamunanagar, Haryana. Indian J. Agric. Sci. 2020, 90, 312–315. [Google Scholar]
- Hansen, E.; Moore, L.; Netzer, D.; Ostry, M.; Phipps, H.; Zavitkovski, J. Establishing Intensively Cultured Hybrid Poplar Planations for Fuel and Fiber; USDA Forest Service General Technical Report NC-78; Department of Agriculture, Forest Service, North Central Forest Experiment Station: St. Paul, MN, USA, 1983.
- Berndes, G.; Hoogwijk, M.; van den Broek, R. The contribution of biomass in the future global energy supply: A review of 17 studies. Biomass Bioenergy 2003, 25, 1–28. [Google Scholar] [CrossRef]
- Aylott, M.J.; Casella, E.; Tubby, I.; Street, N.R.; Smith, P.; Taylor, G. Yield and spatial supply of bioenergy poplar and willow short-rotation coppice in the UK. New Phytol. 2008, 178, 358–370. [Google Scholar] [PubMed]
- Bloemen, J.; Egi, R.; Ichot, S.F.; Horemans, J.A.; Broeckx, L.S.; Verlinden, M.S.; Zenone, T.; Ceulemans, R. Water use of a multigenotype poplar short-rotation coppice from tree to stand scale. GCB Bioenergy 2017, 9, 370–384. [Google Scholar] [CrossRef] [Green Version]
- Ashworth, K.; Wild, O.; Hewitt, C.N. Impacts of biofuel cultivation on mortality and crop yields. Nat. Clim. Chang. 2013, 5, 492–496. [Google Scholar] [CrossRef]
- Allen, S.J.; Hall, R.L.; Rosier, P.T.W. Transpiration by two poplar varieties grown as coppice for biomass production. Tree Physiol. 1999, 19, 493–501. [Google Scholar] [PubMed] [Green Version]
- Navarro, A.; Facciotto, G.; Campi, P.; Mastrorilli, M. Physiological adaptations of five poplar genotypes grown under SRC in the semi-arid Mediterranean environment. Trees 2014, 28, 983–994. [Google Scholar] [CrossRef]
- Fischer, M.; Trnka, M.; Kučera, J.; Deckmyn, G.; Orság, M.; Sedlák, P.; Žalud, Z.; Ceulemans, R. Evapotranspiration of a high-density poplar stand in comparison with a reference grass cover in the Czech–Moravian Highlands. Agric. For. Meteorol. 2013, 181, 43–60. [Google Scholar] [CrossRef]
- Bungart, R.; Hüttl, R.F. Growth dynamics and biomass accumulation of 8-year-old hybrid poplar clones in a short-rotation plantation on a clayey sandy mining substrate with respect to plant nutrition and water budget. Eur. J. For. Res. 2004, 123, 105–115. [Google Scholar] [CrossRef]
- Petzold, R.; Schwarzel, K.; Feger, K.H. Transpiration of a hybrid poplar plantation in Saxony (Germany) in response to climate and soil conditions. Eur. J. For. Res. 2011, 130, 695–706. [Google Scholar] [CrossRef]
- Linderson, M.L.; Iritz, Z.; Lindroth, A. The effect of water availability on standlevel productivity, transpiration, water use efficiency and radiation use efficiency of field-grown willow clones. Biomass Bioenergy 2007, 31, 460–468. [Google Scholar] [CrossRef]
- Tricker, P.J.; Pecchiari, M.; Bunn, S.M.; Vaccari, F.P.; Peressotti, A.; Miglietta, F.; Taylor, G. Water use of a bioenergy plantation increases in a future high CO2 world. Biomass Bioenergy 2009, 33, 200–208. [Google Scholar] [CrossRef]
- Miller, R.O.; Bender, B.A. Proceedings from Sun Grant National Conference for Biomass Feedstock Production and Utilization, New Orleans, LA, USA. Available online: https://bioenergykdf.net/content/proceedings-2012-sun-grant-national-conference-science-biomass-feedstock-production-and (accessed on 25 December 2021).
- Zamora, D.; Wyatt, G.; Apostol, K.; Tschirner, U. Biomass yield, energy values, and chemical composition of 21/25 hybrid poplar in short rotation woody crops production and native perennial grasses in Minnesota, USA. Biomass Bioenergy 2013, 49, 222–230. [Google Scholar] [CrossRef]
- Zalesny, R.S., Jr.; Hall, R.B.; Zalesny, J.A.; McMahon, B.G.; Berguson, W.E.; Stanosz, G.R. Biomass and genotype environment interactions of Populus energy crops in the Midwestern United States. BioEnergy Res. 2009, 2, 106–122. [Google Scholar] [CrossRef]
- Davis, J.M. Genetic improvement of poplar (Populus spp.) as a bioenergy crop. In Genetic Improvement of Bioenergy Crops; Vermerris, W., Ed.; Springer Science & Business Media: Berlin, Germany, 2008. [Google Scholar]
- Sampson, D.A.; Ceulemans, R. SECRETS: Simulated carbon fluxes from a mixed coniferous/deciduous Belgian forest. In Forest Ecosystem Modelling, Upscaling and Remote Sensing; Ceulemans, R.J.M., Veroustraete, F., Gond, V., Van Rensbergen, J.B.H.F., Eds.; SPB Academic Publishing: The Hague, The Netherlands, 2000; pp. 95–108. [Google Scholar]
- Deckmyna, G.; Laureysensa, I.; Garciab, J.; Muysb, B.; Ceulemansa, R. Poplar growth and yield in short rotation coppice: Model simulations using the process model SECRETS. Biomass Bioenergy 2004, 26, 221–227. [Google Scholar] [CrossRef]
- Hart, Q.J.; Tittmann, P.W.; Bandaru, V.; Jenkins, B.M. Modeling poplar growth as a short rotation woody crop for biofuels in the Pacific Northwest. Biomass Bioenergy 2015, 79, 12–27. [Google Scholar] [CrossRef] [Green Version]
- Ouyang, Y.; Zhang, J.E.; Leininger, T.D.; Frey, B. A STELLA model to estimate water and nitrogen dynamics in a short-rotation woody crop plantation. J. Environ. Qual. 2015, 44, 200–209. [Google Scholar] [CrossRef]
- Ouyang, Y.; Feng, G.; Renninger, H.; Leininger, T.D.; Parajuli, P.; Grace, J.M. A STELLA-Based Model to Simultaneously Predict Hydrological Processes, N Uptake and Biomass Production in a Eucalyptus Plantation. Forests 2021, 12, 515. [Google Scholar] [CrossRef]
- Ouyang, Y.; Zhang, J.E.; Lin, D.; Liu, D.G. A STELLA model for the estimation of atrazine runoff, leaching, adsorption, and degradation from an agricultural land. J. Soils Sediments 2010, 10, 263–271. [Google Scholar] [CrossRef]
- Lee, K.H.; Jose, S. Nitrate leaching in cottonwood and loblolly pine biomass plantations along a nitrogen fertilization gradient. Agric. Ecosyst. Environ. 2005, 105, 615–623. [Google Scholar] [CrossRef]
- USDA-SCS. National Engineering Handbook; USDA–SCS: Washington, DC, USA, 1973.
- Mullins, J.A.; Carsel, R.F.; Scarbrough, J.E.; Ivery, A.M. PRZM-2, a Model for Predicting Pesticides Fate in the Crop Root and Unsaturated Soil Zones: User Manual for Release 2.0; US-EPA; U.S. Department of Energy Office of Scientific and Technical Information: Athens, GA, USA, 1993.
- Baiamonte, G. Simplified Interception/Evaporation Model. Hydrology 2021, 8, 99. [Google Scholar] [CrossRef]
- Nobel, P.S. Biophysical Plant Physiology and Ecology; Freeman and Company: San Francisco, CA, USA, 1983. [Google Scholar]
- Jenkins, J.C.; Chojnacky, D.C.; Heath, L.S.; Birdsey, R.A. Comprehensive Database of Diameter-Based Biomass Regressions for North American Tree Species; General Technical Report NE-319; USDA, Forest Service: Newtown Square, PA, USA, 2003.
- Edmondson, J.; Friedman, J.; Meko, D.; Touchan, R.; Scott, J.; Edmondson, A. Dendroclimatic potential of plains cottonwood (Populus deltoides subsp. monilifera) from the northern great plains, USA. Tree Ring Res. 2014, 70, 21–30. [Google Scholar] [CrossRef] [Green Version]
- Henderson, D.E.; Jose, S. Biomass production potential of three short rotation woody crop species under varying nitrogen and water availability. Agrofor. Syst. 2010, 80, 259–273. [Google Scholar] [CrossRef]


Publisher’s Note: MDPI stays neutral with regard to jurisdictional claims in published maps and institutional affiliations. |
© 2022 by the authors. Licensee MDPI, Basel, Switzerland. This article is an open access article distributed under the terms and conditions of the Creative Commons Attribution (CC BY) license (https://creativecommons.org/licenses/by/4.0/).