1. Introduction
Decay or cavities inside trees are some of the main causes of tree collapse and breakage. Structurally weakened trees are more vulnerable to strong winds and heavy rain. The damage caused by trees uprooting and falling has been increasing due to intensifying strong winds and torrential downpours as a result of climate change, thereby leading to major social problems such as damage to human life and property. In addition to trees on streets, trees designated as cultural properties (such as those around natural monuments and cultural heritage sites) that are old and tall are more vulnerable to natural disasters. Considering their biological characteristics, it is very difficult to restore them once damaged, and the cumulative loss of value of natural heritage has a great impact on the public over time. In South Korea, approximately 81% of old trees designated as natural monuments have been damaged by typhoons, strong winds, and rainfall since 2008. A 250-year-old fir tree (Abies holophylla) at Haeinsa Temple, Hapcheon, fell because of a typhoon in 2019, and a large internal cavity that had not been detected by visual inspection was later revealed.
Determining the extent of damage inside trees by visual inspection is difficult. Therefore, applications of invasive or noninvasive diagnostic methods are required. For trees designated as natural monuments or cultural heritage sites, it is essential to employ preventive tree management by applying a noninvasive diagnostic method that minimizes physical damage as much as possible.
If defects such as internal cavities can be detected in the tree beforehand, the bearing capacity of the tree can be strengthened in layers. The tree’s crown density can be controlled, and trunk support structures can be installed to prepare for natural disasters such as strong winds and heavy snow, according to the degree of risk. Based on such scientific evidence, the involved institutions and organizations can implement policies to preserve natural heritage in a way that minimizes damage to the trees.
Noninvasive methods include acoustic sounding methods, stress wave timers, multi-sensor tomography, computed tomography, and X-ray analysis. Sonic tomography (SoT) measures the rate of stress wave transmission in various directions depending on the modulus of elasticity and wood density. In general, the sonic velocity of parts of a tree that contain decay or cavities tends to be lower than that of the healthy parts [
1]. In particular, this method is highly applicable to old trees because it can provide information on the entire cross-section of trees, be used for large trees, and be applied safely in the field.
To date, studies [
1,
2,
3,
4,
5,
6] on SoT methods have mainly been conducted on European and tropical tree species. SoT studies on native Asian species or old trees are insufficient, except those conducted on native zelkova and fir trees in urban parks in China [
7,
8,
9].
Oriental white oak (
Quercus aliena) is a deciduous, broad-leaved tree that grows to approximately 30 m in height. It is native to East Asia, including Korea, Japan, and China. In South Korea, oriental white oak has a high cultural and historical value as a major tree species planted around royal tombs, and these trees have also been designated as natural monuments. In a previous study on a similar tree species, the accuracy of SoT to detect tree defects was indirectly measured by visually comparing nine wooden sections of white oak (
Quercus alba L.) native to eastern and central North America. Another study measured the degree of incipient decay detection over 2–27 months by inoculating English oak (
Quercus robur L.), which grows in most parts of Europe, with four types of fungi [
10,
11]. A variation in the measurement accuracy was observed according to tree species and decay level even among oak trees; SoT detected decay in white oak trees with 90% accuracy but failed to detect incipient decay between 2 and 27 months in English oak trees. Since the measurement accuracy of SoT varies according to the species and types of defects, prior verification of the error rate of the SoT measurement for each species is required.
In this study, sonic tomography was conducted on oriental white oak trees, a species that entails a high cultural value as they are a primary tree species that constitute the royal tombs in Korea and are also designated as natural monuments. Sonic tomography measurements and minimally invasive drill resistance measurements were cross-compared. The accuracy of the minimally invasive sonic tomography was verified through comparisons with the cross-section of the wood.
Resistance micro-drilling (RM) detects internal defects by measuring the density change using a drilling needle (tip diameter 3 mm, shaft diameter 1.5 mm) that can penetrate a wood section with different densities. Owing to the high accuracy of RM, it is widely used for wood decay detection and structural diagnosis [
12,
13,
14,
15]. However, this technique has limitations because it is affected by moisture, leaves, and small holes, which can cause infection and discoloration when penetrating the wood.
To expand the application of a nondestructive method to old oriental white oak trees, ensuring the reliability of the method is an integral part of managing the trees’ lives. Since visual detection of internal defects is difficult in old trees, it is essential to apply a noninvasive detection method that will allow the prevention or reduction of tree damage in advance. Therefore, we aimed to compare the results obtained by SoT and RM in old oriental white oak and verified the accuracy of noninvasive SoT by comparing it with the results obtained from wood cross-sectioning.
2. Materials and Methods
A comparative study of SoT and RM was conducted on 100-year-old oriental white oak trees from the Jongmyo Shrine in Seoul and Gwangneung, Gyeonggi-do, South Korea. Jongmyo is a Confucian shrine covering an area of 19 ha. It enshrines ancestral tablets of successive kings and queens of the Joseon Dynasty, and it is also where ceremonies are performed. Recognized for its tangible and intangible historical and cultural value (Criterion IV), it was registered as a UNESCO World Heritage Site in 1995. The forest in Jongmyo Shrine is an important part of this area, as it has been a historical and cultural landscape forest for more than 100 years. Moreover, it also serves as the carbon sink of the city because it is located in its center.
In this study, noninvasive SoT was applied to old oriental white oak with a height of 15–21 m and an average breast height of 228 cm. To analyze the reliability of the measurement results by SoT, they were compared with the measurements taken using invasive RM and actual wood sectioning after felling. The details of the studied trees are given in
Table 1 and
Table 2. SoT tomograms were compared with wood sections and RM profiles in the field survey. For the first session of investigation, SoT was conducted on 6 oriental white oak trees that were planned to be cut down in September 2018 (
Table 1). After cutting them down, 10 wood discs were extracted (collected in February 2019) to compare SoT tomograms with actual defects in cross-sections (e.g., decay, cavities, cracks). For the second session of the investigation, SoT was performed on 18 oriental white oak trees from June to July 2021 (
Table 2). RM was performed for 91 measuring points (MPs). Outliers were removed in the interquartile range (IQR) before analyzing the 85 measuring points to improve the reliability and accuracy of the statistical analysis results. For the cross-verification of SoT and RM, the length (cm) of the defective area at 85 MPs was compared, and then a
t-test and simple linear regression analysis were performed using SPSS 21.0 (IBM Corp., Armonk, NY, USA).
PiCUS 3 sonic tomography (Argus Electronic GmbH, Rostock, Germany) was used to measure the geometry of the cross-sections at heights ranging from 30 to 100 cm from the ground. The PiCUS 3 software converts the sonic velocity into a two-dimensional SoT tomogram, with a dark auburn color indicating high sonic velocity through healthy tissues (high density), red and blue colors indicating low sonic velocity through defects (decay and cavities), and a green color indicating incipient decay, which is the transition zone between healthy and defective areas.
After SoT measurement, electric resistance tomography (ERT) was applied to the fallen trees to detect incipient decay, which is difficult to detect using SoT. ERT involves measuring the moisture content level of a cross-section of wood and the electrical resistance of chemical elements using current and voltage, which change according to the wood condition and cell structure. It also shows the distribution of high and low conductivity areas. ERT was measured using PiCUS 3 Treetronic (Argus Electronic GmbH) in this study.
To obtain comparative data to verify the reliability of the SoT results, a minimally invasive RM (Rinntech-Metriwerk GmbH & Co, Rinntech Resistograph 650, Heidelberg, Germany) was applied. In this study, 91 MPs were measured from the tree bark to the heartwood (radial direction) parallel to the ground based on the suspected defect and four aspects of the SoT tomogram.
3. Results
3.1. Comparison of SoT and ERT Tomograms of Wood Sections
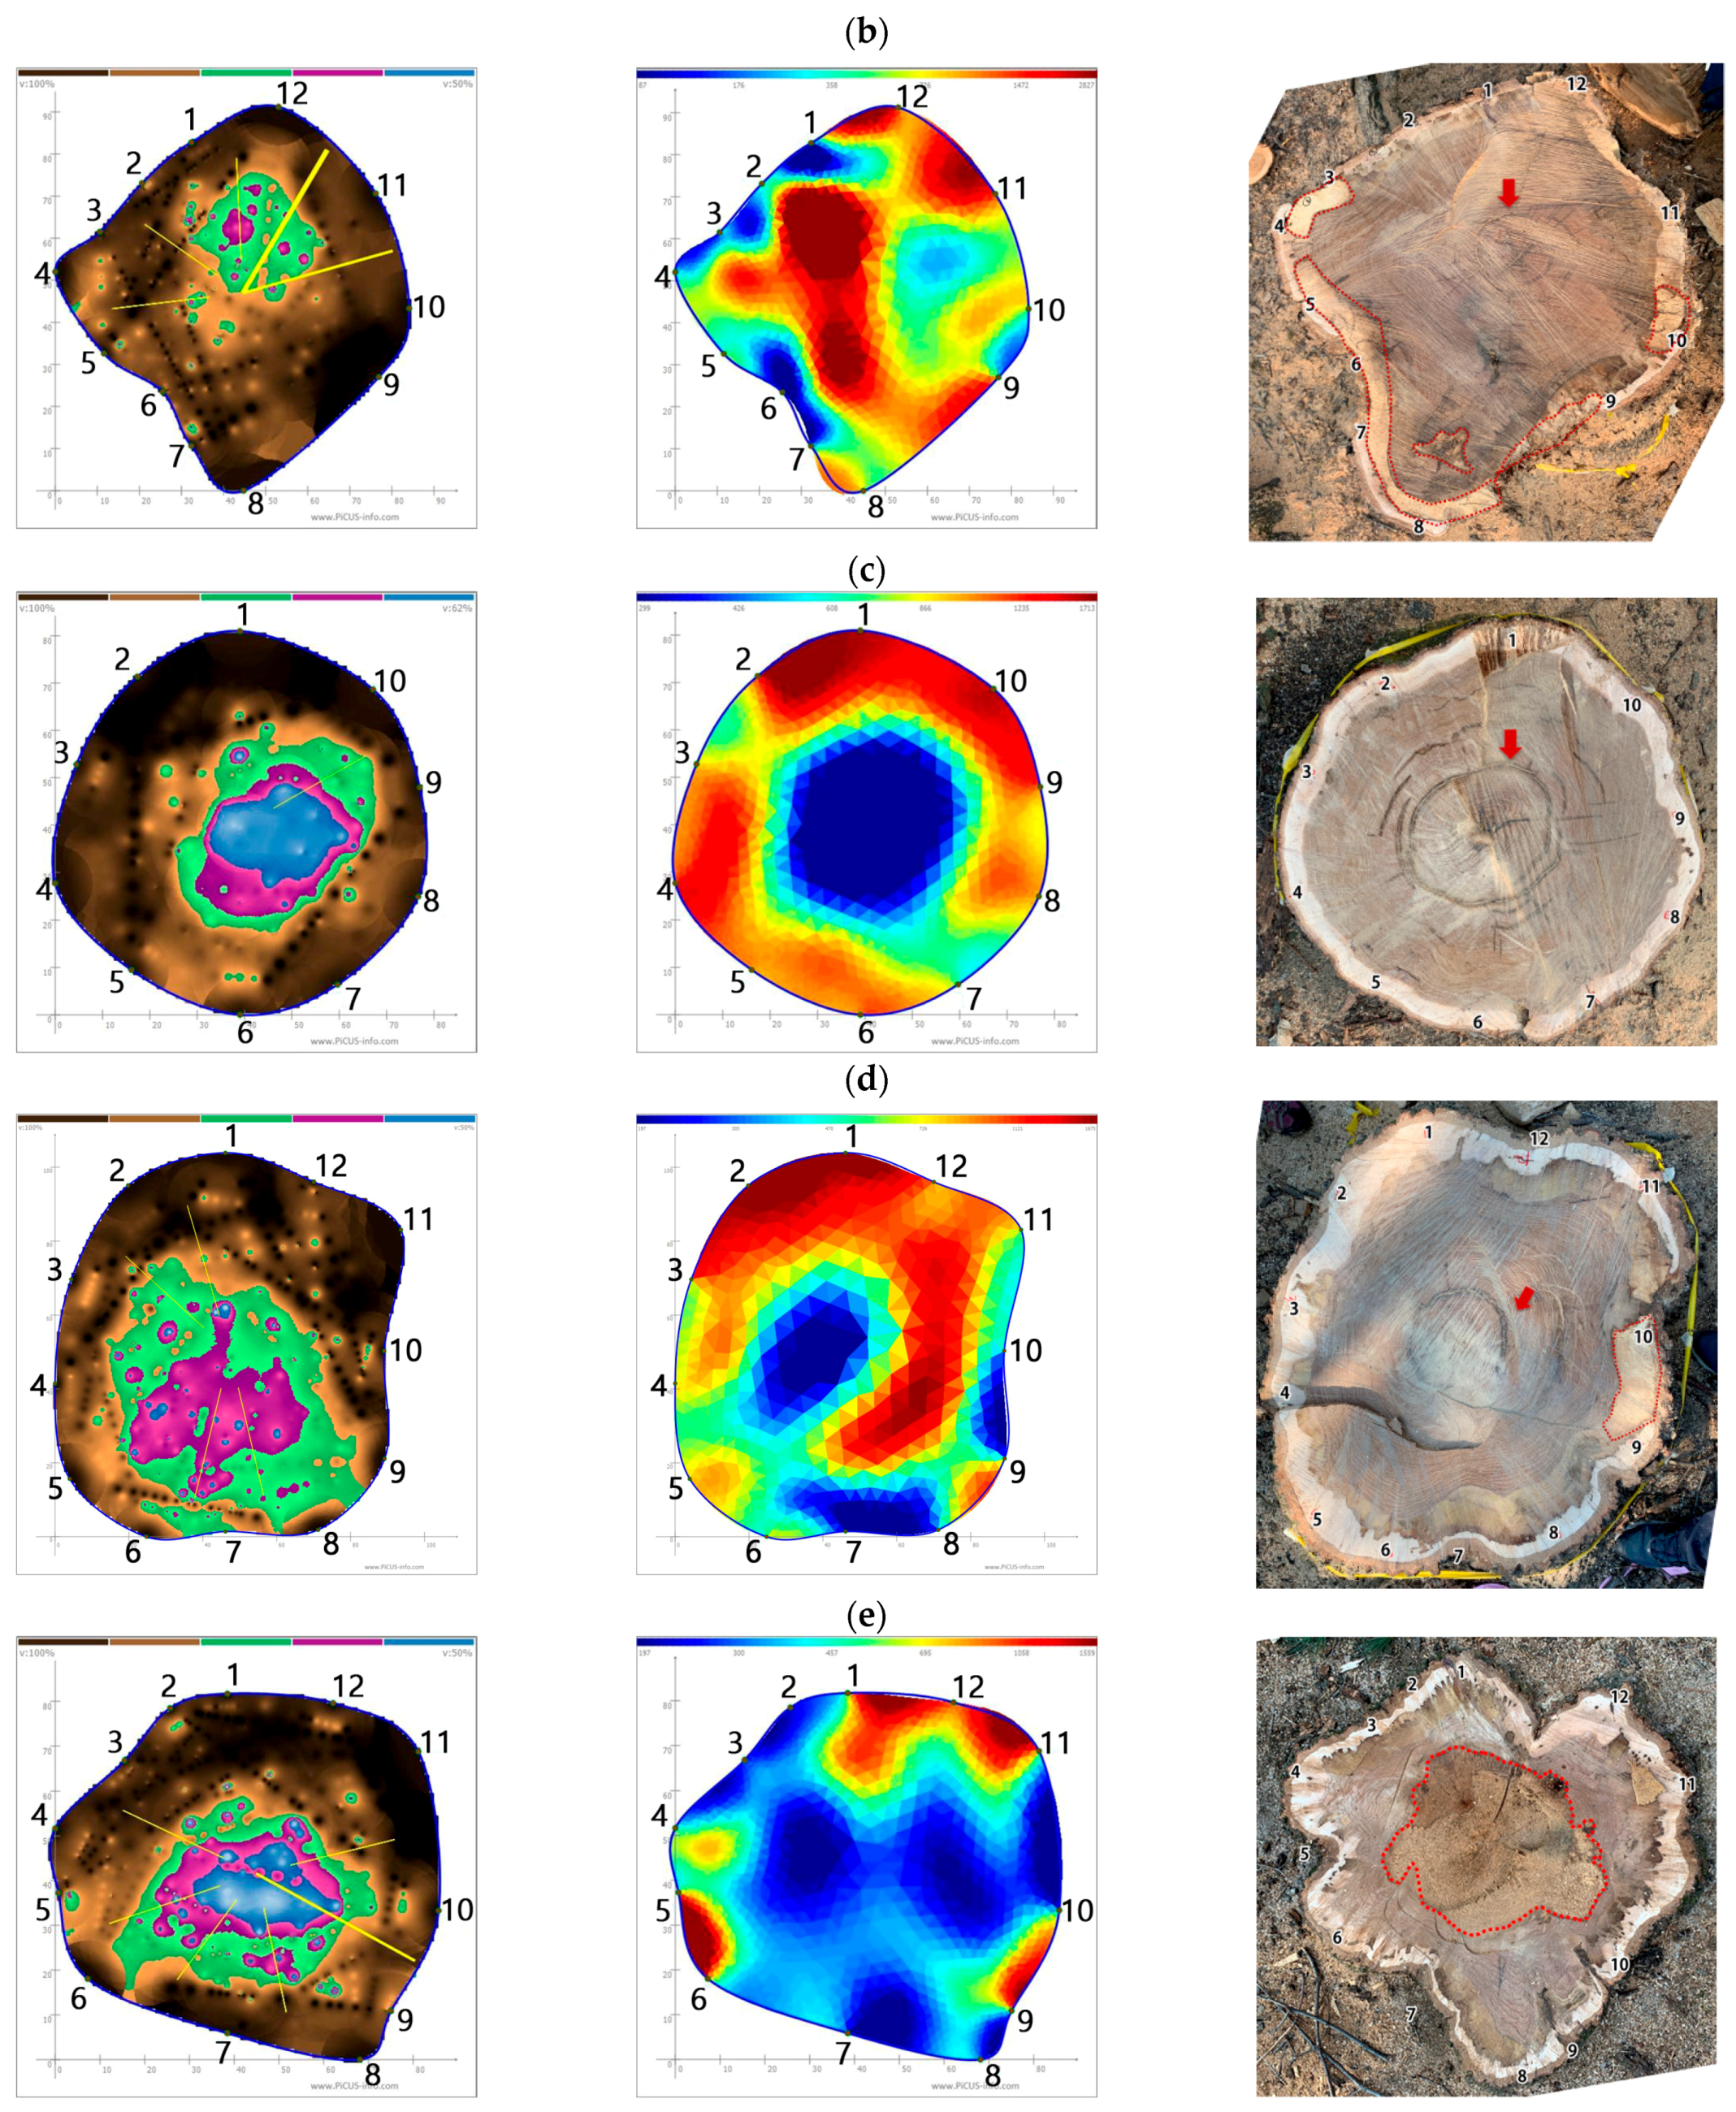
Figure 1 and
Table 3 present the comparison between the SoT tomograms of 10 wood sections of oriental white oak trees with the actual defects. In
Figure 1a–d, after combining the SoT and ERT tomograms, it was observed that the sonic velocity inside the wood gradually slowed down in the SoT tomograms; it was predicted that there would be cavities or decay in the heartwood, accounting for an average area of 20.5% with the possibility of several cracks (yellow lines). Based on the ERT tomograms, the area between MP2~9 of sapwood in
Figure 1a and the areas including MP1~4, MP6~7, and MP9~10 of sapwood in
Figure 1b, heartwood in
Figure 1c, and MP9~10 and MP7~8 in
Figure 1d may have had undetected incipient decay by SoT because of the low electrical resistance and relatively high moisture content in the center of the heartwood.
In contrast, after comparing with the actual cross-section, no damage, such as decay or cavity, was observed in
Figure 1a–d, but ring shakes were present. The actual area with defects, including incipient decay, was 0%~5.2%, with an average error of approximately 17.6% from that measured by SoT; the wood damage detected was estimated to be larger than the actual defects. The incipient decay of sapwood, which was not detected by the SoT tomogram, was detected in the ERT tomograms. This indicates that the wood remains relatively dense when incipient decay is present. Additionally, the moisture content in the ring shake area was relatively high, which seemed to be due to active decay at the crack site detected in the ERT tomograms.
Figure 1e,f are the cases in which the SoT tomogram accurately represented the actual defect, and a large-scale internal defect was detected in the SoT tomogram. In
Figure 1e, the active decay area detected by SoT was 31.9% of the area centered on the heartwood. In
Figure 1f, the active decay area detected by SoT was 61.3% of the area, with dead decay, active decay, and cavity predicted to expand in the MP4~7 direction from the heartwood. After comparing with the actual wood section, the error in the defect area was 3.6%, and the SoT tomogram reflected the actual location and size of the decay.
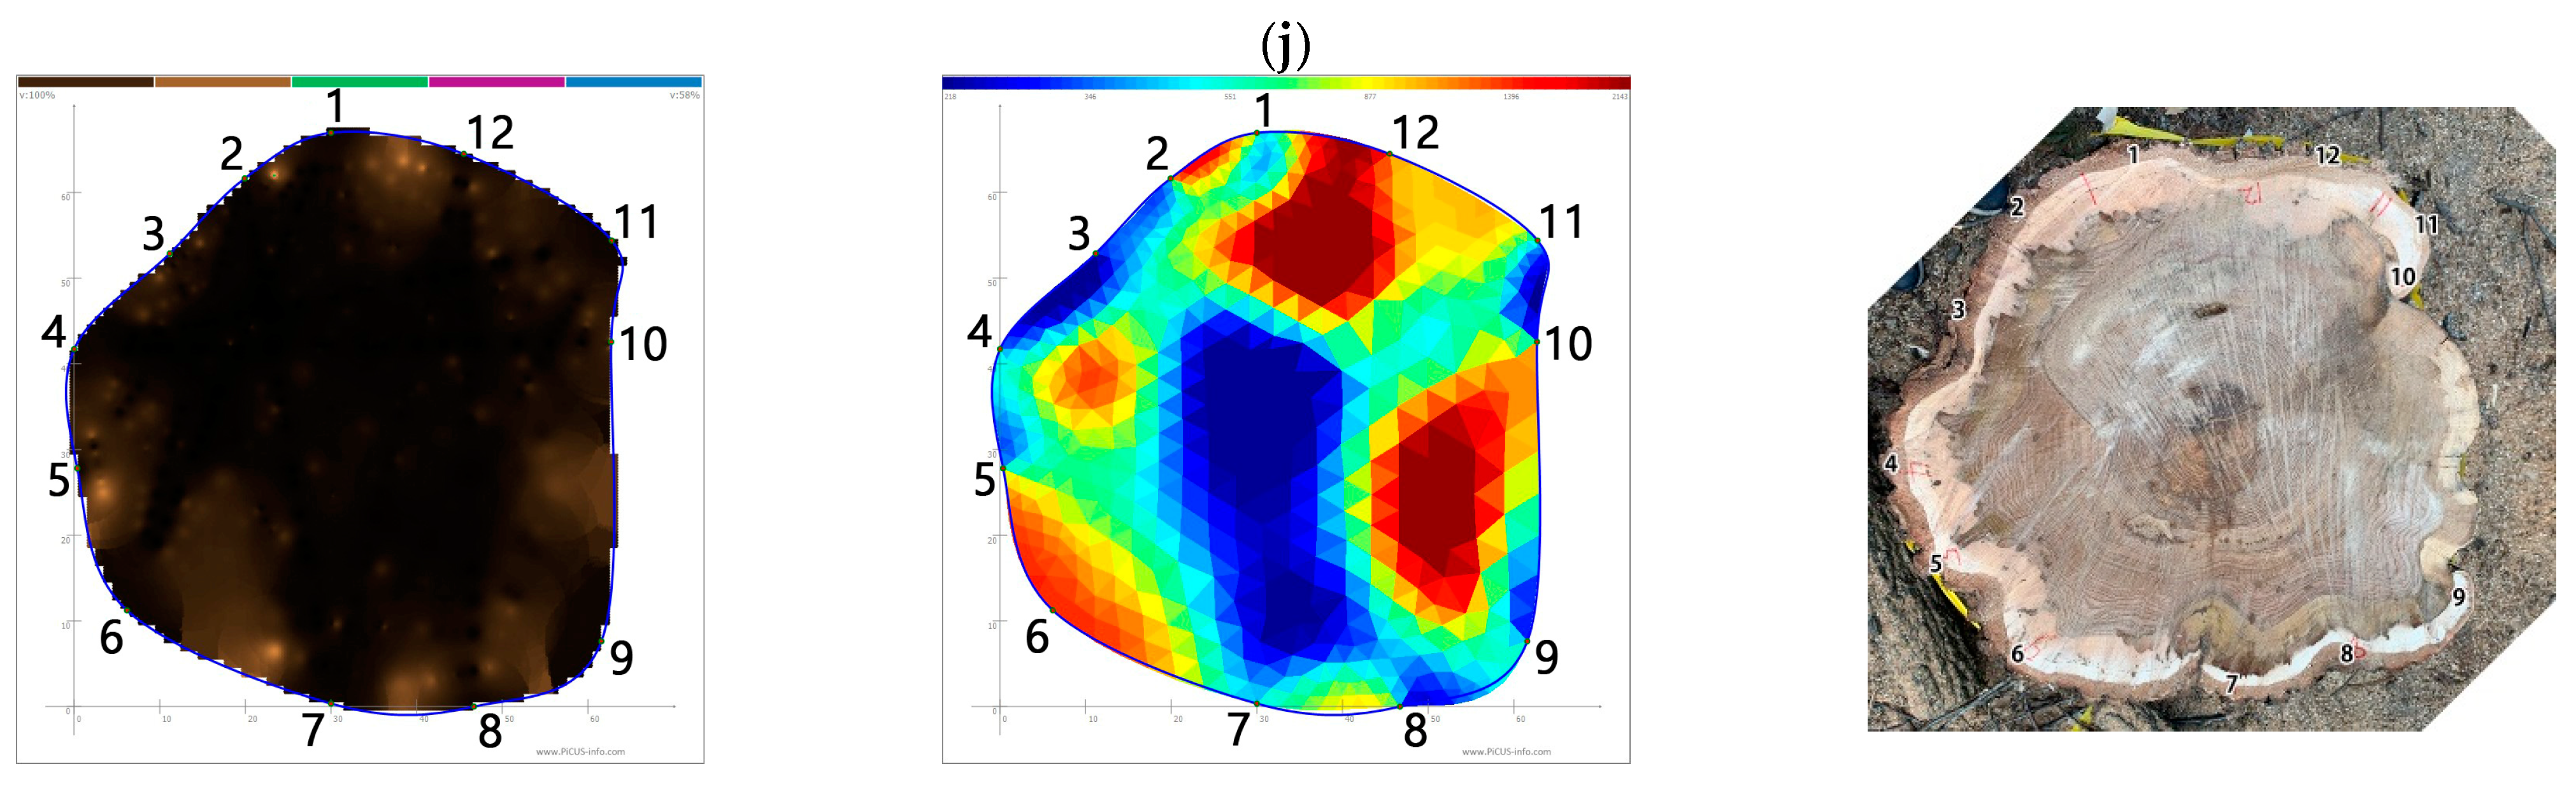
SoT tomograms in
Figure 1g–j revealed that the sonic velocity was constant and that wood density was mostly normal. Some sapwood or heartwood areas had low electrical resistance and relatively high moisture content, with the possibility of incipient decay undetected in SoT tomograms. Some incipient decay was identified in the actual wood section, which was a minor defect that did not yet affect the wood density. In
Figure 1g, white rot was identified in the sapwood of MP2~8, as shown in the ERT tomogram. In
Figure 1h, most of the wood, except for MP1, was healthy. In
Figure 1i, white rot was observed between the heartwood and sapwood of MP9~11; however, the overall wood density was sound. In
Figure 1j, the sonic velocity was normal, but the possibility of incipient decay was detected because of the high moisture content in the ERT tomogram. Discoloration of the site was observed in the actual cross-section, with expected advancement of incipient decay (Argus Electronic Gmbh 2017). The analysis of the area of defect for
Figure 1g–j revealed that the defects of the SoT tomogram were 0~(−)12.3%, with an average error of (−)4.6%. The actual defect was somewhat underestimated because incipient decay was not detected in the SoT tomogram.
3.2. Comparison of SoT and RM Results
The results of RM and SoT measurements are presented in
Table 4. To analyze the error rate of the measurement results of SoT, RM was performed on the same 85 MPs (
Table A1,
Appendix A), and an independent
t-test and regression analysis were performed. The
t-test analysis of the tomograms and RM profiles at 85 measuring points showed an average defect length of 8.1 cm and 6.1 cm for SoT tomograms and RM profiles, respectively. The average error rate was 2.0 cm, and there was no significant difference between the two groups (
Table 4). The linear regression analysis revealed that the regression model was significantly positively correlated with the change in the RM results of the regression equation. However, the correlation with the RM results, with an explanatory power of 40.5%, was lower than those observed in fir (R
2 = 0.675) and zelkova trees (R
2 = 0.764) [
8,
9] (F = 56.442,
p < 0.001, R
2 = 0.405,
Figure 2).
4. Discussion
The t-test results of the RM profile and sonic tomograms of the oriental white oak trees showed that the average measured defect length was not significantly different between the two groups. The regression model of the sonic tomogram concerning the RM profile was positively correlated, and the regression equation R2 had a value of 0.405.
When compared with those of the needle fir and zelkova tree, the average error rates between drill resistance measurements and SoT for all three tree species showed no statistically significant difference. However, the explanatory power of the regression equation of the sound tomogram on drill resistance measurements was 67.5% and 76.4% for zelkova and needle fir, respectively, and the SoT measurement error was relatively low. The internal ring shakes are suspected to be the cause of the higher error rate in oriental white oak trees than in other tree species.
Even in comparison with the actual cross-section,
Figure 1a–d had ring shakes at the center of the cross-section, where the cracks may have led to an overestimation of defects compared to actual defects. Moreover, the error rate was the highest, with an average of 17.6% and a maximum of 39.9%. This observation is consistent with the operating manual [
16]. These cracks are mostly present in the radial direction and extend up and down in vertical planes within the trunk, effectively cutting off the linear propagation of the acoustic waves and diverting them to a much longer travel path [
3].
In
Figure 1g–j, it was confirmed that the SoT tomogram could detect the actual defect location and size trend, as well as the possibility of incipient decay. After quantifying the defect area, the average error between the result of the SoT tomogram and the actual decay area of the wood section was only 3.6%. In addition, for defects detected by SoT, decay types, such as dead decay and active decay, can be subdivided based on the ERT tomograms. Moreover, ERT effectively identified where the decay started, i.e., incipient decay, which SoT cannot detect because incipient decay is characterized by being relatively dense based on the sonic velocity. However, particularly ring or star-shaped shakes block the linear propagation of sound waves and divert the path to detect defects larger than the actual wood damage, thereby increasing the error rate.
Oriental white oak showed a lower accuracy of the SoT measurement than other tree species, which might be because of the increased error rate caused by internal ring shakes. However, the cause of such cracks may be a combination of various reasons, such as the growing environment conditions of the trees or the species’ physical and anatomical traits. Therefore, additional research in the future is needed.
Because the error is relatively high in the SoT tomograms of oriental white oak compared with other species, when an on-site internal diagnosis is conducted, the measurement accuracy can be improved by reducing the overestimation error in the tomograms through an invasive measurement method, e.g., additional RM, to determine decay and defects.
5. Conclusions
There was a significant difference in the average defect length in wood between the results obtained by RM and SoT in 100-year-old oriental white oak trees growing at a UNESCO World Heritage Site. The two groups showed no meaningful difference in error rate, and even though SoT tomograms and RM showed a positive correlation resistance value, the explanatory power was low compared to zelkova and needle fir trees. In comparison with the actual wood sections, the presence of ring shakes inside led to an overestimation of defects in the SoT tomograms.
The error between SoT and RM was observed to increase with the presence of cracks. In most other cases, the tomograms accurately detected the location, type, and size of actual defects by comparing the wood sections with each tomogram.
As SoT allows the monitoring of changes in internal decay or cavities that are difficult to detect by visual inspection while minimizing the invasive impact on trees, it seems to be an effective method of preventive management for trees for which invasive methods cannot be applied. However, to reduce the error of overestimation of defects because of cracks, the accuracy of the measurement can be improved by using additional RM.


