Article

Modelling Response of Norway Spruce Forest Vegetation to Projected Climate and Environmental Changes in Central Balkans Using Different Sets of Species

by
Dragica Obratov-Petković
1,
Jelena Beloica
1,
Dragana Čavlović
1,*,
Vladimir Djurdjević
2,
Snežana Belanović Simić
1 and
Ivana Bjedov
1
1
Faculty of Forestry, University of Belgrade, Kneza Višeslava 1, 11030 Belgrade, Serbia
2
Institute of Meteorology, Faculty of Physics, University of Belgrade, 11000 Belgrade, Serbia
*
Author to whom correspondence should be addressed.
Forests 2022, 13(5), 666; https://doi.org/10.3390/f13050666
Submission received: 27 March 2022 / Revised: 21 April 2022 / Accepted: 21 April 2022 / Published: 26 April 2022
(This article belongs to the Special Issue Responses of Forest Ecosystems to Climate Change)

Abstract

:
The structure and function of many forest ecosystems will be modified as a result of air pollution and climate change. Norway spruce (Picea abies L.) forests are among the first terrestrial ecosystems to respond to this change. We analysed how changes in climate and environmental factors will affect vegetation cover in Norway spruce forests and whether it is possible to assemble a list of diagnostically important/sensitive species that would be the first to react to changes in habitats of Norway spruce in Central Balkan. Significant changes in the vegetation cover of Norway spruce forests are mainly influenced by temperature increases (≈4 °C), and precipitation decreases (≈102 mm) by the end of the 21st century. Projections show that vegetation cover changes and future habitat conditions for Norway spruce forests on podzolic brown soils with a low base saturation and soil pH decreases, and temperature growth and precipitation decline, with the worst in the Rodope montane forest ecoregion. In Dinaric Mountain and Balkan mixed forest ecoregions, the range of natural occurrence of Norway spruce forest will shift to higher altitudes, or to the north. One of the cognitions of this paper is that, through available environmental models and their indices, species from the IUCN Red List should be recognised more properly and included in model calculations.

Graphical Abstract

1. Introduction

Mountainous habitats in Europe contain ∼20% of the native flora [1]. They are authentic hotspots of plant diversity, hosting highly specialised vascular plants [2,3] and many endemics [4]. These ecosystems are sensitive to pollution and climate change, as major external environmental factors influencing the forest ecosystems in central Europe, due to sharp transitions in vegetation sequences (ecotones), with often endemic species and a limited species pool [5,6].
Forests are particularly sensitive to climate change because the long lifespan of trees does not allow for rapid adaptation to environmental changes [7]. Common broadleaved species appeared to be less sensitive to climate change, while some of the most important conifer species had already lost a large portion of their climatically suitable habitat [8]. In addition, the Norway spruce (Picea abies L.) migrated from several refugia following the last ice age [9].
The total natural distribution of P. abies covers 31 degrees of latitude from 41°27′ N (the Balkan Peninsula) to 72°15′ N (near the Chatanga River, Siberia). The longitudinal range is from 5°27′ E (the French Alps) to 154° E (the Sea of Okhotsk in Eastern Siberia). The vertical distribution is from 0 m to the altitudes above 2300 m (Italian Alps) [10]. As one of the most widespread types of forest in the higher mountains of Europe, Norway spruce forests prefer cool and moist climatic conditions. In the context of future climate change, this ecologically and economically valuable species may become severely affected under global warming conditions [11]. According to previous studies, the direct effect of air pollution was likely the main and primary stressor causing the weakening of the spruce trees and increased sensitivity to other stressors causing massive Norway spruce forest declines in the past few decades [12,13].
Several factors that are associated with climate change, which can act either independently or in combination, affect a forest ecosystem’s structure and dynamics [7]. They can alter species composition and richness through many pathways: temperature, precipitation, nutrient availability, carbon sequestration, soil chemistry, etc., and consequently lead to homogenisation. By changing gradually, air pollution has a cumulative effect on the biodiversity of natural ecosystems [14]. The atmospheric deposition of reactive nitrogen (N) is considered a global threat to biodiversity [15,16,17,18] and plant N availability over stand development [19].
In the Central Balkans, Norway spruce forests belong to the G3.1E EUNIS type (southern European P. abies forests). They occur in the southernmost part of the species’ range, with clumped distribution determined by the cooler climate of the highest mountains in Serbia (Figure 1). In this part of the European range, spruce mainly grows on shallow mountain soils [20] and on steep slopes, additionally stressed by summer droughts and forest fires, storms, and bark beetles [21].
The evaluation and quantification of the cumulative effects of air pollutants and climate change stressors are very complex and demand dynamic model assessment and different/specific biodiversity metrics systems to be applied [18,22]. According to the results of the MOTIVE project, increasing temperatures and a change in the precipitation regime may lead to a decrease in the area of mesic, cold- and humidity-adapted species such as Norway spruce, which are assumed to move northwards and lose large portions of their growing space. The simulation results for the Norway spruce (for the period of 2051–2080) specifically show that only habitats at higher elevations and latitudes are projected to remain suitable [23].
In this paper, the VSD+PROPS model and Habitat Suitability Index (HSI) were used to predict the influence of future climate changes (A1B scenario) and N deposition on the quality of habitat that might affect species composition. These indicators have been successfully used for policy support of the Convention on Biological Diversity (CBD) and Convention on Long-Range Transboundary Air Pollution (CLRTAP) in Europe and North America, as a link between air pollution and biodiversity. However, there is a lack of clear recommendations given by the CBD and CLRTAP legislation on a representative set of species as an indicator of climate and environmental change for certain habitat types.
One of the cognitions of this paper is that, through modelling processes, UNESCO Red List species are not properly recognised in the calculation of the banded HSI. A separate indicator for biodiversity change assessment should be assigned for Red List species with an additional weighting method.
The aim of this study was to disentangle the following aspects:
  • How climate change, according to the projections, would affect vegetation structure in the Norway spruce forests of the Central Balkans;
  • How changes in environmental factors and habitat suitability would affect vegetation structure in the named forest habitats;
  • Defining a list of plant species as the most suitable for dynamic modelling of HSI metrics and early diagnosis of Norway spruce plant community reaction to multiple stressors.
Projecting the future vegetation structure of Norway spruce forests is of great importance for forest management. Adaptive management plans should acknowledge higher vertical and horizontal structural diversity since it improves resilience and resistance [24]. Another management strategy to be considered is the identification and protection of habitat refugia into which future populations of threatened species could migrate, or use as corridors for dispersal [25].

2. Materials and Methods

2.1. Study Area

This study was conducted in Norway spruce forests at four mountains that belong to three ecoregions in the Central Balkans: Rodope montane forests (Stara Mountain), Dinaric montane forests (Mountain Zlatar), and Balkan mixed forests (Mountain Golija and Kopaonik) (Figure 1). According to The Digital Map of European Ecological Regions- DMEER [26], ecoregions are ecologically distinct areas, with relatively homogeneous ecological conditions on the basis of updated knowledge of climatic, topographic, and geobotanical data within which comparisons and assessments of different expressions of biodiversity are meaningful [27]. Basic information on the studied sites is presented in Table 1.

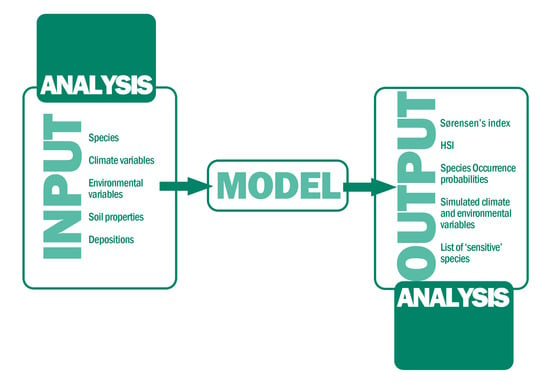
2.2. Vegetation Sampling, Data Processing, and Model Description

Vegetation in Norway spruce forests was analysed using the Braun–Blanquet phytocoenological method [28]. A total of 67 relevés were taken from all four sites (400 m2 plot size), and 309 species were recorded (Stara Mt.—35 species/10 relevés; Zlatar- 120/22; Golija- 76/27 and Kopaonik- 78/8). The species nomenclature follows the Flora Europaea (Euro+Med) plant base and the plant list.
In order to identify the most useful set of species as an indicator of climate and environmental changes, a list of three groups of species was assembled. Up to 40 of the most frequent species from the relevés per site were extracted as dominant species (dom). Typical species (typ) for the Norway spruce habitat were extracted according to the available literature [29,30,31]. Finally, the EuroVeg Checklist expert system Juice 7.0 [32] was used for extracting the list of diagnostic species (dia) for Vaccinio–Piceetea forests (Table S1, Supplementary Materials). The term diagnostic species refers to species which preferably occur in a single vegetation unit (character species) or in a few vegetation units (differential species), and are particularly useful for the identification of vegetation units [33]
VSD+Studio model, Version 5.5.1, Alterra CEE [34], coupled with the PROPS model (Probability of Occurrence of Plant Species Version 5.5.1. Alterra, CCE) [35], was used for the simulation of ground vegetation cover change due to the changes in climate and soil chemistry dynamics [36]. In conjunction with the VSD+Studio model, two pre-processor models were used. First, MetHyd v1.5.1, CCE [37] was used for calculating evapotranspiration, soil moisture and percolation, and parameters related to nitrification, denitrification, and mineralisation, and secondly, the GrowUp model v1.3.2 Alterra, CCE [37] was used for computing N and base cation uptake from the specified tree-growth and specific forest management. The net nutrient uptake (equal to the removal of harvested biomass) was calculated using the average growth rates measured in the Norway spruce stands with natural rejuvenation forest management in protected areas.
As an output of VSD+PROPS coupled models, the occurrence probability (OP) of the species has been defined as a function of soil chemistry and climatic variables [34,38]. Sørensen’s similarity index (β) [39] was used for the analysis of floristic differences between the OP of the set of species (dom, typ, and dia) from the time of phytocoenological surveying, and modelled OP (for the same sets) in 10-year time slices (1980–2100). Sørensen’s similarity index (β) was used to address the following question: How will vegetation structure change over time, or specifically, what species group will be the first to tell if the overall structure is about to change?
As another output of the same coupled models, the Habitat Suitability Index (HSI) has been defined as the arithmetic mean of the ‘normalised’ probabilities of occurrence of the species of ‘interest’ [40]. In order to discover the connection between different sets of species and environmental changes in Norway spruce communities, three HSIs were calculated: HSIdom, HSItyp, and HSIdia, which were the outputs when we used dom, typ, and dia set of species, respectively. A correlation was performed for the time-series data obtained from the model for the 2020–2100 period in order to determine the significance level of the main abiotic drivers (air temperature, precipitation amount, soil N content, soil pH) and their impact on habitat suitability change. All three HSI indices were included in this analysis (HSIdom, HSItyp, and HSIdia), with OP of Norway spruce, annual temperature, precipitation, N deposition reduction, and soil pH.

2.3. Climatic Data and Modelling

Coupled regional climate model EBU-POM [41,42] was used for the dynamical downscaling of global climate change projections, following moderate IPCC emission scenario A1B [43], in order to obtain a time-series dataset on future climate conditions. The whole model simulation covers the period from 1951 to 2100. The climate variables used in this modelling process were mean monthly temperature, precipitation, insolation, and soil water content. For the surface air temperature and precipitation, model bias was removed using an observed time series of the same variables (on a daily level), taken from the Republic Hydrometeorological Service of Serbia (RHMSS) database, over a normal climate period of 1961–1990, following a statistical bias correction method [44]. For the insolation and soil water content, the same approach was applied using the data from ERA-Interim reanalysis [45] from the European Centre for Medium-Range Weather Forecasts.
Climatic changes were analysed by comparing variables of the 1961–1990 normal period (Republic Hydrometeorological Service of Serbia), with their projected values in the 2071–2100 period (EBU-POM). The time-series data of variables for the 1980–2100 period were used as an addition to the MetHyd model, for the VSD+Studio model run.

2.4. Soil, Deposition Data, and Modelling

Soil data were obtained from the archive of the Faculty of Forestry, University of Belgrade (Serbia). The main physical and chemical soil properties are presented in Table S2, Supplementary Materials. Nitrogen (N) and sulphur (S) deposition data (1980–2013) were obtained from the database of The European Monitoring and Evaluation Programme (EMEP) model results [46], using data from the grid cell corresponding to the location of the relevés (Figure S1, Supplementary Materials). Coupled biogeochemical model VSD + Studio was used for the simulation of future climate, as well as N and S deposition effects on soil chemistry dynamics [34]. It was presumed that the deposition of N and S would stay on the current trend (the average value for the last 10 years); therefore, a corresponding deposition scenario was used, which is in accordance with the A1B climate scenario. Thus, N and S deposition will show a similar decreasing trend, in all studied areas in the 1980-2100 time period.
Canonical Correspondence Analysis (CCA) ordination technique was performed with Past 4.06b software [47], to jointly display the obtained results from the EBU-POM and VSD+ Studio models, for the period 2020–2100, with decade values as sites and OPs as species scores. The analysed environmental variables were temperature (Temp C), precipitation (Precip), soil moisture content (Theta), soil pH value, C:N ratio (CN rat), and plant-available nitrogen.

3. Results

3.1. Pre-Modelling Analyses

All analysed forest communities belong to Piceion excelsae, Pawłowski et al., 1928 alliance, according to the EuroVeg Checklist [48]. In, or in the range of, these forests, there are 15 endemic and Tertiary relict species, and 1 endemic genus (e.g., Bruckenthalia spiculifolia, Pancicia serbica, Aremonia agrimonioides, Asarum europaeum, etc.). The temperature and precipitation for a normal 30-year period (1961–1990) and EBU-POM model projections for the A1B scenario, 2001–2100 and 2071–2100, are presented in Tables S3 and S4 (Supplementary Materials). Very dry and warm summers (covering the whole vegetation period), according to the model simulations, in all studied areas are projected. The temperature will shift by nearly 4 °C until the year 2100 (Table S3, Supplementary Materials), and annual precipitation will decrease in the range of 85.78 mm (Rodope montane forests) to 113.39 mm (Balkan mixed forests—Golija) (Table S4, Supplementary Materials).

3.2. Results of the Norway Spruce Forest Modelling

The analysis of Sørensen’s similarity index (β) showed that, for the dom species, β will be decreasing constantly until 2090, when it should slightly begin to rise (Figure 2a). Considering all studied sites, the β median is 0.54 (min. 0.48 in 2090, max. 0.54 in 2100), meaning that on average 46% of dominant species will change over time. The structure of dominant vegetation will change the slightest in Rodope montane forests (β = 0.93 in 2030), and the strongest in Balkan mixed forests (β = 0.24 in 2040, Golija site).
Changes in typ species are less pronounced. The median β for all sites is 0.62 (min. 0.58 in 2040, max. 0.82 in 1990), and it is pretty much constant throughout the simulation period (specifically from 2010 to 2100). The only ecoregion that stands out is Rodope montane forests, with very high β = 0.95 until 2030, when it will start to decrease to 0.82 in 2100 (Figure 2b).
The changes in vegetation structure are probably the most noticeable when we consider dia species, although the overall median β is the same as with dom species—0.54 (min. 0.53 in 2060, 2070, and max. 0.75 in 1990). Considering all analysed sites, almost half of the diagnostic species were already ‘changed’ in the 1980–2010 period (Figure 2c), and according to the simulation, β will remain almost constant until the end of the century, when it will rise to 0.65. Only Rodope montane forests will not follow such a trend; it appears that β will start to decrease near the end of the 21st century (min. 0.86 in 2090, 2100).

3.3. Habitat Suitability Analysis

HSI was used as a measure of the influence of future climate changes (A1B scenario) and N input on the quality of habitat that might affect the dom, typ, and dia species occurrence. The HSIdom value increases for the Dinaric and Rodope montane forests and partly in Balkan mixed forests after 2008. Until the end of the simulation period (2100), it remains balanced with only small oscillations (Figure 3a). The HSItyp increases in Balkan mixed forests after 2008, up until 2083. After 2083, it decreases again to the end of the simulation period (2100). For the Rodope mountain forests, the model shows the earliest (from 2029) and largest decrease (from 0.54 to 0.34) of HSItyp. The value of the HSIdia is lower in comparison to the HSIdom and HSItyp for all ecoregions, with the exception of the Kopaonik site (Figure 3a–c). It should also be noted that, after the 2080s, the Balkan mixed forest ecoregion (for all three groups of species: dom, typ, and dia) will experience a decline in habitat suitability.
After the correlation analysis, we compared obtained indices across each other (Table 2).
The highest positive correlation was found between HSIdom and HSItyp in the Balkan mixed forest (Golija site) ecoregion, and the highest negative correlation (−0.85) was found between the occurrence probability of Norway spruce (Zlatar site) and mean monthly temperature.
There was a strong correlation found between the HSIdom and habitat suitability of two other groups of species (typ and dia), indicating that all three groups prefer similar habitat conditions, and their species overlap. Additionally, OP of Norway spruce was strongly correlated with all three HSIs, indicating their mutual dependence. Regarding the environmental variables, HSIdom had a strong positive correlation with annual precipitation and soil pH and a strong negative correlation with annual temperature and N deposition reduction (Table 2). The other two HSIs were similar. The only environmental parameter strongly correlated with all three HSIs is the annual precipitation amount. This result confirms the strong dependence of Norway spruce forests on both aboveground and underground water availability.
Observing the relationship between OP of Norway spruce and environmental variables, the only strong correlation was found for precipitation (Table 2). That led us to the conclusion that Norway spruce, in particular, is the species that reacts the most to a lack of precipitation; thus, the entire habitat becomes less suitable for the entire Norway spruce forest.

3.4. Canonical Correspondence Analysis

The results of CCA gave us a perspective of the species–environment changes over time (Figure 4a–d).
Temperature and C:N ratio are expected to increase, while precipitation, soil moisture content, plant-available N, and soil pH are expected to decrease at all studied sites. An exception is the Dinaric montane forests, where pH values are deviating but remain around 4.7. The C:N ratio will drastically increase by a median of 9.97 (median for 1980 = 11.41, median for 2100 = 22.67) in all analysed ecoregions. Values of plant-available N, as previously stated, will follow the adopted scenario, the CCA confirms. The decrease in soil water content will be very moderate for the analysed ecoregions. It will be less than 2.18% in Dinaric montane forests, to 4% in Rodope montane forests, according to the simulation. Soil pH, although very low (median for 1980 = 4.06, min 3.90, max 4.46), will decrease even more (median for 2100 = 3.92, min 3.71, max 4.11) at all three studied ecoregions. Only a few acidophilus species will prefer these kinds of soil conditions, e.g., Vaccinium myrtillus (V_myr), V. vitis-idaea (V_v-i), Juniperus communis subsp. Nana (J_c_al), while species such as Luzula sylvatica (L_syl), Hieracium murorum (H_mur), and Valeriana tripteris (V_tri) are not tolerable towards low pH and are expected to be near extinction. In Dinaric Mountain forests (Figure 4b), species are concentrated along the axis that represents the pH gradient, indicating that the species distribution is strongly related to soil pH changes. The soil pH appears to have a strong role in the habitat of the Balkans mixed forests as well, where the majority of species are also distributed along this gradient axis (Figure 4d).

4. Discussion

4.1. Norway Spruce Forests’ Response to Climate Changes

According to the simulations undertaken by Mihailović et al. [49] for the A1B scenario, a warmer and drier climate in the region in the study area can be expected in the future. As the overall climate warms, it can be expected that the current Dfwbx’’Köppen zone will shift to higher altitudes in the mountain ranges. As certain types of vegetation are associated with specific climate types (which are shifting, thus warming the surface at higher altitudes), certain native species may no longer grow well in a given altitudes’ climate [49]. In the future, under the A1B scenario, the climate zones of the Central Balkans will shift in altitude relative to the period of 1961–1990 for 100 m (for period 2001–2030) and 400 m (for period 2071–2100). The results of our study completely correspond to those described in the study above, with the Norway spruce forest range expected to shift as well.
High-mountain ecosystems are increasingly threatened by climate change, resulting in loss of biodiversity, habitat degradation, and landscape modifications [50,51]. Although Norway spruce forests are relatively stable ecosystems (in the coenological optimum) and not unduly susceptible to degradation, any long-term negative impact may lead to a reduction in the canopy density, poor rejuvenation, and, ultimately, acidification and further soil physical degradation [31]. As a result, Vaccinium myrtillus and Juniperus sybirica spp. nana will potentially spread throughout these degraded habitats, until the last degradation stadium, Nardetum strictae s.l., is reached.
Boreal forests have a large impact on local temperatures and, of the three main forest types, the largest influence on global mean temperature. Our study shows that the temperature in analysed locations will increase by 3.87–4.00 °C, which is in conjunction with the fourth and fifth IPCC Assessment Reports [52,53]. The precipitation will also decrease, in the range of 12.31% to 14.63%, by 2100. It is expected that a climate warming of 1–2 °C can cause small changes in alpine vegetation, but even greater warming of the climate can cause more pronounced changes [54]. This increment will be met by increased mineralisation, nutrient availability, and uptake by roots, without which the growth response to elevated temperature and CO2 will stagnate at a lower level [55,56,57,58,59].
Precipitation usually has a strong impact on the dynamics of soil moisture. Its loss by an interception in spruce stands is related to the nature of the rain and forest age. Many studies confirmed that the interception is increasing with the stand age [60,61]. Canopy gap differences were recorded in the dripping zone at the crown periphery and in the central zone of a crown of the stand [61]. Some studies of spruce forests show that the soil water content in the surface layer is higher in older stands, whereas in deeper soil it is higher in the thickets and young spruce stands [60]. Norway spruce needs high relative humidity and high surface moisture [62]. Additionally, even in its seedling stage, Norway spruce is very sensitive to soil moisture change, according to our results (Figure 4). The results from our study are in compliance with the results by Mihailović et al. [63]. The authors argue that for Dystric Cambysol soil type, the decrease in soil moisture will be between 6% and 8% (relative to the period 2021–2050, or 2051–2100).

4.2. Norway Spruce Forests’ Response to Environmental Changes

The results show that sites in the same ecoregion have the highest correlation (Balkan mixed forests), and sites with the lowest similarity belong to those ecoregions (Rodope and Dynaric mountains) with the largest differences in temperature and precipitation values (Tables S2 and S3 in Supplementary Materials). The model output results also show similar trends for the future. The Rodope mountain ecoregion is highlighted as the least suitable for spruce forests (according to the A1B scenario) and the Dynaric mountain ecoregion, as the most suitable. This was additionally proven through the correlation of the HSIs and the main climatic parameters (Table 2). Thus, the delineation of the different habitats’ conditions, according to DMEER, for the comparison and assessment of different expressions of biodiversity are shown to be meaningful for the present and future analyses of plant communities.
A narrow range of tolerance is described as an indicator of a species’ sensitivity to environmental changes. If it is also an endemic or relict species, its response to climate change should be analysed very carefully. Species distribution shifts will also depend on habitat availability. Many already-threatened local endemic species will be affected first [64]. Some of them are range-restricted species and are in the list of characteristic combinations of species or play a pronounced role at the ground level. Some of them have a few generations in the vegetation period and cover the ground level with dense populations. They would be replaced by other species with less demand on the environmental conditions, which would, in turn, signal the first step in the process of the degradation of Norway spruce forests.

4.3. The Effects of Changes in Soil Properties

Norway spruce is typically found growing in acidic soil and is believed to be adapted to low soil pH [65], and it produces slowly decomposing, acidic coniferous litter [66]. According to the projection, by 2100, all studied sites will experience a further soil pH decrease. As previously stated, only a few acidophilus species can overcome such a low soil pH, and they can be considered diagnostic for spruce forests [33]. For all but the Dinaric ecoregion, pH will descend below 4, making those habitats more susceptible to further soil physical degradation.
The C:N ratio of forest soils is one of the best predictors for evaluating the soil functions mainly involved in climate change issues [67]. The C:N ratio is more or less within the range for spruce forests in the studied ecoregions and soil types [68]. In spruce forest soil, the C:N is affected mostly by humus type, soil type, ecoregion, and parent material. In our study, according to the A1B scenario and corresponding temperature increase, the C:N ratio will increase by a median of 9.097, and it is expected that it will affect the occurrence of some plant species with a narrow range of tolerance to a C:N ratio change. Furthermore, the species will react to N deposition as well.

4.4. The Effects of Deposition Changes

Thus far, the deposition of N and S has decreased considerably as a result of political initiatives in Europe—Convention on Long-range Transboundary Air Pollution (CLRTAP)—with S reduction from 1980 ranging up to as high as 90%. There has been a small decline in N deposition in some regions in recent years but with occasional rises after 2006. The deposition of N remains high in many areas and critical loads are still exceeded in many parts of Europe. Many studies have observed high N inputs as a factor in soil biogeochemistry changes, community composition change, and, finally, loss of species diversity [69,70,71,72,73,74,75,76]. For all sites we have examined in this study, the total N deposition is within or near the lower limit of the recommended range (10–15 kg ha−1 yr−1) for spruce forests [77]. At the beginning of the research period, in 1980, N deposition was near the lower limit of the recommended range, and for the period 2020–2100, it is constant and below the lower empirical range for a spruce habitat. N deposition below 10 kgha−1yr−1 could still have a negative impact on most plant species and their occurrence within the spruce habitats (Figure S1, Supplementary Materials).

5. Conclusions

In conclusion, we can emphasise that according to the projections, the vegetation structure of Norway spruce forests will change. The outlook for Norway spruce forests is the worst on podzolic brown soils, with a low content of base saturation, temperature growth, precipitation decline, and soil pH decrease in the Rodope mountain forest ecoregion. Changes in environmental factors will result in large changes in vegetation cover and may further lead to physical soil degradation. No tree species would be able to adapt to these conditions, except maybe the woody species from the Juniperus and Vaccinium genus. In Dinaric Mountain and Balkan mixed forest ecoregions, the Norway spruce forest limit will change, and their range of natural occurrence will shift to higher altitudes, or to the north. The composition of species and the relationship between dominant and diagnostic species and the environment can be used as predictors for the determination of habitats suitable for Norway spruce.
Species of importance for biodiversity maintenance and conservation (e.g., endemic and relict plant species or species from the IUCN Red List), should be considered in habitat suitability modelling. Uncertainties in the habitat suitability modelling for these species are reflected in the following: not all species are represented in the used plant database, and these species are not usually particularly abundant, or they are not typical for the specific habitat. Consequently, they are not properly recognised in the calculation of the banded HSI. A separate indicator for biodiversity change assessment should be assigned for Red List species with an additional weighting method. Further research and monitoring of Norway Spruce habitats are needed in order to understand these relationships and to prove or disprove the simulation results.
However, there are more synecological and autecological processes in the very communities that might be initiated by changes in ecosystem composition, phenology, reproduction rate, tree growth, habitat disturbance, range, genetic diversity, adaptations, competition, and many others. Clumped distribution of Norway spruce forests in the Central Balkans signals the additional sensitivity of these habitats and those spatial changes in these fragmented parts would be useful to monitor in the context of climate change.
Forest ecosystem modelling studies should be based on reliable and long-term time-series data. All results should be validated with on-site observations in order to improve the level of model certainty, as support for adaptive forest management/conservation and decision making under climate change.

Supplementary Materials

The following supporting information can be downloaded at: https://www.mdpi.com/article/10.3390/f13050666/s1, Figure S1: (a) Nitrogen (N) and (b) sulphur (S) deposition on examined sites for the period 1980–2019 (source EMEP), Table S1: List of dominant (dom), typical (typ) and diagnostic (dia) species for Norway spruce forests, Table S2: Main soil properties of studied sites, Table S3: Temperatures in reference 30-year period (1961–1990) and model predictions for A1B scenario, 2001–2100 and 2071–2100, Table S4: Precipitation in reference 30-year period (1961–1990) and model predictions for A1B scenario, 2001–2100 and 2071–2100.

Author Contributions

Conceptualisation, D.O.-P., J.B. and D.Č.; methodology, J.B. and D.Č.; software, J.B., D.Č. and V.D.; formal analysis J.B. and D.Č.; investigation, D.O.-P., S.B.S. and I.B.; resources, J.B., D.Č. and V.D.; data curation, D.O.-P., J.B., V.D., D.Č., I.B. and S.B.S.; writing—original draft preparation, D.O.-P., J.B. and D.Č.; writing—review and editing, D.O.-P., J.B. and D.Č.; visualisation, J.B. and D.Č.; supervision, D.O.-P. and S.B.S. All authors have read and agreed to the published version of the manuscript.

Funding

This research received no external funding. The APC was funded by Faculty of Forestry, University of Belgrade.

Data Availability Statement

The data presented in this study are available from the authors upon request.

Acknowledgments

This research was carried out as part of the Agreement on financing the scientific research work of Scientific Research Organisations in the year 2022, No. 451-03-68/2022-14/200169.

Conflicts of Interest

The authors declare no conflict of interest.

References

  1. Väre, H.; Lampinen, R.; Humphries, C.; Williams, P. Taxonomic Diversity of Vascular Plants in the European Alpine Areas. In Alpine Biodiversity in Europe; Nagy, L., Grabherr, G., Körner, C., Thompson, D.B.A., Eds.; Ecological Studies; Springer: Berlin/Heidelberg, Germany, 2003; Volume 167. [Google Scholar] [CrossRef]
  2. Barthlott, W.; Lauer, W.; Placke, A. Global Distribution of Species Diversity in Vascular Plants: Towards a World Map of Phytodiversity (Globale Verteilung der Artenvielfalt Höherer Pflanzen: Vorarbeiten zu einer Weltkarte der Phytodiversität). Erdkunde 1996, 50, 317–327. Available online: http://www.jstor.org/stable/25646853 (accessed on 15 April 2022). [CrossRef]
  3. Myers, N.; Mittermeier, R.A.; Mittermeier, C.G.; da Fonseca, G.A.B.; Kent, J. Biodiversity hotspots for conservation priorities. Nature 2000, 403, 853–858. [Google Scholar] [CrossRef] [PubMed]
  4. Harald, P.; Gottfried, M.; Reiter, K.; Klettner, C.; Grabherr, G. Signals of range expansions and contractions of vascular plants in the high Alps: Observations (1994–2004) at the GLORIA* master site Schrankogel, Tyrol, Austria. Glob. Change Biol. 2007, 13, 147–156. [Google Scholar] [CrossRef]
  5. Beniston, M. Climatic Change in Mountain Regions: A Review of Possible Impacts. Clim. Change 2003, 59, 5–31. [Google Scholar] [CrossRef]
  6. Ulrich, B.; Mayer, R.; Khanna, P.K. Chemical changes due to acidic precipitation in a loess-derived soils in Central Europe. Soil Sci. 1980, 130, 193–199. [Google Scholar] [CrossRef]
  7. Lindner, M.; Maroschek, M.; Netherer, S.; Kremer, A.; Barbati, A.; Garcia-Gonzalo, J.; Seidl, R.; Delzon, S.; Corona, P.; Kolström, M.; et al. Climate change impacts; adaptive capacity; and vulnerability of European forest ecosystems. For. Ecol. Manag. 2010, 259, 698–709. [Google Scholar] [CrossRef]
  8. Hansen, A.J.; Neilson, R.P.; Dale, V.H.; Flather, C.H.; Iverson, L.R.; Currie, D.J.; Shafer, S.; Cook, R.; Bartlein, P.J. Global change in forest: Response of species; communities and biomes: Interactions between climate change and land use are projected to cause large shifts in biodiversity. Biosci. J. 2001, 51, 765–779. [Google Scholar] [CrossRef]
  9. Modrzyński, J. Outline of Ecology. In Biology and Ecology of Norway Spruce; Tjoelker, M., Boratisńki, A., Bugala, A., Eds.; Forestry Science; Springer: Berlin/Heidelberg, Germany, 2007; pp. 195–273. [Google Scholar]
  10. Skrøppa, T. EUFORGEN Technical Guidelines for Genetic Conservation and Use for Norway Spruce (Picea abies). Bioversity International. 2003. Available online: http://www.euforgen.org/fileadmin/templates/euforgen.org/upload/Publications/Technical_guidelines/Technical_guidelines_Picea_abies.pdf (accessed on 15 April 2022).
  11. CH2014-Impacts. Toward Quantitative Scenarios of Climate Change Impacts in Switzerland; OCCR, FOEN, MeteoSwiss, C2SM, Agroscope, and ProClim, Bern, Switzerland. 2014. Available online: http://www.ch2014-impacts.ch/res/files/CH2014-Impacts_report.pdf (accessed on 22 April 2022).
  12. Schulze, E.D. Air Pollution and Forest Decline in a Spruce (Picea abies) Forest. Science 1989, 19, 776–783. [Google Scholar] [CrossRef] [PubMed]
  13. Hlásny, T.; Sitková, Z. (Eds.) Spruce Forests Decline in the Beskids; National Forest Centre–Forest Research Institute Zvolen & Czech University of Life Sciences Prague & Forestry and Game Management Research Institute Jiloviště—Strnady: Zvolen, Slovakia, 2010; 182p, ISBN 978-80-8093-127-8. [Google Scholar]
  14. Sala, O.E.; Chapin, F.S.; Armesto, J.J.; Berlow, E.; Bloomfield, J.; Dirzo, R.; Huber-Sanwald, E.; Huenneke, L.F.; Jackson, R.B.; Kinzig, A.; et al. Global biodiversity scenarios for the year 2100. Science 2000, 287, 1770–1774. [Google Scholar] [CrossRef] [PubMed]
  15. Hettelingh, J.-P.; de Vries, W.; Posch, M.; Reinds, G.J.; Slootweg, J.; Hicks, W.K. Development of the critical loads concept and current and potential applications to different regions of the world. In Nitrogen Deposition; Critical Loads and Biodiversity; Hicks, W.K., Haeuber, R., Sutton, M.A., Eds.; Springer: Dordrecht, The Netherlands, 2014; pp. 281–293. [Google Scholar]
  16. Phoenix, G.K.; Hicks, W.K.; Cinderby, S.; Kuylenstierna, J.C.I.; Stock, W.D.; Dentener, F.J.; Giller, K.E.; Austin, A.T.; Lefroy, R.D.B.; Gimeno, B.S.; et al. Atmospheric nitrogen deposition in world biodiversity hotspots: The need for a greater global perspective in assessing N deposition impacts. Glob. Chang. Biol. 2006, 12, 470–476. [Google Scholar] [CrossRef]
  17. Sutton, M.A.; Skiba, U.M.; van Grinsven, H.J.; Oenema, O.; Watson, C.J.; Williams, J.; Hellums, D.T.; Maas, R.; Gyldenkaerne, S.; Pathak, H.; et al. Green economy thinking and the control of nitrous oxide emissions. Environ. Dev. 2014, 9, 76–85. [Google Scholar] [CrossRef] [Green Version]
  18. Rowe, E.C.; Wamelink, G.W.W.; Smart, S.M.; Butler, A.; Henrys, P.; van Dobben, H.F.; Reinds, G.J.; Evans, C.D.; Kros, J.; de Vries, W. Field survey-based models for exploring nitrogen and acidity effects on plant species diversity and assessing long-term critical loads. In Critical Loads and Dynamic Risk Assessments; de Vries, W., Hettelingh, J.P., Posch, M., Eds.; Springer: Dordrecht, The Netherlands, 2015; pp. 297–326. [Google Scholar] [CrossRef]
  19. Le Duc, S.D.; Rothstein, D.E. Plant-available organic and mineral nitrogen shift in dominance with forest stand age. Ecology 2010, 91, 708–720. [Google Scholar] [CrossRef]
  20. Jovanović, B. Picea abies. In Flora of SR Serbia I.; Sarić, M., Ed.; Serbian Academy of Sciences and Arts: Belgrade, Serbia, 1992; pp. 183–185. (In Serbian) [Google Scholar]
  21. Caudullo, G.; Tinner, W.; de Rigo, D. Picea abies in Europe: Distribution, habitat, usage and threats. In European Atlas of Forest Tree Species; San-Miguel-Ayanz, J., de Rigo, D., Caudullo, G., Houston Durrant, T., Mauri, A., Eds.; Publications Office of the EU: Luxembourg, 2016; pp. 114–116. [Google Scholar]
  22. Probst, A.; Obeidy, C.; Gaudio, N.; Belyazid, S.; Gégout, J.-C.; Alard, D.; Corket, E.; Party, J.-P.; Gauquelin, T.; Mansat, A.; et al. Evaluation of Plant Responses to Atmospheric Nitrogen Deposition in France Using Integrated Soil-Vegetation Models. In Critical Loads and Dynamic Risk Assessments; de Vries, W., Hettelingh, J.P., Posch, M., Eds.; Springer: Dordrecht, The Netherlands, 2015; pp. 359–380. [Google Scholar] [CrossRef]
  23. Fitzgerald, J.; Lindner, M. Adapting to Climate Change in European Forests—Results of the MOTIVE Project; Pensoft Publishers: Sofia, Bulgaria, 2013; p. 108. [Google Scholar]
  24. Schmied, G.; Hilmers, T.; Uhl, E.; Pretzsch, H. The Past Matters: Previous Management Strategies Modulate Current Growth and Drought Responses of Norway Spruce (Picea abies H. Karst.). Forests 2022, 13, 243. [Google Scholar] [CrossRef]
  25. Wilkening, J.; Pearson-Prestera, W.; Mungi, N.A.; Bhattacharyya, S. Endangered species management and climate change: When habitat conservation becomes a moving target. Wildl. Soc. Bull. 2019, 43, 11–20. [Google Scholar] [CrossRef] [Green Version]
  26. European Environmental Agency. Digital Map of European Ecological Regions. 2009. Available online: https://www.eea.europa.eu/data-and-maps/figures/dmeer-digital-map-of-european-ecological-regions (accessed on 18 October 2020).
  27. Painho, M.; Farral, H.; Barata, F. Digital Map of European Ecological Regions (DMEER). Its concept and elaboration. In Proceedings of the Second Joint European Conference & Exhibition on Geographical Information (Vol. 1): From Research to Application through Cooperation; IOS Press: Barcelona, Spain, 1996; pp. 437–446. [Google Scholar]
  28. Braun-Blanquet, J. Pflanzensoziologie. Grundzüge der Vegetationskunde, 3rd ed.; Springerm: Wien, Austria, 1964. [Google Scholar]
  29. Tomić, Z. Šumske fitocenoze Srbije; Šumarski fakultet: Beograd, Srbija, 1992. [Google Scholar]
  30. Tomić, Z. Šumarska fitocenologija; Šumarski fakultet: Beograd, Srbija, 2004. [Google Scholar]
  31. European Commission. Dg Environment Interpretation Manual of European Union Habitats—EUR28 2013. Available online: http://ec.europa.eu/environment/nature/legislation/habitatsdirective/docs/Int_Manual_EU28.pdf (accessed on 21 March 2022).
  32. Tichý, L. JUICE; software for vegetation classification. J. Veg. Sci. 2002, 3, 451–453. [Google Scholar] [CrossRef]
  33. Chytrý, M.; Tichý, L.; Holt, J.; Botta-Dukát, Z. Determination of diagnostic species with statistical fidelity measures. J. Veg. Sci. 2002, 13, 79–90. [Google Scholar] [CrossRef]
  34. Reinds, G.J.; Mol-Dijkstra, J.; Bonten, L.; Wamelink, W.; de Vries, W.; Posch, M. VSD+PROPS: Recent developments. In Modelling and Mapping the Impacts of Atmospheric Deposition on Plant Species Diversity in Europe. CCE Status Report; Slootweg, J., Posch, M., Hettelingh, J.P., Mathijssen, L., Eds.; RIVM: Bilthoven, The Netherlands, 2014; pp. 47–53. Available online: http://hdl.handle.net/10029/557117 (accessed on 21 March 2022).
  35. Reinds, G.J.; Mol-Dijkstra, J.; Bonten, L.; Wamelink, W.; Hennekens, S.; Goedhart, P.; Posch, M. Probability of plant species (PROPS) model: Latest developments. In Modelling and Mapping the Impacts of Atmospheric Deposition of Nitrogen and Sulphur. CCE Status Report 2015; Slootweg, J., Posch, M., Hettelingh, J.-P., Eds.; National Institute for Public Health and the Environment; RIVM Report 2015-0193; National Institute for Public Health and the Environment: Bilthoven, The Netherlands, 2015; pp. 55–62. Available online: https://www.umweltbundesamt.de/en/cce-status-reports?parent=68093 (accessed on 21 March 2022).
  36. Dirnböck, T.; Djukic, I.; Kitzler, B.; Kobler, J.; Mol-Dijkstra, J.P.; Posch, M.; Reinds, G.J.; Schlutow, A.; Starlinger, F.; Wamelink, W.G.W. Climate and air pollution impacts on habitat suitability of Austrian forest ecosystems. PLoS ONE 2017, 12, 0184194. [Google Scholar] [CrossRef] [Green Version]
  37. Bonten, L.T.C.; Reinds, G.J.; Posch, M. A model to calculate effects of atmospheric deposition on soil acidification; eutrophication and carbon sequestration. Environ. Model Softw. 2016, 79, 75–84. [Google Scholar] [CrossRef]
  38. Rowe, E.C.; Ford, A.E.S.; Smart, S.M.; Henrys, P.A.; Ashmore, M.R. Using qualitative and quantitative methods to choose a habitat quality metric for air pollution policy evaluation. PLoS ONE 2016, 11, e0161085. [Google Scholar] [CrossRef] [Green Version]
  39. Češka, A. Estimation of the mean floristic similarity between and within sets of vegetational relevés. Folia Geobot. Phytotaxon. 1966, 1, 93–100. [Google Scholar] [CrossRef]
  40. Posch, M.; Hettelingh, J.P.; Slootweg, J.; Reinds, G.J. Deriving critical loads based on plant diversity targets. In Modelling and Mapping the Impacts of Atmospheric Deposition on Plant Species Diversity in Europe: CCE Status Report 2014; Slootweg, J., Posch, M., Hettelingh, J.P., Mathijssen, L., Eds.; Report 2014–0075; RIVM: Bilthoven, The Netherlands, 2014; pp. 41–46. [Google Scholar]
  41. Djurdjevic, V.; Rajkovic, B. Verification of a coupled atmosphere-ocean model using satellite observations over the Adriatic Sea. Ann. Geophys. 2008, 26, 1935–1954. [Google Scholar] [CrossRef] [Green Version]
  42. Kržič, A.; Tošić, I.; Djurdjević, V.; Veljović, K.; Rajković, B. Changes in some indices over Serbia according to the SRES A1B and A2 scenarios. Clim. Res. 2011, 49, 73–86. [Google Scholar] [CrossRef]
  43. Nakićenović, N.; Davidson, D.G.; Grübler, A.; Kram, T.; La Rovere, L.E.; Bert, M.; Tsuneyuki, M.; Peper, W.; Hugh, P.; Sankovski, A.; et al. Special Report on Emissions Scenarios. A Special Report of Working Group III of the Intergovernmental Panel on Climate Change; Cambridge University Press: Cambridge, UK; New York, NY, USA, 2000; Available online: http://ipcc.ch/pdf/special-reports/spm/sres-en.pdf (accessed on 21 March 2022).
  44. Ruml, M.; Vuković, A.; Vujadinović, M.; Djurdjević, V.; Ranković-Vasić, Z.; Atanacković, Z.; Sivčev, B.; Marković, N.; Matijašević, S.; Petrović, N. On the use of regional climate models: Implications of climate change for viticulture in Serbia. Agric. For. Meteorol. 2012, 158–159, 53–62. [Google Scholar] [CrossRef]
  45. Berrisford, P.; Dee, D.; Poli, P.; Brugge, R.; Fielding, K.; Fuentes, M.; Kållberg, P.; Kobayashi, S.; Uppala, S.; Simmons, A. The ERA-interim Archive Version 2.0. ERA Report Series 1. ECMWF. Shinfield Park. 2011. Available online: https://www.ecmwf.int/en/elibrary/8174-era-interim-archive-version-20 (accessed on 21 March 2022).
  46. The Norwegian Meteorological Institute, The European Monitoring and Evaluation Programme EMEP. Available online: https://www.emep.int/mscw/mscw_moddata.html (accessed on 21 March 2022).
  47. Hammer, Ø.; Harper, D.A.T.; Ryan, P.D. PAST: Paleontological statistics software package for education and data analysis. Palaeontol. Electron. 2001, 4, 9. Available online: https://www.nhm.uio.no/english/research/infrastructure/past/ (accessed on 18 November 2020).
  48. Mucina, L.; Bültmann, H.; Dierßen, K.; Theurillat, J.-P.; Raus, T.; Čarni, A.; Šumberová, K.; Willner, W.; Dengler, J.; García, R.G.; et al. Vegetation of Europe: Hierarchical floristic classification system of vascular plant; bryophyte; lichen; and algal communities. Appl. Veg. Sci. 2016, 19, 3–264. [Google Scholar] [CrossRef]
  49. Mihailović, D.T.; Lalić, B.; Drešković, N.; Mimić, G.; Djurdjević, V.; Jančić, M. Climate change effects on crop yields in Serbia and related shifts of Köppen climate zones under the SRES-A1B and SRES-A2. Int. J. Climatol. 2014, 35, 3320–3334. [Google Scholar] [CrossRef]
  50. Körner, C. Alpine Plant Life. Functional Plant Ecology of High Mountain Ecosystems; Springer: Heidelberg, Germany, 2003. [Google Scholar]
  51. Bech Bruun, T.; de Neergaard, A.; Lawrence, D.; Ziegler, A. Environmental consequences of the Demise in Swidden cultivation in Southeast Asia: Carbon storage and soil quality. Hum. Ecol. 2006, 37, 375–388. [Google Scholar] [CrossRef]
  52. IPCC. Climate Change Synthesis Report. Contribution of Working Groups I; II and III to the Fourth Assessment Report of the Intergovernmental Panel on Climate Change; Core Writing Team; Pachauri, R.K., Reisinger, A., Eds.; IPCC: Geneva, Switzerland, 2007; 104p, Available online: https://www.ipcc.ch/site/assets/uploads/2018/02/ar4_syr_full_report.pdf (accessed on 21 March 2022).
  53. IPCC. Climate Change Synthesis Report. Contribution of Working Groups I; II and III to the Fifth Assessment Report of the Intergovernmental Panel on Climate Change Core Writing Team; Pachauri, R.K., Meyer, L.A., Eds.; IPCC: Geneva, Switzerland, 2014; 151p, Available online: https://www.ipcc.ch/site/assets/uploads/2018/02/SYR_AR5_FINAL_full.pdf (accessed on 21 March 2022).
  54. Theurillat, J.P.; Guisan, A. Potential impact of climate change on vegetation in the European Alps: A review. Clim. Change 2001, 50, 77–109. [Google Scholar] [CrossRef]
  55. Bonan, G.B.; Van Cleve, K. Soil temperature; nitrogen mineralization; and carbon source-sink relationships in boreal forests. Can. J. For. Res. 1992, 22, 629–639. [Google Scholar] [CrossRef]
  56. Melillo, J.M.; McGuire, A.D.; Kicklighter, D.W.; Moore, B.; Vorosmarty, C.J.; Schloss, A.L. Global climate change and terrestrial net primary production. Nature 1993, 363, 234–240. [Google Scholar] [CrossRef]
  57. Houghton, J. Global Warming: The Complete Briefing, 5th ed.; Cambridge University Press: Cambridge, UK, 2015; pp. 409–412. [Google Scholar] [CrossRef]
  58. Medlyn, B.E.; Loustau, D.; Delzon, S. Temperature response of parameters of a biochemically based model of photosynthesis. I. Seasonal changes in mature maritime pine (Pinus pinaster Ait.). Plant Cell Environ. 2002, 25, 1155–1165. [Google Scholar] [CrossRef] [Green Version]
  59. McMurtrie, R.E.; Medlyn, B.E.; Dewar, R.E. Increased understanding of nutrient immobilization in soil organic matter is critical for predicting the carbon sink strength in forest ecosystem over the next 100 years. Tree Physiol. 2001, 21, 831–839. [Google Scholar] [CrossRef] [PubMed] [Green Version]
  60. Bartík, M.; Jančo, M.; Střelcová, K.; Škvareninová, J.; Škvarenina, J.; Mikloš, M.; Vido, J.; Waldhauserová, P.D. Rainfall interception in a disturbed montane spruce (Picea abies) stand in the West Tatra Mountains. Biologia 2016, 71, 1002–1008. [Google Scholar] [CrossRef]
  61. Šrámek, V.; Hellebrandová, K.N.; Fadrhonsová, V. Interception and soil water relation in Norway spruce stands of different age during the contrasting vegetation seasons of 2017 and 2018. J. For. Sci. 2019, 65, 51–60. [Google Scholar] [CrossRef] [Green Version]
  62. Gottfried, M.; Pauli, H.; Futschik, A.; Akhalkatsi, M.; Barančok, P.; Benito Alonso, J.L.; Coldea, G.; Dick, J.; Erschbamer, B.; Fernández Calzado, M.R.; et al. Continent-wide response of mountain vegetation to climate change. Nat. Clim. Change 2012, 2, 111–115. [Google Scholar] [CrossRef]
  63. Mihailović, D.; Drešković, N.; Arsenić, I.; Ćirić, V.; Djurdjević, V.; Mimić, G.; Pap, I.; Balaž, I. Impact of climate change on soil thermal and moisture regimes in Serbia: An analysis with data from regional climate simulations under SRES-A1B. Sci. Total Environ. 2016, 571, 398–409. [Google Scholar] [CrossRef]
  64. Kazakis, G.; Ghosn, D.; Vogiatzakis, I.N.; Papanastasis, V.P. Vascular plant diversity and climate change in the alpine zone of the Lefka Ori; Crete. Biodivers. Conserv. 2007, 16, 1603–1615. [Google Scholar] [CrossRef]
  65. Read, D.J. Mycorrhizas in ecosystems. Experientia 1991, 47, 376–391. [Google Scholar] [CrossRef]
  66. Ellenberg, H. Vegetation Ecology of Central Europe, 4th ed.; Cambridge University Press: Cambridge, UK, 2002. [Google Scholar]
  67. Carré, F.; Jeannée, N.; Casalegno, S.; Lemarchand, O.; Reuter, H.; Montanarella, L. Mapping the CN ratio of the forest litters in Europe-lessons for global digital soil mapping. In Digital Soil Mapping: Bridging Research; Environmental Application and Operation; Boettinger, J.L., Howell, D.W., Moore, A.C., Hartemink, A.E., Kienast-Brown, S., Eds.; Springer: Dordrecht, The Netherlands, 2010; pp. 217–226. [Google Scholar]
  68. Cools, N.; Vesterdal, L.; de Vos, B.; Vanguelova, E.; Hansen, K. Tree species is the major factor explaining C:N ratios in European forest soils. For. Ecol. Manag. 2014, 311, 3–16. [Google Scholar] [CrossRef]
  69. Abrahamsen, G.; Miller, H.G. Effects of Acidic Deposition on Forest Soil and Vegetation. Philos. Trans. R. Soc. Lond. 1984, 305, 369–382. [Google Scholar]
  70. Falkengren-Grerup, U. Soil Acidification and Vegetation Changes in deciduous Forest in Southern Sweden. Oecologia 1986, 70, 339–347. [Google Scholar] [CrossRef]
  71. Thimonier, A.; Dupouey, J.; Timbal, T. Floristic changes in the herb-layer vegetation of a deciduous forest in the Lorrain plain under the influence of atmospheric deposition. For. Ecol. Manag. 1992, 55, 149–167. [Google Scholar] [CrossRef]
  72. Lameire, S.; Hermy, M.; Honnay, O. Two decades of change in the ground vegetation of a mixed deciduous forest in an agricultural landscape. J. Veg. Sci. 2000, 11, 695–704. [Google Scholar] [CrossRef]
  73. De Vries, W.; Wamelink, G.W.W.; van Dobben, H.; Kros, J.; Reinds, G.J.; Mol-Dijkstra, J.P.; Smart, S.M.; Evans, C.D.; Rowe, E.C.; Belyazid, S.; et al. Use of dynamic soil-vegetation models to assess impacts of nitrogen deposition on plant species composition: An overview. Ecol. Appl. 2010, 20, 69–79. [Google Scholar] [CrossRef] [PubMed] [Green Version]
  74. Bobbink, R.; Hicks, K.; Galloway, J.; Spranger, T.; Alkemade, R.; Ashmore, M.; Bustamante, M.; Cinderby, S.; Davidson, E.; Dentener, F.; et al. Global assessment of nitrogen deposition effects on terrestrial plant diversity: A synthesis. Ecol. Appl. 2010, 20, 30–59. [Google Scholar] [CrossRef] [Green Version]
  75. Azevedo, L.B.; Van Zelm, R.; Hendriks, A.J.; Bobbink, R.; Huijbregts, M.A.J. Global assessment of the effects of terrestrial acidification on plant species richness. Environ. Pollut. 2013, 174, 10–15. [Google Scholar] [CrossRef] [Green Version]
  76. Rizzetto, S.; Belyazid, S.; Gégout, J.-C.; Nicolas, M.; Alard, D.; Corcket, E.; Gaudio, N.; Sverdrup, H.; Probst, A. Modelling the impact of climate change and atmospheric N deposition on French forests biodiversity. Environ. Pollut. 2016, 213, 1016–1027. [Google Scholar] [CrossRef] [PubMed] [Green Version]
  77. Spranger, T.; Lorenz, U.; Gregor, H.D. Manual on Methodologies and Criteria for Modelling and Mapping Critical Loads & Levels and Air Pollution Effects, Risks and Trends; The Umweltbundesamt: Berlin, Germany, 2004; p. 266. [Google Scholar]
Figure 1. Study area: (a) distribution map of Norway spruce in Europe, according to the European Forest Genetic Resources Programme (EUFORGEN); (b) ecoregions according to Digital Map of European Ecological Regions (DMEER), and natural potential areal of Norway spruce forests in Serbia; (c) terrain of studied sites. RS—Republic of Serbia.
Forests 13 00666 g001
Figure 2. Sörrensen similarity index (β) change for period 1980–2100, 1980 is set as starting year, where β = 1 (a) for dominant and most frequent species, (b) for typical species (according to the literature), and (c) for diagnostic species (according to the EuroVeg Checklist expert system).
Forests 13 00666 g002
Figure 3. Habitat Suitability Indices—simulation using VSD+PROPS model for examined sites: (a) for dominant and most frequent species; (b) for typical species (according to the literature); (c) for diagnostic species (according to the EuroVeg Checklist expert system).
Forests 13 00666 g003
Figure 4. CCA for all sites analysed for 1981–2100 period: (a) Stara mt.; (b) Zlatar; (c) Golija; (d) Kopaonik.
Forests 13 00666 g004
Table 1. Basic information on studied sites.
SiteStara Mt.ZlatarGolijaKopaonik
EcoregionsRodope montane forestsDinaric montane forestsBalkan mixed
forests
Balkan mixed
forests
Coordinates43°17′34.33′ N 22°47′09.76′ E43°24′20.04′ N 19°48′36.19′ E43°20′6.38′ N 20°17′12.21′ E43°17′30′ N
20°48′50′ E
Altitude (m)1450–17001220–14001300–17201520–1800
Precipitation (mm) *606826797770
Temperature (°C) *6.846.005.385.86
Soil parent
material
Permian red sandstoneChromic Humic Cambisol/ChertPhylliteGranodiorite/Granite
Soil type (WRB)Podzolic CambisolChromic Humic Cambisol/Dystric CambisolPodzolic Cambisol/Dystric CambisolPodzolic Cambisol Humic Cambisols
Protection statusNature ParkLandscape of
exceptional natural beauty
Nature ParkNational Park
EUNIS habitat typeG3.1E—Southern European P. abies forests
EU HD type9410 Acidophilous Picea forests of the montane to alpine levels
(Vaccinio-Piceetea)
EU HD subtype42.24 Southern European Norway spruce forests
* Annual average 1961–1990; WRB—World Reference Base for Soil Resources; EUNIS—the European Nature Information System; EU HD—European Union Habitat Directive.
Table 2. Correlation matrix for Habitat Suitability Indices, P. abies occurrence probability and environmental variables for period 2020–2100.
SitesVariablesHSIdomP. abiesTPNpH
Stara Mt.HSIdom/0.648−0.5790.492−0.6380.748
HSItyp0.5840.944−0.7360.617n.s.n.s.
HSIdia0.4740.745−0.5710.673n.s.n.s.
P. abies0.648/−0.8390.572n.s.0.46
ZlatarHSIdom/0.802−0.5540.778−0.6460.708
HSItyp0.8170.77−0.4410.691−0.520.498
HSIdia0.5390.78−0.5010.420n.s.n.s.
P. abies0.802/−0.850.592−0.4670.608
GolijaHSIdom/0.679n.s.0.674−0.8010.855
HSItyp0.9660.7968n.s.0.611−0.7180.742
HSIdia0.9390.711−0.310.629−0.7410.81
P. abies0.679/n.s.0.533−0.3810.375
KopaonikHSIdom/0.588n.s.0.66−0.8250.862
HSItyp0.7350.799−0.2030.606−0.5670.452
HSIdia0.8970.571−0.4320.55−0.7760.886
P. abies0.588/−0.6120.703−0.4990.484
T—annual temperature; P—annual precipitation; N—soil nitrogen content; pH—soil pH value. All correlations are significant at level p < 0.05; n.s.—not significant.
Publisher’s Note: MDPI stays neutral with regard to jurisdictional claims in published maps and institutional affiliations.

