Article

The Genetics and Ecology of Post-Fire Eucalyptus globulus Recruitment in an Isolated Stand in Central Portugal

1
RAIZ Forest and Paper Research Institute, Quinta S. Francisco, Ap 15, 3801-501 Eixo, Portugal
2
College of Agriculture, Polytechnic of Coimbra, Centre for Functional Ecology, University of Coimbra, 3045-601 Coimbra, Portugal
*
Author to whom correspondence should be addressed.
Forests 2022, 13(5), 680; https://doi.org/10.3390/f13050680
Submission received: 1 April 2022 / Revised: 24 April 2022 / Accepted: 25 April 2022 / Published: 28 April 2022
(This article belongs to the Section Forest Ecology and Management)

Abstract

:
Eucalyptus globulus Labill. is a widespread forest tree species, reported as naturalized across the introduced range, often showing abundant natural regeneration after wildfires. This paper studies a post-fire cohort of seedlings derived from a small, isolated E. globulus stand in central Portugal. The aim is to better understand the genetic dynamics and dispersal mechanisms of naturally established E. globulus populations in the introduced range. The seedling density at 55 m from adult trees was 12,000 ha−1, the farthest seedling being registered at 101 m. Post-fire expansion occurred in a southward direction, in accordance with predominant wind. Seedlings had significantly lower levels of genetic diversity (Ae = 5.8.; He = 0.8) than adult trees (Ae = 6.5; He = 0.8). Crossings were strongly unbalanced, with only eight trees contributing to the sampled seedlings, and one single tree contributing to 52% of these seedlings. Moreover, the co-ancestry amongst seedlings more than doubled (from θ = 0.03 to 0.076), and the population status number was around one third of the value registered for the adult population (from Ns = 16.2 to 6.6). Despite its isolation, external pollen was detected in the stand, and appears to have travelled at least 700 m, contributing to 22% of the offspring. Overall, the seedling cohort is much less diverse than the parent trees, with expected lower resilience and persistence to environmental stresses.

1. Introduction

Eucalyptus globulus Labill., also known as Tasmanian blue gum, is an evergreen, broadleaf tree native to southeastern Australia (Victoria), the Bass Strait Islands, and Tasmania. This tree species was discovered by the end of the 18th century, and was later introduced into several countries throughout the world [1,2]. It is now one of the most popular and important pulpwood plantation species in the world, covering more than 2.5 million ha, mostly in the Iberian Peninsula, Australia, and southern South America [2]. Eucalyptus globulus was introduced to Portugal in the mid-1800s, but the planted area expanded more significantly in the late 20th century, mostly aimed at the pulp and paper industry [3,4]. By 2015, the eucalypt area reached around 845,000 ha, which makes Portugal the country with the largest area occupied by this species [5].
E. globulus is naturalized in many regions across the introduced range, often showing abundant natural regeneration, especially after fire or other major environmental disturbances [6,7]. Although eucalypts are generally viewed as less invasive than several other tree species [8,9], given its wide distribution, it is important to have a better understanding of its reproductive success and how it is likely to evolve. Most of the published research looked at the importance of environmental factors on the natural regeneration success of the species, especially in areas surrounding plantations [8,10,11]. Fire and climate have been shown to be important drivers of seedling establishment. Fire, in particular, triggers massive, synchronized seed shed following capsule desiccation [12,13,14,15], and reduces or eliminates plant competition [11,16]. Small, isolated E. globulus populations or individuals can also originate abundant recruitment [7].
Less studied has been the role of population genetics in explaining how these naturalized, often isolated, populations are likely to evolve. One of the approaches to study the genetics of dispersal and naturalization of exotic plant populations has been the use genetic markers (e.g., [17,18,19]). They provide a framework for estimating most of the key intra- and inter-population genetic parameters, and help to explain how naturalized populations are expected to evolve. Among the large number of available genetic markers, microsatellites or simple sequence repeats (SSR) have been widely used in eucalypt studies throughout the years [20,21,22,23,24,25,26].
This paper studies the genetic structure of a post-fire regeneration cohort derived from a small, isolated population of E. globulus in Portugal. The aims are two-fold: (a) to understand the changes in genetic diversity between cohorts, as well as the mating patterns and gene flow underlying this regeneration event; and (b) to characterize the expansion patterns, including seedling densities, dispersal distance, and dispersal directions. This was achieved by producing a complete reconstruction of the parent and offspring pedigree relationships based on 11 SSR nuclear markers. This is the first study using genetic markers to assess the genetics of an E. globulus naturalized population in the introduced range. The presented results are relevant for better understanding the naturalization process of E. globulus in Portugal and elsewhere.

2. Materials and Methods
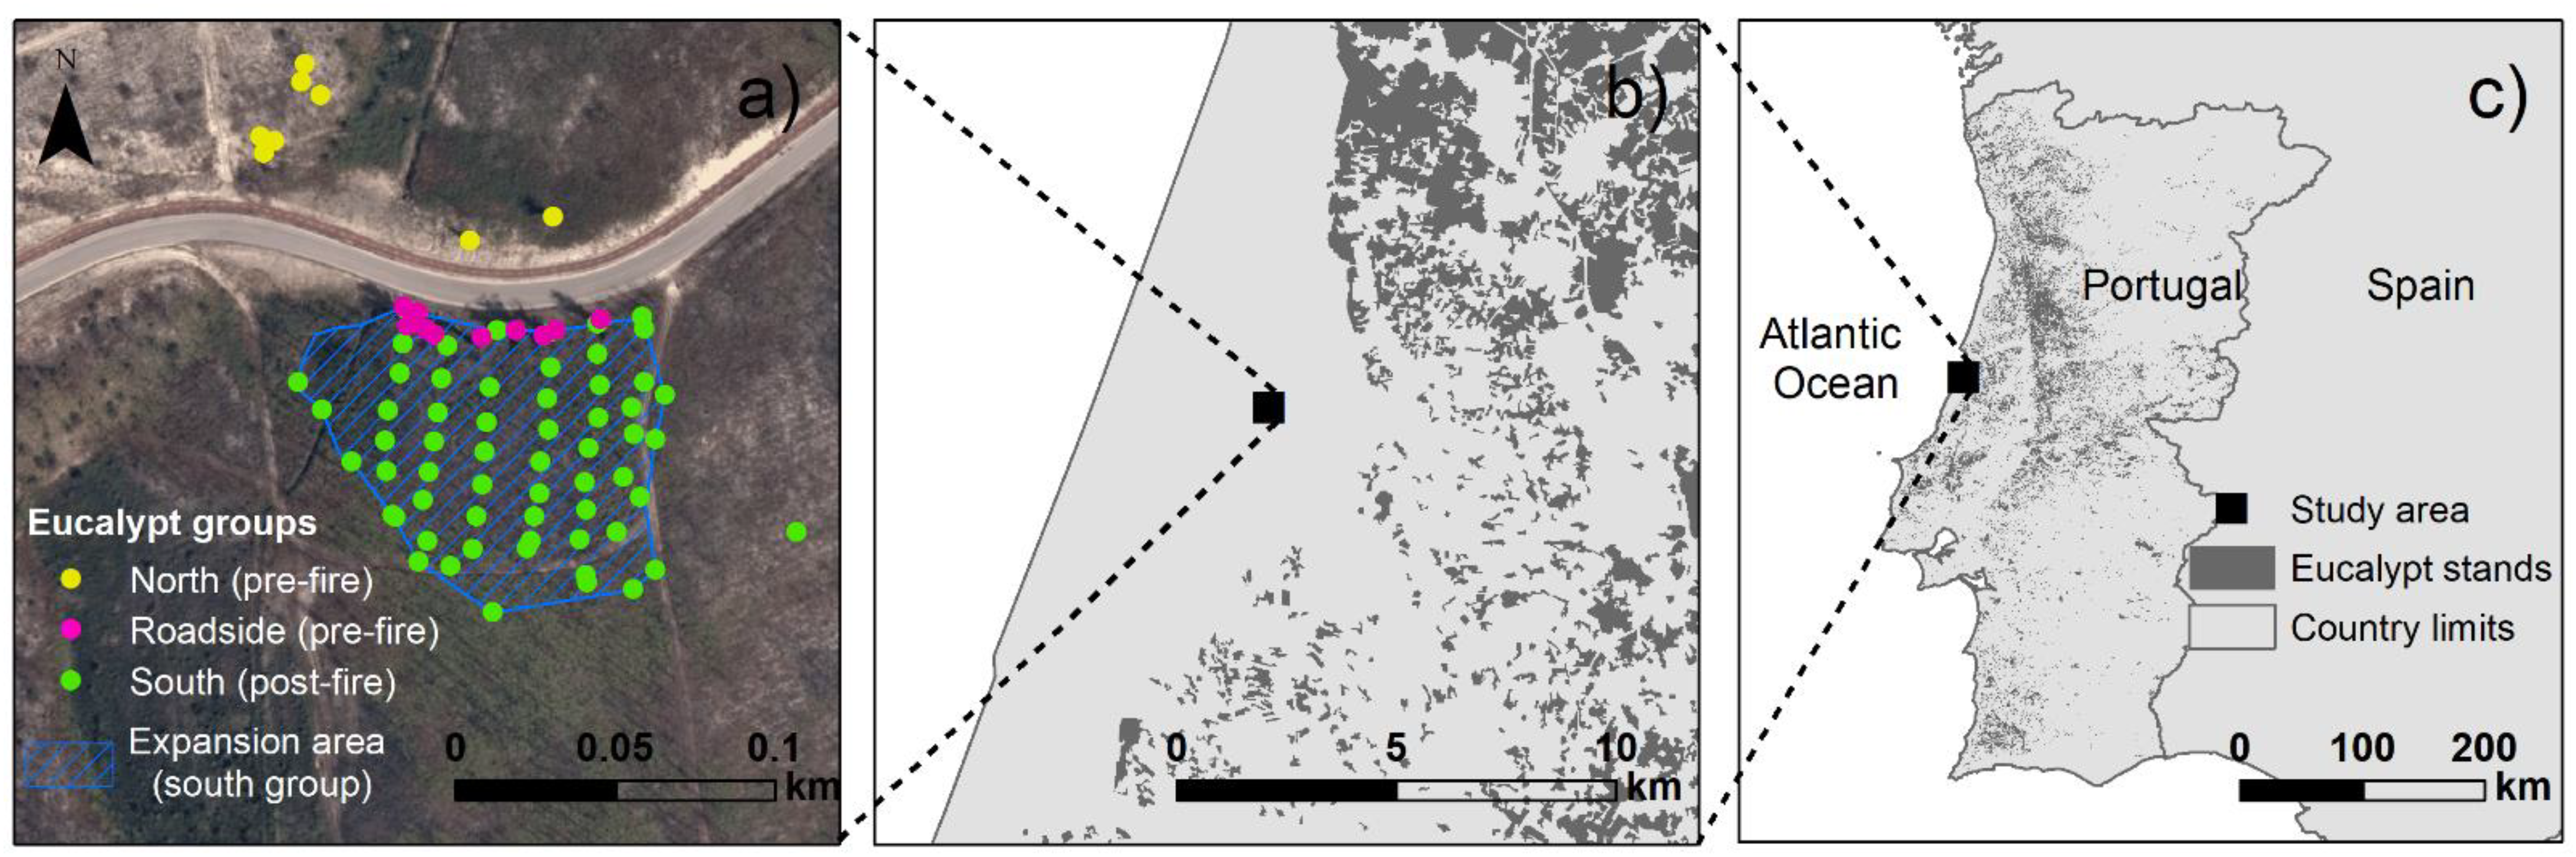
2.1. Study Area

The study area is located at Mata Nacional do Urso, a public forest estate located in central Portugal (coordinates: 39.970312°, −8.882413°; Figure 1). This woodland is managed by the Portuguese Institute for Forests and Nature Conservation (ICNF), covering a total area of 6102 hectares. The terrain is slightly undulated, shaped by dune systems, with an average altitude of 50 m, reaching c. 90 m in some locations. The forested area is dominated by maritime pine (Pinus pinaster Ait.) plantations. The introduction of eucalypts in this area dates to 1909–10, when 35,000–40,000 eucalypts, mostly E. globulus, were planted for swamp draining [27] and for ornamental purposes along roads, and they have persisted until today, mostly in small patches and along roadsides.
The studied eucalypt population includes a small, isolated group of trees planted along a roadside, the respective offspring, and a few other trees of unknown origin. The population distances ca. 4 km from the sea, covering c. 1.55 ha on both sides of the road (Figure 1), and extending over 213 m between the most far apart plants. The closest eucalypt stand is located at ca. 700 m. The roadside trees are 10 adult eucalypts of unknown provenance and age, planted along 75 m on the southern side of the road. On the northern side of the road, there was another small group of trees, probably eucalypts, that were clear felled between 2009–2011 after the improvement of the road. At the time of the survey, some resprouting eucalypts persisted north of the road. Most of the remaining area is covered by E. globulus recruitment that expanded south of the road after a wildfire occurred in October 2017, covering ca. 0.98 ha. According to historic aerial imagery, until recently, the whole area was covered mostly by pine plantations that were clear felled after the latest wildfires, particularly north of the road after a wildfire in 2015 and south of the road after the latest 2017 wildfire.

2.2. Sampling and Data Collection

The whole eucalypt population was divided into three main groups, based on their size and status (Figure 1). The group of putative founder trees was composed of 10 large adult individuals, planted before the 2017 wildfire, along the roadside. The second group was composed of eight smaller adult trees, also present before the 2017 wildfire. The third group was composed of highly dense plant recruitment, established after the 2017 wildfire. These plants are hereafter identified as seedlings, although their size was between the seedling and sapling stages.
Field work was performed in September 2020, around three years after the 2017 wildfire. There were two different sampling schemes that were applied to the whole eucalypt population. One was addressed to sample both adults and seedlings, in order to obtain genetic material to assess genetic diversity and kinship. The other was specifically addressed to sample the seedling population to assess the population structure, including density and size class distribution. The first sampling scheme was performed at the plant level, whereas the second used a series of sampling plots distributed along transects across the area of seedling establishment. Aerial imagery collected in October 2018 with an unmanned aerial vehicle (drone) assisted the design of the sampling protocols, particularly the establishment of the sampling transects.
Regarding the sampling for the genetic analysis, we collected data and biological tissue (leaves or cambium) from a sample of seedlings (south group) and from all mature trees present (roadside and north groups). In order to collect all putative parents, all eucalypts established before the 2017 wildfire were sampled (n = 18), which included all putative founder individuals planted on the roadside and all adult trees north of the road. The south seedling population, due to its abundance, was sampled along transects. A set of six parallel transects were set, distanced 15 m from each other, starting from the row of roadside trees, and extending south perpendicular to the road, corresponding roughly to the dispersal direction. We selected the closest seedling every 10 m along each transect until no eucalypt plant was found. Additionally, we conducted a thorough survey in the surrounding areas and sampled all eucalypts found at greater distances, until reaching the limit of 62 seedlings. A total of two of the sampled seedlings did not meet the minimum quality parameters of extracted DNA, being therefore discarded from further analyses. Therefore, the sample for genetic analysis was composed of 18 adult trees and 60 seedlings (n = 78). All sampled eucalypts were tagged and identified by a unique code, and georeferenced using a high-precision (<1 m) GPS (Trimble Geo7x; Geospatial Solutions, Trimble Inc., Sunnyvale, CA, USA). The following information was collected for each sampled eucalypt: (a) maximum height (using a digital clinometer for taller trees; model Peco DCC-1, PECO Sales, Jackson, MS, USA); diameter at breast height of all stems (DBH; measured at 1.3 m height; smaller trees had no data); diameter and height of all stumps in the case of resprouting individuals; resprouting condition (yes/ no) and number of stems; presence of reproductive organs; and proportion of juvenile leaves.
The second sampling scheme, which addressed the structure of the seedling subpopulation, used a set of sampling plots established across the post-fire expansion area. A total of 4 sampling plots were established every 15 m along 3 of the 6 sampling transects, totaling 12 sampling plots. The first sampling plot in each transect was distanced 10 m from the start of the transect. As a result, sampling plots were established at the following distances along transects: 10 m; 25 m; 40 m; 55 m. Sampling plots were circular, with a 1.79 m radius and an area of 10 m2. In each sampling plot, the number and height of all eucalypts was recorded, and later assigned to four height classes: ≤0.50 m; 0.51–1.30 m; 1.31–3.00 m; >3.00 m.

2.3. DNA Extraction and Microsatellite Analysis

Genomic DNA was extracted from all collected samples. Cambium tissue was stored in ice after collection until DNA extraction. A standard DNA extraction protocol was used as described by [28], with minor modifications. Both quantity and quality parameters of extracted DNA were accessed using Thermo ScientificTM NanoDrop.
A total of 11 microsatellite loci were amplified in multiplex sessions using well established conditions, and information for the 11 SSR is presented in Supplementary Table S1 [29,30,31,32]. Amplified DNA fragments were separated by electrophoresis on 0.25-mm-thick 65% polyacrylamide gels, and visualized using a DNA sequencer (Gene Readir 4200; LI-COR, NE, USA). RFLP scan analysis software (v3.1, Scanalytic, Fairfax, VA, USA) was used for measuring SSR allele size. Manual editing of allele size was performed for increased accuracy.

2.4. Genetic Analysis

2.4.1. Genetic Diversity

Genetic diversity parameters were estimated for all individuals. Allelic frequencies, the number of alleles per loci (Na), and the number of effective alleles per loci (Ne) were generated using GenAlex v6.5 [33,34]. The observed (Ho) and expected (He) heterozygosity, the Wright’s fixation index (FIS), and the Hardy–Weinberg equilibrium (HWE) were calculated using the software FSTAT v2.9.3 [35,36] and GENEPOP v4 [37]. The null allele frequencies were estimated following the Brookfield method, implemented in MICRO-CHECKER v2.2.3 package [38]. The global FST estimate and corresponding significance levels were calculated using GENEPOP and pairwise FST measurements [39] amongst the mature trees, and the post-fire seedling cohort population was estimated using ARLEQUIN v3.5 [40], with 10,000 permutations.

2.4.2. Paternity Assignment

Paternity analysis of each post-fire individual seedling was carried out using a maximum-likelihood method, as implemented in software CERVUS v3.0.6 [41]. Paternity was assigned by comparing the genotypes of the 18 pre-fire individuals with all post-fire individual seedlings (n = 60), assuming that the potential parents could be either the mother or the father of the progeny at any given point in time. Simulation analysis was carried out to determine the critical value of Delta (D) for each confidence in the paternity and maternity analysis, defined as the difference between the “LOD score” of the first most likely candidate and the “LOD score” of the second most likely candidate.
Simulations were based on a confidence level of 80% (relaxed) to 95% (strict), as suggested by [42], using 100,000 repetitions, 0.01 as the ratio of genotyping errors, and 100% as the proportion of pollen donors sampled within each population (given the high degree of isolation of the orchard). The minimum number of loci necessary to determine the paternity of a seed was fixed at eight.
In order to assign candidate parents, we used the method described by [43,44]. In cases where only one potential parent was assigned to one individual, the potential parent was deemed as the maternal (seed) parent. If a seedling had no potential pollen donor within the population, this seedling was considered to have been derived with pollen from outside the stand. When two potential parents were assigned, the closest parent was assumed to be the seed parent, while the most distant was considered as the pollen donor. This hypothesis could be used in our case study, as seeds in E. globulus have a dispersal distance smaller than the respective pollen [11,45]. In pedigree reconstruction for each seedling, we also considered the possibility of one single mismatch and the possibility of self-pollination.
Based on the reconstructed pedigree, we calculated the group co-ancestry (θ; viz [46]) and from this, the corresponding status number was calculated. This status effective number, introduced by [47], can be defined as the number of unrelated and noninbred genotypes in an ideal panmictic population that would produce progeny with the same average coefficient of inbreeding as the progeny of the genotypes of a panmictic breeding population. Status number would equal the census number if all trees were unrelated.

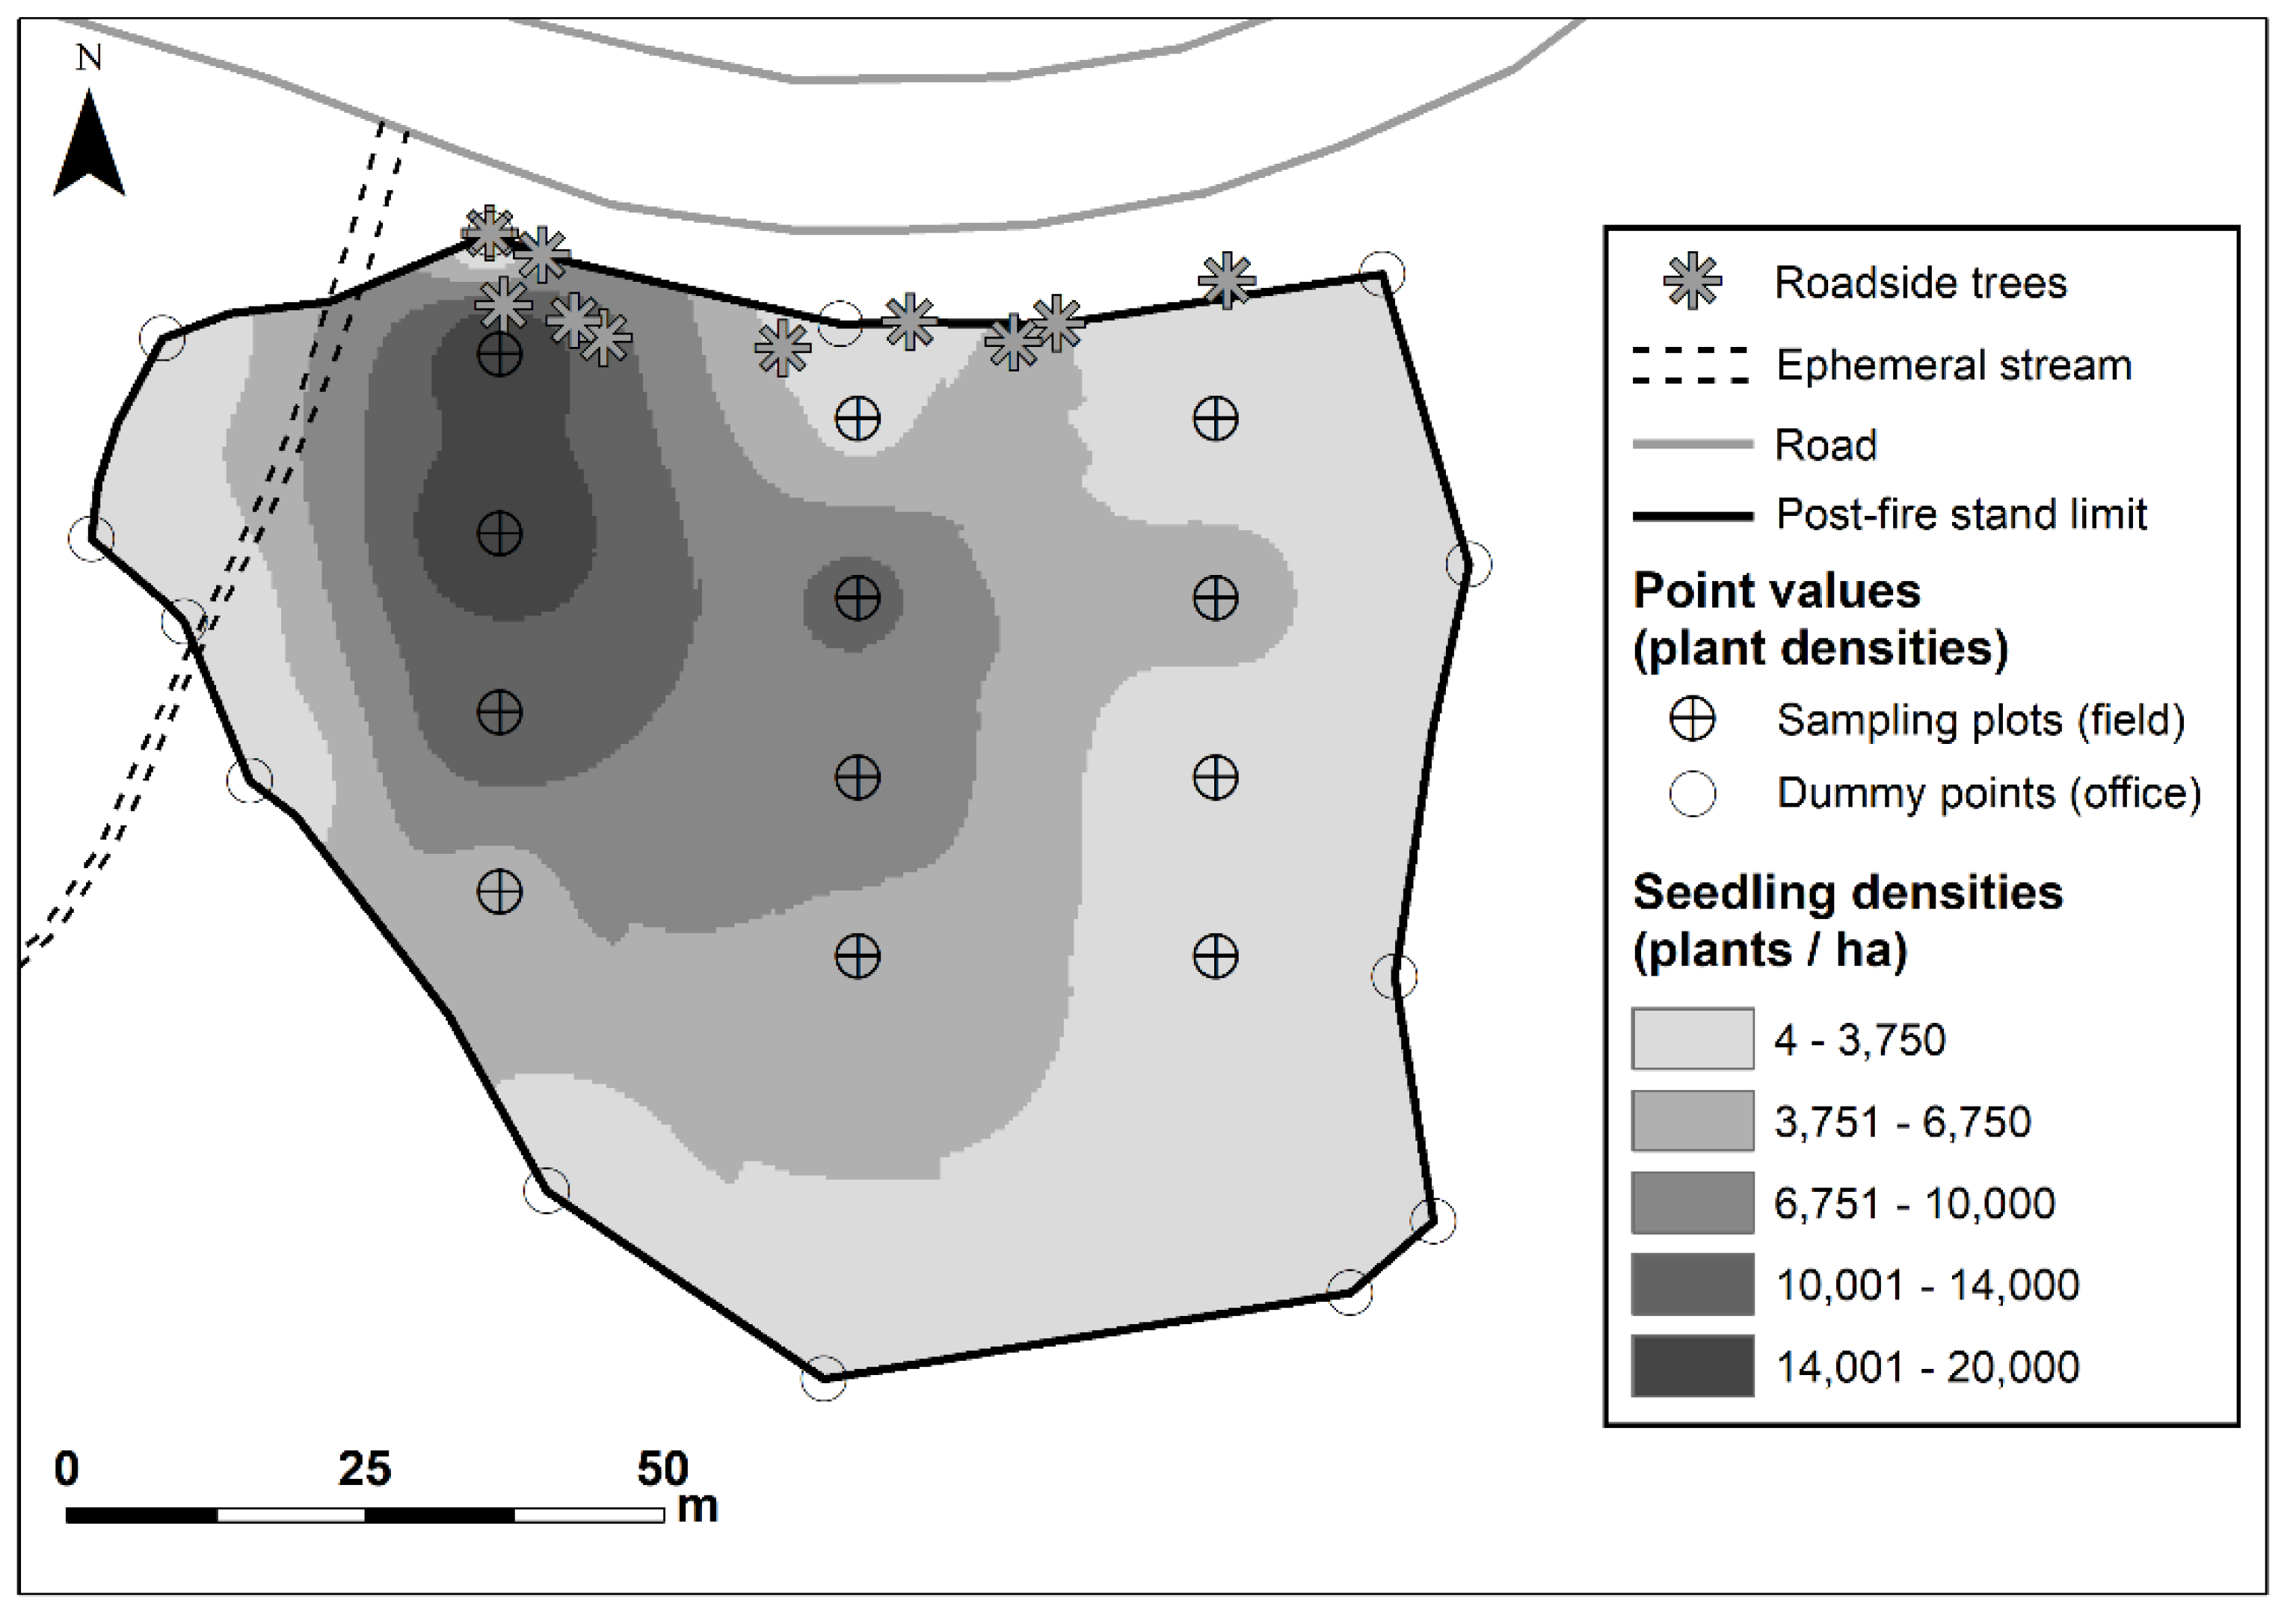
2.5. Analysis of Field Data

Results of paternity assignment allowed computing the dispersal distance and direction (azimuth) in GIS of sampled offspring from seed-trees. Seed dispersal was compared for each sampled seedling, with prevailing wind data (direction and speed), in the days following the 15 October 2017 wildfire. We retained the samples for which the mother was unequivocally identified (n = 22; 15 plants with one parent assigned and 7 selfings). Wind speed was estimated from D ≈ Vw H/Vt, [48], where D is distance, Vw is wind velocity, H is height, and Vt is terminal velocity of E. globulus seeds. Terminal velocity of E. globulus seeds was estimated to be 5.54 m s−1 in the cited work. A wind rose diagram was produced using these 22 records of dispersal events.
Previous studies found that most seeds are expected to be dispersed within a three-month period after a wildfire [49]. Therefore, hourly wind data were gathered for the period between 16 October and 15 January (three months) from the two closest weather stations, distanced c. 20 and 22 km from the study area, and c. 5 and 16 km from the sea. The weather stations were located at the following coordinates: 40.139764°, −8.805944° (Figueira da Foz) and 39.780550°, −8.820966° (Leiria). Wind data included azimuth; average speed; maximum speed; and azimuth of maximum speed. Hourly records with no data were discarded. Wind data were provided by the Portuguese Institute for the Sea and Atmosphere (IPMA). Wind data were divided into groups of seven consecutive days (weeks) for analyses. The number of records for each week ranged between 317 and 384 records. A wind rose plot was produced for each week from each weather station, totaling 26 wind roses (13 weeks × 2 weather stations). Wind roses were created using R software [50]. The average wind direction was compared with the average dispersal direction of each weather station, using a Wilcoxon rank sum test.
In order to visualize spatial patterns and local trends of seedling densities in the post-fire expansion area, we performed spatial interpolation of seedling density data from the 12 sampling plots established within this area. Since interpolation maps are spatially confined within the perimeter of sample points, in our case, it formed a square in the middle of the post-fire expansion area (not covering the whole expansion area), and additional density points (dummy points) were created in the outer limits of the expansion area. These dummy points corresponded to the outer seedlings identified either in field surveys or through photointerpretation of high-resolution aerial imagery to draw the perimeter of the expansion area, as well as the limits of the interpolation map. Each dummy point was assigned with the minimum value of 1000 plants ha−1, corresponding to one plant in a 10 m2 sampling plot. Density interpolation was performed in ArcGis using the inverse distance weighting method (Geostatistical Analysis extension; default options). A total of five density classes were defined using Jenks’ natural breaks classification method, rounded to the nearest quarter of a thousand.
To understand the factors explaining the number of parentage relations assigned to each parent tree, we used a generalized linear model with a Gaussian distribution and logit link function, using tree-related data as predictors. We retained parent trees with at least one parentage relation assigned, either as mother, father, or both in the case of selfings (2 parentage relations counted), totaling 8 seed-trees with 108 parent-offspring relations.

3. Results

3.1. Population structure

The adult trees present in the stand prior to the fire included a wide range of sizes, and correspond possibly to at least two cohorts (roadside and north, Table 1). The group with the largest trees (n = 10) along the roadside were probably the oldest eucalypts in this population. Their heights and DBH ranged between 16.8 and 32.2 m and between 14 and 60 cm, respectively. Overall, seven of them had DBH greater than 48 cm. All these roadside trees were also single-stemmed, indicating that they have never been coppiced, and all showed reproductive organs (buds, immature and/or mature capsules).
The north group of adult trees (n = 8) was composed of several coppiced individuals, showing between 1 to 5 shoots per stump (1.8 ± 1.3 shoots; mean ± SE). Their height ranged between 5.0 and 12.0 m, and DBH ranged between 8 and 40 cm. Only one individual in this group held capsules in the canopy.
The south group (n = 60) included the sampled juvenile seedlings recruited after the October 2017 wildfire. The average height was 1.3 ± 2.3 m, ranging between 0.2 and 4.0 m. Most seedlings (n = 57, 92%) had exclusively juvenile leaves, and none had exclusively adult leaves. No sampled seedling was resprouting, and none had developed reproductive organs at the time of the survey.
Sampling plots established throughout the post-fire expansion area (see Section 2.2) showed an average density of 8167 ± 1849 (SE) juvenile plants ha−1 (Figure 2). The maximum density was estimated at 20,000 plants ha−1, and the minimum recorded was 1000 plants ha−1. The average seedling density along the sampling plots at 10 m, 25 m, 40 m, and 55 m from the closest seed-trees was, respectively, 8000 ± 5508 plants ha−1, 12,000 ± 4359 plants ha−1, 7666 ± 3528 plants ha−1, and 5000 ± 1000 plants ha−1. A total of 98 seedlings were counted in the 12 sampling plots, distributed according to the following height classes: class ≤ 0.50 m = 27 seedlings; class 0.51–1.30 m = 35; class 1.31–3.00 m = 32; class > 3.00 m = 4.
Spatial interpolation of seedling densities across the post-fire expansion area showed that higher seedling densities concentrate near a group of seed-trees in the western limit of the area, close to a drainage channel, crossing the area (Figure 2). In general, seedling densities tend to decrease with distance from both seed-trees and from the small stream, in a southeast direction.

3.2. Genetic Diversity Analyses

The 11 nuclear SSR markers were successfully expressed in all 78 individuals. All of the genotypes analyzed (adults and seedling’s cohorts) were unique, indicating an absence of cloning.
Statistics related with genetic diversity of the adult and post-fire seedling populations are presented in Table 2. The adult trees’ (n = 18) number of alleles (A) varied between 8 (several loci) and 12 (En12), with an average of 9.6 alleles/loci, and an effective allele number (Ae) ranging between 4.1 (En15) and 8.6 (Embra23), with an average of 6.5 alleles. These are higher values than those found in the post-fire seedling cohort. The seedling cohort (n = 60) had a total number of alleles per locus ranging between 6 (in Embra119) to 10 alleles (at several loci), with an average of 8.7 alleles. This corresponds to a number of effective alleles that ranged between 3.9 (Embra119) and 7.9 (Embra41) alleles, with an average of 5.8 alleles.
Regarding the levels of observed heterozygosity, estimates within the adult tree cohort ranged between Ho = 0.722 (in Emcrc8) and 0.944 (at various locus), with an average of 0.869. This is higher than the expected He = 0.838, for the average of all loci, although differences and signs changed across loci. However, no loci showed a statistically significant deviation from the Hardy–Weinberg equilibrium expectations (Table 2). The overall fixation index was therefore slightly negative (FIS = −0.008), but not significantly different from zero. In the seedling cohort, the observed heterozygote ranged between 0.712 (En12) and 0.950 (Embra23), with an average estimate of Ho = 0.822, a lower value than found in the adult cohort. The observed heterozygosity was generally higher than expected, ranging between 0.744 (Embra119) and 0.874 (Embra41), and with an average value of He = 0.819. Furthermore, in the seedlings cohort, these differences were found to deviate significantly from the Hardy–Weinberg equilibrium at most loci, with most showing significant positive fixation indices (mean Fis = 0.004; Table 2).
In many trees, several private alleles have been found across all loci, although they were mostly found on pre-fire mature trees (in 10 out of the 18 individuals). In the post-fire seedling population, only three seedlings presented private alleles, i.e., alleles not found in any of the neighbor adult trees. The marker-based pairwise population statistic FST, between the adult and the post-fire seedling cohorts, was FST = 0.003 (which is not statistically significant from zero), indicating no significant change in gene frequencies, an indication that little genetic differentiation occurred between the two cohort populations.

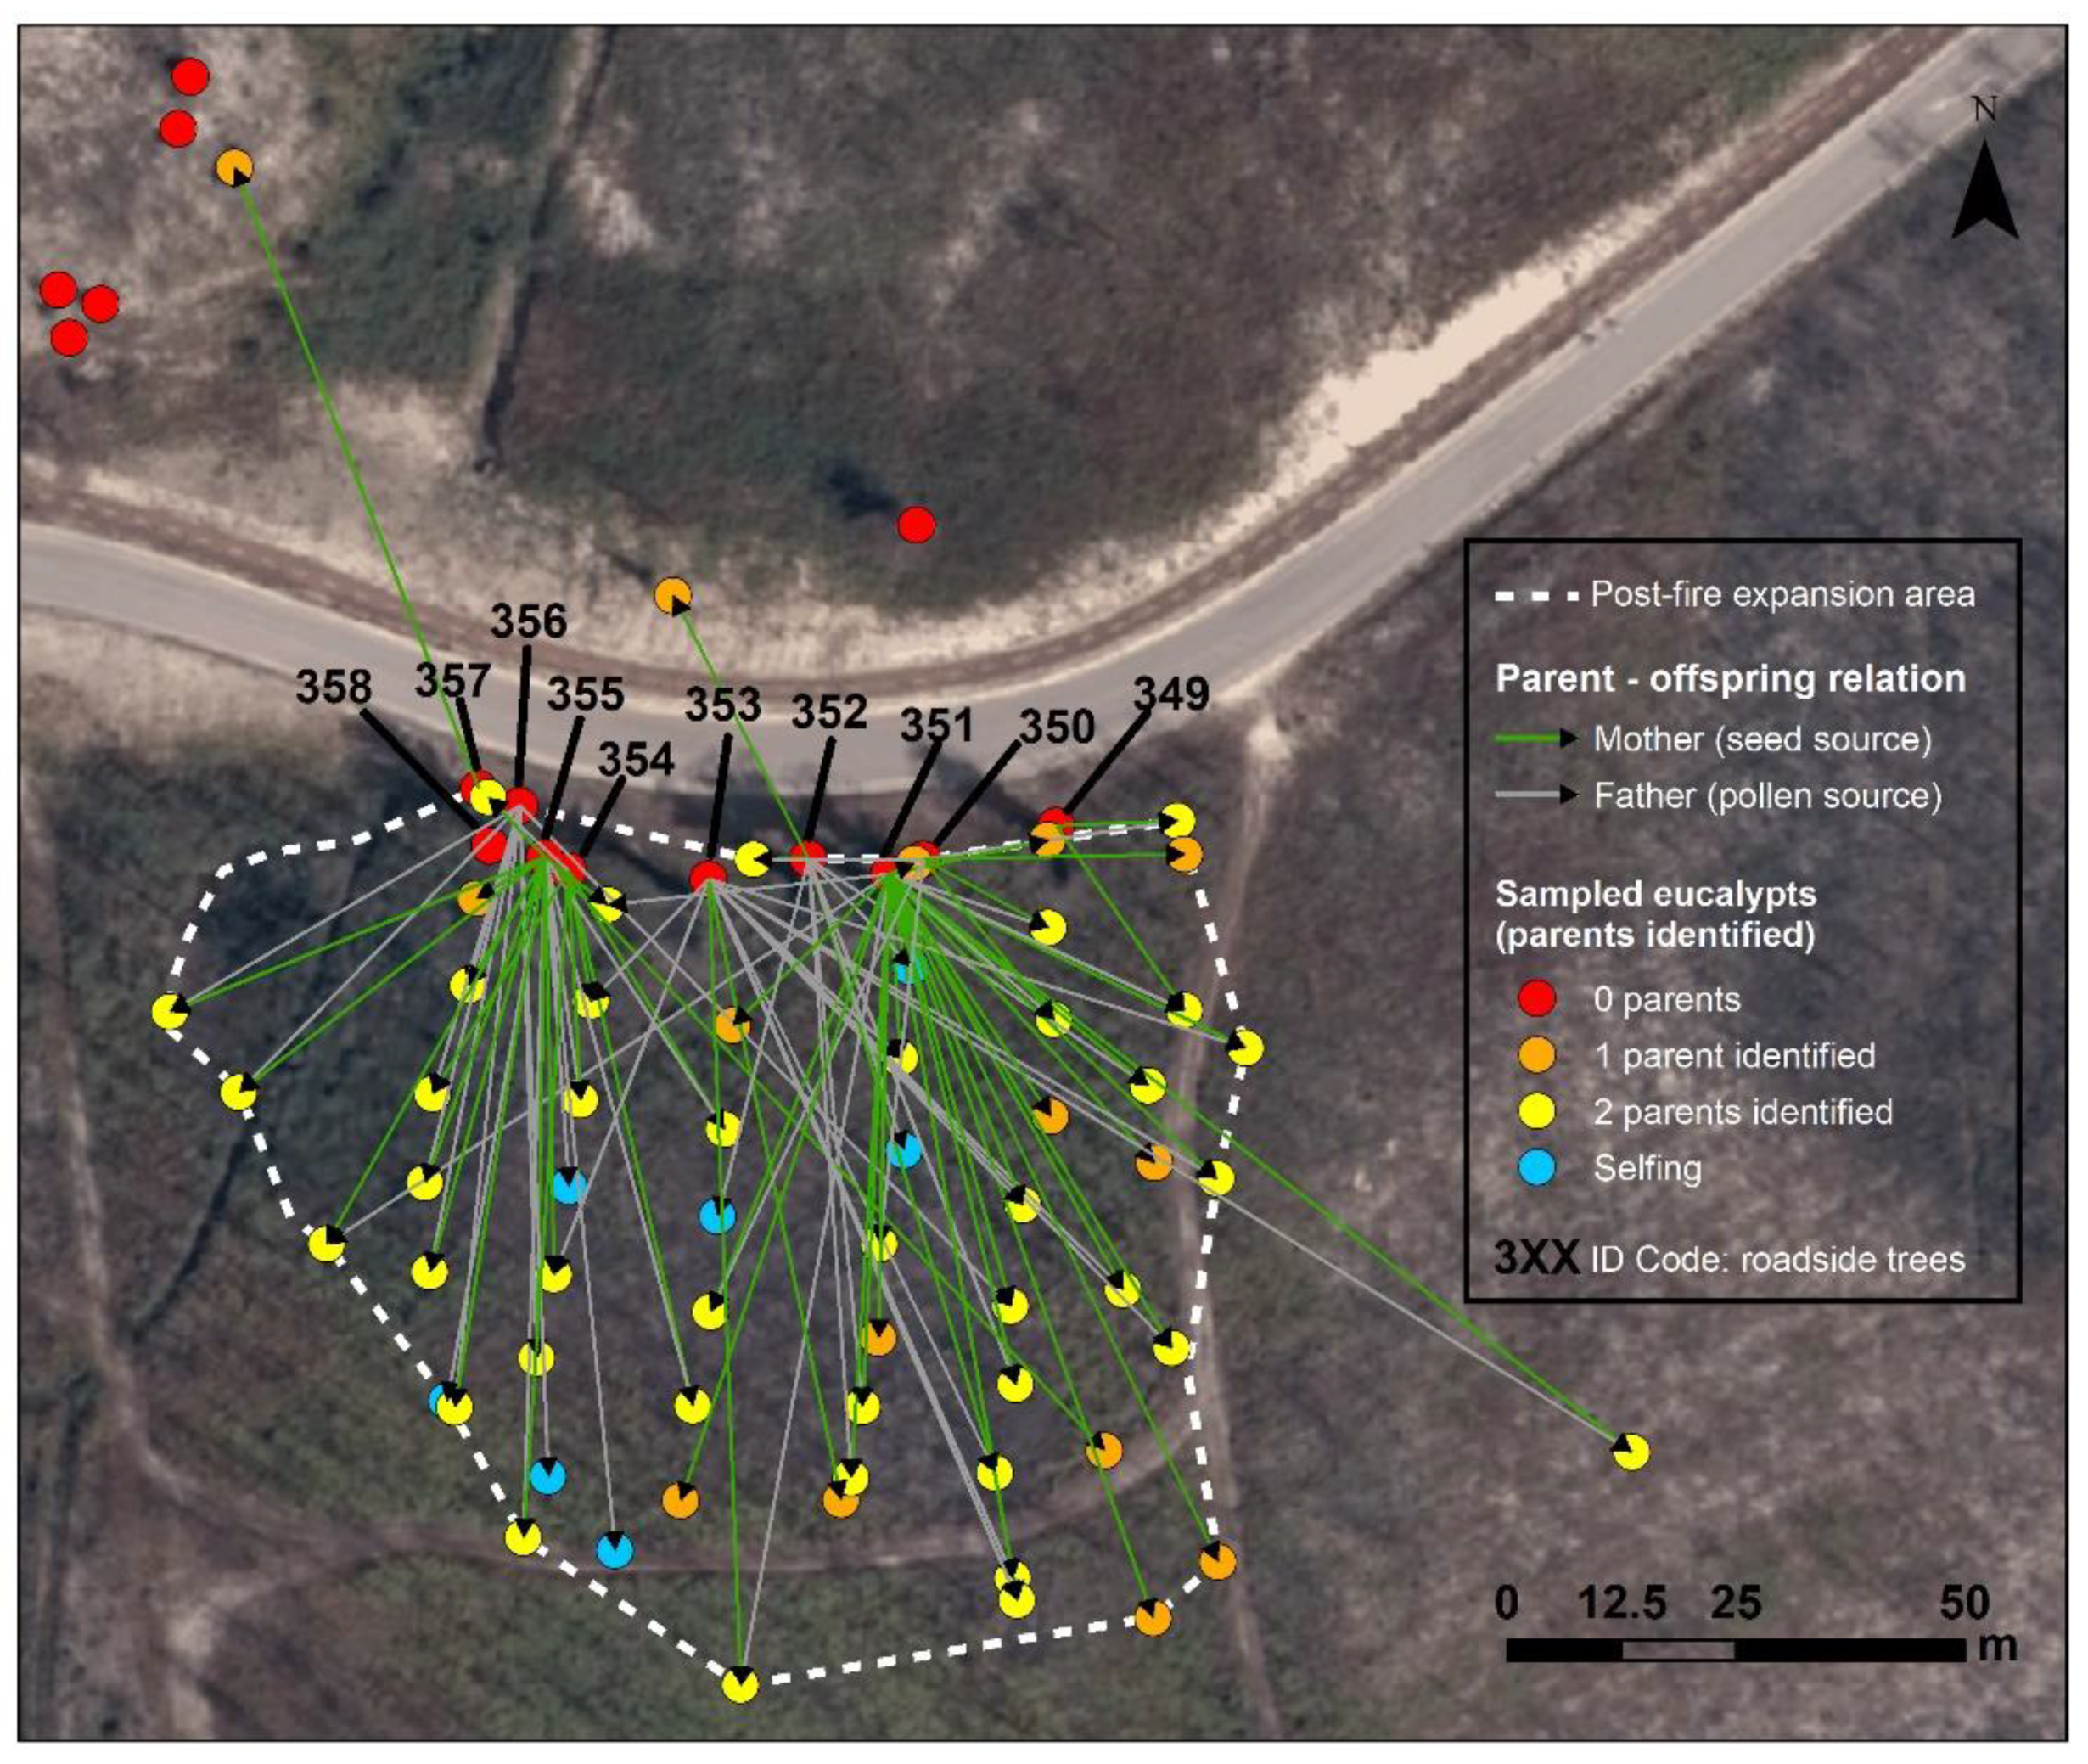
3.3. Parentage Analysis and Genetic Structure

Amongst the 18 adult trees present prior to the 2017 wildfire, 4 have been found to be related, either as parent–offspring or as full siblings (with a 95% confidence level). Given the differences in size, it would seem more likely the two smaller adult trees of the north side of the road are offspring of two largest trees by the roadside (Figure 3). For the remaining ones, with an unknown pedigree, their mean pairwise relatedness, inferred from the SSR marker’s data, was −0.193 (SE ± 0.017), which can be interpreted as equal to zero, hence suggesting that these founder trees can be considered unrelated and, in fact, rather divergent.
All 60 post-fire seedlings had at least one of their parents successfully assigned, with a 95% confidence level (Figure 3). Paternal (pollen) parents within the stand were able to be assigned to 47 seedlings (78%), 7 of which were through self-pollination (a 12% rate). Out of these 47 seedlings, 32 pollen parents were assigned with a 95% confidence level, and the remaining being assigned with 80% confidence. A total of 13 seedlings (22%) had no known putative pollen parent, and were assumed to have been originated with pollen coming from outside the stand.
Out of the 18 adult trees standing at the time of the fire, only 8 seem to have produced offspring after the post-fire event. The reproductive success varied considerably between them. One adult tree, in particular (#351), contributed to most (52%) of the sampled post-fire seedling offspring. This tree had also the highest DBH, and was amongst the tallest putative parents in the stand. In fact, the GLM produced to understand how tree-related characteristics influence the number of parentage relations showed a positive and significant influence of DBH (p = 0.03) on reproductive success, explaining 45% of the deviance (Table 3).
Selfed seedlings originated from only three of the contributing parents, namely trees #352, #353, and #355, with no evident relationship to its size or position in the stand (Figure 3, blue dots). Similarly, outcrossing with foreign pollen varied little among female parents, with no obvious association with tree size. However, seedlings with foreign pollen seem to be preferentially located to the south, east, and southeast limits of the regeneration patch (Figure 3, orange dots), but with no apparent relationship with the direction of the closest stand positioned 700 m away, to the south, west, and southwest.
Based on the full reconstructed pedigree of all adult and progeny cohorts in the stand, the total group co-ancestry amongst the 18 adult trees, mostly found to be unrelated, was close to zero (θ = 0.03), which corresponds to a status number of Ns = 16.2. On the other hand, the seedling group co-ancestry was significantly higher (θ = 0.076), and its correspondingly status number was much lower (Ns = 6.6). The pairwise co-ancestry (θxy) between all pairs of post-fire seedlings included only 56% of unrelated pairs (Table 4).

3.4. Seed and Pollen Dispersal

The study covers a well-defined regeneration patch, derived from a small group of adult individuals, which served as seed-trees following a single fire event. The seed dispersal therefore corresponds to the boundaries of the regeneration patch, which in this case reached a maximum distance of 101 m from the roadside (putative founders) trees. Among the 8 mother-trees identified, the maximum dispersal distances ranged between 24.0 m and 101.0 m, with at least 20 seedlings distanced between 50–80 m, and 5 seedlings distanced more than 80 m from their mother-trees. Furthermore, this dispersal, which originated exclusively from large seed-trees present on the roadside, occurred preferentially southwards.
The following analyses of wind dispersal direction exclusively considered eucalypts (samples), for which the mother was unequivocally identified, which included samples with one parent identified and selfings (n = 22). The average dispersal azimuth was 175º (south). Around 68% (n = 15) of the seed dispersal events occurred towards the southern quadrant (SSE; S; SSW). However, there was great amplitude of dispersal, ranging from 68° (ENE) to 339° (NNE). Trees providing more than one dispersal event showed relatively wide amplitudes of dispersal azimuth, ranging between 137° (SSE) and 239° (WSW), between 68° (ENE) and 226° (WSW), and between 137° (SSE) and 333° (NNW), corresponding to amplitudes of 102°, 158°, and 196°, respectively.
Comparisons (Wilcoxon test) between seed dispersal direction and the prevalent wind in the three months following the fire showed different results, depending on the weather station. The dispersal azimuth was significantly different from the average wind direction in one weather station (Figueira da Foz; p = 0.008), but it was not significantly different from the wind direction recorded in another weather station (Leiria, p = 0.74).
The estimated wind speed for the effective seed dispersal, considering seedlings with assigned mother (n = 22), ranged between 2.1 and 68.8 km h−1 for dispersal distances between 2.9 and 87.3 m. Seed dispersal distances greater than 80 m required wind speeds greater than 50 km h−1. Nearby weather stations recorded higher maximum wind speeds of up to 86 km h−1 in the weeks following the fire, many of which were in the direction of the south quadrant, in accordance with seed dispersal direction.
Pollen, on the other hand, seemed to have been able to travel longer distances. Although most of the seedlings have been sired by one of the local adult trees, 22% of the post-fire cohort seedlings appears to have been sired by external pollen. A careful survey of the areas surrounding the studied plot indicated that the nearest eucalypt trees were located at least 700 m away, therefore the results point to a significant long-distance dispersal of pollen (Figure 1).

4. Discussion

4.1. Genetic Diversity

The Mata Nacional do Urso population started as an isolated grove of a few trees, established for ornamental purposes by the Portuguese Forest Service in mid-20th century, most likely from local seed sources. The genetic diversity of this founder population is, as expected, not particularly polymorphic [51]. The mean allele number, A = 9.6, which corresponds to an effective allele number of 6.5 (Table 2), is low compared with the allelic richness of comparable SSR markers reported in studies across the specie’s native range [23,24,25], which found around 20 alleles/locus. However, it is within the range found for local land-races or breeding populations (e.g., [21,52,53]), suggesting that the genetic basis from where these few adult trees present at Mata Nacional do Urso have been collected would have been a reasonable genetic sample of the so-called Portuguese landrace. On the other hand, the observed heterozygosity across the 18 adult trees was Ho = 0.869 (Table 2). This is higher than the typical values reported for native populations, based on similar markers (e.g., [24,54]). In the adult individuals, this observed heterozygosity was also slightly higher than expected under a HW equilibrium, resulting in a negative fixation index (Fis = −0.008), although not statistically different from zero. Such high levels of heterozygosity suggest that these founder trees would be mostly unrelated and diverse. The excess heterozygosity, albeit small, is also expected in populations which have undergone a recent reduction in effective size, as it was the case here. However, it can also be the result of other factors, the most obvious being a selective advantage against selfed progeny.
The allelic diversity was, however, significantly altered in the seedling population, compared with the parent adult cohort. The number of alleles dropped (A = 8.7; Ae = 5.8), which represents a loss of one in 10 alleles. Furthermore, the level of heterozygosity dropped to Ho = 0.82, and the fixation index increased (Fis = 0.004), showing now a deficit of heterozygosity and a significant deviation from the Hardy–Weinberg expectations (Table 2). Both results are expected in populations that experience a recent reduction of their effective population size. However, the allelic diversity is reduced faster than the heterozygosity, hence the observed heterozygosity becomes larger than the heterozygosity expected from the observed allele number.
Positive Fis have been the norm in most native population studies, which suggests a build-up of co-ancestry and, over time, a high level of population inbreeding. The Fis = 0.004 found here (Table 2) is, however, lower than the typical estimates in native populations (at around 0.08 [23]). Despite the very small number of parents involved in the post-fire progeny (only eight), the relatively low level of selfing (12%) and the reasonably high frequency of foreign pollen in the pedigree (22% have been pollinated from trees outside the stand) appears to have been sufficient to ensure that, in this generation, the seedling’s cohort remained with low levels of inbreeding.

4.2. Population Structure and Gene Flow

Fire has a major role is E. globulus recruitment. Several studies have found a much higher recruitment in recently burnt areas, compared with undisturbed vegetation [6,7]. In our case, despite the small number of adult trees, post-fire regeneration success was high, with one of the highest densities of naturally established eucalypts ever recorded in the introduced range. The regeneration showed an average density of 8166 ± 6407 plants ha−1 across all sampling plots, with a maximum of 12,000 ± 7549 plants ha−1. Even higher densities were found in Portugal after the same October multiple-fires event (prompted by hurricane Ophelia) in the year 2017 [6,7]. The particular post-fire conditions provided by humid burned soil after the October fire, reported by [6,7], certainly played a major role in such a successful regeneration. The synchronous fire-triggered seed dehiscence was coincident with very favorable germination conditions, resulting in a very high seedlings density. This high density of young eucalypts has raised concerns regarding the control possibilities. Previous findings [6] have shown that an early control of seedlings through cutting or herbicide may be effective and result in high mortality rates.
The three-year-old E. globulus regeneration cohort had an average height of 1.3 ± 2.3 m, a very low growth rate compared with plantation standards [55], but showed a wide variation in size, with heights varying between 0.2 and 4.0 m. This may suggest that the recruitment could have occurred over time. Micro-scale variation in soil conditions, competition, or water availability, although not quantified in our study, may not be enough to explain such a high variation in size. Delayed germination of some of the seedlings would also be unlikely, since E. globulus seeds have no dormancy, and are short-lived once in contact with the soil [12]. Therefore, gradual seed shed after the fire, spanning a period of several months, would be a likely cause of the variation in size [12,49]. A study conducted on E. globulus stands in central Portugal and burnt in the same day but in a different fire showed that new recruitment continued up to two years after a fire event [6], which may explain the range of heights obtained in our study. Accordingly, all seedlings had between 40 and 100% juvenile leaves, and most (92%) had exclusively juvenile leaves.
The regeneration patch covered an area of around 2000 m2 in total, but spread only south of the adult seed trees. This observation highlights the importance of both wind speed and direction in the expansion of E. globulus regeneration. Strong wind speeds enhance long seed dispersal. We estimated that wind-mediated seed dispersal beyond 80 m required wind speed over c. 50 km ha−1 or 14 m s−1 (or 31 mph). This is consistent with local weather station records, which registered similar maximum wind speeds in some weeks during the three months following the wildfire, including in the first week after fire. In fact, October 2017 wildfires in Portugal raged following the Ophelia hurricane that affected coastal countries in western and northern Europe. Together with wind speed, the direction of local wind determines the direction of seed dispersal and the spatial distribution of post-fire eucalypt cohorts. The post-fire expansion recorded in this study occurred predominantly towards the south quadrant, which is in accordance with the predominant winds in this region, and particularly with the dominant winds in the following weeks after fire. The role of wind on E. globulus dispersal has been shown in other studies. For instance, on Angel Island (San Francisco Bay), the remarkable expansion of E. globulus followed prevalent wind directions [56]. Another study found lower abundance of E. globulus seedlings in the western edges of plantations, which may be explained by northwestern winds pushing the seed rain towards the inside of plantations [57]. Despite the existence of southern winds in the weeks following the wildfire, there were no juvenile seedlings on the north side of the road. We also found no evidence of post-fire forest management that could explain the absence of recruitment on the northern side of the road, suggesting that all post-fire recruitment occurred towards the south.
As often reported in natural stands and even seed-orchard populations, reproductive success deviated significantly from typical panmictic conditions, where each parent is expected to contribute equally to the overall progeny. Out of the 18 adult trees, only 8 have contributed to the post-fire seedling cohort, and one of them parented more than half of the progeny sampled. Gene flow from the adult to the seedling cohorts was therefore strongly unbalanced. Eucalypt pollen is not suited for wind dispersal, with pollination being dependent on insects and, in some cases, on birds [58,59]. However, both are capable of pollination over reasonably long ranges. According to land-cover maps, in Mata Nacional do Urso, no eucalypt trees were present within a 700 m radius from the study area, a distance which would be considered sufficient to ensure isolation by distance [60,61]. However, the pedigree reconstruction of the seedling cohort showed the crossings involved a moderate rate of foreign pollen, with 22% of the offspring being sired from pollen outside the stand. This puts the hypothetical distance of pollen dispersal at least at 700 m, a figure in the upper limit of reported distances of pollen dispersal in eucalypts (e.g., [26,45,61,62]), although record distances between 1.6–1.9 km have been registered [63,64].
Eucalypts, and E. globulus in particular, have a mixed mating system although outcrossing is favored. The rate at which selfing can occur, however, is dependent on genotypes and environmental conditions [65]. A number of post-zygotic barriers to selfing has been reported, including strong inbreeding depression causing reduced seed set, poorer germination and growth, and higher mortality [65,66]. Under panmictic conditions, the eight adult parent trees would be expected to have an arithmetic panmictic estimation for the selfed progeny of 32%. Our results found a much lower selfing rate of 12%, with only 7 out of 60 seedlings being the result of self-pollination. Furthermore, selfed offspring were from only three of the eight contributing parent trees. In nature, reported selfing rates ranged between 5 to over 40% [67,68,69], with most estimates being derived from seeds, not recruited seedlings. This could explain why the selfing rate found in our study was lower, as early mortality is known to be higher in selfed progeny [66,70]. In other words, the lower-than-expected selfing rates observed in our study may indicate a strong selection against selfing during early stages of plant regeneration, a condition which would certainly have been exacerbated by the very high densities observed.
Limitations in pollen and seed dispersal from outside the stand and the likelihood of similar or close-by genotypes to mate with each other, typical of an isolated population, are expected to lead to a rapid build-up of inbreeding [71,72], as well as a loss of genetic variation [73]. These effects would also be expected to amplify the genetic differentiation between the base parent and progeny populations (viz the FST statistic) [74]. However, with only one generation between them, we found a lack of genetic differentiation between the adults and juvenile cohort, as given by the close to zero FST value. The high levels of heterozygosity in the base population and the low selfing rate, estimated at 12%, seem to also have been key contributing factors to this lack of genetic differentiation between the two cohorts. Pollen influx, which accounted for 22% of the seedlings sampled, significantly reduced the loss of genetic diversity, and may be why inbreeding has remained low in the post-fire seedling population. It is known that even low levels of gene flow are sufficient to counteract opposing mutation, drift, and selection [72]. However, despite the balancing effects of outside gene-flow, the seedling cohort at Mata Nacional do Urso is a much less diverse population than its parental counterpart. The co-ancestry amongst seedlings more than doubled (from θ = 0.03 to 0.076), getting closer to a half sibling relationship. The status effective number, statistic derived from the group co-ancestry, provides a useful quantitative measure of the current state of genetic diversity in the population, and extends information given by inbreeding and co-ancestry coefficients (viz [47]). In the case of Mata Nacional do Urso, the population status number dropped to a third of what it was for the adult population (from Ns = 16.2 to 6.6). This was exacerbated by the strongly unbalanced representation of some parents in the progeny, as larger individuals contributed the most to the post-fire progeny, with the three largest adult trees in the stand being responsible for nearly 60% of the seedlings.

5. Conclusions

The present work is, to our knowledge, the first genetic-based study on the naturalization process of E. globulus, allowing for a better understanding and forecasting on how populations may evolve in the introduced range. Although eucalypts are generally viewed as less invasive than several other tree species, E. globulus shows abundant natural regeneration, and fire may trigger high densities of E. globulus seedling regeneration, spread by dominant winds. Mata Nacional do Urso is a fairly isolated stand that last suffered from wildfires in 2017. The results show that, despite the small number of adult trees, there was an abundant regeneration success. They also show that the contribution of adult trees was unbalanced, and positively influenced by tree DBH. The post-fire regeneration, one year after the event, had one of the highest densities of naturally established eucalypts ever recorded, with a recruitment that appears to have occurred over several months or years, most likely by gradual seed shed after the fire. The adult cohort of the stand showed a genetic basis similar to that of the so-called Portuguese landrace; however, genetic indices were significantly altered in the seedling population, compared with the parent adult cohort. A standard reduction in allelic diversity and heterozygosity was observed, consistent with the expected recent reduction of their effective population size, as gene flow from the adult to the seedling populations was strongly unbalanced. A pollen dispersal distance of at least 700 m was registered, and this pollen influx significantly reduced the loss of genetic diversity, and helped to keep inbreeding levels somewhat low in the post-fire seedling population. Nevertheless, despite these balancing effects of gene-flow from the outside, the seedling cohort at Mata Nacional do Urso is a much less diverse population than its parental counterpart. Losses of genetic diversity are predicted to negatively impact their fitness/performance. However, the high seedling densities registered in our study may be sufficient to assure the continuity of the established seedlings. These findings call for the need of active post-fire management in areas with large eucalypt trees, particularly those maintained with conservation purposes, such as the case of Mata Nacional do Urso.

Supplementary Materials

The following are available online at https://www.mdpi.com/article/10.3390/f13050680/s1, Table S1: Information of the eleven SSR used and respective reference.

Author Contributions

Conceptualization. J.S.S. and E.D.; methodology. J.C, S.P., J.F.P. and N.B.; formal analysis. J.C., E.D. and S.P.; investigation. J.C., E.D. and S.P.; resources. J.S.S. and N.B.; data curation. J.C. and E.D.; writing—original draft preparation. J.C., E.D. and S.P.; writing—review and editing. J.C., J.S.S., N.B., E.D., S.P. and J.F.P.; supervision. J.C., J.S.S. and N.B.; project administration. J.S.S. and N.B.; funding acquisition. J.S.S. All authors have read and agreed to the published version of the manuscript.

Funding

This research was funded by the Portuguese Foundation for Science and Technology (FCT), through project Wildgum II, grant number PTDC/ASP-SIL/30435/2017. Simão Pinho was supported by PhD grant nr. 2020.09605.BD, awarded by the Foundation for Science and Technology.

Data Availability Statement

Not applicable.

Acknowledgments

The authors are grateful to Fátima Cunha for helping in the preparation of DNA samples, Daniel Martins for assistance in scoring the samples, and to José Gaspar for the drone flight. The authors are also grateful to the Portuguese Institute for Sea and Atmosphere (IPMA, I.P.) for providing wind data.

Conflicts of Interest

The authors declare no conflict of interest.

References

  1. Jordan, G.; Borralho, N.; Tilyard, P.; Potts, B. Identification of races in Eucalyptus globulus spp globulus based on growth traits in Tasmania and geographic distribution. Silvae Genet. 1994, 43, 292–298. [Google Scholar]
  2. Potts, B.M.; Vaillancourt, R.E.; Jordan, G.; Dutkowski, G.; Costa, J.; Mckinnon, G.; Steane, D.; Volker, P.; Lopez, G.; Apiolaza, L.; et al. Exploration of the Eucalyptus Globulus Gene Pool. In Proceedings of the Eucalyptus in a Changing World Proc. of IUFRO Conference, Aveiro, Portugal, 11–15 October 2004; pp. 11–15. [Google Scholar]
  3. Alves, A.M.; Pereira, J.S.; Silva, J.M.N. Introdução e expansão do eucalipto em Portugal. Pinhais E Eucaliptais—A Floresta Cultiv. Colecção Árvores E Florestas Port. 2007, 4, 151–165. [Google Scholar]
  4. Potts, B.M.; McGowen, M.H.; Williams, D.R.; Suitor, S.; Jones, T.H.; Gore, P.L.; Vaillancourt, R.E. Advances in reproductive biology and seed production systems of Eucalyptus: The case of Eucalyptus globulus. South. For. 2008, 70, 145–154. [Google Scholar] [CrossRef]
  5. ICNF. 6.0 Inventário Florestal Nacional—Resultados Portugal—NUTS I [Portuguese National Forest Inventory]; Instituto da Conservação da Natureza e das Florestas: Lisbon, Portugal, 2019. [Google Scholar]
  6. Silva, J.S.; Nereu, M.; Pinho, S.; Queirós, L.; Jesús, C.; Deus, E. Post-fire demography, growth, and control of eucalyptus globulus wildlings. Forests 2021, 12, 156. [Google Scholar] [CrossRef]
  7. Anjos, A.; Fernandes, P.; Marques, C.; Borralho, N.; Valente, C.; Correia, O.; Máguas, C.; Chozas, S. Management and fire, a critical combination for Eucalyptus globulus dispersal. For. Ecol. Manag. 2021, 490, 91–102. [Google Scholar] [CrossRef]
  8. Fernandes, P.; Antunes, C.; Pinho, P.; Máguas, C.; Correia, O. Natural regeneration of Pinus pinaster and Eucalyptus globulus from plantation into adjacent natural habitats. For. Ecol. Manag. 2016, 378, 91–102. [Google Scholar] [CrossRef]
  9. Rejmánek, M.; Richardson, D. Eucalypts. In Encyclopedia of Biological Invasions; Simberloff, D.R.M., Rejmánek, M., Richardson, D., Eds.; University of California Press: Los Angeles, CA, USA, 2011; pp. 203–209. [Google Scholar]
  10. Catry, F.X.; Moreira, F.; Deus, E.; Silva, J.S.; Águas, A. Assessing the Extent and the Environmental Drivers of Eucalyptus Globulus Wildling Establishment in Portugal: Results from a Countrywide Survey. Biol. Invasions 2015, 17, 3163–3181. [Google Scholar] [CrossRef]
  11. Calviño-Cancela, M.; Rubido-Bará, M. Invasive potential of Eucalyptus globulus: Seed dispersal, seedling recruitment and survival in habitats surrounding plantations. For. Ecol. Manag. 2013, 305, 129–137. [Google Scholar] [CrossRef]
  12. dos Santos, P.; Matias, H.; Deus, E.; Águas, A.; Silva, J.S. Fire effects on capsules and encapsulated seeds from Eucalyptus globulus in Portugal. Plant Ecol. 2015, 216, 1611–1621. [Google Scholar] [CrossRef]
  13. Águas, A.; Ferreira, A.; Maia, P.; Fernandes, P.M.; Roxo, L.; Keizer, J.; Silva, J.S.; Rego, F.C.; Moreira, F. Natural establishment of Eucalyptus globulus Labill. in burnt stands in Portugal. For. Ecol. Manag. 2014, 323, 47–56. [Google Scholar] [CrossRef] [Green Version]
  14. Calviño-Cancela, M.; Lorenzo, P.; González, L. Fire increases Eucalyptus globulus seedling recruitment in forested habitats: Effects of litter, shade and burnt soil on seedling emergence and survival. For. Ecol. Manag. 2018, 409, 826–834. [Google Scholar] [CrossRef]
  15. Silva, J.S.; Dos Santos, P.; Sério, A.; Gomes, F. Effects of heat on dehiscence and germination in Eucalyptus globulus Labill. Int. J. Wildl. Fire 2016, 25, 478–483. [Google Scholar] [CrossRef]
  16. Fernandes, P.; Máguas, C.; Correia, O. Combined effects of climate, habitat, and disturbance on seedling establishment of Pinus pinaster and Eucalyptus globulus. Plant Ecol. 2017, 218, 501–515. [Google Scholar] [CrossRef]
  17. Selkoe, K.A.; Toonen, R.J. Microsatellites for ecologists: A practical guide to using and evaluating microsatellite markers. Ecol. Lett. 2006, 9, 615–629. [Google Scholar] [CrossRef] [PubMed]
  18. Pairon, M.; Jonard, M.; Jacquemart, A.L. Modeling seed dispersal of black cherry, an invasive forest tree: How microsatellites may help? Can. J. For. Res. 2006, 36, 1385–1394. [Google Scholar] [CrossRef]
  19. Dodet, M.; Petit, R.J.; Gasquez, J. Local spread of the invasive Cyperus esculentus (Cyperaceae) inferred using molecular genetic markers. Weed Res. 2008, 48, 19–27. [Google Scholar] [CrossRef]
  20. Jones, T.H.; Vaillancourt, R.E.; Potts, B.M. Detection and visualization of spatial genetic structure in continuous Eucalyptus globulus forest. Mol. Ecol. 2007, 16, 697–707. [Google Scholar] [CrossRef]
  21. Freeman, J.S.; Marques, C.M.P.; Carocha, V.; Borralho, N.; Potts, B.M.; Vaillancourt, R.E. Origins and diversity of the Portuguese Landrace of Eucalyptus globulus. Ann. For. Sci. 2007, 64, 639–647. [Google Scholar] [CrossRef] [Green Version]
  22. Ribeiro, M.M.; Sanchez, L.; Ribeiro, C.; Cunha, F.; Araújo, J.; Borralho, N.M.G.; Marques, C. A case study of Eucalyptus globulus fingerprinting for breeding. Ann. For. Sci. 2011, 68, 701–744. [Google Scholar] [CrossRef] [Green Version]
  23. Costa, J.; Vaillancourt, R.E.; Steane, D.A.; Jones, R.C.; Marques, C. Microsatellite analysis of population structure in Eucalyptus globulus. Genome 2017, 60, 770–777. [Google Scholar] [CrossRef] [Green Version]
  24. Jones, R.C.; Steane, D.A.; Potts, B.M.; Vaillancourt, R.E. Microsatellite and morphological analysis of Eucalyptus globulus populations. Can. J. For. Res. 2002, 32, 59–66. [Google Scholar] [CrossRef] [Green Version]
  25. Steane, D.A.; Conod, N.; Jones, R.C.; Vaillancourt, R.E.; Potts, B.M. A comparative analysis of population structure of a forest tree, Eucalyptus globulus (Myrtaceae), using microsatellite markers and quantitative traits. Tree Genet. Genomes 2006, 2, 30–38. [Google Scholar] [CrossRef]
  26. Jones, M.E.; Shepherd, M.; Henry, R.; Delves, A. Pollen flow in Eucalyptus grandis determined by paternity analysis using microsatellite markers. Tree Genet. Genomes 2008, 4, 37–47. [Google Scholar] [CrossRef]
  27. Rei, M.A. Ensecamento do Pantano do Juncal Gordo e Causas Que o Determinaram; Typ. La Bécarre de Francisco J. Carneiro: Lisboa, Portugal, 1914. [Google Scholar]
  28. Doyle, J.; Doyle, J. A rapid DNA isolation for small quantities of fresh leaf tissue. Phytochem. Bull. 1987, 19, 11–15. [Google Scholar]
  29. Steane, D.A.; Vaillancourt, R.E.; Russell, J.; Powell, W.; Marshall, D.; Potts, B.M. Development and characterisation of microsatellite loci in Eucalyptus globulus (Myrtaceae). Silvae Genet. 2001, 50, 89–91. [Google Scholar]
  30. Brondani, R.P.V.; Brondani, C.; Tarchini, R.; Grattapaglia, D. Development, characterization and mapping of microsatellite markers in Eucalyptus grandis and E. urophylla. Theor. Appl. Genet. 1998, 97, 816–827. [Google Scholar] [CrossRef]
  31. Brondani, R.; Brondani, C.; Grattapaglia, D. Towards a genus-wide reference linkage map for Eucalyptus based exclusively on highly informative microsatellite markers. Mol. Genet. Genom. 2002, 267, 338–347. [Google Scholar] [CrossRef]
  32. Byrne, M.; Marquez-Garcia, M.I.; Uren, T.; Smith, D.S.; Moran, G.F. Conservation and genetic diversity of microsatellite loci in the genus Eucalyptus. Aust. J. Bot. 1996, 44, 331–341. [Google Scholar] [CrossRef]
  33. Peakall, R.; Smouse, P.E. GENALEX 6: Genetic analysis in Excel. Population genetic software for teaching and research. Mol. Ecol. Notes 2006, 6, 288–295. [Google Scholar] [CrossRef]
  34. Peakall, R.; Smouse, P.E. GenALEx 6.5: Genetic analysis in Excel. Population genetic software for teaching and research-an update. Bioinformatics 2012, 28, 2537–2539. [Google Scholar] [CrossRef] [Green Version]
  35. Goudet, J. FSTAT (Version 1.2): A Computer Program to Calculate F-statistics. J. Hered. 1995, 8, 485–486. [Google Scholar] [CrossRef]
  36. Goudet, J. FSTAT, a Program to Estimate and Test Gene Diversities and Fixation Indices (Vers. 2.9.3). 2001, Volume 149. Available online: www.Unil.Ch/Izea/Sofwares/Fstat.Html (accessed on 17 March 2022).
  37. Rousset F Genepop’007: A complete reimplementation of the Genepop software for Windows and Linux. Mol. Ecol. Resour. 2008, 8, 103–106. [CrossRef] [PubMed]
  38. Van Oosterhout, C.; Weetman, D.; Hutchinson, W.F. Estimation and adjustment of microsatellite null alleles in nonequilibrium populations. Mol. Ecol. Notes 2006, 6, 155–156. [Google Scholar] [CrossRef]
  39. Weir, B.S.; Cockerham, C.C. Estimating F-statistics for the analysis of population structure. Evolution 1984, 38, 1358–1370. [Google Scholar] [CrossRef] [PubMed]
  40. Excoffier, L.; Lischer, H.E.L. Arlequin suite ver 3.5: A new series of programs to perform population genetics analyses under Linux and Windows. Mol. Ecol. Resour. 2010, 10, 564–567. [Google Scholar] [CrossRef] [PubMed]
  41. Kalinowski, S.T.; Taper, M.L.; Marshall, T.C. Revising how the computer program CERVUS accommodates genotyping error increases success in paternity assignment. Mol. Ecol. 2007, 16, 1099–1106. [Google Scholar] [CrossRef]
  42. Marshall, T.C.; Slate, J.; Kruuk, L.E.B.; Pemberton, J.M. Statistical confidence for likelihood-based paternity inference in natural populations. Mol. Ecol. 1998, 7, 639–655. [Google Scholar] [CrossRef] [Green Version]
  43. Dow, B.D.; Ashley, M.V. Microsatellite analysis of seed dispersal and parentage of saplings in bur oak, Quercus macrocarpa. Mol. Ecol. 1996, 5, 615–627. [Google Scholar] [CrossRef]
  44. Bacles, C.F.E.; Lowe, A.J.; Ennos, R.A. Effective seed dispersal across a fragmented landscape. Science 2006, 311, 628. [Google Scholar] [CrossRef] [Green Version]
  45. Silva, P.H.M.D.; Sebbenn, A.M.; Grattapaglia, D.; Conti, J.L.F. Realized pollen flow and wildling establishment from a genetically modified eucalypt field trial in Southeastern Brazil. For. Ecol. Manag. 2017, 385, 161–166. [Google Scholar] [CrossRef] [Green Version]
  46. Cockerham, C.C. Group inbreeding and coancestry. Genetics 1967, 56, 89–104. [Google Scholar] [CrossRef] [PubMed]
  47. Lindgren, D.; Gea, L.; Jefferson, P. Status number for measuring genetic diversity. For. Genet. 1997, 4, 69–76. [Google Scholar]
  48. Cremer, K.W. Distance of seed dispersal in Eucalypts estimated from seed weights. Aust. For. Res. 1977, 7, 225–228. [Google Scholar]
  49. Cremer, K.W. How eucalypt fruits release their seed. Aust. J. Bot. 1965, 13, 11–16. [Google Scholar] [CrossRef]
  50. R Core Team. R: A Language and Environment for Statistical Computing; R Foundation for Statistical Computing: Vienna, Austria, 2021; Available online: https://www.R-project.org/ (accessed on 31 December 2021).
  51. Sumathi, M.; Yasodha, R. Microsatellite resources of eucalyptus: Current status and future perspectives. Bot. Stud. 2014, 55, 136–140. [Google Scholar] [CrossRef] [PubMed] [Green Version]
  52. Jones, T.H.; Steane, D.A.; Jones, R.C.; Pilbeam, D.; Vaillancourt, R.E.; Potts, B.M. Effects of domestication on genetic diversity in Eucalyptus globulus. For. Ecol. Manag. 2006, 234, 78–84. [Google Scholar] [CrossRef]
  53. Mimura, M.; Barbour, R.C.; Potts, B.M.; Vaillancourt, R.E.; Watanabe, K.N. Comparison of contemporary mating patterns in continuous and fragmented Eucalyptus globulus native forests. Mol. Ecol. 2009, 18, 4180–4192. [Google Scholar] [CrossRef]
  54. Foster, S.A.; McKinnon, G.E.; Steane, D.A.; Potts, B.M.; Vaillancourt, R.E. Parallel evolution of dwarf ecotypes in the forest tree Eucalyptus globulus. New Phytol. 2007, 175, 370–380. [Google Scholar] [CrossRef] [Green Version]
  55. Amaro, A.; Reed, D.; Tomé, M.; Themido, I. Modeling dominant height growth: Eucalyptus plantations in Portugal. For. Sci. 1998, 44, 37–46. [Google Scholar]
  56. Booth, T.H. Going nowhere fast: A review of seed dispersal in eucalypts. Aust. J. Bot. 2017, 65, 401–410. [Google Scholar] [CrossRef] [Green Version]
  57. Deus, E.; Silva, J.S.; Larcombe, M.J.; Catry, F.X.; Queirós, L.; dos Santos, P.; Matias, H.; Águas, A.; Rego, F.C. Investigating the invasiveness of Eucalyptus globulus in Portugal: Site-scale drivers, reproductive capacity and dispersal potential. Biol. Invasions 2019, 21, 2027–2044. [Google Scholar] [CrossRef]
  58. Hingston, A.; Potts, B. Floral visitors of Eucalyptus globulus subsp. globulus in eastern Tasmania. Tasforests 1998, 10, 125–139. [Google Scholar]
  59. Hingston, A.B.; Potts, B.M.; McQuillan, P.B. The swift parrot, Lathamus discolor (Psittacidae), social bees (Apidae) and native insects as pollinators of Eucalyptus globulus ssp. globulus (Myrtaceae). Aust. J. Bot. 2004, 52, 371–379. [Google Scholar] [CrossRef]
  60. Lopez, G.A.; Potts, B.M.; Vaillancourt, R.E.; Apiolaza, L.A. Maternal and carryover effects on early growth of Eucalyptus globulus. Can. J. For. Res. 2003, 33, 2108–2115. [Google Scholar] [CrossRef] [Green Version]
  61. da Silva, P.H.M.; Sebbenn, A.M.; Grattapaglia, D. Pollen-mediated gene flow across fragmented clonal stands of hybrid eucalypts in an exotic environment. For. Ecol. Manag. 2015, 356, 293–298. [Google Scholar] [CrossRef] [Green Version]
  62. Byrne, M.; Elliott, C.P.; Yates, C.J.; Coates, D.J. Maintenance of high pollen dispersal in Eucalyptus wandoo, a dominant tree of the fragmented agricultural region in Western Australia. Conserv. Genet. 2008, 9, 97–105. [Google Scholar] [CrossRef]
  63. Barbour, R.C.; Potts, B.M.; Vaillancourt, R.E. Pollen dispersal from exotic eucalypt plantations. Conserv. Genet. 2005, 6, 253–257. [Google Scholar] [CrossRef]
  64. Sampson, J.F.; Byrne, M. Outcrossing between an agroforestry plantation and remnant native populations of Eucalyptus loxophleba. Mol. Ecol. 2008, 17, 2769–2781. [Google Scholar] [CrossRef]
  65. McGowen, M.H.; Vaillancourt, R.E.; Pilbeam, D.J.; Potts, B.M. Sources of variation in self-incompatibility in the Australian forest tree, Eucalyptus globulus. Ann. Bot. 2010, 105, 737–745. [Google Scholar] [CrossRef] [Green Version]
  66. HARDNER, C.; POTTS, B. Inbreeding depression and changes in variation after selfing in Eucalyptus globulus ssp. globulus. Silvae Genet. 1995, 44, 46–54. [Google Scholar]
  67. Moncur, M.W.; Mitchell, A.; Fripp, Y.; Kleinschmidt, G.J. The role of honey bees (Apis mellifera) in eucalypt and acacia seed production areas. Commonw. For. Rev. 1995, 74, 350–354. [Google Scholar]
  68. Patterson, B.; Vaillancourt, R.E.; Pilbeam, D.J.; Potts, B.M. Factors affecting variation in outcrossing rate in Eucalyptus globulus. Aust. J. Bot. 2004, 52, 773–780. [Google Scholar] [CrossRef]
  69. Russell, J.; Marshall, D.; Griffin, D.; Harbard, J.; Powell, W. Gene flow in South American Eucalyptus grandis and E. globulus seed orchards. In Proceedings of the IUFRO International Symposium: Developing the Eucalypt of the Future; Valdivia, Chile, 10–15 September 2001, pp. 149–150.
  70. Nickolas, H.; Harrison, P.A.; Tilyard, P.; Vaillancourt, R.E.; Potts, B.M. Inbreeding depression and differential maladaptation shape the fitness trajectory of two co-occurring Eucalyptus species. Ann. For. Sci. 2019, 76, 10. [Google Scholar] [CrossRef] [Green Version]
  71. Seidler, T.G.; Plotkin, J.B. Seed dispersal and spatial pattern in tropical trees. PLoS Biol. 2006, 4, e344. [Google Scholar] [CrossRef]
  72. Ellstrand, N.C. Is gene flow the most important evolutionary force in plants? Am. J. Bot. 2014, 101, 737–753. [Google Scholar] [CrossRef] [PubMed]
  73. Loveless, M.D.; Hamrick, J.L. Ecological determinants of genetic structure in plant populations. Annu. Rev. Ecol. Syst. 1984, 15, 65–95. [Google Scholar] [CrossRef]
  74. Duminil, J.; Hardy, O.J.; Petit, R.J. Plant traits correlated with generation time directly affect inbreeding depression and mating system and indirectly genetic structure. BMC Evol. Biol. 2009, 9, 177. [Google Scholar] [CrossRef]
Figure 1. Location of sampled eucalypts (n = 78) in the study area according to eucalypt groups (a), relative to surrounding eucalypt stands (b), in central Portugal (c). Eucalypt groups include: “north”—pre-fire eucalypts established north of the road; “south”—post-fire eucalypts established south of the road; roadside—large pre-fire eucalypts established on the roadside. Geographical information (orthophoto 2018) in (a) provided by Direção-Geral do Território.
Forests 13 00680 g001
Figure 2. Spatial interpolation of seedling densities across the post-fire expansion area, based on 12 sampling plots. Dummy points were created on peripheral seedlings in the outer limits of the expansion area, and assigned a density of 1000 plants ha−1.
Forests 13 00680 g002
Figure 3. Distribution of sampled eucalypts featuring results from paternity assignment. When two parents were assigned, the closest parent was assumed to be the seed parent, and the farthest was assumed to be the pollen parent.
Forests 13 00680 g003
Table 1. Size and reproductive status of the three cohort groups sampled. Statistics include mean ± standard error (minimum–maximum) for diameter at breast height (DBH, in cm) and height (in meters). The proportion of trees with resprouts and with reproductive organs (flowers and capsules) is also listed. In the post-fire group, mean DBH does not include 37 seedlings smaller than 1.30 m.
CohortCount (n)DBH
(cm)
Height
(m)
Resprout (%)Reproductive (%)
Pre-fireRoadside (adult)1044.2 (4.6)
(14.0–60.0)
25.9 (0.9)
(16.8–32.2)
0.0100
North (adult)817.4 (4.0)
(8–40)
7.4 (2.8)
(5–12)
10012.5
Post-fireSouth (seedlings)601.6 (0.1)
(0.5–4.0)
1.4 (0.1)
(0.2–4.0)
0.00.0
Total7814.5 ± 19.4
(0.5–60.0)
5.0 ± 8.4
(0.2–32.2)
1013.8
Table 2. Estimates of population size and genetic diversity measures for adult (pre-fire) individuals (n = 18) and post-fire young seedlings (n = 60) from Mata Nacional do Urso based on 11 microsatellite markers. Diversity indices include the number of alleles (A); the effective number of alleles (Ae); the observed and expected heterozygosity (Ho and He, respectively) and the fixation index (FIS); SE: Standard error. t-test probability levels for HWE are * p < 0.05. ** p < 0.01. *** p < 0.001.
LocusAAeHoHeFis
Adult cohort (n = 18)
Embra1186.1130.8890.836−0.034
Embra23108.6400.9440.884−0.040
Embra37106.2310.8890.840−0.030
Embra41127.4480.9440.866−0.063
Embra11996.1130.7780.8360.098
Embra22785.0230.7780.8010.057
Emcrc784.8360.7220.7930.118
Emcrc8117.4480.9440.866−0.063
Eg65107.6240.9440.869−0.059
En12127.7140.7780.8700.135
En1584.1010.9440.756−0.222
Mean (SE)9.636 (0.472)6.481 (0.428)0.869 (0.026)0.838 (0.012)−0.008
Post-fire seedlings cohort (n = 60)
Embra1196.4920.8000.8460.063 ***
Embra2397.8520.9500.873−0.108 *
Embra3795.3370.8170.8130.003 *
Embra41107.9380.9000.874−0.021 *
Embra11963.9000.8170.744−0.090
Embra22775.0070.7500.8000.071 **
Emcrc795.1610.9000.806−0.108 *
Emcrc8105.9950.8330.8330.008 *
Eg65105.9750.7330.8330.128 **
En12106.2380.7120.8400.0161 *
En1573.9760.8330.748−0.105 *
Mean (SE)8.727 (0.428)5.807 (0.401)0.822 (0.022)0.819 (0.013)0.004 ***
Table 3. Results from a generalized linear model produced to assess the influence of tree-related factors (DBH: diameter at breast height, cm) on the number of parentage relations assigned to each parent tree. ns: non-significant (p > 0.05).
VariableCoefficientsStd. Errort-Valuep-Value
Intercept−2.792.03−1.38ns
DBH0.100.042.850.03
Table 4. Expected pairwise co-ancestry amongst the post-fire seedling cohort, based on the reconstructed pedigree.
Classθxy# Pairs%
Unrelated098955.9
Half siblings0.12560834.4
Full siblings0.251679.4
Full siblings selfs0.560.3
Publisher’s Note: MDPI stays neutral with regard to jurisdictional claims in published maps and institutional affiliations.

