Abstract
The characteristics of vegetation in urban road side green spaces affect their noise reduction capacity. How to objectively, extensively, and accurately evaluate the noise reduction effect of these complex structures is challenging. In this study, we take urban roadside green space quadrats as the research object, use knapsack LiDAR to collect point cloud data of vegetation in the quadrats, and then construct and extract factor indices that can reflect the different vegetation characteristics based on LiDAR point cloud data with LiDAR360 software. We then combine the actual collected and calculate attenuation of traffic noise using correlation analysis and ordinary least square regression analysis to clarify the characteristic factors and correlation of noise attenuation in order to explore the influence of vegetation characteristics on the effect of noise reduction. The results show that a variety of factors affect the noise reduction effect of complex vegetation structures, and the importance degree is the following: horizontal occlusion degree > width > percentage of point cloud grid > leaf area index > coverage degree. By comparing the vegetation characteristic factors at different heights, we found that coverage degree, leaf area index, horizontal occlusion degree, and the percentage of the point cloud grid have the most significant positive correlation with the actual attenuation at a height of 5 m, but the coverage degree and leaf area index at absolute height have no correlation with the actual attenuation. The amount of vegetation near the road has a greater effect on noise reduction than that on the far side. The actual noise attenuation and the vegetation characteristic factors of green space have a non-linear relationship, and the interaction has a comprehensive influence on the noise reduction effect. These findings can provide a scientific basis for the reduction of traffic noise through the structural optimization of urban green space.
1. Introduction
Light Detection and Ranging (LiDAR) is an active remote sensing technology, and it is used to extract vegetation parameters from point cloud data by constructing a 3D model [1]. At present, there are three main data acquisition methods for LiDAR: Terrestrial Laser Scanning (TLS), Airborne Laser Scanning (ALS), and Mobile Laser Scanning (MLS). This approach is also widely used for forest ecosystem structure acquisition [2], three-dimensional monitoring and modeling [3,4], and vegetation classification [5], among other studies. This three-dimensional visualization technology also provides a new method and medium for research in the field of urban green space design and planning, such as through ground-based LiDAR to evaluate the ecological landscape benefits of road street trees [6], using vehicle mounted laser scanning to extract the position of street trees on both sides of the road, the improvement of the efficiency and accuracy of landscaping studies [7], exploring the analysis method of the “Green Viewing Ratio” of landscape space [8], the construction of three-dimensional urban vegetation models based on point cloud data [9], and for use as a shared medium to integrate landscape planning and design methods [10].
Plants in green spaces enact noise reduction through the absorption, reflection, and scattering of sound waves by leaves and branches [11], which is one of the ecosystem services that urban green spaces can provide. In cities, the reduction of traffic noise by green spaces on both sides of the road is the main way to supply this service [12], and the vegetation community in the green space will show differences related to tree species and structure [13]. Many studies have shown that the effect of noise reduction is closely related to the biophysical characteristics of green space and internal plant communities. Zhang et al. [14] selected two Populus tomentosa greenbelts suitable for noise experiments, measured and extracted their average tree height, average height under branch, average breast diameter, length, and width, and obtained a noise-reduction prediction model, which provided a reference method for noise reduction research on a single plant species. Fang et al. [15,16] constructed a regression equation linking noise reduction with visibility, width, height, and length of tree belts for different plantations of a single species. The study concluded that visibility and width were the two factors that contributed the most to noise reduction. Samaneh et al. [17] selected species of mainly mixed forests with uniform density, canopy, leaf structure, and height, and then they obtained the influence contribution of different vegetation characteristics on noise reduction through correlation analysis. Wang et al. [18] and Sun et al. [19] selected the mixed forests of highway greenbelts as the research object. They then extracted the vegetation characteristic indices of those forest belts within the sampling area by testing each plant. Next, they obtained the important factors affecting noise reduction by combining them with analysis of noise monitoring. This provided a reference for the optimization of highway greenbelts. Li et al. [20] and Zhang et al. [21] selected a variety of plant communities in urban parks, and then they quantified the internal structure and vegetation characteristic indices of each community, focusing on the effect of plant species collocation, structure, and biophysical characteristics on noise reduction. Pal et al. [22] used the standard quadrate method to measure and extract vegetation characteristic indices of different mixed plantations. The indices included aerial height, diameter at breast height, branchless lower trunk, canopy branch cover, and vegetation density quantification through vertical light penetration and horizontal light penetration. Both vertical and horizontal light penetration were considered to assess canopy and branching coverage of the greenbelts. A regression equation related to noise reduction was then proposed by statistical analysis. Md et al. [23] selected several greenbelts with various types of vegetations on both sides of the road for noise measurement. Crown density and shelterbelt porosity of greenbelts were measured by digital photos in the sample sites and then calculated by using the digital image processing method. It concluded that the greenbelts with high canopy density and low porosity had good noise reduction effects. Lai et al. [24] and Timothy [25] also took green spaces with various types of vegetation as the study object to analyze their noise reduction effects. Through parameter assignment, the noise reduction capacity was assessed by means of 3D finite-difference time-domain (FDTD) calculations. Based on the indices of tree trunk, planting density, and arrangements, they analyzed the noise reduction effects of green spaces with different structures.
In summary, there have been many studies on the noise reduction effects of single species or several mixed forest belts, along with the roles of different plant communities in parks. Due to the simple vegetation structure, it is feasible to use manual measurements to extract vegetation characteristic indices. However, there are also certain limitations. Because the method of manually measuring and extracting vegetation relies on repeated human operations and sensory recognition, the obtained data will inevitably have human errors. For example, Fang et al. [16] determined the visibilities of three tree belts by visual experience alone. Several indices of some vegetation types could not be counted, resulting in a lack of data for those parts [22]. Additionally, Zhang et al. [21] measured the average single leaf area and applied the direct point method to estimate the total leaf mass of the community. These errors directly affect the accuracy and credibility of research results and make their comparisons difficult.
However, urban road side green space is different from shelterbelt and park plant community structure components, which cover more atypical green space, with obvious complexity and uncertainty in planting type, quantity, method, height, canopy width, density, and other aspects. In some green spaces, the internal vegetation growth is disorderly; all these factors greatly increase the difficulty of traditional manual collection of vegetation characteristics. Compared with pure forest belts, it is more difficult to use correlation factors to form effective regression models to explain the noise reduction mechanism of most greenbelt structures. Crown density and shelterbelt porosity were used in a study of noise reduction effects for this type of green space, but the method of acquisition was also subjective, and the results were qualitative [23]. Studies carried out through 3D simulation also had a certain subjectivity in the selection and use of parameters. Furthermore, the vegetation characteristics involved were not comprehensive, such as the inability to consider plant leaves [24,25].
In order to mitigate these problems and compensate for the shortcomings of the previous studies, this study adjusted the selection of indices and technical methods according to the research object and its characteristics, reflecting the different characteristics of methods and application angles (Table 1).

Table 1.
Comparison between this study and previous studies.
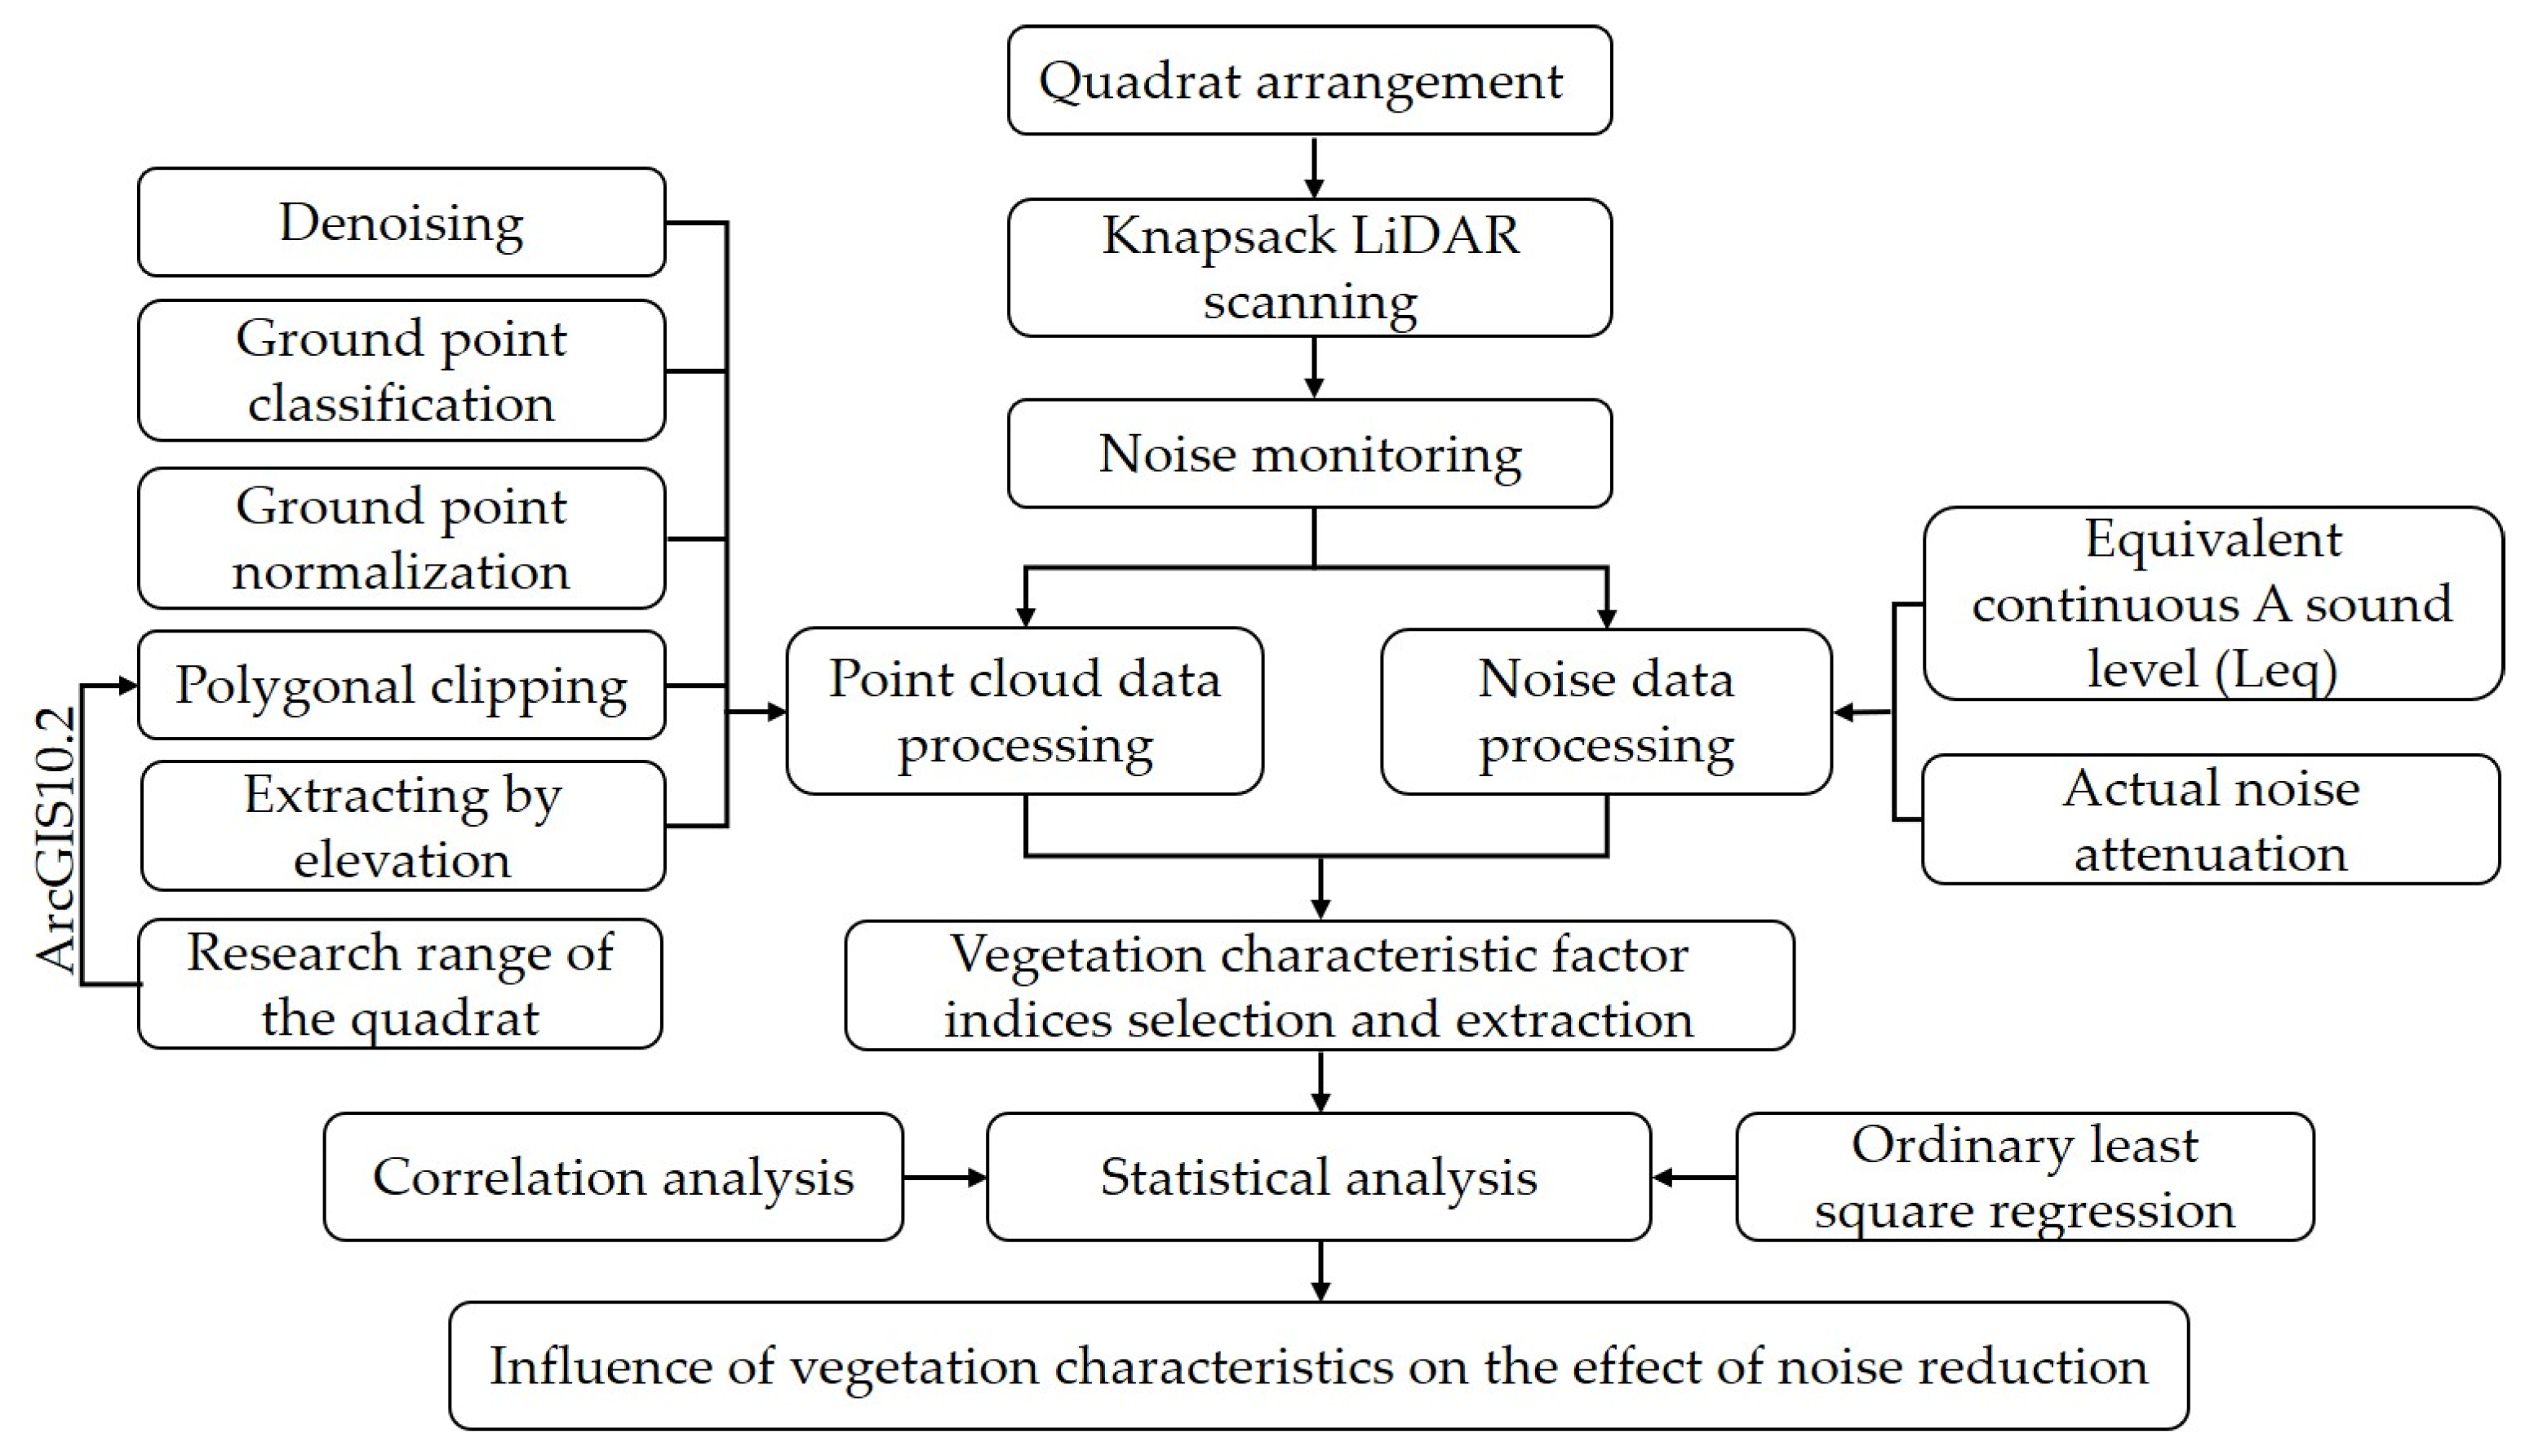
Based on the advantages of LiDAR technology in building three-dimensional vegetation models and extracting and analyzing vegetation indices, this study selected roadside green space quadrats of urban roads in Shenzhen to extract the characteristics of green space structure components and monitor traffic noise data, and it analyzed the influence of different characteristic factors of green space on noise reduction by combining them. The workflow diagram of the study is shown in Figure 1.
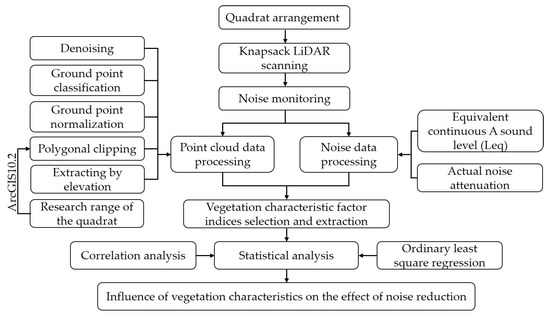
Figure 1.
Workflow diagram of the study.
It is helpful to scientifically and objectively reveal the mechanism of noise reduction of complex vegetation-structure green spaces, ascertain a universal method to evaluate the noise reduction effects, and provide a robust scientific basis for more optimal realization of the noise reduction ecosystem service in urban planning.
2. Materials and Methods
2.1. Study Area
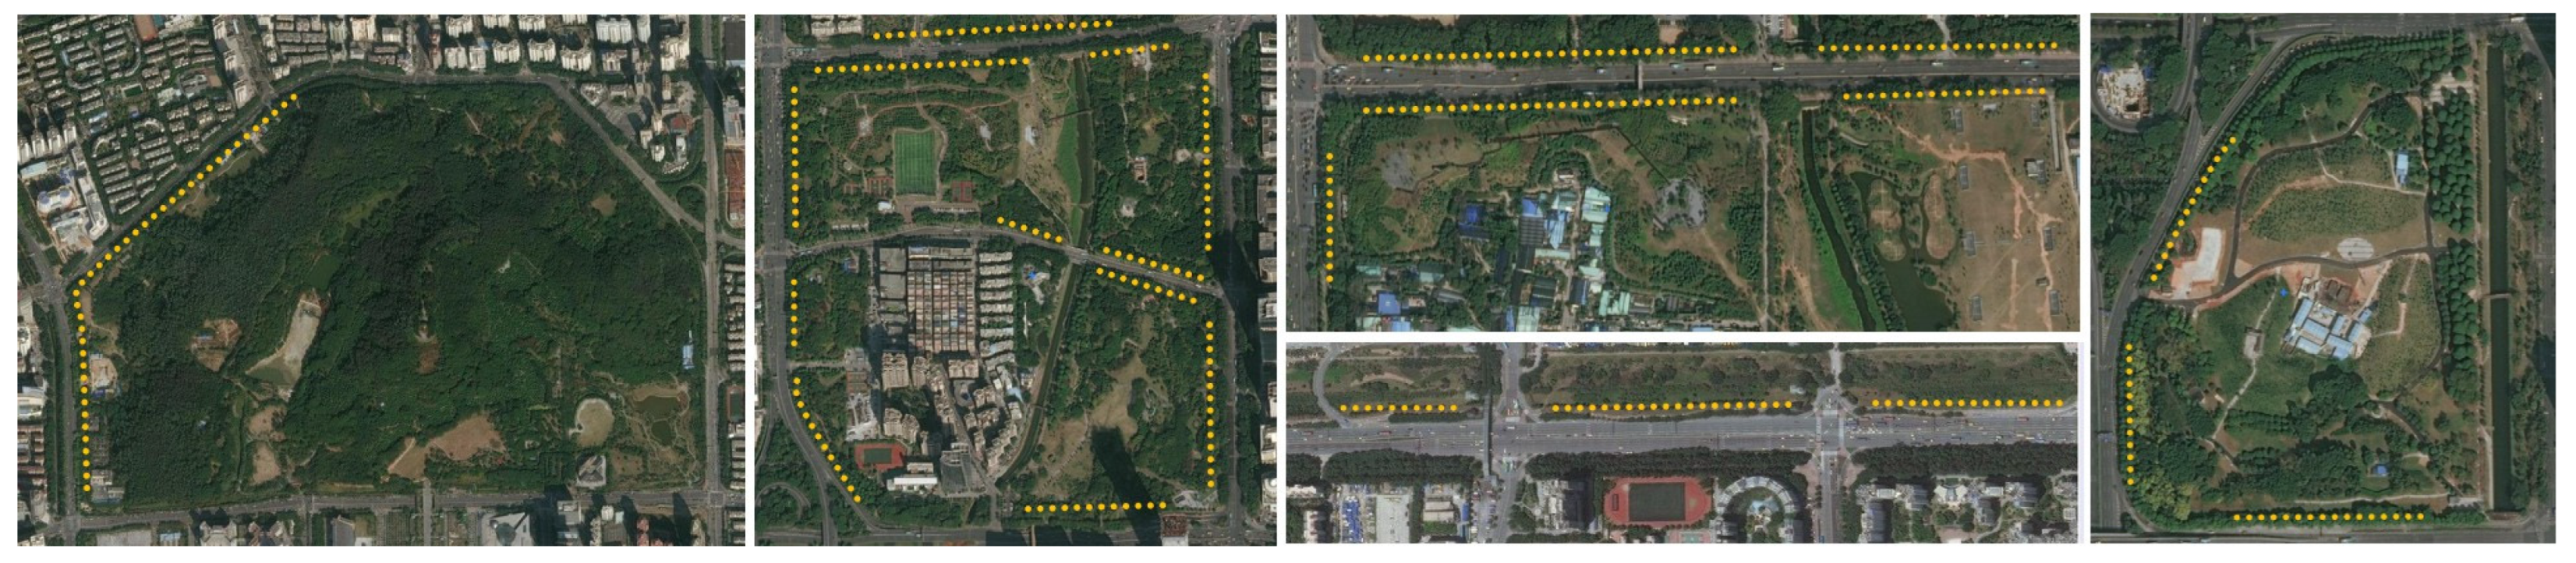
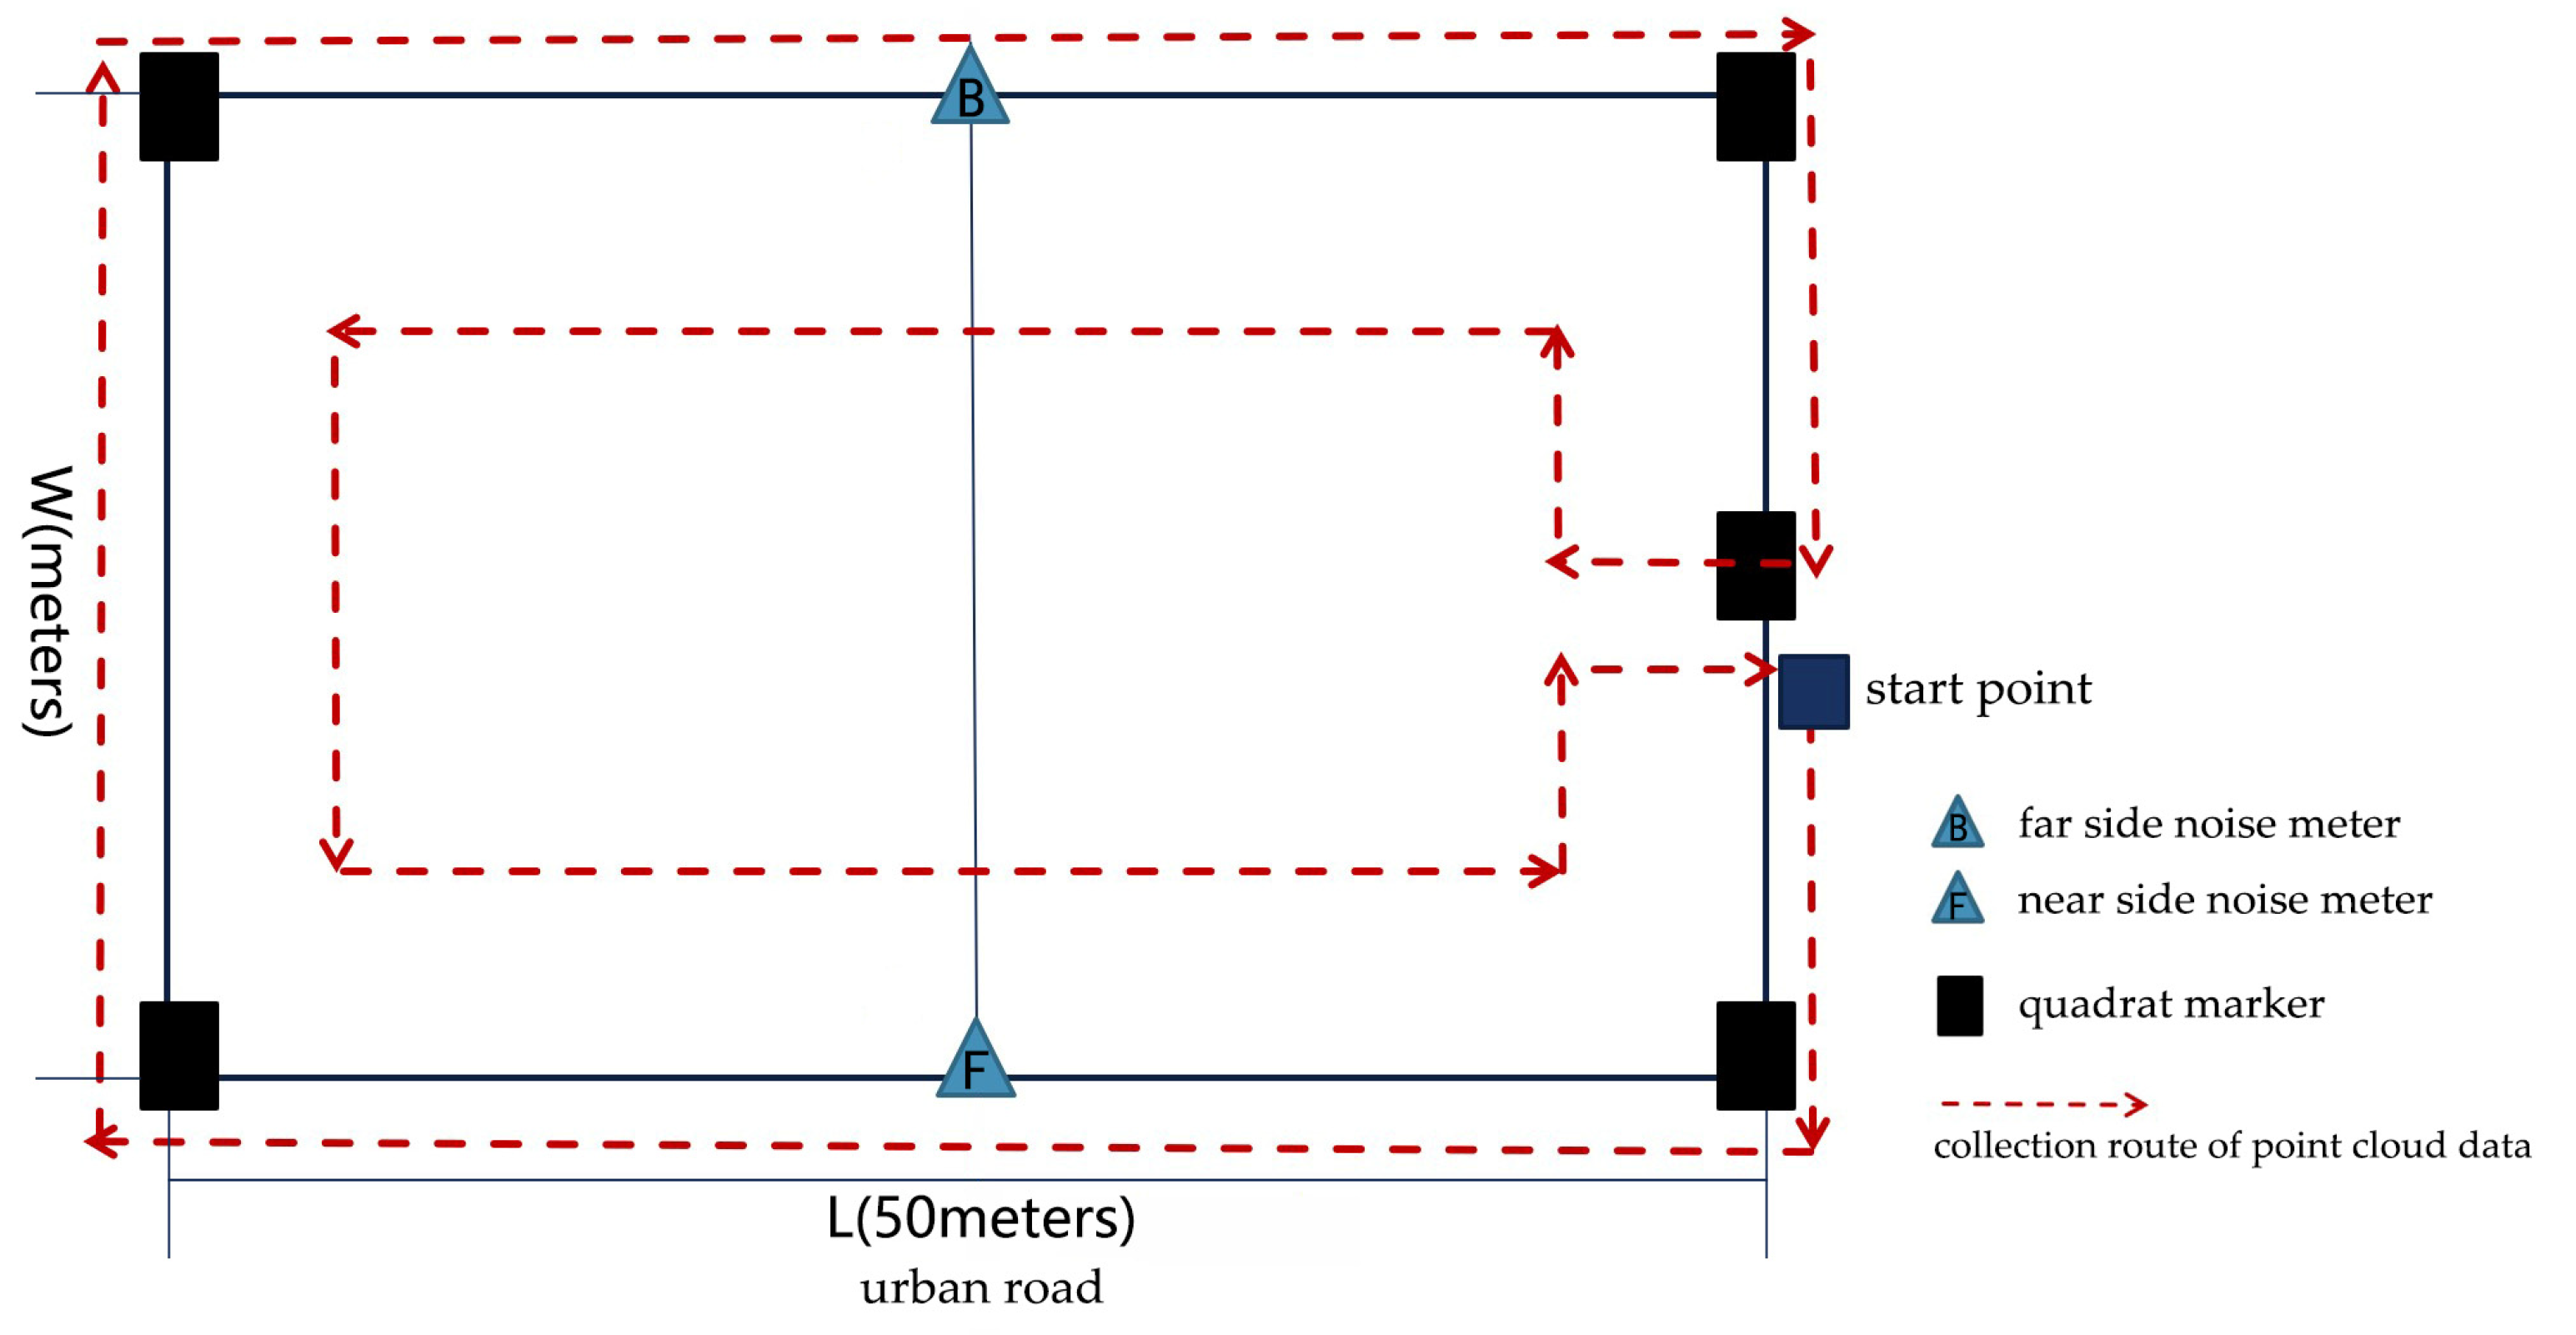
In this study, 96 quadrats were selected from the roadside green spaces along urban trunk roads in Shenzhen for field measurement (Figure 2). The areas with similar levels of trunk roads and the same distance between the front edge of green space and the road teeth were selected. Furthermore, we avoided road intersections and areas with interference on the far side of the quadrat. The topography of the measured quadrats was flat, and the vertical road direction was unequal in width (W). The distribution, quantity, and characteristics of vegetation in the quadrats were stochastic and diverse. In order to avoid the influence of noise diffraction at the end of the quadrat and direct lateral sound on the results, the length (L) of each quadrat in the parallel road direction was selected to be 50 m [16,27] to ensure the stability of the influence of length on the noise reduction effect (Figure 3).

Figure 2.
Study area.
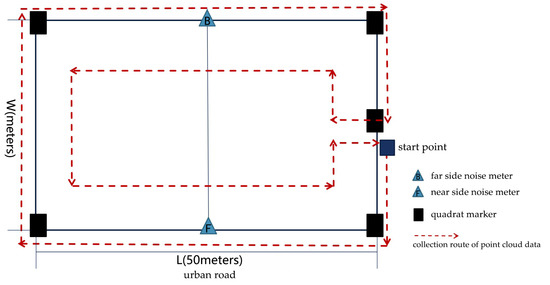
Figure 3.
Schematic diagram of quadrat measurement.
2.2. Quadrat Measurement
The measurements were carried out during July and August of 2020 under the climatic conditions of clear weather, wind speed < 2 m/s, and stable temperature and humidity conditions. The time periods selected were from 08:00–12:00 and 14:00–18:00 on weekdays. The content included quadrat point cloud data collection and noise data collection. The quadrat arrangement and collection content are shown in Figure 3.
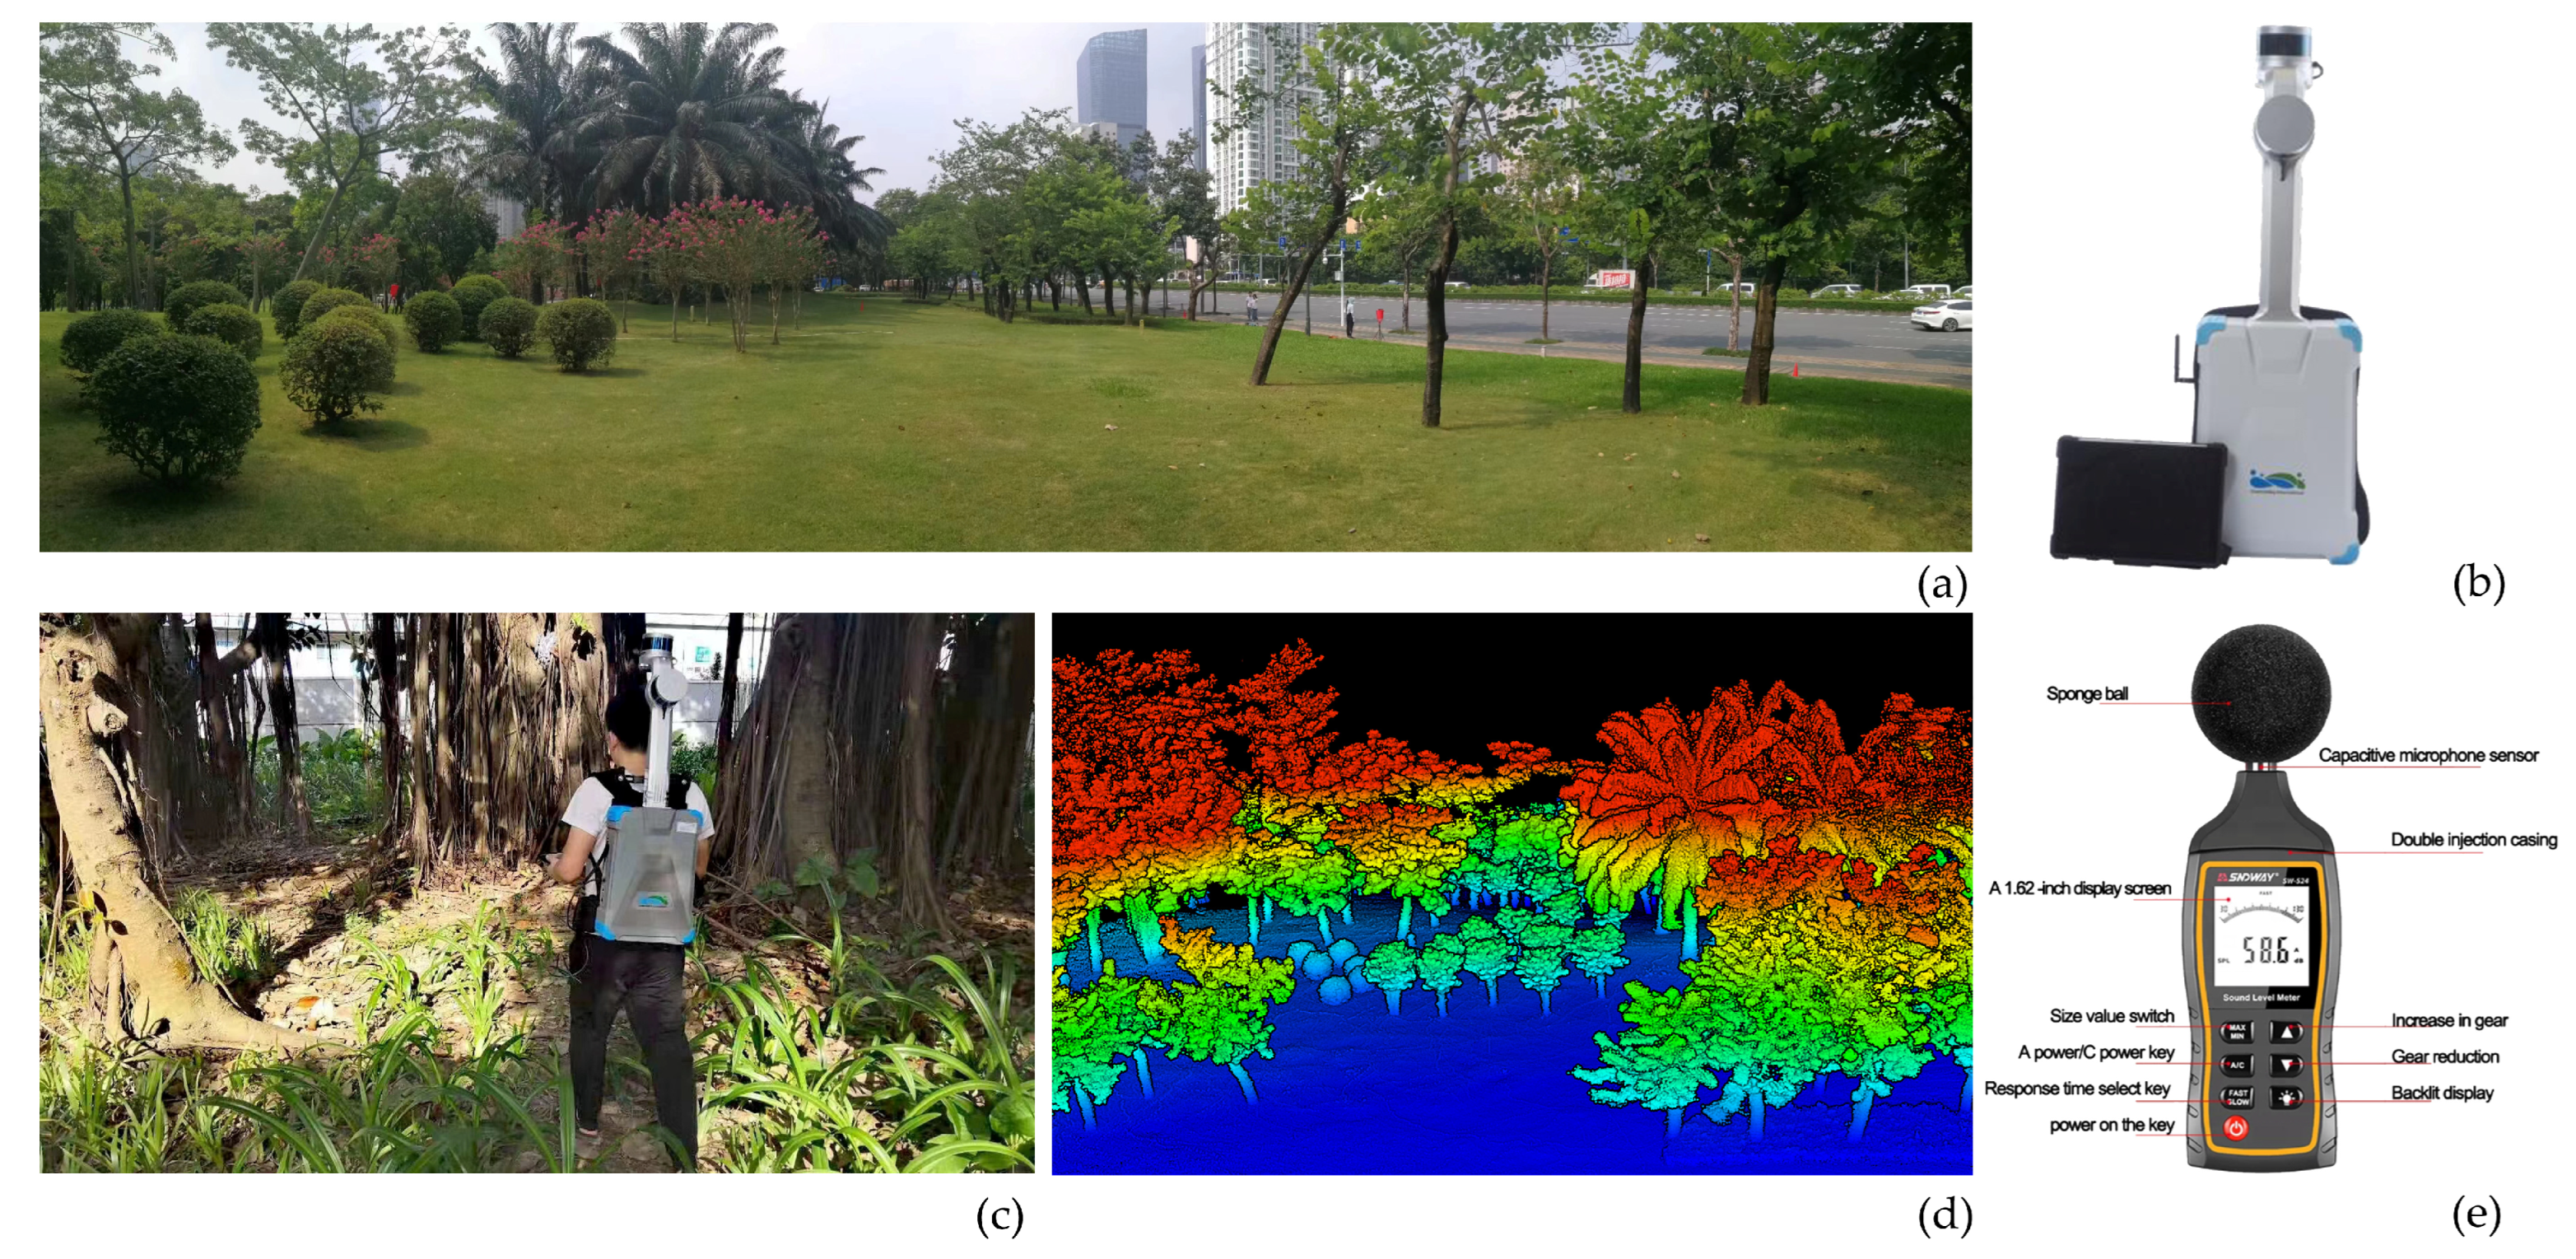
According to research needs and objectives, a LiBackpack D50 knapsack LiDAR (MLS) developed by GreenValley International was used for scanning (Figure 4). Compared with airborne and ground-based LiDAR, knapsack LiDAR can obtain more complete vegetation data under green canopies. The LiBackpack D50 LiDAR scanning system is a multi-sensor integrated version of the LiBackpack series, including a horizontal and vertical LiDAR sensor. The system has a wide scanning angle (0–360° horizontally, −90–90° vertically), a 100 m scanning range, and the max measurement rate can reach 600,000 pts/s. With simultaneous localization and mapping (SLAM) technology, it can even obtain high-precision 3D point cloud data with high accuracy (≤3 cm).
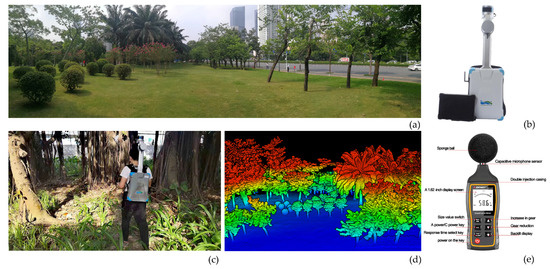
Figure 4.
Quadrat measurement: (a) photo of the quadrat, (b) LiBackpack D50, (c) data are collected by using a LiDAR knapsack, (d) the collected quadrat point cloud data, (e) noise meter.
The collection of each quadrat started from the starting point by walking uniformly and smoothly along the acquisition line and forming a closed loop through the collection of the outer ring and the inner circle back to the starting point, so as to ensure the comprehensiveness and uniformity of the collected point cloud data. Several markers were placed at the important nodes of the quadrat to indicate the collection route and to locate the range of the quadrat within the point cloud data.
Two noise meters were arranged in the quadrat square, which were arranged in a straight line from the near side to the far side along the vertical road direction (Figure 3). The noise meters were placed on the tripods, and the markers were hung on the tripod to locate the noise meter in the point cloud data. These were set at a height equal to 1.2 m to be closer to the acceptable noise level for human ears. The noise meters, model SNDWAY SW-524 (accuracy: ±1.5 dB, measuring range: 30–130 dB, the rights to A and C, resolution of 0.1 dB, sampling frequency of 2 times per second) (Figure 4), were calibrated before the test. The A-weighted sound pressure level was used during the test. The time-weighted characteristic was “Fast” response, and the sampling interval was 1 s. Each quadrat was tested once, and each test was continuously tested for 20 min.
2.3. Point Cloud Data Processing
LiDAR360 software was used for data analysis and index extraction. Compared with other types of mainstream point cloud data processing software, the main advantage of this software is that it has more professional forestry analysis and application functions, including statistical parameter extraction, regression analysis, single tree segmentation, point extraction according to tree ID, and other tools [28].
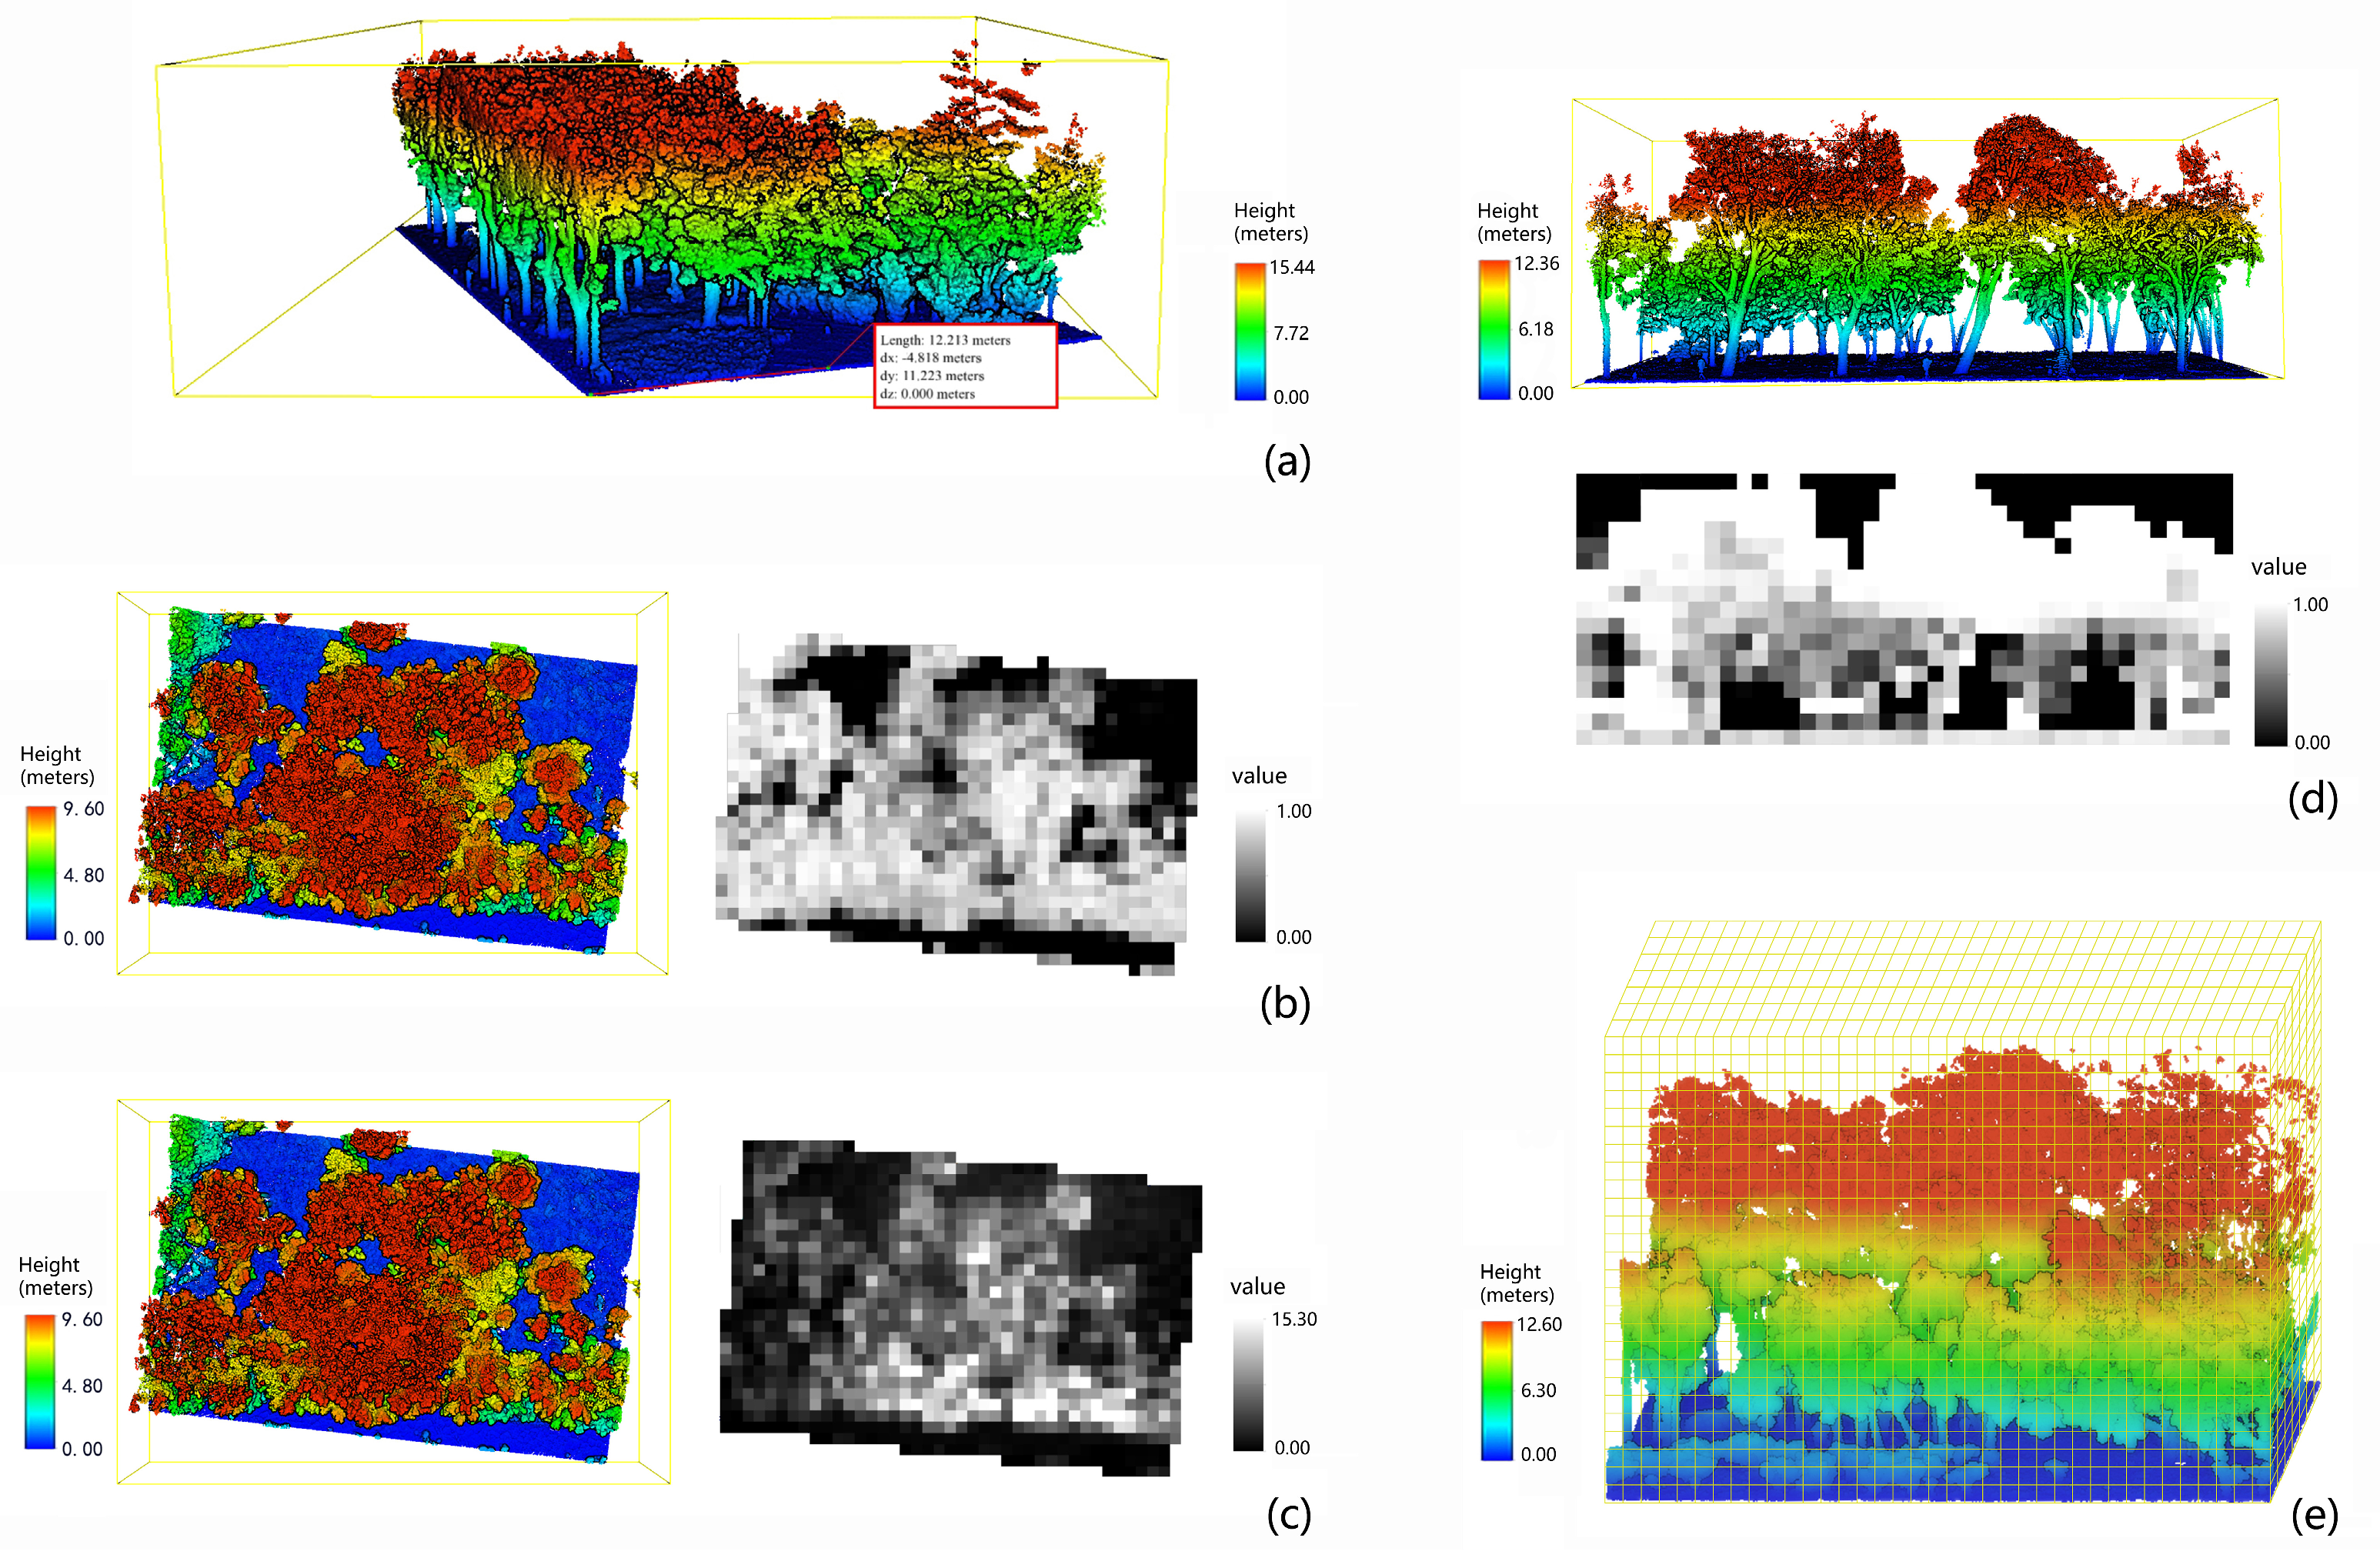
The collected point cloud data were imported into LiDAR360 software for preliminary data processing through the steps of denoising, ground point classification, and ground point normalization. In the software, the x and y coordinates of the near side (F) noise meter and the far side (B) noise meter in each quadrat were obtained according to the markers. Then, using ArcGIS10.2, we took the nearside and farside coordinates (F and B) as the center line, and drew the shape vector rectangle with a length of 50 m. The research ranges of the quadrat green spaces were obtained respectively. In LiDAR 360, the point cloud data within the research range of two quadrat squares were clipped and extracted by the polygonal clipping of the data management clipping function. In order to further explore the action mechanism of different height intervals on noise reduction, the point cloud data of each quadrat were extracted for follow-up analysis according to the three levels of less than 2 m, less than 5 m, and less than 8 m [21] (Figure 5).
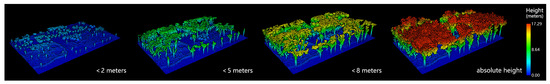
Figure 5.
Point cloud LiDAR data processing at four levels of vegetation height, i.e., <2 m, <5 m, <8 m, and absolute height.
2.4. Noise Data Processing
The traffic flow on the main road was high, so the road vehicle flow could be regarded as a line sound source with a uniform distribution of sound level [29]. Because the traffic noise was constantly changing, the equivalent continuous A sound level (Leq), which was calculated based on the noise value during the test period (refer to GB/T3222-1994 for the calculation method), was used to represent the noise level of the measurement point, in dB (A). Based on the Leq values of four measuring points, one set of data was obtained from each quadrat, that is, N = NF − NB represents the noise level difference between the front and rear edges of different green spaces. The actual noise attenuation of green space was obtained by subtracting distance attenuation, and 96 sets of data were obtained by this method.
where the NA is the actual noise attenuation, N is the noise difference between the front and rear edges, r1 is the distance from the front edge of the green space to the sound source, and r2 is the distance from the rear edge of the green space to the sound source.
NA = N − ∆L
∆L = 10lg (r2/r1)
2.5. Index Selection and Extraction
Because the influence of the single characteristic factor index in the complex structure green space on the noise reduction effect of the whole green space is not as sensitive compared to that of the simple structure, abstracting and objectifying it is helpful for exploring the universal mechanism of the noise reduction ecosystem service. Md et al. [23] calculated the crown density and shelterbelt porosity of greenbelts by using the digital image processing method. Hu et al. [26] calculated the road shielding rate of the greenbelts by using the light transmission at the back end of the green space. They are both useful methods for objectifying and abstracting a variety of complex indices. Therefore, unlike many previous studies, this study weakened the use of diameter at breast height, crown width, and lower branch higher monomer indices in the selection of influencing factors and emphasized group indices such as coverage degree, occlusion degree, point cloud percentage, leaf area index, and so on. At the same time, we combined the characteristics and advantages of point cloud data to explore several new characteristic factor index extraction methods (Table 2) (Figure 6).
Table 2.
Characteristic factor and index extraction method of quadrat.
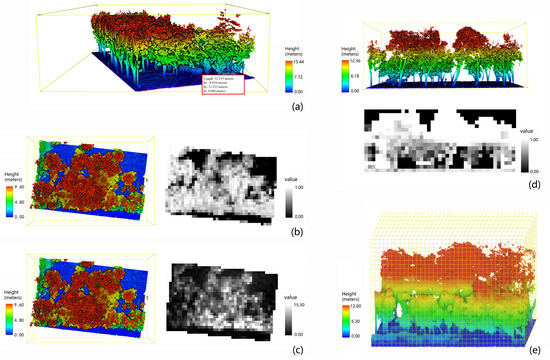
Figure 6.
Index extraction content: (a) width, (b) coverage degree, (c) leaf area index, (d) horizontal occlusion degree, (e) percentage of point cloud grid.
2.6. Statistical Analysis
On the R statistical analysis platform, we took the actual noise attenuation (NA) of 96 quadrats as the dependent variables, and the near roadside noise (NF) (because the noise values of different road sections are different, they were assumed in the independent variables), width, coverage degree, leaf area index, horizontal occlusion degree, and the percentage of point cloud grid as the independent variables to analyze the correlation between them. In order to explore the effects of different lengths on noise reduction, we took the most significant factor as a reference and extracted the indices of 30 m, 40 m, and 50 m in length for correlation analysis. We also counted the characteristic indices of vegetation at different locations (nearside and farside) in each quadrat and analyzed the influence of different location distributions on noise reduction. Finally, the ordinary least square regression fitting regression model was used to further analyze the influence degree of green space vegetation characteristics on the noise reduction effect under the combined action of various influencing factors. Considering the possible interactions among the influencing factors [18], the product of the main influencing factors was assumed in the independent variables.
3. Results
3.1. Effects of the Vegetation Characteristics at Different Heights on Noise Reduction
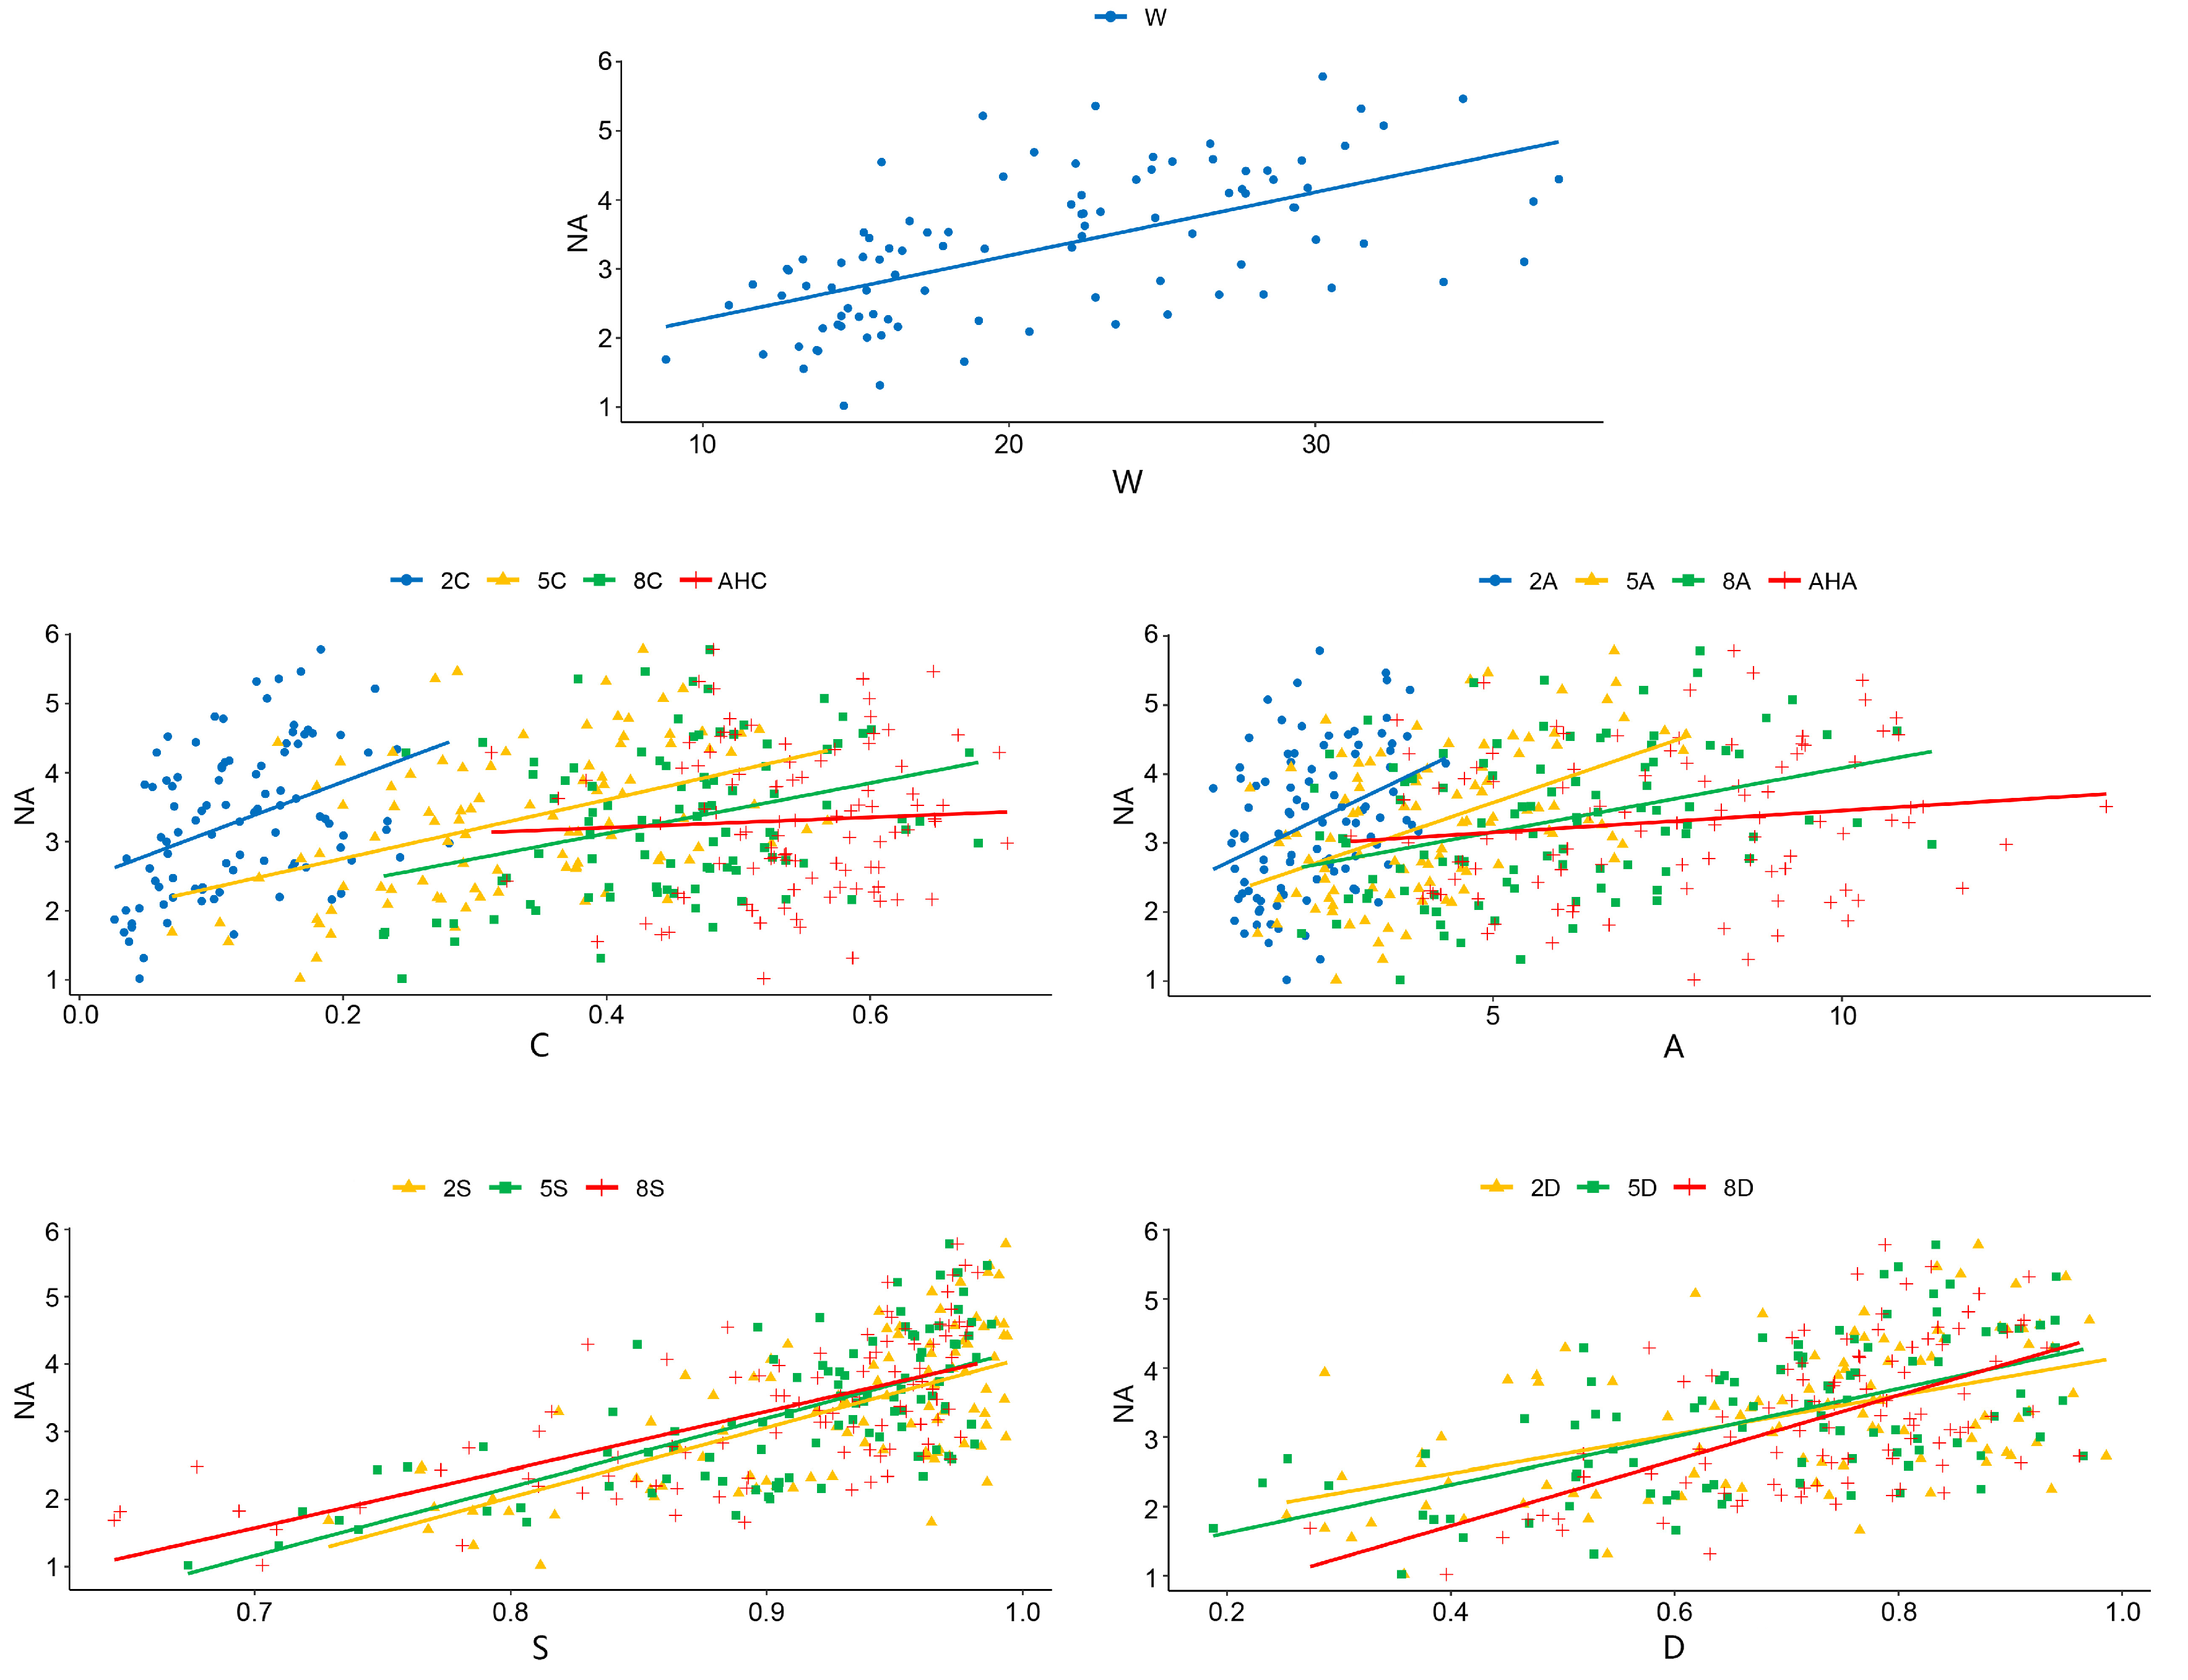
It can be seen from Figure 7 and Table 3 that the actual noise attenuation of a green space is related to its various characteristic factors. There is a significant positive correlation between width and actual attenuation. There is a significant positive correlation between coverage degree and actual attenuation at the levels of 2 m, 5 m, and 8 m, among which 5 m has the strongest correlation, but there is no correlation at absolute height (coverage degree at absolute height, AHC). There is a significant positive correlation between leaf area index and actual attenuation at the levels of 2 m, 5 m, and 8 m, among which 5 m has the strongest correlation, but there is no correlation at absolute height (leaf area index at absolute height, AHA). There is a significant positive correlation between horizontal occlusion degree and actual attenuation at the levels of 2 m, 5 m, and 8 m, among which 5 m has the strongest correlation. There is a significant positive correlation between the percentage of point cloud grid and actual attenuation at the levels of 2 m, 5 m, and 8 m, among which 5 m has the strongest correlation.
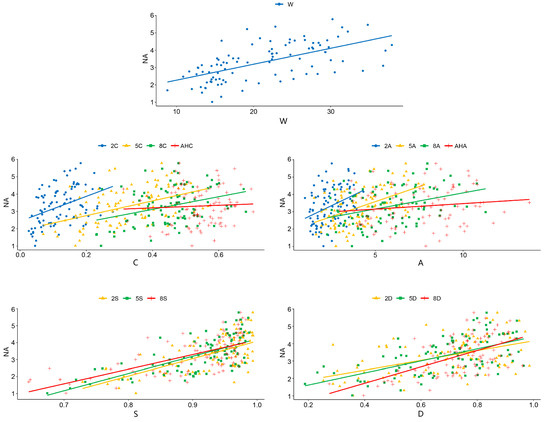
Figure 7.
Scatter distribution of characteristic factor indices and actual noise attenuation. W: width, C: coverage degree, A: leaf area index, S: horizontal occlusion degree, D: percentage of point cloud grid.
Table 3.
Correlation analysis of each index.
In general, the four characteristic factors of coverage degree, leaf area index, horizontal occlusion degree, and percentage of point cloud grid are all at the level of 5 m, and they have the strongest correlation with the actual noise attenuation. The importance degree of the influence on actual noise attenuation is as follows: horizontal occlusion degree > width > percentage of point cloud grid > leaf area index > coverage degree.
3.2. Effects of the Quadrats with Different Lengths on Noise Reduction
The correlation coefficients between the S indices (5 m) under the three lengths and the actual noise attenuation are 0.625, 0.634, and 0.677, respectively (p < 0.001) (Table 4). It can be seen that the correlation between actual noise attenuation and vegetation characteristic factors of the 50 m quadrat is the strongest.
Table 4.
Correlation analysis of the horizontal occlusion degree under three lengths.
3.3. Effects of the Vegetation at Different Locations on Noise Reduction
The correlation coefficient between the D index (5 m) of the half quadrat on the near side and the actual noise attenuation is 0.475 (p < 0.001); it is more significant than the far side (0.371, p < 0.001) (Table 5).
Table 5.
Correlation analysis of the percentage of point cloud grid at different locations.
3.4. Regression Analysis
In this study, the index and index product with the strongest correlation for each factor were selected for ordinary least square regression, and two effective models with good-fitting degrees were obtained. All factors except coverage degree were put into the regression models. As can be seen from Table 6, the adjusted R-squared value of the first model is 0.630, and the model variables are near road side noise, width, horizontal occlusion degree, the product of width, and leaf area index. All indices have a significant positive impact on actual noise attenuation, among which the horizontal occlusion degree has the greatest influence. The adjusted R-squared value of the second model is 0.627, and the model variables are near road side noise, horizontal occlusion degree, the product of width and horizontal occlusion degree, and the product of leaf area index and the proportion of point cloud grid. All indices have a significant positive impact on actual noise attenuation, among which the horizontal occlusion degree has the greatest influence.
Table 6.
Parameter table of the multiple regression model.
4. Discussion
Extracting the characteristic factors of green space vegetation based on LiDAR data provides the possibility for studying those urban green spaces where it is difficult to extract vegetation characteristic factors manually and provides a more objective basis for further research. At the same time, it increases the breadth and applicability of noise reduction research, such as through the construction of a three-dimensional data model of urban vegetation, large-scale evaluation of urban roadside green space noise reduction function, and so on. With the continuous deepening and optimization of this research, new methods for other types of urban ecosystem services research can be provided, and the application of LiDAR point cloud data provides an area for further exploration in terms of medium- and small-scale urban ecosystem services evaluation, whether in terms of two dimensions or three dimensions.
Previous studies have shown that green spaces with large widths, high planting densities, and dense foliage vegetation characteristics have better noise reduction effects [17,22,23], a finding consistent with the results of this study. For single species or several mixed forest belts and the plant communities in parks, the single characteristic factor indices are relatively easy to obtain. At the same time, there is little difference in vegetation composition among different quadrats. Therefore, the analysis of the average crown width, average diameter at breast height, and average lower branch height index can reflect a more significant overall difference [14,18,19]. These specific indices can provide reference for the selection and collocation of plants. Additionally, due to the consideration and comparison of plant species, the results can provide reference for noise reduction optimization of specific tree species [32] or specific community structures [21] and plant collocation [20]. However, the application objects of these studies are slightly limited. Since there are numerous plant species in the complex structure green space plot, and because of the need to enhance the breadth of research applications, this study did not specifically consider the impact of species factors. Based on the objective, quantitative, and multi-level analysis advantages of the LiDAR technical method, subsequent comparative studies can be conducted specifically for different tree species and different community structures. This approach may be better than methods based on manual measurements and may provide the basis for future studies.
Because the composition of complex green space vegetation is diverse, and each quadrat has large differences in terms of height, it is difficult to take the unified height as the quadrat height extraction index for analysis. Therefore, differentiation analysis was carried out at four levels: below 2 m, below 5 m, below 8 m, and below absolute height. Unlike garden communities with simple tree species [21] or relatively regular planting [22], the complex green space vegetation coverage degree and leaf area index collected at the absolute height have no correlation with actual noise attenuation, which further illustrates the uncertainty of vegetation characteristics in this kind of green space. In terms of regression modelling, the fitting degree of noise reduction affects the evaluation model using complex vegetation characteristic factors, and it is not as high as that of single [14,15,16] or mixed forest greenbelts [18], which is also related to the complexity and uncertainty of the vegetation structure and components in the quadrat.
Some studies have shown that the length factor of the greenbelt will also have an influence on its noise reduction effect. The influence tends to be stable when the length exceeds 50 m [16,27], which is consistent with the trend reflected in this study. However, the maximum threshold of 50 m requires further study. Similar to previous studies [18,19], this study also found that vegetation on the near side of the quadrat contributed more to noise reduction, which may be the best area for improving the effect. Multiple regions can be extracted and analyzed based on the collected quadrat data, reflecting the advantages of this method based on LiDAR data in multi-spatial distribution analysis. It also avoids repeated measurement errors in comparative studies of different regions.
At present, only the noise reduction effect of human height acquisition has been simulated and analyzed. The effect of noise reduction in greater heights, such as with high-rise buildings, requires further study. In the future, it is necessary to increase the number of quadrats, analyze and construct new characteristic factor indices, explore the deeper potential correlations between the factors, and further explore and optimize new models to improve their quality and practicability.
5. Conclusions
In this study, by collecting LiDAR point cloud data and traffic noise data of urban roadside green space quadrats, relevant green space vegetation characteristic factors were selected. Then the index data of different height levels were extracted, and the noise reduction mechanisms of complex green spaces were subsequently analyzed. The main conclusions are as follows: there is a correlation between the actual noise attenuation of green space and the indices of many kinds of vegetation characteristic factors at different heights. Among them, there is a significant positive correlation between width (r = 0.607) and actual noise attenuation, and the strongest correlation occurred between coverage degree (r = 0.448), leaf area index (r = 0.496), horizontal occlusion degree (r = 0.677), and percentage of point cloud grid (r = 0.585) at the level of 5 m height. However, there is no correlation between coverage degree (r = 0.054), leaf area index (r = 0.143), and actual noise attenuation at absolute height. Both the newly constructed horizontal occlusion degree and the percentage of point cloud grid can be used as important vegetation characteristics of complex green space to study the noise reduction effect. The effect of a 50 m length quadrat is greater than that of 30 m and 40 m. The amount of vegetation near the road (r = 0.475) has a greater effect on noise reduction than that on the far side (r = 0.371). Except for coverage degree, the other four types of characteristic factors can be used as independent variables to fit and synthesize effective regression models (adjusted R2 = 0.630, 0.627) to jointly explain the noise reduction effect of vegetation characteristics. There is no linear relationship between actual noise attenuation and green space vegetation characteristic factors, and the interaction of each factor plays a comprehensive role in the noise reduction effect. The noise reduction effect of green space is more prominent in the roads with more serious noise pollution (B = 0.076, 0.074). In order to improve the noise reduction capacity of green space vegetation, it is important to increase the width (B = 0.036) of green space and focus on the planting space below 5 m. Under limited conditions, it is also an effective method to increase the vegetation on the near side. Selecting trees and shrubs with low branching points, increasing the planting quantity and density of the space, and improving the frontal horizontal occlusion degree (B = 4.634, 3.095) will be the most effective ways.
Author Contributions
Conceptualization, C.X.; methodology, C.X. and B.H.; investigation, C.X. and B.H.; software, C.X.; writing—original draft preparation, C.X.; writing—review and editing, B.H., F.L. and T.W.; supervision, C.X. and B.H.; project administration, B.H. All authors have read and agreed to the published version of the manuscript.
Funding
This research was funded by the National Natural Science Foundation of China, grant number 71804180; Youth Innovation Promotion Association, CAS; Young Teachers’ Research Capability Improvement Project in Beijing University of Civil Engineering and Architecture, grant number X21088.
Institutional Review Board Statement
Not applicable.
Informed Consent Statement
Not applicable.
Data Availability Statement
Not applicable.
Conflicts of Interest
The authors declare no conflict of interest.
References
- Cao, W.; Chen, D.; Shi, Y.; Cao, Z.; Xia, S. Progress and Prospect of Lidar Point Clouds to 3d Tree Models. Geomat. Inf. Sci. Wuhan Univ. 2021, 46, 203–220. [Google Scholar]
- Guo, Q.; Hu, T.; Ma, Q.; Xu, K.; Yang, Q.; Sun, Q.; Li, Y.; Su, Y. Advances for the New Remote Sensing Technology in Ecosystem Ecology Research. J. Plant Ecol. 2020, 44, 418–435. [Google Scholar] [CrossRef]
- Guo, Q.; Liu, J.; Tao, S.; Xue, B.; Le, L.; Xu, G.; Li, W.; Wu, F.; Li, Y.; Chen, L.; et al. Perspectives and Prospects of Lidar in Forest Ecosystem Monitoring and Modeling. Chin. Sci. Bull. 2014, 59, 459–478. [Google Scholar]
- Guo, Q.; Su, Y.; Hu, T.; Guan, H.; Jin, S.; Zhang, J.; Zhao, X.; Xu, K.; Wei, D.; Kelly, M.; et al. Lidar Boosts 3D Ecological Observations and Modelings: A Review and Perspective. IEEE Geosc. Remote Sens. Mag. 2021, 9, 232–257. [Google Scholar] [CrossRef]
- Su, Y.; Guo, Q.; Xue, B.; Hu, T.; Alvarez, O.; Tao, S.; Fang, J. Spatial distribution of forest aboveground biomass in China: Estimation through combination of spaceborne lidar, optical imagery, and forest inventory data. Remote Sens. Environ. 2016, 173, 187–199. [Google Scholar] [CrossRef] [Green Version]
- Sun, X.; Tian, J.; Xu, Y.; Xu, S.; Li, H. Evaluation of Ecological Landscape of Road Based on Terrestrial Laser Scanning: A Case Study of Huanghai National Forest Park. J. Ecol. Rural Environ. 2020, 36, 1477–1484. [Google Scholar]
- Jia, J.; Li, G.; Qiang, X. Research and Application of Automatic Extraction of Landscaping Data Based on Vehicle Point Cloud. Mod Sur. Map. 2019, 42, 49–51. [Google Scholar]
- Cheng, S.; Zhang, G.; Zhang, X.; Liu, Y. Research on the quantitative analysis method of “Green Viewing Ratio” of landscape spatial form based on three-dimensional LiDAR point cloud data. Chin. Landsc. Arch. 2022, 38, 12–19. [Google Scholar]
- Wang, R.; Peethambaran, J.; Chen, D. LiDAR Point Clouds to 3-D Urban Models: A Review. IEEE J. Sel. Top. Appl. Earth Obs. Remote Sens. 2018, 11, 606–627. [Google Scholar] [CrossRef]
- Urech, P.R.W.; Dissegna, M.A.; Girot, C.; Gret-Regamey, A. Point cloud modeling as a bridge between landscape design and planning. Landsc. Urban Plan. 2020, 203, 103903. [Google Scholar] [CrossRef]
- Wang, W.; Guo, X.; Wang, M.; Zhang, P. Research Progress of Traffic Noise Attenuation By Green Belts. J. Nor Agric. For. Univ. 2013, 28, 240–244. [Google Scholar]
- Chen, L.; Xie, G.; Gai, L.; Pei, S.; Zhang, C.; Zhang, B.; Xiao, Y. Research on Noise Reduction Service of Road Green Spacesa Case Study of Beijing. J. Nat. Resour. 2011, 26, 1526–1534. [Google Scholar]
- Han, B.; Shu, C.; Cai, W.; Jia, Q.; Wang, X.; Ouyang, Z. Research Advances in the Impact of Vegetation Community Characteristics on Urban Ecosystem Services. Acta Ecol. Sin. 2021, 41, 9978–9989. [Google Scholar]
- Zhang, J.; Guo, X.; Zhao, C. Nonlinear prediction model of noise reduction by greenbelts. Urban For. Urban Green 2015, 14, 282–285. [Google Scholar] [CrossRef]
- Fang, C.; Ling, D. Guidance for noise reduction provided by tree belts. Landsc. Urban Plan. 2005, 71, 29–34. [Google Scholar] [CrossRef]
- Fang, C.; Ling, D. Investigation of the noise reduction provided by tree belts. Landsc. Urban Plan. 2003, 63, 187–195. [Google Scholar] [CrossRef]
- Samaneh, S.K.; Elham, K.; Hamid, R.N.; Seyed, M.G.; Seyed, M.H.; Mina, A. Investigation of the Traffic Noise Attenuation Provided by Roadside Green Belts. Fluct. Noise Lett. 2015, 14, 1550036. [Google Scholar]
- Wang, H.; Guo, J.; Zhang, Y.; Wei, H.; Feng, L. Study on Noise Attenuation Impact of Roadside Tree-belts and Related Influence Factors. J. Ecol. Environ. Sci. 2010, 19, 1403–1408. [Google Scholar]
- Sun, W.; Wang, W.; Guo, X.; Peng, H. Comparison on Attenuation Effect of Green Belts with Different Types on Traffic Noise. J. Plant Resour. Environ. 2014, 23, 87–93. [Google Scholar]
- Li, G.; Xiong, J.; Xu, M.; Dong, L. Comprehensive Study on the Noise Reduction Ability and the Visual Effect on the Edge of Green Space of Beijing Urban Park. J. Beijing For. Univ. 2017, 39, 93–104. [Google Scholar]
- Zhang, Q.; Zheng, S.; Xia, L.; Wu, H.; Zhang, M.; Li, M. Noise-reduction Function and Its Affecting Factors of Urban Plant Communities in Shanghai. J. Appl. Ecol. 2007, 2295–2300. [Google Scholar]
- Pal, A.K.; Kumar, V.; Saxena, N.C. Noise Attenuation By Green Belts. J. Sound Vib. 2000, 234, 149–165. [Google Scholar] [CrossRef]
- Md, N.I.; Khandkar-Siddikur, R.; Md, M.B.; Md, A.H.; Keisuke, A.; Nobuaki, H. Pollution attenuation by roadside greenbelt in and around urban areas. Urban. For. Urban Green. 2012, 11, 460–464. [Google Scholar]
- Ow, L.F.; Ghosh, S. Urban cities and road traffic noise: Reduction through vegetation. Appl. Acoust. 2017, 120, 15–20. [Google Scholar] [CrossRef]
- Timothy, V.R. Guidelines for optimizing road traffic noise shielding by non-deep tree belts. Ecol. Eng. 2014, 69, 276–286. [Google Scholar]
- Hu, J.; Ge, J. Attenuation Effect of City Green Belt and Simulation on Traffic Noise. Urban Environ. Urban Ecol. 2013, 26, 33–36. [Google Scholar]
- Zhang, H. Study on the Parameter Design of Highway Green Belts Noise Reduction. High Auto Appl. 2009, 156–159. [Google Scholar]
- Zhou, J.; Zhang, L.; Ma, H.; Zhang, W. Comparison and Evaluation of Airborne Lidar Point Cloud Data Processing Software. GeoSpa Inf. Technol. 2019, 42, 101–104. [Google Scholar]
- Zhang, W.; Liu, J.; Hu, H.; Xiao, L.; Li, X. Effect of the Construction of Green Belts on the Attenuation of Traffic Noise Along the Urban Trunk Roads in Xiamen City. Subtrop. Plant Sci. 2009, 38, 74–78. [Google Scholar]
- Ma, Q.; Su, Y.; Guo, Q. Comparison of Canopy Cover Estimations from Airborne LiDAR, Aerial Imagery, and Satellite Imagery. IEEE J. Sel. Top. Appl. Earth Obs. Remote Sens. 2017, 10, 4225–4236. [Google Scholar] [CrossRef]
- Chen, J.M.; Black, T.A. Measuring leaf area index of plant canopies with branch architecture. Agric. For. Meteorol. 1991, 57, 1–12. [Google Scholar] [CrossRef]
- Guo, X.; Peng, H.; Wang, L. The Effects of Traffic Noise Attenuation by Green Belts. Acta Sci. Circumstantiae 2009, 29, 2567–2571. [Google Scholar]

Publisher’s Note: MDPI stays neutral with regard to jurisdictional claims in published maps and institutional affiliations. |
© 2022 by the authors. Licensee MDPI, Basel, Switzerland. This article is an open access article distributed under the terms and conditions of the Creative Commons Attribution (CC BY) license (https://creativecommons.org/licenses/by/4.0/).