3.1. Descriptive Statistics
Despite the homogeneous geological bedrock in the study area, we found surprising richness of local soil types (
Figure S1). In general, the forest contains acid soils, where the exchangeable pH ranged from 2.5 to 3.7 in the surface and 3.5 to 4.2 in the subsurface layer. Organic carbon ranged between 5% and 20% in the surface and between 1% and 6% in the subsurface layer, reflecting the expected decreasing content with soil depth (
Table 1,
Figure S5).
Soil properties of an external source, such as C
ox, pH, CEC, EA, Mg
2+, Ca
2+, Na
+, K
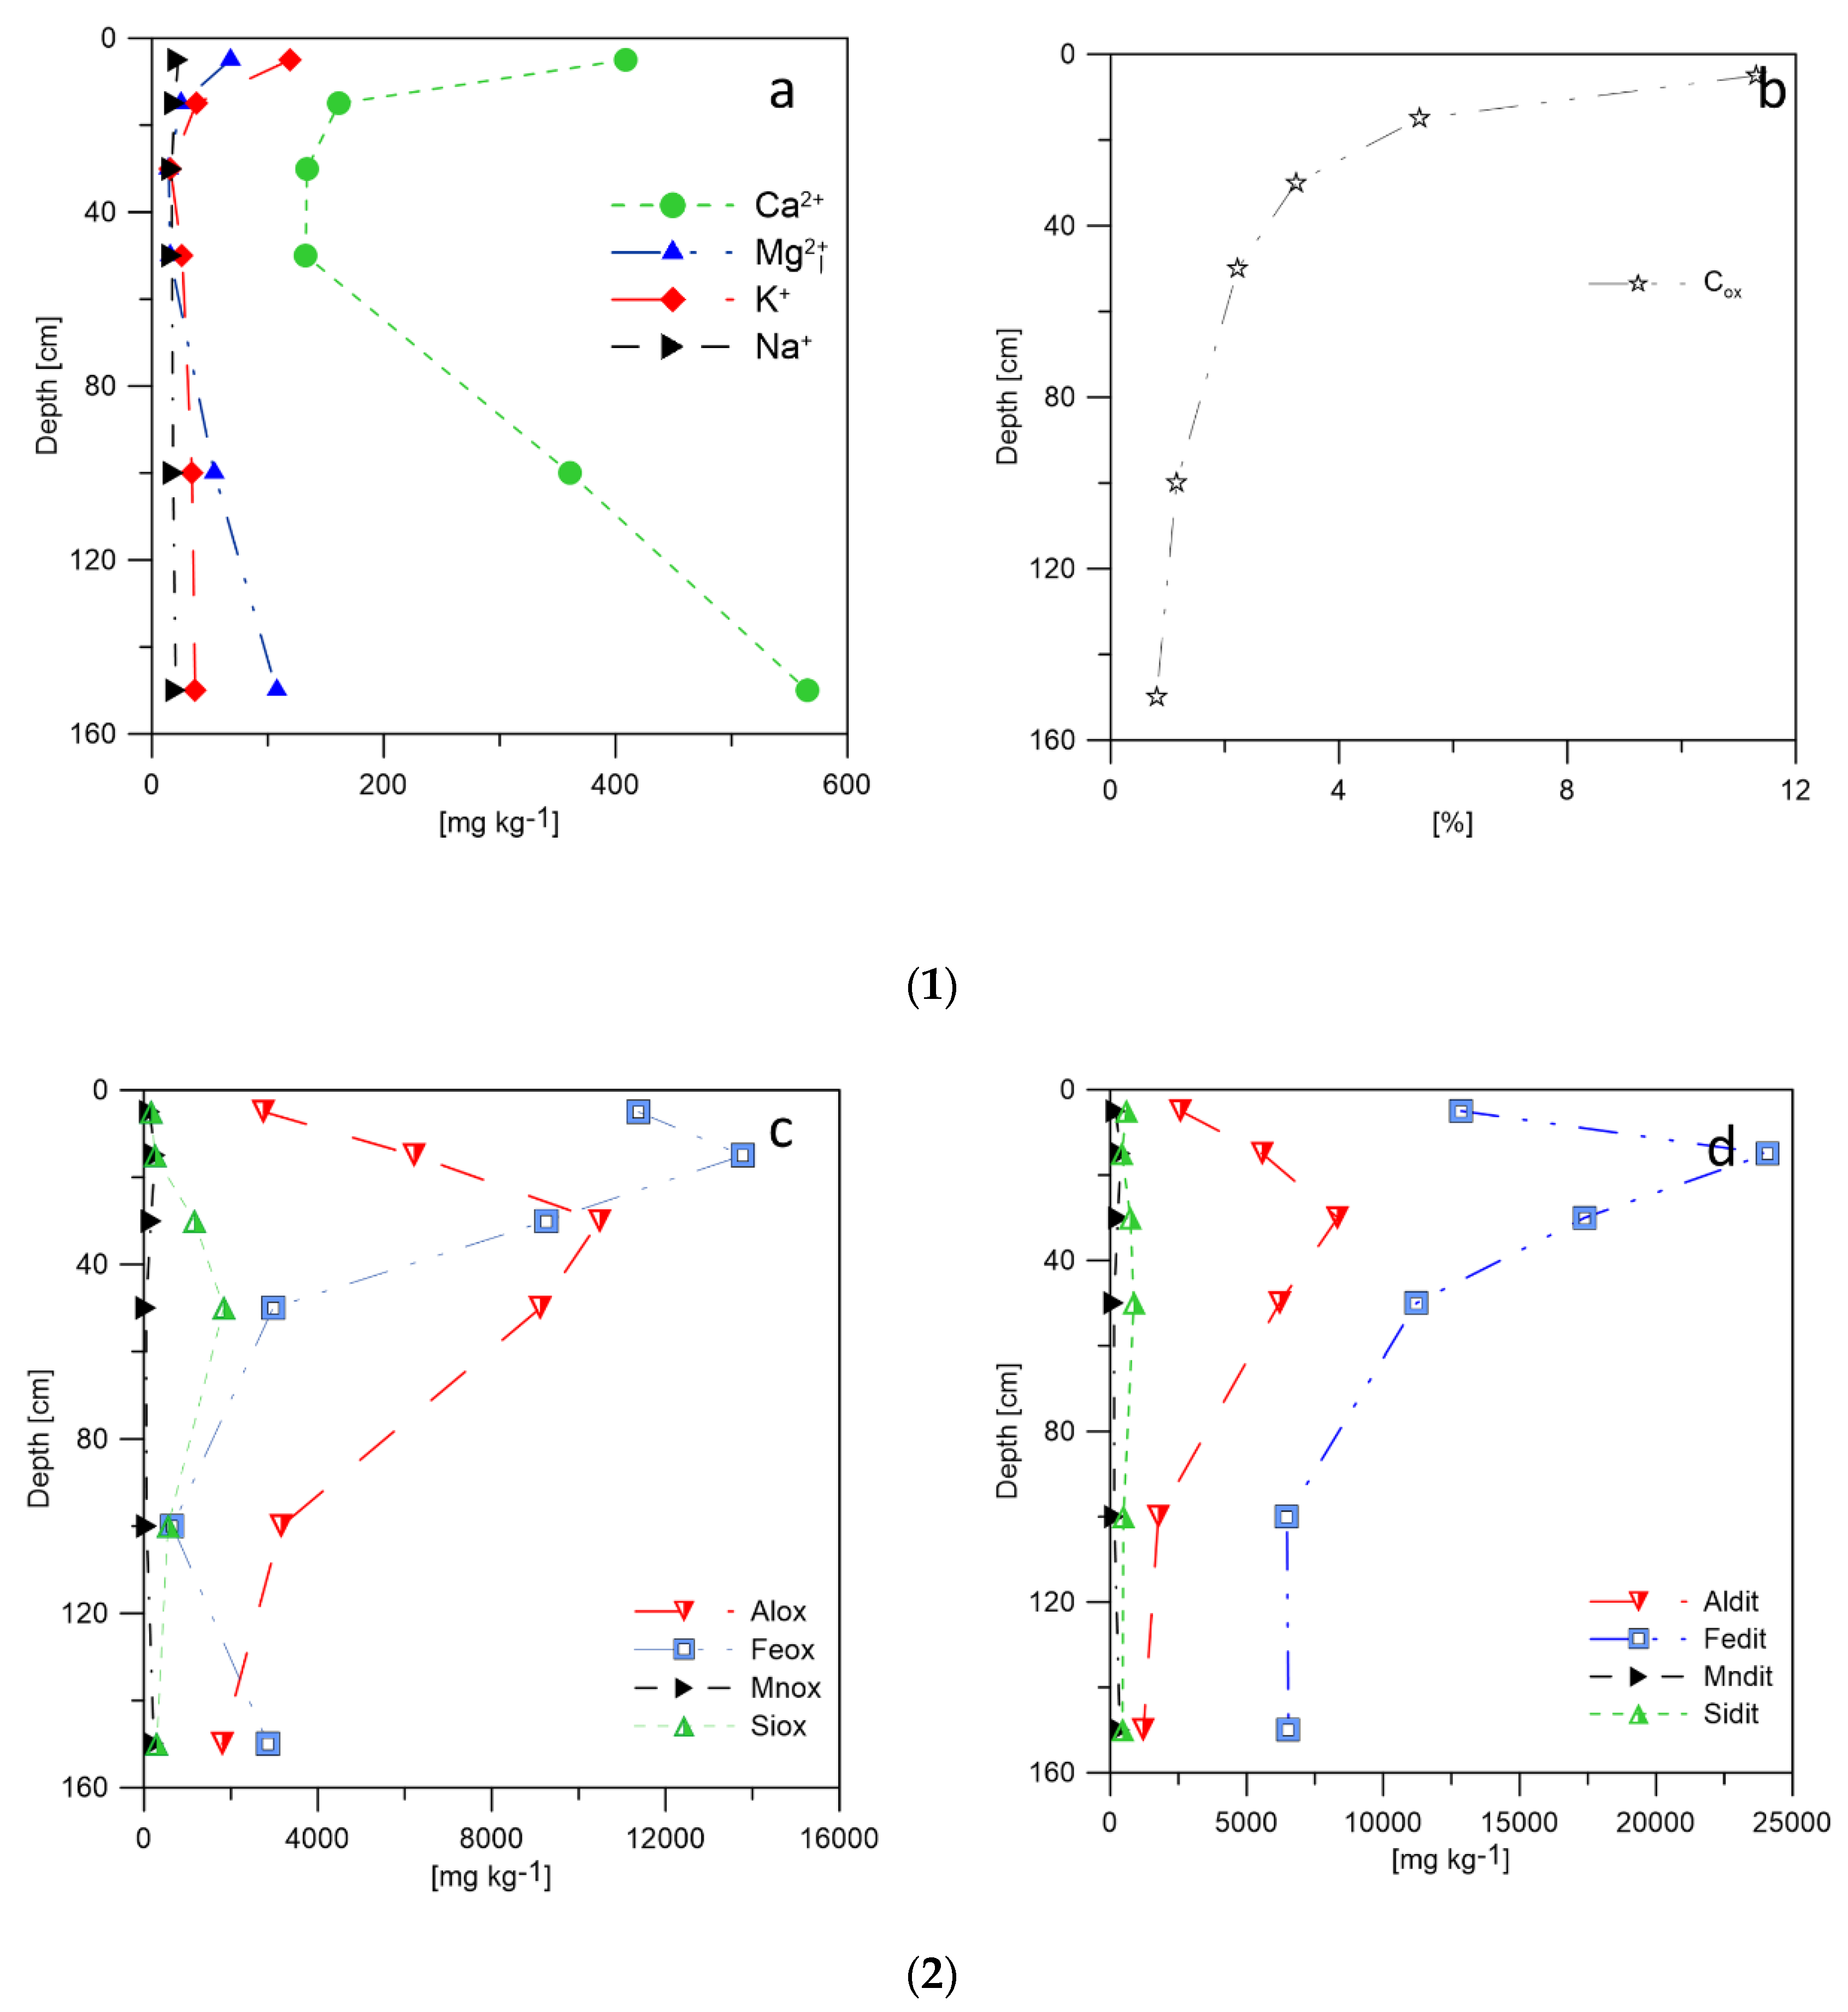
+ and Al cations, had higher mean values in the surface than in the subsurface layer. Of the aluminium cations, the largest proportion was the highly toxic Al
3+, representing an average 81% and 93% in the surface and subsurface layers, respectively. Al(Y)
2+ represented about 2% of the total in both layers, and the least-toxic species, Al(X)
1+, accounted for 17% and 4% in the surface and subsurface layers, respectively. Soil properties of pedogenic sources, Al
ox, Mn
ox, Fe
ox, Si
ox, Si
dit, Mn
dit, Al
dit, and Fe
dit, had higher mean values in the subsurface layer than in the surface or below the subsurface layer (
Figure 2c,d). The differences in the content of amorphous forms of Mn and Fe were minimal in the surface and subsurface layers, but the Al content was three times higher and the Si content was five times higher in the subsurface layer. In contrast, Al
KCl, Mn
KCl, and Fe
KCl had higher mean values in the surface than in the subsurface layer.
For soil units, Podzols showed a higher organic carbon content than Cambisols in the surface and subsurface layers (p = 0.01 and 0.26, respectively). The contents of amorphous forms of Al, Mn, Fe and Si and Aldit, Mndit, Fedit and Sidit were higher in the Cambisols than in the Podzols in the surface (p < 0.0001). In contrast, the content of amorphous forms of Al, Fe, and Si and Aldit, Fedit, and Sidit were higher in the Podzols than in the Cambisols in the subsurface layer (p < 0.0001), with the minor exception of small differences in Mnox, Mndit, and MnKCl content between the two layers. These differences are most likely associated with cation exchange capacity (CEC), which was significantly higher in the Cambisols than in the Podzols in the surface layer and higher in the Podzols than in the Cambisols in the subsurface layer. Comparing the layers, the contents of amorphous forms of Al, Fe, and Si in the Podzols were higher in the subsurface than in the surface layer because of advanced pedogenesis, with minor exceptions for Mn. However, only the content of amorphous forms of Al and Mn were higher in the Cambisols in the subsurface than in the surface layer.
The coefficient of variance (CV) is an important indicator of the overall variation in the heterogeneity of soil chemical properties. The pH of both layers showed low variability (CV = 5.8 and 2.9%, respectively, for the surface and subsurface layers). In contrast, MnKCl, Mnox, and Mndit in the surface layer (CV = 128.3, 114.9 and 101.1%, respectively) and Mg2+ and Ca2+ in the subsurface layer (CV = 124.2 and 113.7%, respectively) showed strong variability. All other chemical soil properties had a CV ranging from 10 to 100%, suggesting moderate variability. When comparing the layers, the CV of soil chemical properties of external sources was higher in the subsurface layer, indicating a statistically significant higher heterogeneity of external soil chemical properties in the subsurface than in the surface layer. In the case of soil chemical properties of pedogenic sources, the CV was higher in the surface layer, suggesting a statistically non-significant higher heterogeneity of soil chemical properties of pedogenic sources in the surface than in the subsurface layer.
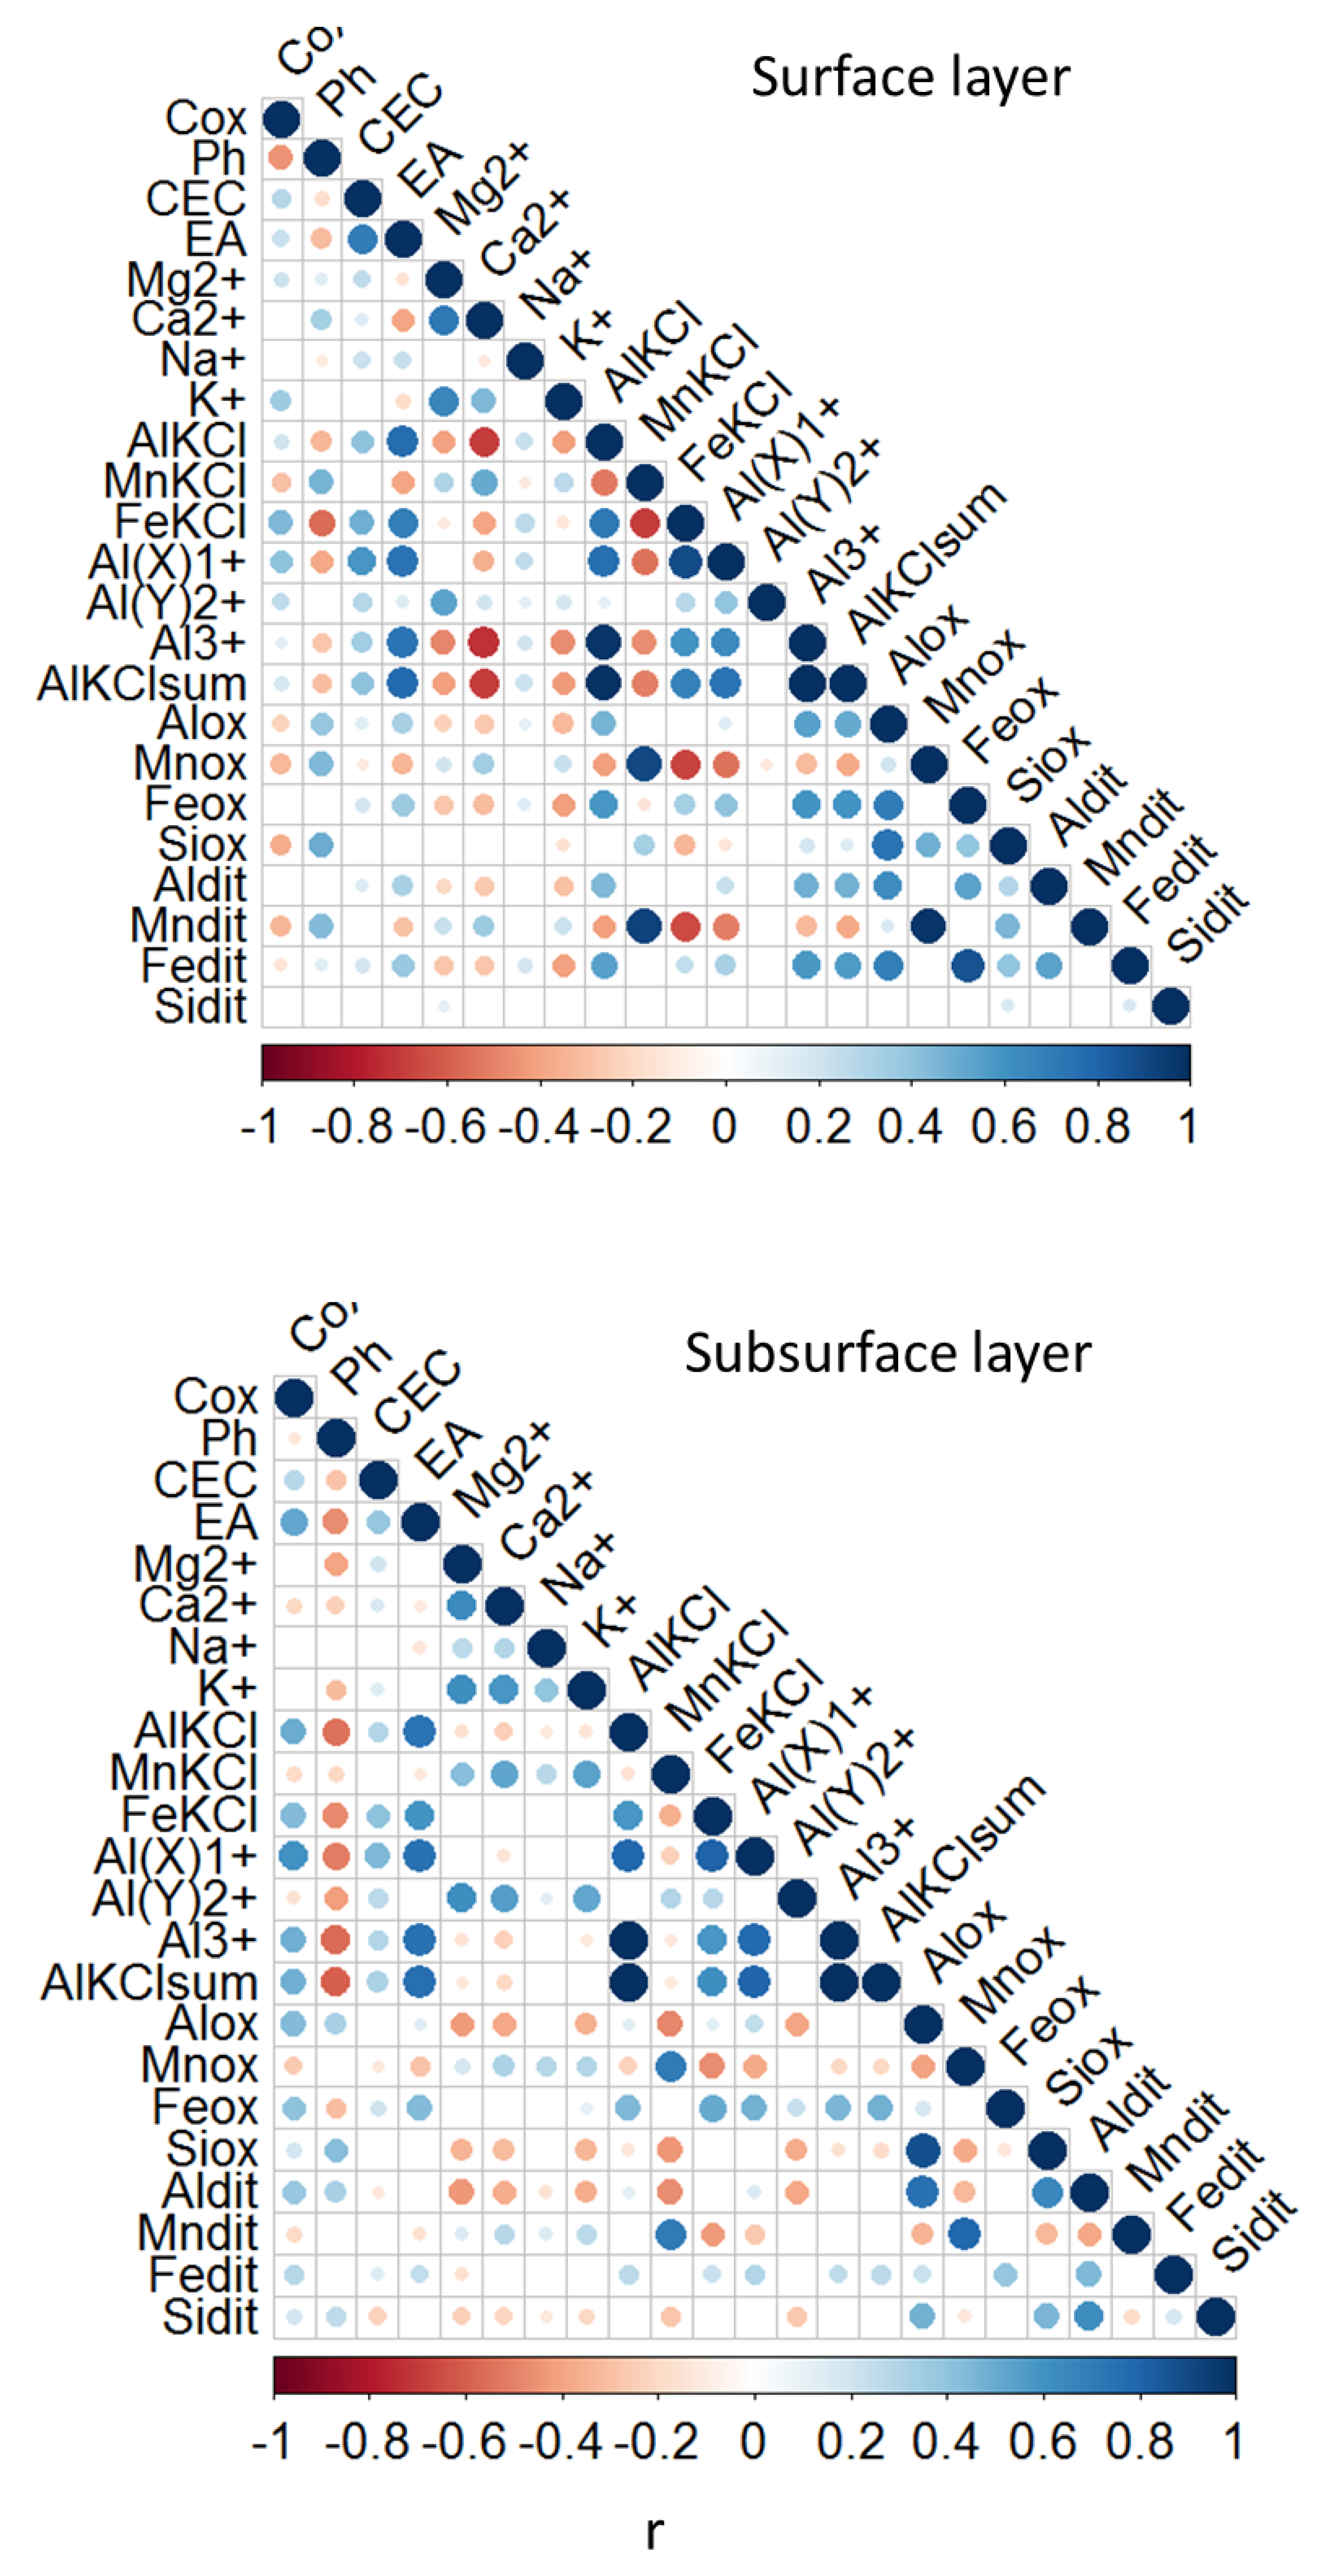
Regarding correlations, the relationships between soil chemical properties were stronger in the surface than in the subsurface layer, with higher correlation values (
r) and higher significance levels (
Figure 3). Specifically, the relationship of C
ox with soil chemical properties of external sources was positive and stronger in the surface than in the subsurface layer. The pH had negative and stronger relationships with soil chemical properties of external sources in the subsurface than in the surface layer. All forms of aluminium and pH were negatively related, and the relationships were stronger in the subsurface than in the surface layer. There were strong relationships between calcium, magnesium, and all forms of aluminium. Calcium and Al(Y)
2+ were positively related in both layers and the relationship was stronger in the subsurface than in the surface layer. Al(X)
1+ and Al
3+ were negatively related to calcium, and the relationships were stronger in the surface than in the subsurface layer. Magnesium was positively related with Al(Y)
2+ and the relationship was very strong in both layers. In contrast, magnesium was negatively related to Al
+3 and the relationship was stronger in the surface than in the subsurface layer. In the case of soil chemical properties of pedogenic sources, relationships with C
ox were negative and weak in the surface layer, but positive and strong in the subsurface layer. The soil chemical properties of pedogenic sources, Mn
ox, Al
ox, Si
ox, Al
dit, Mn
dit, Fe
dit, and Si
dit, were all positively related to pH in both layers (
Figure 3).
The texture of the Entic Podzols is mainly sandy in the upper and lower part of the profile, and loamy sand in some intermediate horizons, while the Albic Podzols have sand in the upper profile and loamy sand in the rest of the profile. The texture in the Haplic Cambisols is loamy sand in the upper and in intermediate horizons and sand in the bottom profile. The Dystric Cambisols are loamy sand in most of the profile and sandy loam in the lower part of the profile. Bulk density is lower in the Albic and Entic Podzols than in the Haplic Dystric Cambisols (
Figure S6).
3.2. Spatial Patterns of Soil Chemical Properties
Generally, the results of the geostatistical analysis indicated that the exponential model was the best fit for most of the soil chemical properties in both layers (
Table 2). Comparing the layers, the range values were generally higher in the surface than in the subsurface layer for most of the soil chemical properties. The highest values were for Na
+ (103 m) in the surface layer and for CEC (254 m) in the subsurface layer. The lowest values were for Si
dit (31 m) in the surface layer and for Mg
2+ (26 m) in the subsurface.
In general, the soil chemical properties did not have a nugget effect, with a few showing a positive nugget effect (Na+, MnKCl, Siox and Mndit) in the surface layer, and Cox, pH, CEC, Ca2+, and Al1+ in the subsurface layer, explained by inherent variability (Liu et al., 2006).
Comparing soil chemical properties of external and pedogenic sources, we observed that the range values of soil chemical properties of external sources were generally lower in the surface layer than in the subsurface layer. In contrast, the range values were lower in the subsurface layer than in the surface layer for most of the soil chemical properties of pedogenic sources. Moreover, we found the highest range value for the soil properties of external sources in both layers (Na+ and CEC).
We applied the Wilcoxon signed-rank test (Wilcoxon, 1945) in the paired difference test for comparing the variogram parameters of both layers, because the data did not follow normality. The range and sill parameters indicated that the layers are significantly different (
p-values < 0.05 = 0.041 and 0.020 respectively), while the nugget parameter indicated a non-significant difference between layers, with
p-value > 0.05 = 0.161 (
Table 3).
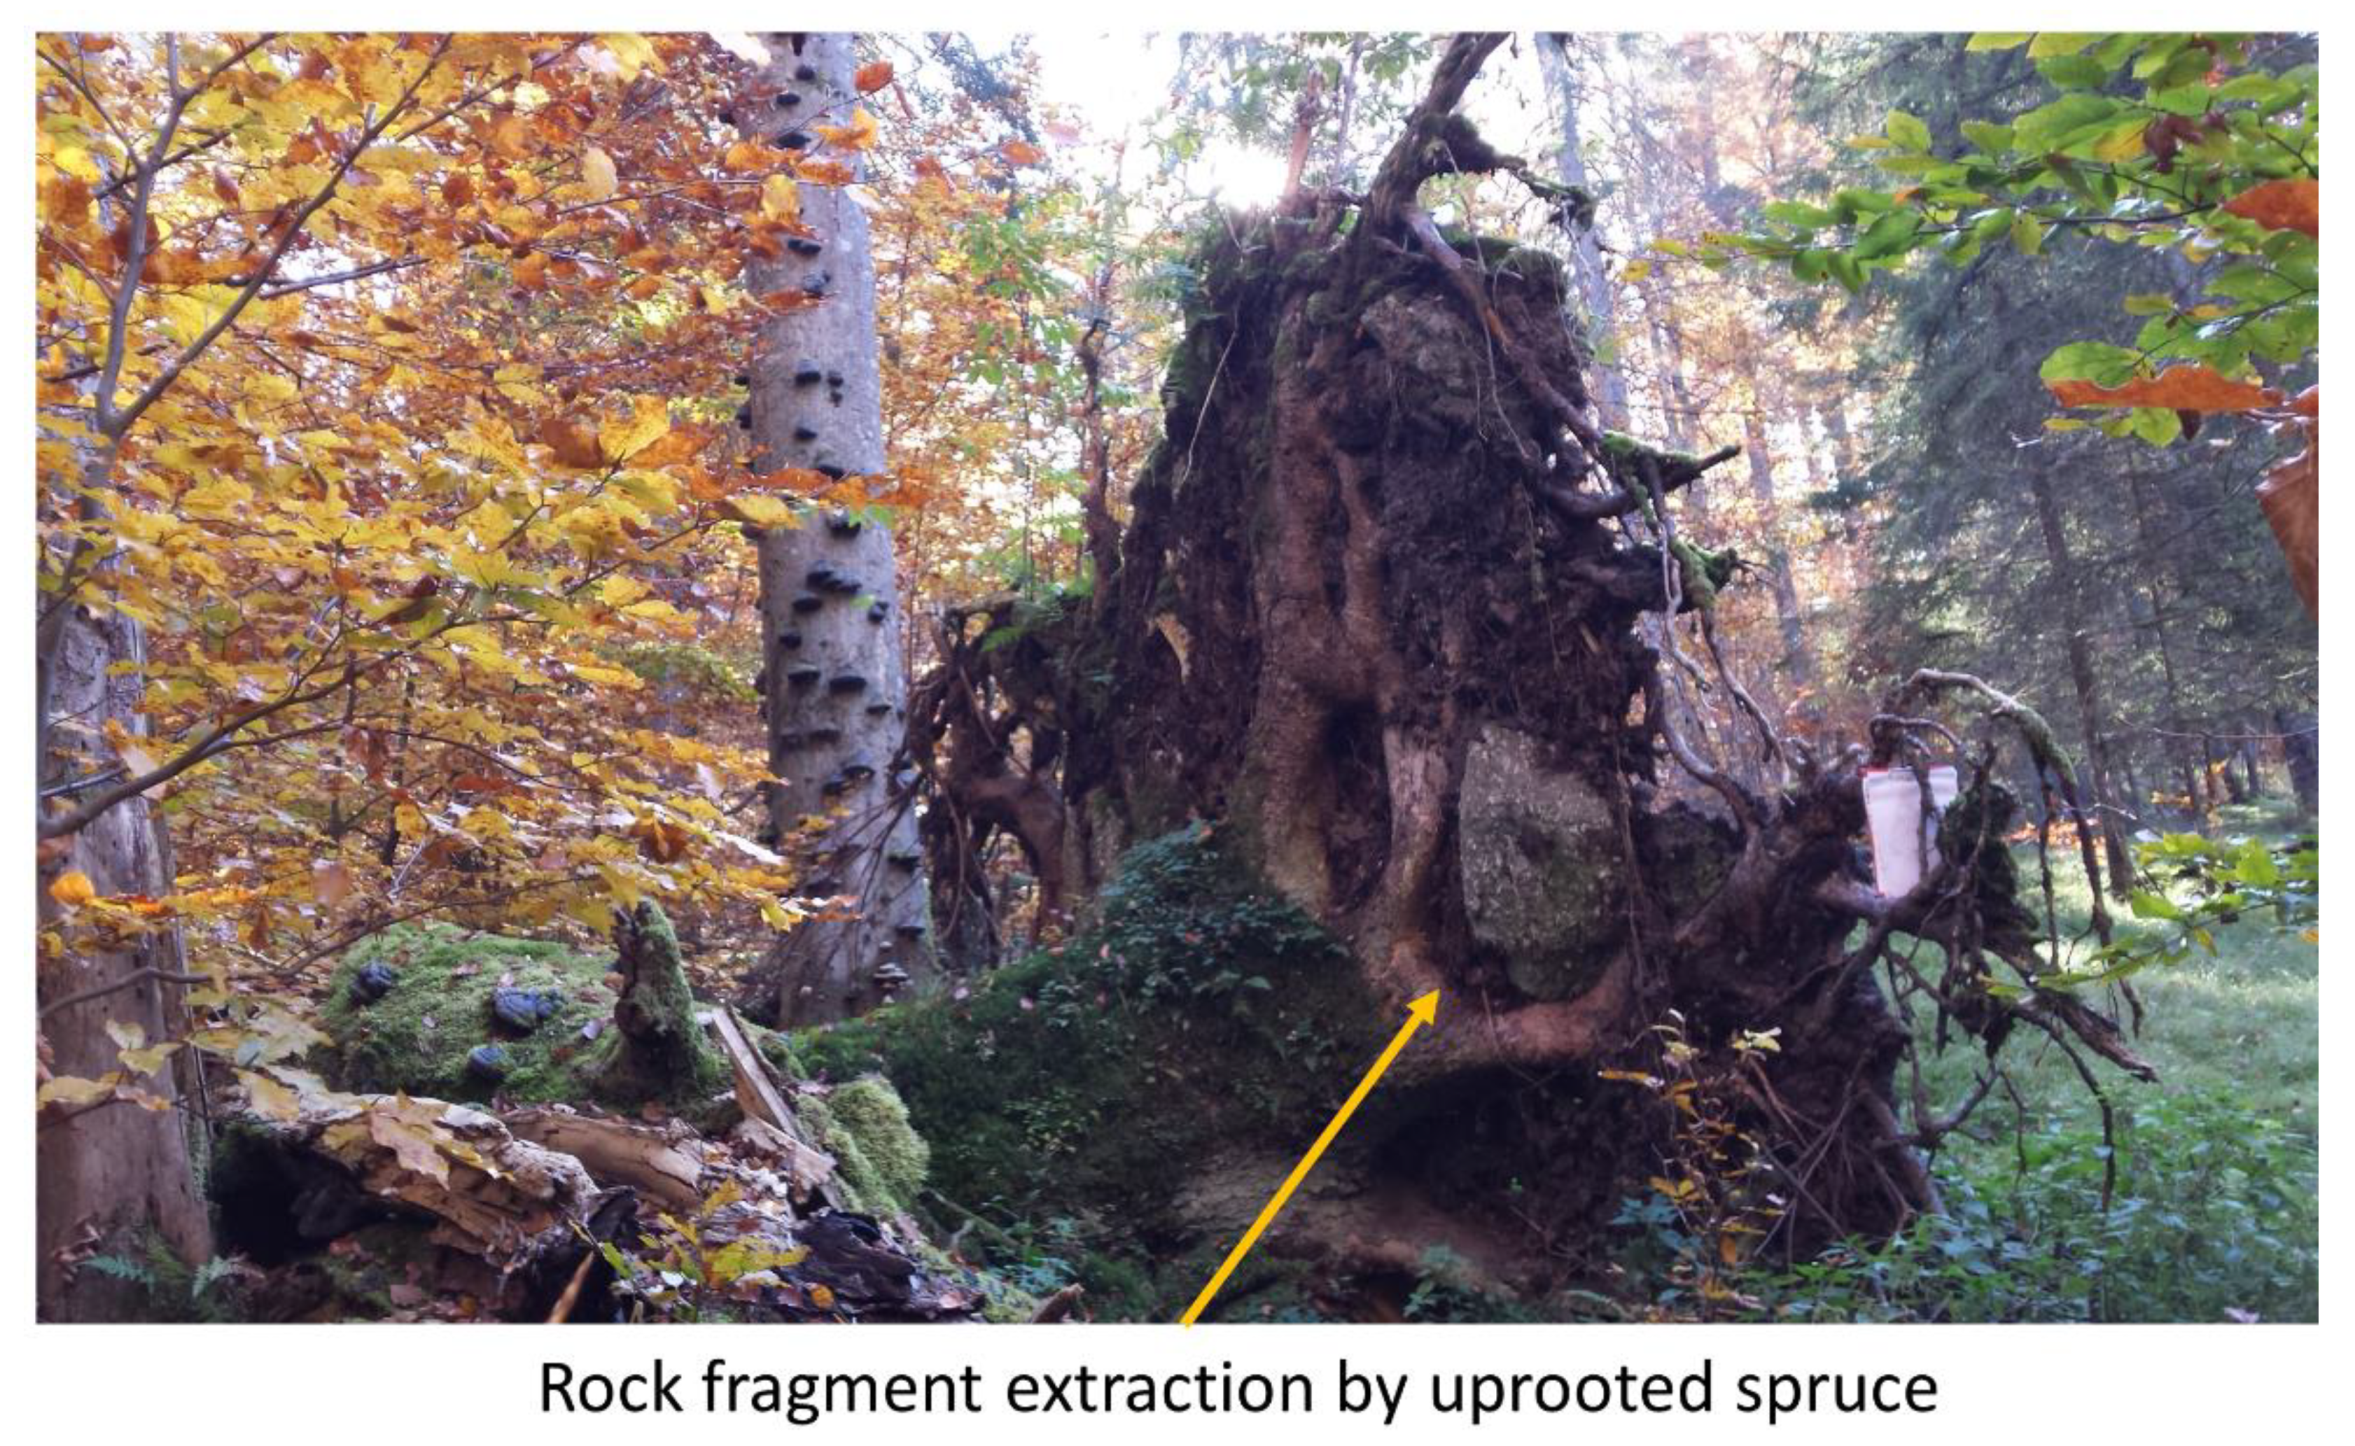
3.3. Relationships between Treethrow Density and Treethrow Depth and Soil Chemical Properties
Our field measurements in Zofin showed that the treethrow depth affected both the surface (0–15 cm) and the subsurface (~15–60 cm) layers, even though the mean value of the treethrow depth was 50 cm below the surface (
Figure S7). In total, 42% of trees had roots shallower than 25 cm in depth, 34% of trees had roots between 25–55 cm, 20% of trees had roots between 55 and 100 cm, and 4% of roots were deeper, with a maximum value of 190 cm (data not published).
Concerning correlations, in the case of the totally decomposed treethrows, the treethrow density showed highly significant correlations with most soil properties of pedogenic sources in both layers, but even more significant relationships in the subsurface layer (
p < 0.05,
p < 0.001). Some soil properties of external sources (C
ox, EA, Mg
2+, Ca
2+, K
+, Al(X)
1+, Al(Y)
2+) showed significant correlations only in the subsurface layer (
p < 0.1,
p < 0.05). Comparing soil units, most soil chemical properties of pedogenic sources showed significant correlations only in the Entic Podzols in both layers, but with even more significant relationships in the subsurface layer (
p < 0.1,
p < 0.05,
p < 0.001). No other important relationships were observed in the rest of the soil units. Generally, the significant correlations were negative in the surface layer, while some of the significant correlations were positive in the subsurface layer (
Table 4).
In the case of partly decomposed treethrows, we found significant correlations between treethrow density and some soil chemical properties. For example, we observed significant correlations in Mg
2+ and Al(Y)
2+ in the surface and CEC, and Al
3+, Al
KClsum, Al
KCl, and Fe
dit in the subsurface layers (
p < 0.05,
p < 0.1). Thus, we found more soil chemical properties with significant correlations in the subsurface layer than the surface layer. However, in the case of fresh treethrow, we did not observe important correlations between treethrow density and soil chemical properties (
Table 5).
Regarding treethrow depth, in the case of totally decomposed treethrows, the treethrow depth showed significant correlations with some soil properties in the surface (C
ox, K
+, Al(Y)
2+) and subsurface layers (Mg
2+, Al
ox, Si
ox). Regarding soil units, we found some soil chemical properties with significant relationships only in the Dystric and Haplic Cambisols in the subsurface layer. For example, C
ox, pH, Mg
2+, and Al (Y)
2+ in Dystric Cambisols and Al
ox, Si
ox, Mn
dit, and Si
dit in Haplic Cambisols showed the most significant correlations (
p < 0.1;
p < 0.05) (
Table 4). In the case of partly decomposed treethrows and fresh treethrows, we did not observe significant correlations between treethrow depth and soil chemical properties (
Table 5).
3.4. Effects of Soil Disturbance Regimes on Soil Chemical Properties
In
Section 3.3, we demonstrated the relationship between tree disturbances and soil chemical properties. In this section, we further investigate the effect of tree disturbances on soil chemical properties with a multivariate redundancy analysis. This analysis revealed that, for totally decomposed treethrows, treethrow density and treethrow depth explained 2.3 and 4.6% of the variation in soil chemical properties in the surface and subsurface layers, respectively. Regarding soil units, we found that the explanatory variables explained 4 and 6% of the variation in soil chemical properties only in the Entic Podzols in the surface and subsurface layers, respectively. In the case of partly decomposed treethrows, the explanatory variables explained 3.4 and 1.1% of the variation in soil chemical properties in the surface and subsurface layers, respectively. For fresh treethrows, the explanatory variables explained 2.1 and 1.1% of the variation in soil chemical properties in the surface and subsurface layer, respectively. In all cases of tree decomposition, most of the soil chemical properties of pedogenic sources and some soil properties of external sources, such as K
+ and Al
+3, could be explained by the explanatory variables both in the surface and subsurface layers. The Monte Carlo permutation test with 10,000 random permutations showed that the model was highly significant for all categories of treethrow decomposition (
p-value = 0.001) and both layers. For totally decomposed treethrows, treethrow density was highly significant (
p < 0.001) in both layers (
n = 287). Specifically, the treethrow density was significant (
p < 0.05) in the Entic Podzols in both layers (
n = 140). For partly decomposed treethrows, treethrow density was significant (
p < 0.05) in the subsurface layer (
n = 33). In the case of fresh treethrows, none of the explanatory variables were significant (
n = 102). However, depth of treethrow was not significant in any case (
Table 6).


