Article

Nonlinear Mixed-Effects Height to Crown Base Model for Moso Bamboo (Phyllostachys heterocycla (Carr.) Mitford cv. Pubescens) in Eastern China

1
International Center for Bamboo and Rattan, Key Laboratory of National Forestry and Grassland Administration, Beijing 100102, China
2
National Location Observation and Research Station of the Bamboo Forest Ecosystem in Yixing, National Forestry and Grassland Administration, Yixing 214200, China
3
Institute of Forestry, Tribhuwan University, Kirtipur 44600, Nepal
*
Author to whom correspondence should be addressed.
These authors contributed equally to this paper and share first authorship.
Forests 2022, 13(6), 823; https://doi.org/10.3390/f13060823
Submission received: 12 April 2022 / Revised: 22 May 2022 / Accepted: 24 May 2022 / Published: 25 May 2022
(This article belongs to the Special Issue Advances in Forest Growth and Site Productivity Modeling)

Abstract

:
Height to crown base (HCB) is an important variable used as a predictor of forest growth and yield. This study developed a nonlinear, mixed-effects HCB model through inclusion of plot-level random effects using data from 29 sample plots distributed across a state-owned Yixing forest farm in Jiangsu province, eastern China. Among several predictor variables evaluated in the analyses, bamboo height, canopy density, and total basal area of bamboo with a diameter larger than that of the subject bamboo individual contributed significantly to the HCB variations. The inclusion of random effects improved the prediction accuracy of the model significantly, indicating that the HCB variations within and across the sample plots were substantial. The model was localized using four sampling strategies, and the study identified that using two medium-sized bamboos by diameter at breast height per sample plot resulted in the smallest prediction error. This strategy, which would balance both measurement cost and potential error, may be applied to estimate the random effects and localization of the nonlinear mixed-effects HCB model for moso bamboo in eastern China.

1. Introduction

Since the signing of the Kyoto Protocol in December 1997, the ability of woody plants to store carbon has been widely examined [1,2,3,4]. The most important environmental services related to climate change and global warming are CO2 absorption from the atmosphere and carbon storage in the terrestrial ecosystem. Some bamboo species, including Makino bamboo (Phyllostachys makinoi) [5] and moso bamboo (Phyllostachys heterocycla (Carr.) Mitford cv. Pubescens) [1,3,4], can accumulate substantial amounts of biomass in a short period. The average annual carbon storage of moso bamboo is 2.39 times that of Cunninghamia lanceolata, and after 40 days of high growth, there could be an accumulation of 76% of carbon by mature bamboo [1,3]. Under the effective management, bamboo shoots mature into the culms in 5 years and can be harvested for different uses.
The sixth assessment report by the Intergovernmental Panel on Climate Change (IPCC) reports the average concentration of atmospheric CO2 as 410 ppm. Carbon sequestration by growing forests is a cost-effective option for mitigating CO2 emission caused by human activities [2]. Thus, the carbon cycle remains an important topic worldwide for research, and all green plants, including bamboo, play major roles for carbon storage. Although forest areas have continued to decline over the last 30 years worldwide, bamboo forests have increased at an average rate of 3% annually [6]. Bamboo forests play an important role in the mitigation of climate change. Therefore, they are among the most important forest types worldwide.
The bamboo canopy is an important part of the nutrient and energy exchange between bamboo and the environment. The canopy functions as an important site for physiological processes, such as photosynthesis and transpiration, and it drives nutrient absorption [7], which affects biomass production and distribution and bamboo quality. Bamboos share similar characteristics with trees, such as height, crown size, bole diameter, and HCB. However, because of unique characteristics, such as fast growth, high production efficiency, and rapid maturation, growth patterns of bamboo differ from those of tree species. In recent decades, carbon stock of moso bamboo forests has steadily increased, serving as a carbon sink in the subtropical region of China [2,8]. In addition to carbon fixing, moso bamboo forests also provide other ecosystem services, such as water storage, soil proliferation, and biodiversity enhancement [9], which are important forest ecosystem functions.
Bamboo crown ratio (ratio of crown length to height) is a key index for evaluating the vitality and quality of bamboo. The crown ratio can be used as an important predictor variable in forest growth and yield models [10,11]. Several studies calculated crown length by measuring total height and HCB [12]. Analyzing and understanding crown ratio is important for determining the vitality and production efficiency of bamboo.
Crown ratio can be measured directly or indirectly using HCB model. HCB, which is height of the first living branch from the ground [13], is necessary for estimating the crown ratio. Knowledge of HCB provides some advantages, such as determination of canopy change patterns and prevention of potential forest fires. Due to high stand density of bamboo forests and difficulty in distinguishing each bamboo crown, measuring HCB is usually challenging, time-consuming, and expensive [14]. Therefore, estimating HCB using an established HCB model is a better alternative for forest managers.
Studies report negative correlation between HCB and utilization rate of bamboo culms and the size of bamboo crowns [15,16,17,18]. The HCB model can predict bamboo canopy size, which is important for physiological processes, such as photosynthesis, transpiration, and nutrient absorption. Bamboo canopy affects the production and distribution of bamboo forest, and, consequently, carbon storage of bamboo forests. The HCB models developed so far are based on data from various tree species [11,19,20,21]; however, bamboo HCB models are not available in the literature. Data typically used for HCB modeling are hierarchically structured, and observations within the subject (sample plot and culm) are most likely correlated. Mixed-effects modeling, which effectively addresses these problems, is a possible solution. Thus, nonlinear mixed-effects (NLME) modeling has been frequently used in forest modeling in recent years [22,23,24,25]. The NLME model predicts a response variable with or without the estimated random effects from prior measurements of the response variable of interest [23,24].
This study uses moso bamboo distributed mostly in tropical and subtropical regions of Asia. Moso bamboo provides wood and food for humans and has economic and ecological benefits [26,27].
Given the importance of moso bamboo, which lacks quantitative investigation, such as HCB modeling, this study thus aimed to: (1) develop an NLME HCB model for moso bamboo forests and (2) determine the optimal number of bamboo individuals per sample plot, which is necessary to estimate the random effects and calibration of a NLME HCB model. Results of this study will be useful for carbon accounting and management of bamboo forests in eastern China.

2. Materials and Methods

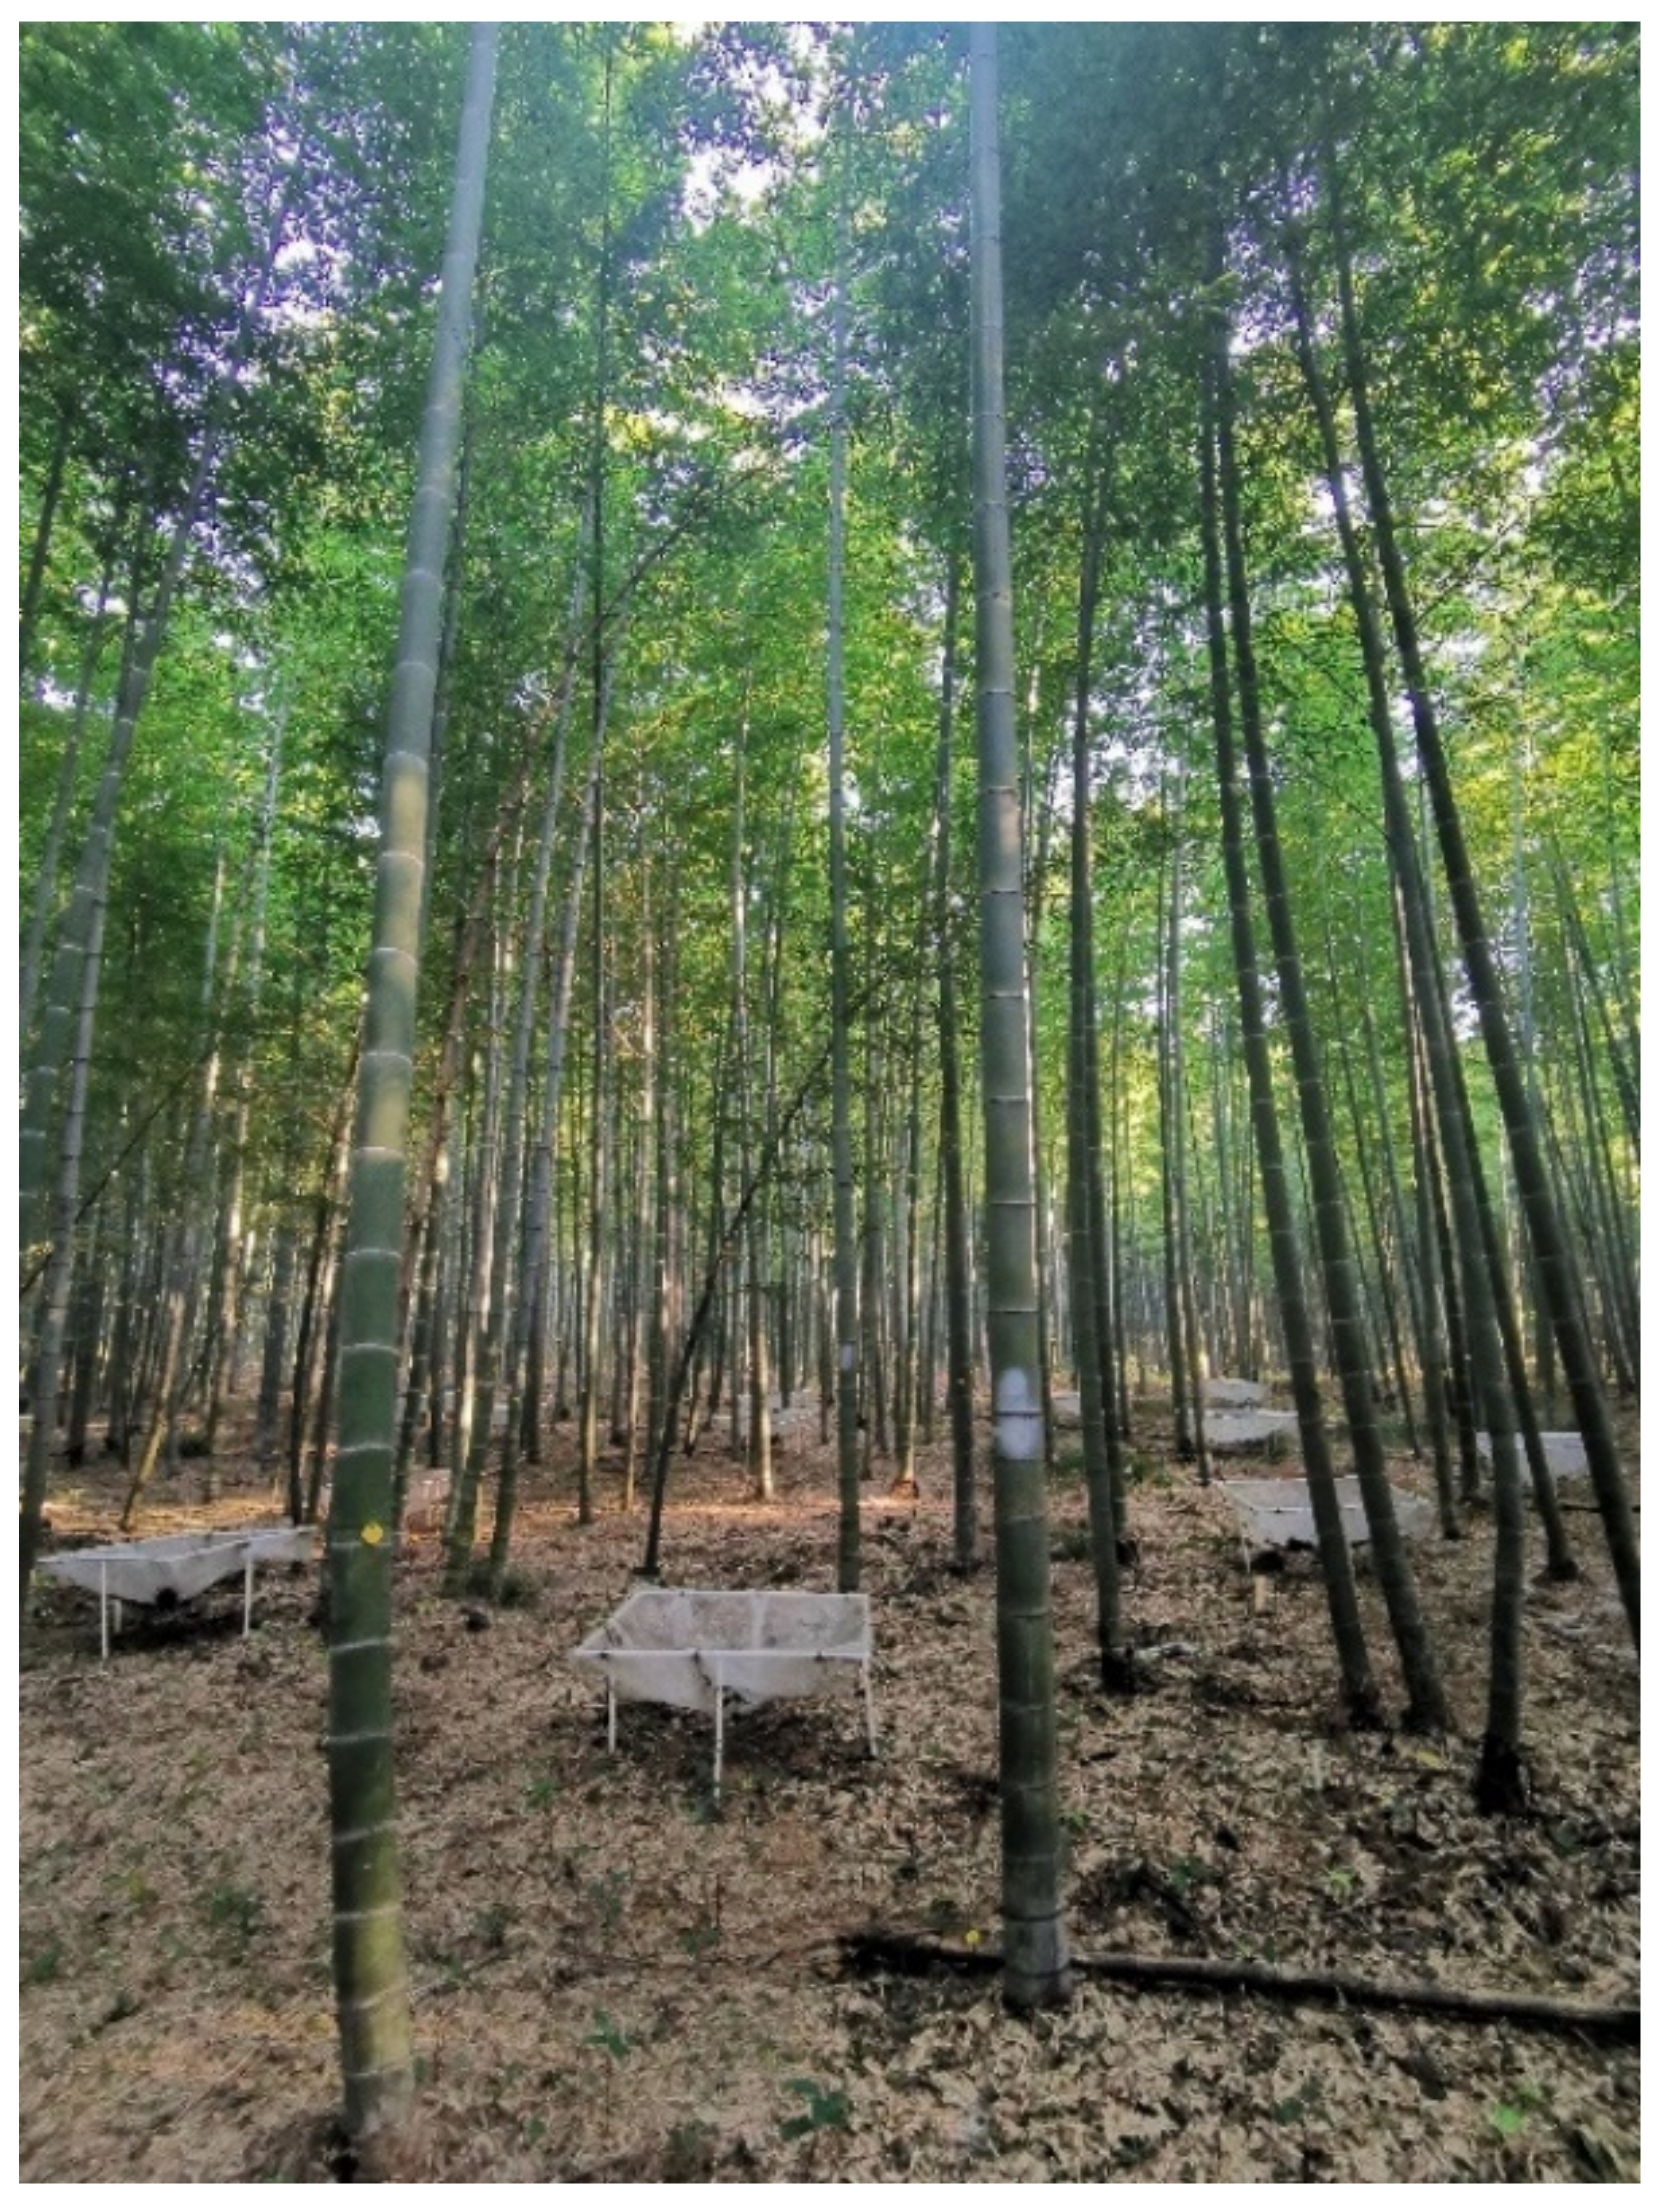
2.1. Study Area and Data

The study was conducted in a state-owned bamboo forest farm in Yixing, Jiangsu Province (31°15′01′′–31°15′40′′ N, 119°43′52′′–119°44′41′′ E) (Figure 1). The area has a subtropical monsoon climate. Affected by Taihu Lake and the ocean, the annual precipitation and heavy rainfall are unevenly distributed in time and space throughout the year. Precipitation was concentrated in the summer. The average annual precipitation is 1805.4 mm, and the summer precipitation accounts for half of the annual precipitation. Annual average maximum and minimum temperatures are 20–24 °C and 12–14 °C, respectively.
In total, 29 temporary sample plots (20 m × 3 m) were established, covering a wide range of stand conditions, and bamboo data collected from 229 bamboo individuals from July through September, 2019 (Figure 1 and Figure 2). Sample plots were selected to provide representative information for a variety of bamboo stand structures, densities, heights, ages, and site productivity. Parameters measured in each sample plot were height to crown base (HCB), bamboo height (H), and diameter at breast height (DBH). Ultrasonic altimeter was used to measure H and HCB. The canopy density was measured using fisheye lenses. Scatter plots distributions between height to crown base (HCB) and different predictor variables are shown in Figure 3. The 29 sample plots were randomly split into two groups: 24 plots with 195 bamboo individuals were used for model fitting, while five plots with 34 bamboo individuals were used for model validation (Table 1). Figure 2 shows the characteristics of bamboo in this area (stand density is high and bamboo crown is not easy to distinguish), indicating the importance and urgency of building HCB model.

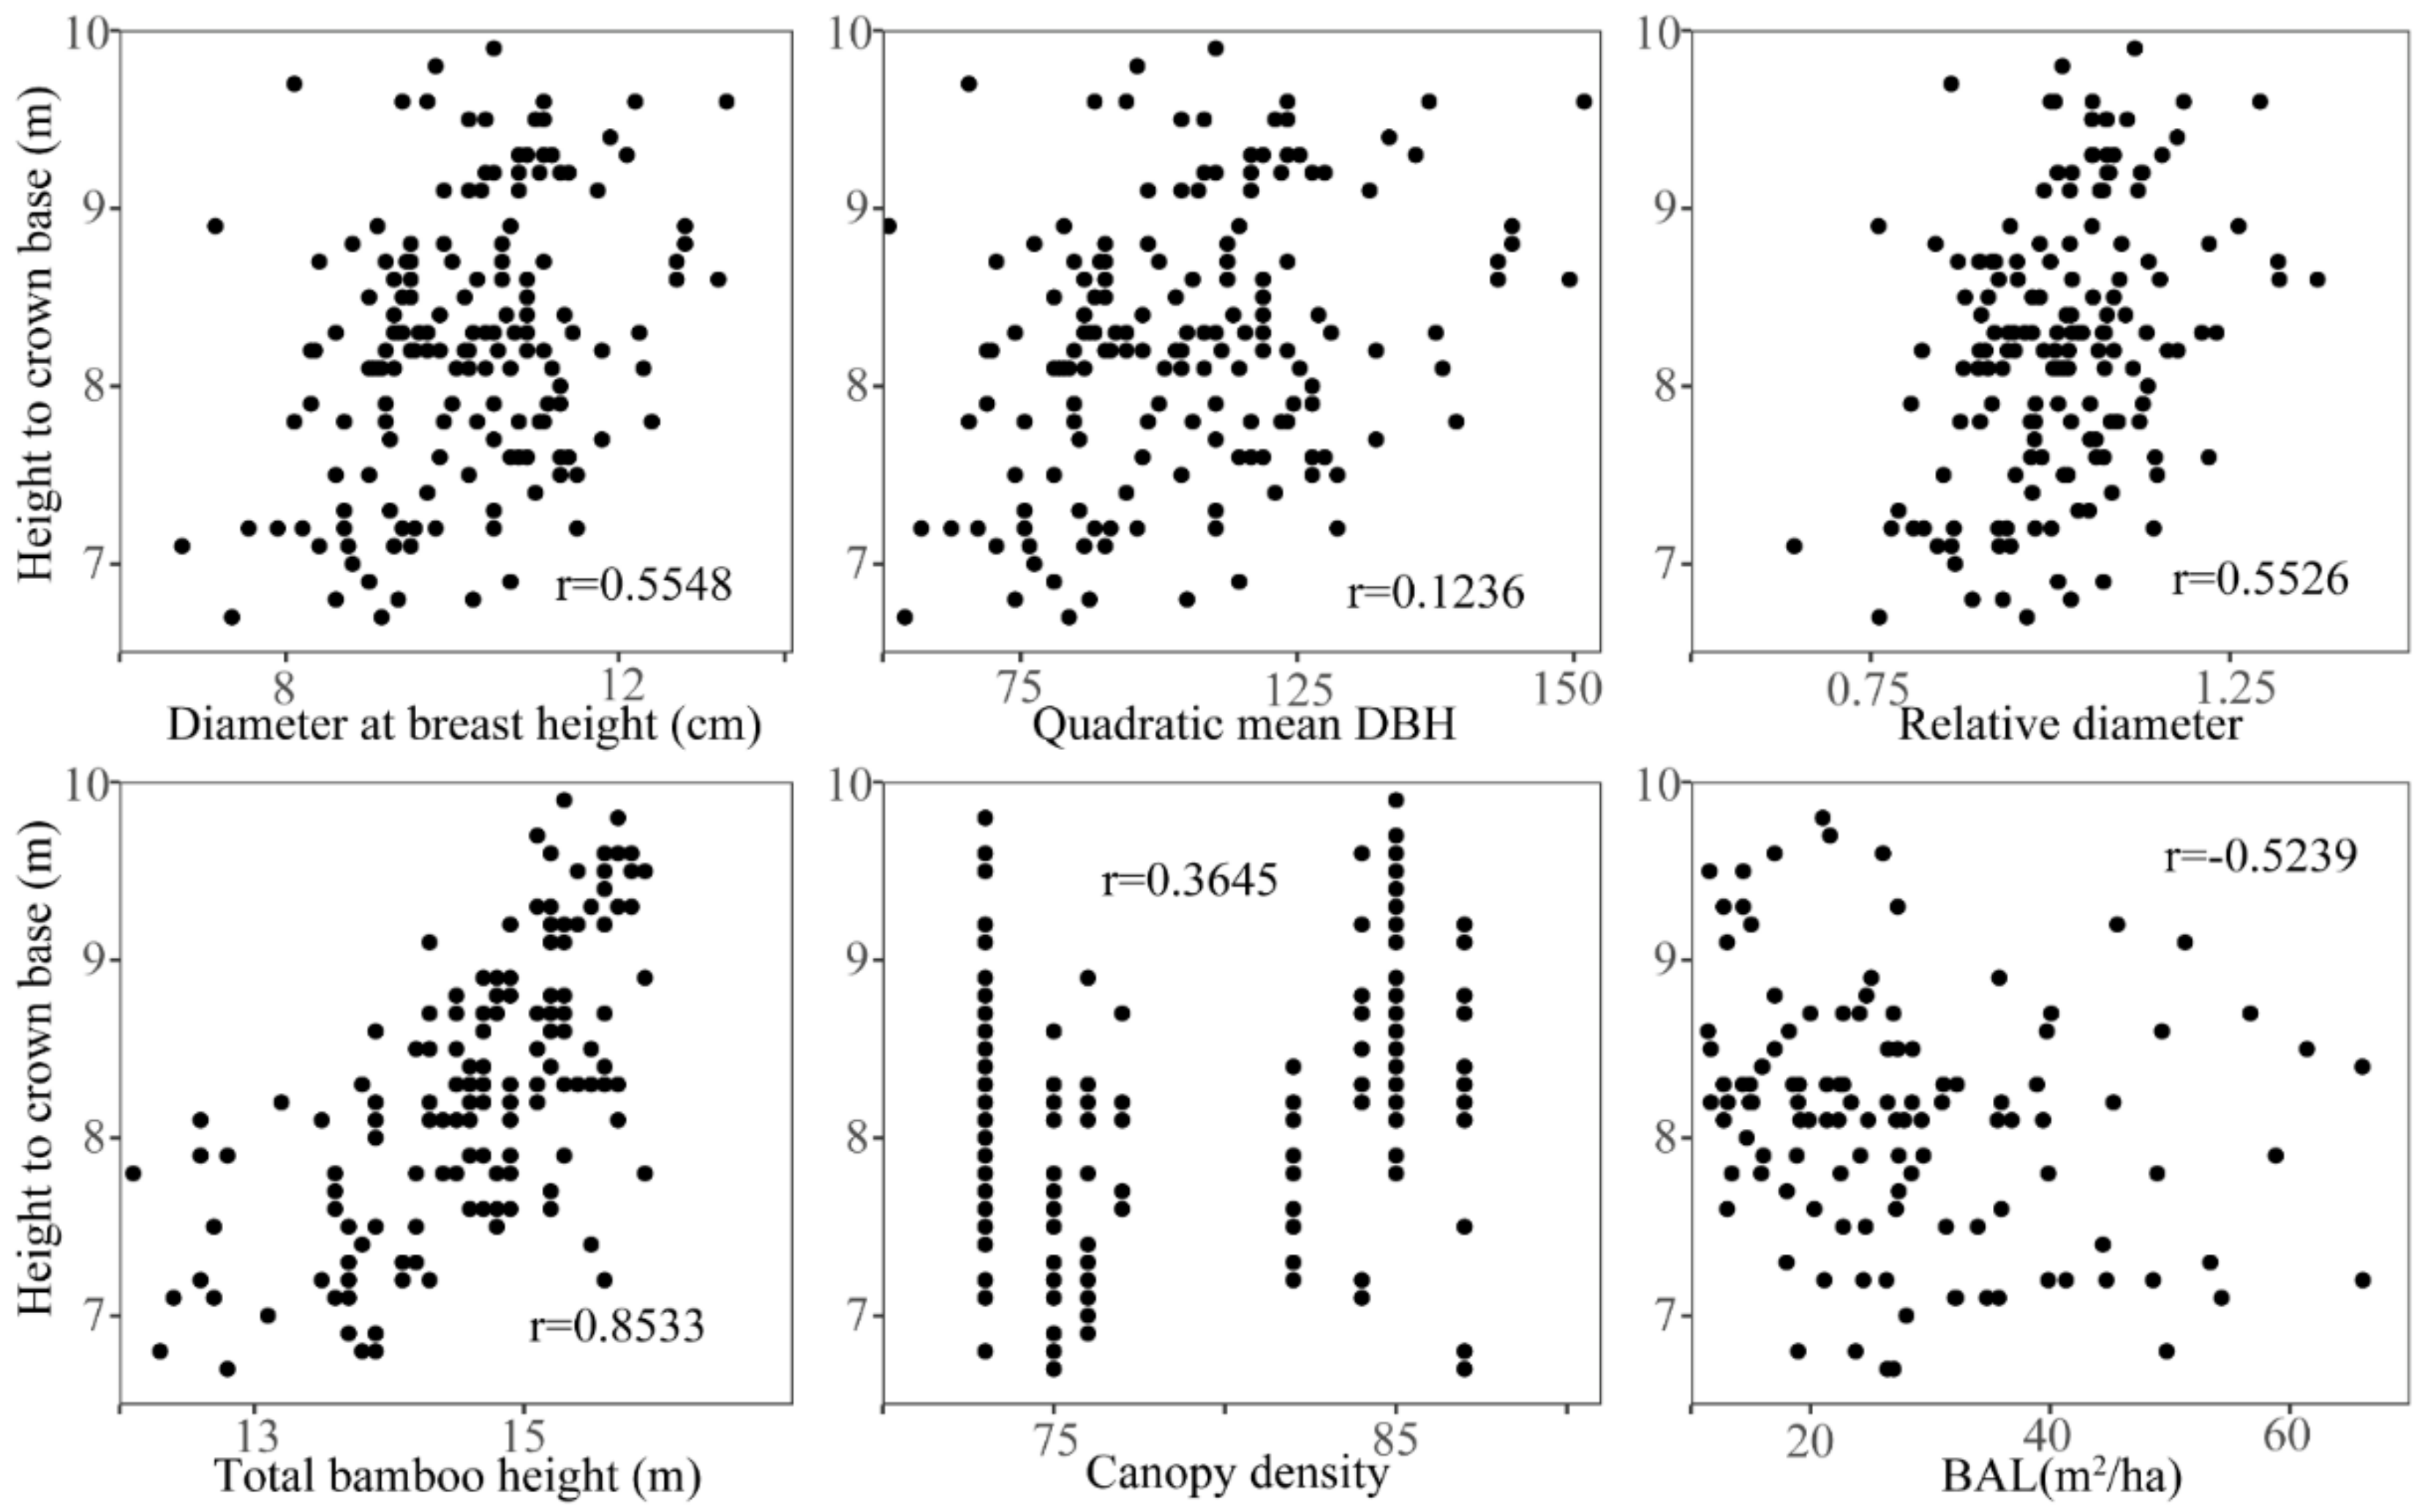
2.2. Selection of Predictor Variables

Owing to similarities between moso bamboo and tree species, such as height, crown size, HCB, and bole diameter, HCB modeling methods for trees were adapted for bamboo HCB modeling.
Evaluation was conducted for the factors affecting HCB, such as bamboo size, health and vigor, and site characteristics, and potential effects of eight variables on the HCB variations. Predictor variables selected were not significantly correlated among themselves and showed considerable contributions to the HCB models. Multicollinearity among the independent variables was verified with the variance inflation factor (VIF). According to a common rule-of-thumb, multicollinearity among variables was considered to occur when VIF > 5 [28]. Thus, the variance inflation factor (VIF) was used to examine whether variables would be collinearity with each other, and variables with VIF < 5 were retained in our final models.

2.3. HCB Model Development

2.3.1. Base Model

Three versatile growth functions for HCB modeling (Table 2) were selected from several previously reported functions [11,20,21]. These basic functions and their corresponding NLME versions were fitted to determine the best-performing model for further analyses using nonlinear least square regression. Although DBH and diameter larger than that of the subject bamboo individual (BAL) could have a linear relationship, their separate contributions to the HCB model were investigated, and the parameter that contributed the most to this study’s final HCB model was selected.
The most common statistical measures (Equations (1)–(4)) were used to evaluate fitting performance of the basic models: the model with largest pseudo coefficient of determination ( p s e u d o R 2 ) and smallest mean residual error ( e ¯ ), root mean square error ( R M S E ), and total relative error ( T R E ) was selected for further analyses.
e ¯ = 1 n i = 1 n ( H C B i H C B ^ i )
p s e u d o R 2 = 1 i = 1 n ( H C B i H C B ^ i ) 2 / i = 1 n ( H C B i i = 1 n H C B i n ) 2
R M S E = 1 n i = 1 n ( H C B i H C B ^ i ) 2
T R E = i = 1 n H C B i H C B ^ i / i = 1 n H C B ^ i
where H C B i and H C B i ^ are the measured and predicted H C B values for bamboo i respectively, and n is the number of observations.

2.3.2. Mixed-Effects HCB Model

The NLME HCB models were established using the appropriate predictor variables and random effects at sample plot-level. All combinations of fixed and random effect parameters were considered to determine the most appropriate association in the model. The NLME model would have a within-sample plot variance-covariance matrix of the error term, which is defined as:
R i = σ 2 G i 0.5 Γ i G i 0.5
where R i is the variance-covariance matrix of error, σ 2 is a scaling factor of the error dispersion, G i is the n i × n i diagonal matrix, which is the expression of the within-sample plot heteroscedasticity variance, and Γ i is the n i × n i matrix showing the within-sample plot autocorrelation error structure. As the residual analysis showed insignificant effects of heteroscedasticity and autocorrelations, both G i and Γ i were reduced to the identity matrices. See for detailed explanation and calculation method in the mixed-effects modeling literature [22,30].
Vector μi of the random effects (ui1, ui2, ui3) in these models (Equations (M7) and (M8) ) was assumed to have a multivariate normal distribution with zero mean and plot variance–covariance matrix D, defined by Equation (6).
D = σ μ i 1 2 σ μ i 1 μ i 2 2 σ μ i 1 μ i 3 2 σ μ i 2 μ i 1 2 σ μ i 2 2 σ μ i 2 μ i 3 2 σ μ i 3 μ i 1 2 σ μ i 3 μ i 2 2 σ μ i 3 2

2.4. Parameter Estimation

Basic models were estimated using the nonlinear least square regression, and parameters of the NLME HCB models were estimated with the NLME package in R software (version 4.1.1) using the maximum likelihood method. Fitting performance of the basic models was evaluated using the statistical measures presented in Equations (1)–(4). Subsequently, the model with the best-fit statistics was selected for further analyses.

2.5. Prediction with NLME Models

The best fitting base model with the selected predictor variables was used to formulate a one-level NLME HCB model by introducing sample plot-level random effects into the model. The NLME model alternatives that resulted from all the possible expansion combinations of fixed-effects parameters with the random effects were fit to the data. The resulting model with the smallest AIC, BIC, and the largest log-likelihood (LL) was selected for further analyses. To avoid the problems due to over-parameterization, we performed a likelihood-ratio test (LRT) [31].
The model with the best-fit statistics could be applied for HCB predictions, either with the random effects included (subject-specific model) or without random effects (M response: only a fixed part of the NLME) included into the model. However, M response did not provide a high prediction accuracy; therefore, the estimated random effects should be added to the M response for high accuracy. The empirical best linear unbiased prediction (EBLUP) theory (Equation (7)) [22,30] was used to estimate the random effects and calibrate the NLME HCB model.
μ ^ i = ψ ^ Z i T ( R ^ i + Z i ψ ^ Z i T ) 1 e i = ψ ^ Z i T ( R ^ i + Z i ψ ^ Z i T ) 1 [ y i f ( β ^ , μ i * , x i ) + Z i μ i * ]
where μ ^ i is the estimated random effects for the ith sample plot (I = 1,…, M); f ( ) is the NLME HCB model; β ^ is the vector of the fixed effects β ; x i is the vector of the predictor variables; ψ ^ is the estimated variance-covariance matrix for the random effects μ i (i = 1,…M); R ^ i is the estimated variance-covariance matrix (Equation (5)) of the errors e i ; and Z i is the n i × q design matrix of the partial derivatives of the estimated NLME HCB model f ( ) with respect to the random effects u i .

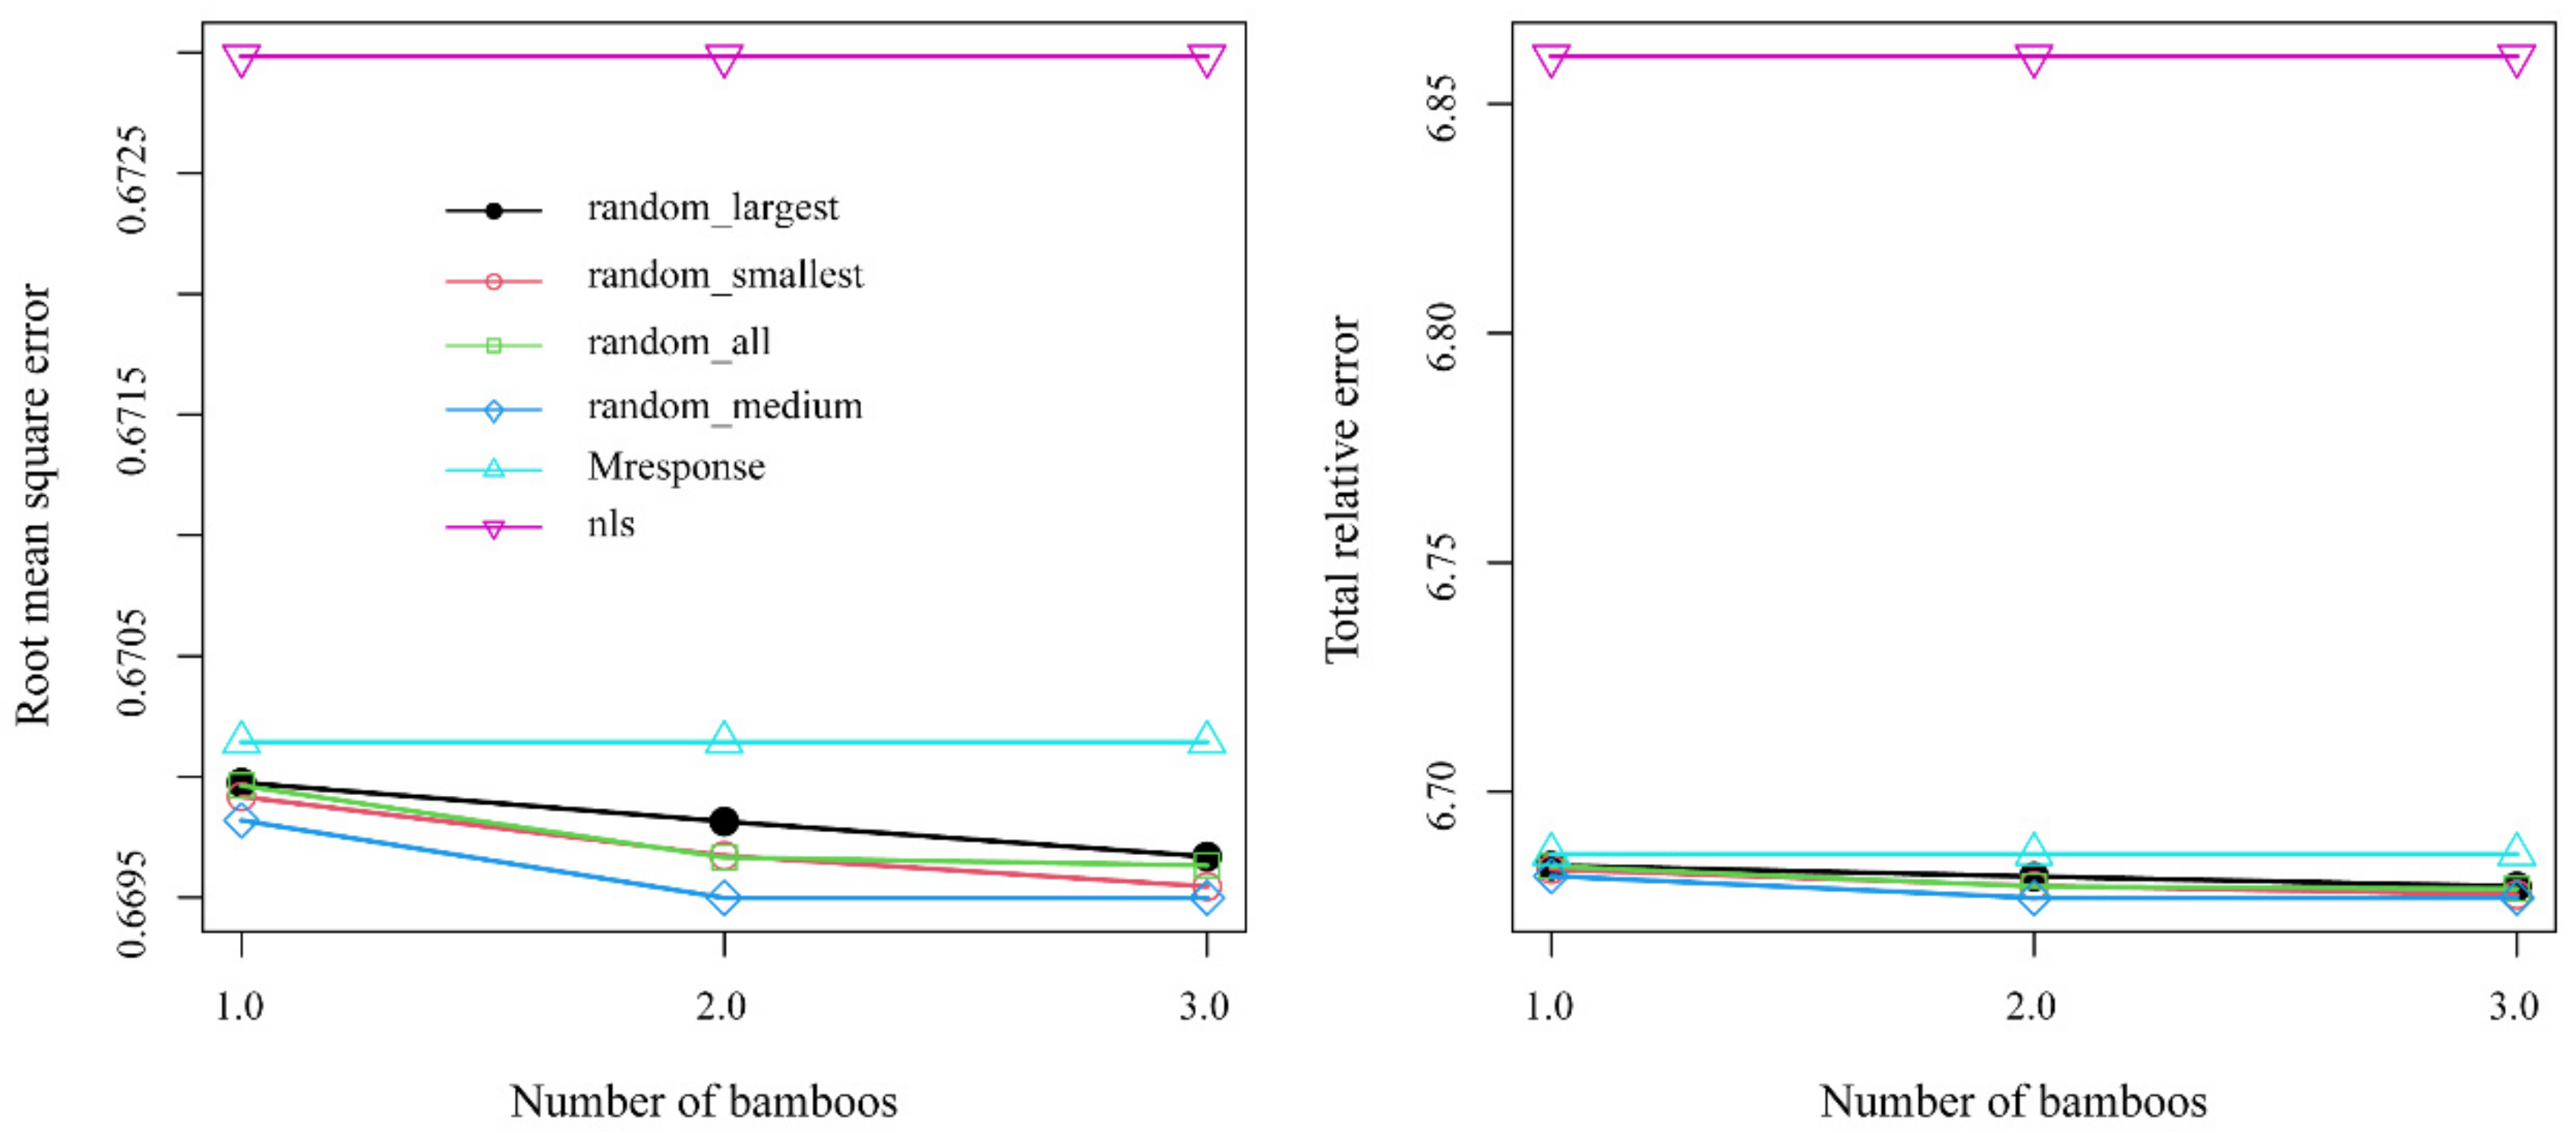
2.6. Response Calibration or Localization of NLME HCB Model

Multiple strategies were considered to select the appropriate number of bamboo individuals and their sizes per sample plot to estimate the random effects of NLME model. Forest modeling studies have shown that the optimal number of sample trees per sample plot can be used to estimate random effects [11,20,24,28]. However, none of these studies were conducted for bamboo NLME modeling. Therefore, considering the importance of determining the optimum number of bamboo individuals per sample plot, the following selection strategies were used to estimate random effects and identified the optimal number:
(i).
The 1–3 randomly selected bamboo plants per sample plot (random);
(ii).
The 1–3 bamboo plants with an average DBH per sample plot (medium);
(iii).
The 1–3 bamboo plants with the largest DBH per sample plot (largest);
(iv).
The 1–3 bamboo plants with the smallest DBH per sample plot (smallest).
Under the same sampling strategy mentioned above, some studies repeated 40 times and showed robust results [11,20,24]. In this case, (though sample data used in the current study is relatively small), in order to ensure the stability of the results. Each strategy was repeated 100 times to compute the prediction statistics, such as RMSE (Equation (3)), and TRE (Equation (4)), and evaluate the accuracy of each strategy.

2.7. Evaluation of Prediction Performance of NLME HCB Model

Validity of the final NLME HCB model was assessed using an independent dataset consisting of 34 bamboo individuals from five randomly allocated sample plots. The deviations of the predicted HCB from the observed HCB were used to compute e ¯ , p s e u d o R 2 , R M S E , and T R E (Equations (1)–(4)).

3. Results

3.1. Selection of Predictor Variables

Only three variables were retained in the final NLME HCB model based on the VIF criterion (VIF < 5), which is commonly used for variable selection, such as bamboo height (H), canopy density (CD), and diameter larger than that of the subject bamboo individual (BAL) (Table 3). These three variables had significant contributions to the HCB variations (Figure 3).

3.2. Base Model

Each basic function was expanded (Table 2) by including three predictor variables identified (H, CD, and BAL) (Table 4). The parameter estimates and fit statistics for these models are presented in Table 5. All parameter estimates were significant (p < 0.05), except β 2 of M5. HCB was negatively correlated with both the BAL and CD. Compared with M4 and M6, M5 fitted relatively poorly. The fit statistics calculated using the model fitting dataset for M4 and M6 shows that each model performed almost identically; hence, M4 and M6 were selected to build the NLME HCB model.

3.3. NLME HCB Models

By incorporating random effects to account for sample plot-specific effects, M4 and M6 were used to expand as NLME HCB models (Table 6). Table 7 presents the parameter estimates and fit statistics for these models. Compared with the models without random effects (M4 and M6), T R E and R M S E of the NLME models (M7 and M8) largely decreased while pseudo-R2 increased. Compared with the model index of M6, T R E and R M S E of M8 decreased by 20.23% and 10%, respectively, pseudo-R2 increased by 7.33%. No significant heteroscedasticity existed in the residuals of these models (Figure 4).
The AIC, BIC, and -2log likelihood values of different models are shown in Table 8. The AIC, BIC, and -2log likelihood calculated by the model with the random effects parameters is smaller than that of the model fitted with the ordinary least square regression method (also known as traditional modeling method). It indicates that adding random effects parameters does not lead to over parameterization, and could prove that the mixed-effects model was more appropriate than the traditional model for HCB modeling.

3.4. Model Evaluation

Table 9 presents prediction statistics of the NLME HCB models (M7 and M8) based on the validation data. The mean prediction bias for these models did not differ statistically (p > 0.05). Compared with the models fitted without random effects (M4 and M6), their corresponding NLME model counterparts had the smaller e ¯ , R M S E , and T R E , and larger p s e u d o R 2 . M8 outperformed M7 in both the fit and prediction statistics. As M8 has simpler structure than M7, it is preferred for recommending for prediction of the moso bamboo HCB.

3.5. Model Prediction

Four selection strategies were considered for random effects prediction using EBLUP theory, and calibration of the best fitted NLME HCB model (M8) (Equation (6); Figure 5). Each of the four strategies yielded similar R M S E and T R E values.
Regardless of the number of bamboo samples (1–3 bamboo individuals per sample plot) used in the calibration, the R M S E and T R E of M8 were smaller than those of the M response and M6 model. The prediction accuracy of M8 increased gradually when more bamboo individuals were used to estimate random effects. When two randomly selected average-sized (in terms of DBH) bamboo individuals per sample plot were used to estimate random effects, M8 produced the smallest R M S E and T R E values.
As the number of bamboo individuals increased, the R M S E decreased (Figure 5). The use of average-sized bamboo per sample plot led to the largest reduction in RMSE and TRE values compared to those of M response. R M S E and T R E can be further reduced by using a larger number of average-sized bamboo individuals in the calibration. Owing to reduced data collection time and cost of two average-sized bamboo individuals per sample plot, applying this strategy to the NLME HCB model (M8) could produce the desired accuracy and efficiency.

4. Discussion

Due to the uncertainties and complexity of the growth processes of bamboo forests, we lacked an effective tool or method to determine a reasonable combination of variables (tree-level, stand-level, and climate) and their interactions with the stand-specific conditions for predicting HCB. HCB has a certain maximum growth, which could be represented by horizontal asymptote (maximum-bamboo height). In forestry, logistic and exponential functions are widely used in the forest mortality [24,25], height growth [32], and DBH growth [33,34], and so on. Therefore, this study selected three model forms that are commonly used in the previous modeling studies [10,28,29], and they all have horizontal asymptotes.
This study compared the fitting performances of three basic forms of the HCB models selected from literature [11,20,21]. Afterward, the best-performing basic functions were used to develop NLME HCB models. The variance influencing factor (VIF) was used as a collinearity control metric, and only three variables (H, CD, and BAL) with no multicollinearity effects were used for establishing the NLME HCB models (Table 3). Additionally, random effects at the sample plot level were included in the model, which substantially improved the NLME HCB model. Because of within- and across-sample HCB variations in the plots, estimated random effects were significant, justifying the application of the mixed-effects modeling. Bamboo and trees have similar characteristics, including height, crown size, bole diameter, and HCB; therefore, frequently used basic functions for HCB modeling of trees conveniently described large variations in the HCB of bamboo.
Moreover, other HCB modeling studies (e.g., Sharma et al., 2017; Fu et al., 2017; Yang et al., 2020) reported tree height as an important variable predictor in HCB models [11,19,20]. The height growth of bamboo is almost completed in the first year followed by radial growth, suggesting that height is an important attribute of bamboo as it determines canopy structure and production potential [3,20]. DBH is the most reliable and easily measurable variable in the field and may also be an important contributor to HCB variations. However, this study did not investigate this character because BAL provided a better fit for the model and was retained in the final model (Table 5). This is because that a significant correlation exists between DBH and BAL, and BAL better expresses the competitive interaction among bamboo individuals in the culm. Combining H and BAL is possibly the most effective predictor variable and is often used to describe tree vigor and competitiveness [21]. CD is an important stand characteristic of bamboo, as it reflects bamboo stand structure, growth, and vigor. In this study, CD had a certain impact on HCB (Figure 3), and the parameter estimate of M8 was significantly negatively correlated (p < 0.05). (i.e., with larger CD, there would be smaller HCB). Notably, CD has not been used as a predictor in any previously developed HCB models, confirming the novelty or our study.
There are some reports of the possible significant impact of aspect, slope, slope position, stand age, and stand density on HCB [17,18,32]. We also attempted to evaluate these variables in our study; however, model precision was not significantly improved. This might be because of correlations between these variables and other predictor variables retained in the final model. The HCB model may use various predictor variables, such as variables describing site productivity, stand structure and density, and growth of bamboo attributes, which largely affect HCB. Although stand density (number of trees per hectare) would be one of the most important contributors to HCB models [21,35], it was not observed in our study. Bamboo has two developmental stages, with the culm height growth stage being the first. Once maximum height is reached, the second stage begins, which is characterized by increased culm strength through the accumulation of dry mass until maturity [3,5]. Our study mainly focused on the second stage of bamboo forest growth when height stops increasing and bole thickening occurs, possibly causing the insignificant effect of stand density on HCB.
In this study, the over parameterization problem did not occur, and adding random effect parameters in the model produced better fitting effects than the model estimated with traditional modeling (Table 8). Introducing too many tree-level and stand-level variables may significantly improve the prediction accuracy of HCB model, but models might not be converged with global minimum, and estimated model could have large bias due to over parameterization [11,31]. In addition, adding many predictors to the HCB model will increase the cost of forest inventory. Therefore, a simple model with a reasonable accuracy is the first choice for effective forest management.
Relative spacing may influence tree height and crown base relationships [21,36]. However, we did not apply this to our study, because the bamboo stand density did not change. Annual bamboo shoots possibly lead to a change in the stand density, and bamboo is cut down 4–6 years after it is unearthed.
The fit statistics were significantly improved when the random components describing the sample plot-level effects were included in the HCB models. DBH and height growth of bamboo were largely different in the different sample plots, and, consequently, HCB differed within and across the sample plots. DBH can reflect the competitive ability and vitality of bamboo [11,21], which is also similar to that by BAL and CD.
The mixed-effects HCB model can be used with or without prior measurement of a response variable of the interest (HCB, in this study). Calibration of NLME HCB model through a prior measurement of HCB for only a few bamboo samples may reduce the measurement costs and increase the prediction accuracy [20,23,24,37]. Some variables that may significantly influence HCB were not measured in the field, but their potential effects were captured by a few samples used in calibration.
Several modeling studies in forestry have proposed an optimal sample size for calibrating NLME models [11,20,24,38,39]. All these studies show higher prediction accuracies with increasing sample size used in calibration [19,35,40], which is consistent with the results of our study (Figure 5). However, in general, using a large sample size for calibration is not practically justifiable, as this requires higher inventory cost. Thorough analyses of four strategies aided for proposing optimal size in our study, which is two average-sized bamboo individuals (in terms of DBH) per sample plot, because of a high prediction accuracy (Table 8; Figure 5). This strategy could optimize prediction accuracy and possibly reduced the model application cost. Our study aimed at finding the sampling strategy that corresponds with maximum decline rate of errors ( R M S E and T R E ).
The HCB, whether measured directly in the sample plot or estimated using the HCB model, is very important. Information, such as canopy change, forest fire potential, and change in carbon storage, can be obtained from the bamboo HCB estimates. As acquiring HCB data at a large scale through field measurements is relatively costly and time-consuming, light detection and ranging (LiDAR) method, which provides high accuracy for stand height on the rugged or irregular terrains [41], is a better alternative for data acquisition strategy in bamboo forests. In future, HCB model developed in this study with LiDAR data can be used to predict bamboo HCB for other regions of China. Compared with total height, HCB determination is more difficult with LiDAR; therefore, bamboo height was included as a predictors in the HCB model.
RMSE are statistically identical (Figure 5), which may be due to small number of bamboo individuals in each sample plot. However, when increasing the number of samples bamboos, RMSE and TRE showed a downward trend. Our study will provide a cost-effective method of sample plot investigation in future.
At present, there are only a few studies on the HCB modeling, especially using the mixed-effects HCB modeling, which have also adopted various sampling strategies in calibration and identified an optimal size of sample for predicting HCB [11,20]. However, most of these studies focused on arbor forest. Bamboo has unique characteristics, such as faster growth rate, shorter rotation, higher productivity, and more early maturation than other forestry crops. The greater HCB of bamboo, the higher would be the utilization efficiency of the bamboo culm [15,16,17,18]. Some studies have established bamboo height-DBH models [3,4,5,27]. Because of measurement difficulty and higher cost of biomass sampling of bamboo forests, our model can be combined with existing bamboo height-DBH models for more accurately estimating biomass, and thus more precise estimates of carbon storage can be obtained using the carbon conversion coefficients. These results may provide a good reference for bamboo forest management in the context of climate change. Our model is simpler to apply and can greatly reduce the workload of forest survey.

5. Conclusions

Nonlinear mixed-effects height to crown base (HCB) models were developed using three predictor variables (bamboo height, canopy density, and total basal area of all the bamboos with diameter larger than that of the subject bamboo) for moso bamboo in eastern China. Prediction accuracy of the HCB model significantly improved when sample plot-level random effect was included in the HCB model. Among the four sampling strategies evaluated in calibrating NMLE HCB model, the strategy of two average-sized bamboo individuals (in terms of DBH) provided the smallest prediction error, which may be an appropriate compromise between measurement cost, model use efficiency, and prediction accuracy. Findings of this study can be combined with bamboo height-diameter models for more accurate estimation of carbon storage in moso bamboo forests.

Author Contributions

X.Z. (Xiao Zhou), Y.Z. (Yaxiong Zheng), X.Z. (Xuan Zhang), Y.Z. (Yang Zhou) and F.G. collected data; X.Z. (Xiao Zhou) and Y.Z. (Yaxiong Zheng) analyzed data; X.Z. (Xiao Zhou), R.P.S. and F.G. wrote manuscript and contributed critically to improve the manuscript, and gave a final approval for publication. All authors have read and agreed to the published version of the manuscript.

Funding

This research was supported by the Basic scientific research funding of International Center For Bamboo and Rattan (Grant No. 1632021009).

Data Availability Statement

Not applicable.

Acknowledgments

We would like to thank the Basic scientific research funding of International Center For Bamboo and Rattan (Grant No. 1632021009) and the Operation subsidy of Jiangsu Yixing bamboo ecosystem national positioning observation and research station for the financial support of this study.

Conflicts of Interest

The authors declare no conflict of interest.

References

  1. Yen, T.M.; Lee, J.S. Comparing aboveground carbon sequestration between moso bamboo (Phyllostachys heterocycla) and China fir (Cunninghamia lanceolata) forests based on the allometric model. For. Ecol. Manag. 2011, 261, 995–1002. [Google Scholar] [CrossRef]
  2. Wang, B.; Wei, W.J.; Liu, C.J.; You, W.Z.; Niu, X.; Man, R.Z. Biomass and carbon stock in moso bamboo forests in subtropical China: Characteristics and implications. J. Trop. For. Sci. 2013, 25, 137–148. [Google Scholar] [CrossRef]
  3. Yen, T.M. Culm height development, biomass accumulation and carbon storage in an initial growth stage for a fast-growing moso bamboo (Phyllostachy pubescens). Bot. Stud. 2016, 57, 10. [Google Scholar] [CrossRef] [PubMed] [Green Version]
  4. Fekadu, G.; Teshome, G.; Teshome, S.; Kelbessa, E. Allometric Equations to Estimate the Biomass of Oxytenanthera Abyssinica (A Rich) Munro (Ethiopian Lowland Bamboo) in Dicho Forest, Oromia Region, Western Ethiopia. Int. J. Res. Stud. Biosci. (IJRSB) 2016, 4, 34–48. [Google Scholar]
  5. Yen, T.M.; Ji, Y.J.; Lee, J.S. Estimating biomass production and carbon storage for a fast growing makino bamboo (Phyllostachys makinoi) plant based on the diameter distribution model. For. Ecol. Manag. 2010, 260, 339–344. [Google Scholar] [CrossRef]
  6. FAO. Global Forest Resources Assessment 2010: Main Report; FAO Forestry Paper; FAO: Rome, Italy, 2010; Volume 163. [Google Scholar]
  7. Morataya, R.; Galloway, G.; Berninger, F.; Kanninen, M. Foliage biomass-sapwood (area and volume) relationships of Tectona grandis L.F. and Gmelina arborea Roxb.: Silvicultural implications. For. Ecol. Manag. 1999, 113, 231–239. [Google Scholar] [CrossRef]
  8. Chen, X.; Zhang, X.; Zhang, Y.; Booth, T.; He, X. Changes of carbon stocks in bamboo stands in China during 100 years. For. Ecol. Manag. 2009, 258, 1489–1496. [Google Scholar] [CrossRef]
  9. Hu, L.Y.; Wen, G.S.; Yi, L.T.; Zhou, Y.F.; Zhang, R.M.; Li, H.J.; Yuan, J. Evaluation on Phyllostachys pubescens forest ecosystem services value in Suichang county. Adv. J. Food Sci. Technol. 2013, 5, 1163–1167. [Google Scholar] [CrossRef]
  10. Wykoff, W.R.; Crookston, N.L.; Stage, A.R. User’s Guide to the Stand Prognosis Model; USDA Forest Service General Technical Report INT-133; USDA: Washington, DC, USA, 1982. [Google Scholar]
  11. Fu, L.; Zhang, H.; Sharma, R.P.; Pang, L.; Wang, G. A generalized nonlinear mixed-effects height to crown base model for Mongolian oak in northeast China. For. Ecol. Manag. 2017, 384, 34–43. [Google Scholar] [CrossRef]
  12. Carvalho, J.P.; Parresol, B.R. Additivity in tree biomass components of Pyrenean oak (Quercus pyrenaica Willd). For. Ecol. Manag. 2003, 179, 269–276. [Google Scholar] [CrossRef]
  13. Hasenauer, H.; Monserud, R.A. A crown ratio model for Austrian forests. For. Ecol. Manag. 1996, 84, 49–60. [Google Scholar] [CrossRef]
  14. Temesgen, H.; Lemay, V.; Mitchell, S.J. Tree crown ratio models for multi-species and multi-layered stands of southeastern. Br. Columbia For. Chron. 2005, 81, 133–141. [Google Scholar] [CrossRef]
  15. Zhou, F.C. Bamboo Cultivation of Science; Beijing, China Forestry Publishing House: Beijing, China, 1998; pp. 11–47. [Google Scholar]
  16. Sun, H.Y. Effects of the Factors on under Branch Height and DBH of Phyllostachys pubescens Mazel; Nanjing Forestry University: Nanjing, China, 2010. (In Chinese) [Google Scholar]
  17. Sun, H.Y.; Song, D.Q.; Wang, F.S. Effects of different site conditions on under branch height of Phyllostachys pubescens Mazel. J. JinLing Inst. Technol. 2009, 25, 61–65. (In Chinese) [Google Scholar]
  18. Li, Z.; Song, D.Q.; Wang, F.S. Effects of different site conditions on under-branch height of Phyllostachys pubescens Mazel. World Bamboo Ratt. 2010, 8, 16–19. Available online: http://en.cnki.com.cn/Article_en/CJFDTOTAL-JNZ200904015.htm (accessed on 1 November 2021).
  19. Sharma, R.P.; Vacek, Z.; Vacek, S.; Podrazsky, V.; Jansa, V. Modelling individual tree height to crown base of Norway spruce (Picea abies (L.) Karst) and European beech (Fagus sylvatica L.). PLoS ONE 2017, 12, e0186394. [Google Scholar] [CrossRef] [Green Version]
  20. Yang, Z.H.; Peng, L.A.; Liu, Q.; Luo, P.; Ye, Q.; Sharma, R.P.; Duan, G.; Zhang, H.; Fu, L. Nonlinear mixed-effects height to crown base model based on both airborne LiDAR and field datasets for Picea crassifolia Kom trees in northwest China-ScienceDirect. For. Ecol. Manag. 2020, 474, 118323. [Google Scholar] [CrossRef]
  21. Pan, L.; Mei, G.Y.; Wang, Y.F.; Saeed, S.; Chen, L.; Cao, Y.; Sun, Y. Generalized Nonlinear Mixed-Effect Model of Individual TREE Height to Crown Base for Larix Olgensis Henry in Northeast China. J. Sustain. For. 2020, 39, 827–840. [Google Scholar] [CrossRef]
  22. Lindstrom, M.J.; Bates, D.M. Nonlinear mixed effects models for repeated measures data. Biometrics 1990, 46, 673–687. [Google Scholar] [CrossRef]
  23. Fu, L.; Sun, W.; Wang, G. A climate-sensitive aboveground biomass model for three larch species in northeastern and northern China. Trees 2017, 31, 557–573. [Google Scholar] [CrossRef]
  24. Zhou, X.; Chen, Q.; Sharma, R.P.; Wang, Y.; He, P.; Guo, J.; Lei, Y.; Fu, L. A climate sensitive mixed-effects diameter class mortality model for Prince Rupprecht larch (Larix gmelinii var. principis-rupprechtii) in northern China. For. Ecol. Manag. 2021, 491, 119091. [Google Scholar] [CrossRef]
  25. Zhou, X.; Fu, L.; Sharma, R.P.; He, P.; Lei, Y.; Guo, J. Generalized or general mixed-effect modelling of tree morality of Larix gmelinii subsp principis-rupprechtii in Northern China. J. For. Res. 2021, 32, 2447–2458. [Google Scholar] [CrossRef]
  26. Scurlock, J.; Dayton, D.; Hames, B. Bamboo: An overlooked biomass resource? Biomass Bioenergy 2000, 19, 229–244. [Google Scholar] [CrossRef] [Green Version]
  27. Zhang, H.X.; Zhuang, S.; Sun, B.; Ji, H.; Li, C.; Zhou, S. Estimation of biomass and carbon storage of moso bamboo (Phyllostachys pubescens Mazel ex Houz) in southern China using a diameter-age bivariate distribution model. Forestry 2014, 87, 674–682. [Google Scholar] [CrossRef] [Green Version]
  28. Van Deusen, P.C.; Biging, G.S. STAG, a STAnd Generator for Mixed Species Stands; Research Note; Northern California Forest Yield Cooperative, Department of Forestry and Resource Management, University of California: Berkeley, CA, USA, 1985; Volume 11, p. 25. [Google Scholar]
  29. Walters, D.K.; Hann, D.W. Taper Equations for Six Conifer Species in Southwest Oregon; Research Bulletin; Forest Research Laboratory, Oregon State University: Corvallis, OR, USA, 1986; Volume 56, p. 41. [Google Scholar]
  30. Meng, S.X.; Huang, S. Improved calibration of nonlinear mixed-effects models demonstrated on a height growth function. For. Sci. 2009, 55, 239–248. [Google Scholar] [CrossRef]
  31. Fang, Z.; Bailey, R.L. Nonlinear mixed-effect modeling for Slash pine dominant height growth following intensive silvicultural treatments. For. Sci. 2001, 47, 287–300. [Google Scholar]
  32. Sharma, R.P.; Brunner, A. Modeling individual tree height growth of Norway spruce and Scots pine from national forest inventory data in Norway. Scand. J. For. Res. 2016, 501–514. [Google Scholar] [CrossRef]
  33. Subedi, N.; Sharma, M. Climate-diameter growth relationships of black spruce and jack pine trees in boreal Ontario, Canada. Glob. Chang. Biol. 2013, 19, 505–516. [Google Scholar] [CrossRef]
  34. Sharma, R.P.; Breidenbach, J. Modeling height-diameter relationships for Norway spruce, Scots pine, and downy birch using Norwegian national forest inventory data. For. Sci. Technol. 2015, 11, 44–53. [Google Scholar] [CrossRef]
  35. Russell, M.B.; Weiskittel, A.R. Maximum and largest crown width equations for 15 tree species in Maine. North. J. Appl. For. 2011, 28, 84–91. [Google Scholar] [CrossRef] [Green Version]
  36. Saud, P.; Lynch, T.B.; Anup, K.C.; Guldin, J.M. Using quadratic mean diameter and relative spacing index to enhance height-diameter and crown ratio models fitted to longitudinal data. Forestry 2016, 2, 215–229. [Google Scholar] [CrossRef] [Green Version]
  37. Liu, W.; Cela, J. Count Data Models in SAS. Stat. Data Anal. 2008, 4, 371–2008. [Google Scholar]
  38. Calama, R.; Montero, G. Interregional nonlinear height-diameter model with random coefficients for stone pine in Spain. Can. J. For. Res. 2004, 34, 150–163. [Google Scholar] [CrossRef] [Green Version]
  39. Ye, Q.; Li, D.; Fu, L.; Zhang, Z.; Yang, W.; Yang, G. Non-Peaked Discriminant Analysis for Data Representation. IEEE Trans. Neural Netw. 2019, 30, 3818–3832. [Google Scholar] [CrossRef] [PubMed]
  40. Temesgen, H.; Monleon, V.J.; Hann, D.W. Analysis and comparison of nonlinear tree height prediction strategies for Douglas-fir forests. Can. J. For. Res. 2008, 38, 553–565. [Google Scholar] [CrossRef] [Green Version]
  41. Detto, M.; Asner, G.; Muller-landau, H.; Sonnentag, O. Spatial variability in tropical forest leaf area density from multireturn lidar and modeling. J. Geophys. Res. 2015, 120, 294–309. [Google Scholar] [CrossRef]
Figure 1. Study area showing location of sample plots. Note: A, B, C, D and E represents China, Jiangsu Province, Wuxi City, Yixing City, and sample plot locations, respectively.
Forests 13 00823 g001
Figure 2. Actual situation of bamboo forest in the sample plot.
Forests 13 00823 g002
Figure 3. Scatter plots distribution between height to crown base (HCB) and different predictor variables used for modeling HCB for moso bamboo (diameter at breast height (DBH), quadratic mean DBH (QMD), relative diameter (ratio of DBH of individuals to quadratic mean diameter; RD), bamboo height (H), canopy density (CD), and total basal area of all bamboos with diameters larger than that of the subject bamboo (BAL), r represents the correlation analysis between HCB and different variables, and the p value between HCB and each variable is <0.001).
Forests 13 00823 g003
Figure 4. Residuals of NLME HCB models: M7 (A) and M8 (B) at the sample plot-level.
Forests 13 00823 g004
Figure 5. Performance of different selection strategies (root mean squared error (RMSE), total relative error (TRE), nonlinear ordinary least square (NLS; M6), mean response (M response) of M8, and M8 with four sampling strategies and DBH sample sizes per sample plot, for estimating the random effects (random: randomly selected DBH; largest: the largest DBH; medium: medium DBH; and smallest: the smallest DBH)).
Forests 13 00823 g005
Table 1. Summary statistics of measurements of bamboo variables. Height to crown base (HCB), diameter at breast height (DBH), quadratic mean DBH (QMD), basal area (BA), relative diameter (ratio of DBH of individual to QMD; RD), base area per hectare (BA), bamboo height (H), canopy density (CD), total basal area of all bamboos with diameter larger than that of the subject bamboo (BAL), Number of culms per hectare (N), and standard deviation (SD).
VariableMinMaxMeanSD
DBH (cm)5.3013.3010.001.42
QMD (cm)8.9011.109.960.48
RD0.521.370.990.13
BA (m2 ha−1)20.7572.5646.3816.31
HCB (m)2.109.908.101.47
H (m)6.7015.9014.141.55
CD73.0087.0078.715.42
BAL (m2 ha−1)070.5823.4417.32
N (culms ha−1)833.002333.001299.00481.08
Table 2. HCB candidate models considered (HCB: height to crown base; H: bamboo height; x: vector of bamboo variables; β, a: parameter vector; : infinity).
DesignationMathematical FormName of Function Value Range Source
M1 H C B = H [ 1 e ( β x ) ] Exponential ( , H ) [10]
M2 H C B = H [ 1 ae ( β x ) 2 ] Exponential ( , H ) [28]
M3 H C B = H 1 + e ( β x ) Logistic ( 0 , H ) [29]
Table 3. Variance influence factor (VIF) of the predictor variables evaluated.
DBHQMDRDCDHBAL
VIF559.899366.1968493.10911.35181.85142.5792
Table 4. Summarized forms of HCB functions, which were expanded through inclusion of various predictor variables.
Model FormsDesignation
H C B = H [ 1 e ( β 1 + β 2 CD + β 3 BAL ) ] M4
H C B = H [ 1 β 1 e ( β 2 CD + β 3 BAL ) 2 ] M5
H C B = H 1 + e ( β 1 + β 2 CD + β 3 BAL ) 2 M6
Note: HCB: height to crown base, H: bamboo height, CD: canopy density, BAL: basal area of all bamboos with diameter larger than the subject bamboo individual, β 1 , β 2 , β 3 are the model parameters to be estimated.
Table 5. Parameter estimates and fit statistics of the three basic models.
ParameterM4M5M6
β1−0.2407
(0.1368)
0.4326
(0.0048)
0.8140
(0.2464)
β2−0.0078
(0.0017)
−0.0011
(0.0010)
−0.0141
(0.0030)
β30.0021
(0.0005)
0.0081
(0.0015)
0.0036
(0.0010)
e ¯ −0.0263−0.0293−0.0269
p s e u d o R 2 0.72240.70010.7215
R M S E 0.77630.80680.7775
T R E 0.96501.04330.9681
Note: β1, β2, β3: parameters, e ¯ : mean residual error, R M S E : root mean square error, T R E : total relative error, p s e u d o R 2 : pseudo coefficient of determination. The numbers in the parenthesis are the standard errors.
Table 6. Forms of the NLME HCB models with random effects added to them.
Model FormsDesignation
H C B = H { 1 e [ β 1 + μ i 1 + ( β 2 + μ i 2 ) CD + ( β 3 + μ i 3 ) BAL ] } + ξ i M7
H C B = H 1 + e [ β 1 + μ i 1 + ( β 2 + μ i 2 ) CD + ( β 3 + μ i 3 ) BAL ] + ξ i M8
Note: HCB: height to crown base, H: bamboo height, CD: canopy density, BAL: basal area of all bamboos with diameter larger than the subject bamboo individual, β 1 , β 2 , β 3 : parameters to be estimated, ξ i : error term, μ i 1 , μ i 2 , μ i 3 : sample plot-specific random effects.
Table 7. Parameter estimates and fit statistics of the NLME HCB models.
ParameterM7M8
β1−0.3212
(0.1031)
0.7660
(0.3197)
β2−0.0066
(0.0013)
−0.0131
(0.0040)
β30.0010
(0.0004)
0.0016
(0.0007)
Variance-covariance
matrix of random effects
Sample plot2.21 × 10−09
2.48 × 10⁻¹¹
3.39 × 10⁻¹¹
0.0924
1.15 × 10−05
2.11 × 10−07
e ¯ −0.1005−0.0883
p s e u d o R 2 0.71220.7744
R M S E 0.79040.6997
T R E 0.98480.7723
Notes: Definitions of each acronym and symbol are the same as in Table 5.
Table 8. AIC, BIC, and -2log likelihood values of different models.
Model Name−2log LikelihoodAICBIC
M4−221451464
M6−222452465
M7−188393418
M8−166.340366
Table 9. Evaluation indicators with the model testing dataset: mean residual error ( e ¯ ), pseudo coefficient of determination ( p s e u d o R 2 ), root mean square error ( R M S E ), and total relative error ( T R E ).
Designation e ¯ p s e u d o R 2 R M S E T R E
M7−0.00640.66020.50670.3849
M8−0.00640.66420.50370.3803
Publisher’s Note: MDPI stays neutral with regard to jurisdictional claims in published maps and institutional affiliations.

