Article

Modeling Optimal Forest Rotation Age for Carbon Sequestration in the Great Khingan Mountains of Northeast China

1
School of Physics and Optoelectronics, Xiangtan University, Xiangtan 411105, China
2
School of Materials Science and Engineering, Xiangtan University, Xiangtan 411105, China
*
Author to whom correspondence should be addressed.
Forests 2022, 13(6), 838; https://doi.org/10.3390/f13060838
Submission received: 22 March 2022 / Revised: 25 May 2022 / Accepted: 25 May 2022 / Published: 27 May 2022
(This article belongs to the Special Issue Modelling Forest Ecosystems)

Abstract

:
The growing concern about climate change has led to the rise of carbon cycle research. Forest cutting planning affects the carbon cycle due to the carbon sequestration function of forests. In this work, we propose a planning model for determining the regeneration cutting age of forests to optimize carbon sequestration and improving the associated economic and ecological benefits. We first built a model based on the carbon sequestration consumption of forest products and forest carbon sequestration to predict the change in forest carbon sequestration over time. The accuracy of the model was verified with forest data from the Great Khingan mountains. Furthermore, we added in economic and ecological factors to build an improved model, which was also applied to the Great Khingan forest. The improved regeneration cutting ages were calculated as 65, 134, 123, 111 and 73 years for white birch, larch, Scots pine, oak, and poplar trees for natural forests, whereas the ages were 34, 65, 64, 77 and 37 years for planted forests, respectively. It can be predicted that the total carbon sequestration in the Great Khingan forests will accumulate to 974.80 million tons after 100 years. The results of this study can provide useful guidance for local governments to develop a sustainable timeline for forest harvesting to optimize carbon sequestration and improve the associated economic and ecological benefits.

1. Introduction

Due to the irreplaceable role of forest ecosystems in the global carbon cycle and the increasing concern of the international community about global warming, forest carbon sequestration has become a scarce economic resource [1]. Strengthening forest management can promote the maintenance and absorption of forest carbon and increase forest carbon stocks [2]. Harvesting management in forest management is an important part of the protection, cultivation, and rational use of forest resources [3]. At the United Nations Conference on Environment and Development in 1992, the impact of forest destruction and reduction on the global environment came into focus, and sustainable forest management became an inevitable choice [4].
Most local governments nowadays use the traditional selective harvesting method for mixed forests [5] (main forest harvesting method in which a part of the mature forest is cut down in the harvesting area at certain intervals of the year), and the regeneration cutting age set by this one-size-fits-all management method is only applicable to economic forests and a very small portion of natural forests. At present, in forest harvesting management, research and improvement regarding the regeneration cutting age are mainly determined by the mature and over-mature ages of different types of trees [6].
For forest harvesting management, most of the existing research mainly considers the asset income brought by the amount of forest harvesting. These models are more applicable to timber forests, and the forest carbon sequestration capacity has not been considered as the main target factor [7,8]. Such traditional models include the classical Faustmann model, which is a multi-objective decision model that integrates the benefits of harvested timber when the forest reaches the rotation period and the stumpage value of a recently created stand with an age of zero [9]. In these models, the rotation period assessments used to calculate stand values do not properly take into account the improvement of the forest system.
Some studies on determining the forest regeneration cutting age have been conducted in terms of the change of ecosystem services. Cui et al. considered the economic and protection benefits of shelterbelts when they studied the formulation of the regeneration cutting age [10]. Hu et al. analyzed the maturity age of the forest from different indicators, such as forest benefits, in a study of the forest regeneration cutting age [11]. Moreover, in existing studies, iterations of carbon sequestration changes over time for the regeneration cutting age have been considered as only a slight and uncertain factor affecting carbon sequestration when building most models.
In order to solve the problems mentioned above, we tried to propose a model for determining the regeneration cutting age that is more helpful for forest carbon sequestration than traditional regenerative cutting management solutions. While deforestation increases over time, the carbon sequestration calculated by the model does not decrease; in other words, it is “sustainable.” For decision-makers in forest management, a sustainable harvesting age is necessary to achieve sustainable carbon sequestration and economic benefits from trees [12]. To optimize the carbon sequestration of a forest and to analyze and calculate the biomass per unit area of the forest (see [13,14,15]), we tried to find a balance between the carbon sequestration value of forest products and that of the standing trees that continue to grow in the forest. As a result, we developed a carbon sequestration–harvesting–products model, which is based on the biomass of the forest for calculation and improves the biomass expansion factor method model [15]. Taking the carbon sequestration of a forest as the target function and considering the carbon sequestration of forest products and the carbon sequestration of forest regeneration standing trees on this basis, a nonlinear programming model was established to calculate a regeneration cutting age of a forest that is more helpful for optimizing forest carbon sequestration than traditional regenerative cutting management solutions. The model was analyzed and validated with five major tree types in China’s Great Khingan region [16].
Forests sequester carbon dioxide in living plants and in the products created from their trees, including furniture, lumber, plywood, paper, and other wood products. These forest products sequester carbon dioxide for their lifespan. Some products have a short lifespan, while others have a lifespan that may exceed that of the trees from which they are produced. The carbon sequestered in some forest products, combined with the carbon sequestered because of the regrowth of younger forests, has the potential to allow for more carbon sequestration over time when compared to the carbon sequestration benefits of not cutting forests at all [17].
The value of forests includes not only the ecological functions such as carbon sequestration, but also forest products and public benefit. This is referred to as the ecological function value, that is, the forest itself and forest products can realize carbon sequestration. Forest products and public benefit value such as tourism can promote the development of economic benefits. Both the forest and its additional public benefit value such as water conservation can promote other ecological values [18].
Therefore, on the basis of optimizing carbon sequestration, we added two indicators, namely, economic benefits and environmental quality. In the ecological function indicators, we additionally considered climatic conditions that have a non-negligible impact on forest carbon sequestration. The objective of this paper is to develop a temporal logic flow model capable of determining new regenerated cutting ages, resulting in regeneration cutting ages that lead to more appreciable carbon sequestration, and finally to support achieving a more sustainable forest management.

2. Decision Model

2.1. Assumptions and Justifications

Assumption 1.
The environmental resources of the studied system are not limiting, such as sunlight, water, and soil, and the growth condition of each tree is guaranteed to be the same. Forest systems are an essential component of the Earth’s biosphere, and the environmental resources of forest systems are hard to estimate due to the finite and uneven nature of the Earth’s diverse resources. Therefore, for simplicity, the environmental resources of the system studied in this paper were not restricted.
Assumption 2.
There is no internal loss for carbon in the forest ecosystem. Natural disturbances, climatical conditions, and other factors can affect the normal ecological functions of forests and can affect ecological values. Since it is difficult for us to comprehensively consider all natural factors into the model, we select the more important climatic conditions and natural disasters among the natural factors for analysis.
Assumption 3.
There is no interval between the felling of trees and the regeneration of forests. It is difficult to grasp the number of trees cut and planted, so we assumed that we can cultivate other trees directly after cutting them down, and thus the total area of the forest is constant.

2.2. The Establishment of the CS-H-P Model

The IPCC (2006) recommends five carbon pools that must be considered, namely living biomass, dead trees, litter, soil carbon, and waste products. However, most previous references and management practices have chosen to ignore the carbon stocks and emissions of wooden products [19,20]. In fact, when trees are cut down, large amounts of carbon stored in wooden products are carried away from the forest ecosystem. These products not only store and maintain carbon for longer than naturally dead trees but may also reduce the use of calcareous building materials when considering substitution effects [21,22].
Forest carbon sequestration is the increase of forest carbon storage per unit time, and each factor mainly affects the output of carbon sequestration by affecting carbon storage. The data on forest carbon storage in each country come from the Global Forest Resources Assessment 2015, which is released every five years. For the intermediate missing data, this paper supplemented the derivation method of forest stock volume in the global forest products model (GFPM). In order to facilitate the comparison of carbon storage data between different countries, this paper used forest carbon storage density as the explained variable for analysis [23].
The measurement of forest ecosystem biomass is the basis for carbon stock estimation, because forest biomass can eventually be converted into carbon stock by the share of carbon in the dry weight of plant organic matter (carbon conversion factor) [15]. The biomass expansion factor method is a great method for estimating forest biomass. It takes the average value of the stand biomass to wood volume ratio as the conversion factor and the forest stock obtained from forest inventory as the base data to calculate the forest carbon stock and is also suitable for the projection of forest biomass at the national scale [15]. If we can determine the biomass per unit area of the forest, we can quantify the total biomass of different forest sizes.
Therefore, we built the model based on the biomass expansion factor method (Appendix A). We took the regeneration cutting age as the research object of forest management and established a carbon sequestration–harvesting–products model that changes carbon sequestration with time—namely, the CS-H-P model—by considering forest harvesting and forest products. The regeneration cutting age is a specific harvesting time interval for our model, which is an important indicator for measuring forest management. For simplicity, we use S to represent the annual loss rate of forest products and to check the market data and set it to be a fixed value of 0.3. Therefore, the carbon sequestration of the forest system is the annual growth of trees minus the loss of wood products after felling.
We defined the increment of tree biomass as the product of tree volume growth rate, BEF and SVD based on the biomass expansion factor method model.
G I i j = q i j · B E F i j · S V D i j ,     i = 1 ,   2 m ,     j = 1 ,   2 n ,
where G I i j is the growth increment of biomass of type j trees in a type i forest, q i j is the annual growth rate of the volume of type j trees in a type i forest, B E F i j is the biomass expansion factor of type j tree species in a type i forest, and S V D i j is the wood density of type j tree species in a type i forest, m is the number of forest types, n is the number of tree types.
The carbon consumption of forest products is the product of the volume of the tree when it is harvested and the rate of loss. The volume of a tree when it is harvested is equivalent to the volume of a tree that reaches the regeneration cutting age:
h a r v e s t i j = V 0 ( 1 + q i j ) t · S ,     i = 1 ,   2 m ,     j = 1 ,   2 n ,
where h a r v e s t i j is the harvested volume of type i forests and type j trees, V 0 is the initial volume of the newly planted trees, t is a variable that follows the logical flow of time in the simulation step and S is the annual loss rate of forest products. The process of transporting thick material, processing products, and marketing wood products in the market is complex, so for simplicity, the wood loss rate was replaced by S.
Similar to Equation (1), we needed to obtain the biomass of trees waiting to be harvested at the regeneration cutting age:
O l d i j = V 0 ( 1 + q i j ) t · B E F i j · S V D i j ,     i = 1 ,   2 m ,     j = 1 ,   2 n ,
where O l d i j is the biomass of type i forests and type j trees beyond the defined harvest period.
The amount of carbon sequestration converted from new growth minus the consumption of wood products after cutting is greater than the amount of carbon sequestration converted from old growth, and the consumption of wood products is seen as releasing carbon dioxide [24]:
G I i j h a r v e s t i j O l d i j   ,     i = 1 ,   2 m ,     j = 1 ,   2 n
Arranged from Equations (1)—(4), we can get:
q i j · B E F i j · S V D i j V 0 ( 1 + q i j ) t · S V 0 ( 1 + q i j ) t · B E F i j · S V D i j ,     i = 1 ,   2 m ,   j = 1 ,   2 n ,
Solving Equation (5), we can get the regeneration cutting age of each forest type, and the biomass of the type j trees in a type i forest can be obtained according to the basic carbon sequestration calculation model:
W i j = t = t 0 T i j q i j · A i j · B E F i j · S V D i j ,     i = 1 ,   2 m ,     j = 1 ,   2 n ,
where T i j is the regeneration cutting age of type j trees in type i forests.
In summary, the total carbon sequestration of a forest is as follows:
W = r · i = 1 m j = 1 n W i j ,
where r is the carbon content biomass conversion factor, according to the guidelines for the measurement of carbon storage in forest ecosystems of the forestry industry of the People’s Republic of China [25]. It can be seen that the carbon content rate of all kinds of trees is approximately 0.5; therefore, for the convenience of calculation, the carbon content rate in this paper was 0.5 of the international commonly used tree species for calculation [26,27,28,29]. Most domestic and foreign researchers also use 0.5 as the average carbon content of all tree species.
Since the loss rate of forest products in the model is an important parameter on the carbon sequestration of forest products and is difficult to determine, we performed a sensitivity analysis on the depletion rate S of forest products and verified the stability of the model accordingly. Parameters such as BEF in the model were all fixed values, and the growth rate changed accordingly with time iteration, so these parameters were not included in the sensitivity analysis.

2.3. EEE Model: Ecological–Economic–Environmental Model

From the above model, we know that forests have the function of absorbing and fixing carbon dioxide, and carbon sequestration is an ecological value realized by the ecological function of forest ecosystems. Our current forest management plan is only based on the amount of carbon sequestered by forests.
To develop a forest management plan that balances forest values in various ways, we selected ten indicators from three aspects and used the technique for order preference by similarity to an ideal solution (TOPSIS) [30] combined with the entropy weight method (EWM) [31] to make a multifaceted and comprehensive assessment of the values of selected forests. The TOPSIS algorithm is a common method for finite-scheme multi-objective decision analysis in systems engineering. The determination of indicators’ weight plays a crucial role and has a direct impact on the accuracy of evaluation results. The TOPSIS algorithm can extract information from actual data and can analyze this information to determine the importance of indicators. EWM is an objective weighting method; therefore, we used it to determine the weight of the indicators.
We evaluated the selected forests from three aspects: ecological function, economic benefit, and environmental quality. Ecological functions include carbon sequestration per unit area, living wood growing stock per unit area, the mean annual temperature, and the mean annual precipitation of the forest. The effects of temperature and precipitation are cumulative, and the complex relationship between them can illustrate the impact of climate change on forest biomass and forest carbon sequestration [32]. The study by Wu [33] suggested that warming and increased precipitation can jointly promote photosynthesis in ecosystems, while decreased precipitation has a negative impact. Current knowledge about the effects of temperature and precipitation on the distribution of below-ground carbon and biomass in forests is still very lacking, and above-ground biomass distribution models are imperfect [32]. Therefore, we considered the mean annual temperature and mean annual precipitation of the forest as climatic conditions within the ecological function category, and used them as positive indicators, so that the carbon sequestration has a linear relationship with climatic conditions. Economic benefits include the total economic profits brought by forests and the amount of production of forest products reflected by the amount of forest harvesting. Environmental qualities include forest cover area, the number of tree species, average number of fires per year and average annual pests and diseases area. Forest fires and pests and diseases, as the sub-indicators most closely related to forest carbon sequestration, should be studied as negative indicators in the simulation (Appendix B).
From the above, we built a comprehensive evaluation model around the three aspects (ecological functions, economic benefits, and environmental qualities), which we refer to as the EEE model for short. In general, the scope of the forest management that we planned not only considers forest harvesting and forest products in the CS-H-P model, but also should combines the above three aspects for comprehensive analysis. Then, we used the algorithm of TOPSIS combined with EWM to solve the weights of the ten indicators in the EEE model.
We set X i k as the index sequence; i represents the forest and k represents the evaluation index. Then, X i 6 is the interval index sequence, and its optimal interval is [a, b], which is the same for X i 7 . X i 9 and X i 10 are the negative index sequences. In the following, we transformed these interval indices into positive indices [34].
M = max { a min X i k , max X i k b }   ,     k = 6 ,   7 ,
where min   X i k and max X i k represent the minimum and maximum values in the k-th evaluation series, respectively.
y i k = { 1 a X i k M   , X i k < a 1 , a X i k b 1 X i k b M   , X i k > b ,   k = 6 ,   7
y i k = max   X i k X i k   , k = 9 ,   10
where yik is the forward value of each evaluation indicator.
The forward values are formed into an i–k matrix. Since the dimensions of each indicator are different, we needed to standardize these indicators. The standardized matrix is denoted as z. Then each element in z matrix is:
z i k = y i k / i = 1 8 y i k 2   , k = 1 ,   2 ,   ,   10
First, we calculated the weight of the k-th indicator in type i forests.
According to the concept of self-information and entropy in information theory, the information entropy of each evaluation index can be calculated, and thus:
e k = l n ( 8 ) 1 i = 1 8 z i k l n ( z i k )   ,   k = 1 ,   2 ,   ,   10
Based on the information entropy, we further calculated the weight of each evaluation indicator we defined before:
ω k = 1 e k 10 e k   ,   k = 1 ,   2 ,   ,   10
After determining the weight of each indicator, we were able to build a model with forest value as the research object:
E E E i j = Ω 1 · E F i j + Ω 2 · E B i j + Ω 3 · E Q i j   ,     i = 1 ,   2 m ,     j = 1 ,   2 n ,
where E E E i j , E F i j , E B i j , and E Q i j represent the forest value, ecological functions, economic benefits, and environmental qualities, respectively. Ω 1 is the sum of ω 1 , ω 2 , ω 3 and ω 4 . Ω 2 is the sum of ω 5 and ω 6 . Ω 3 is the sum of ω 7 , ω 8 , ω 9 and ω 10 .
Based on the evaluation model constructed above, we scored the value generated by a forest system in terms of ecological function, economic value, and environmental cost. Then, using EWM to calculate the weight of each indicator, the total value of the forest system was the weighted sum of the three indicators. The implementation of forest management plans affects the value of the three aspects mentioned above.
We only considered the carbon sequestration in the timetable for the harvesting age of the Great Khingan forest developed in the CS-H-P model. From the EEE model, we should comprehensively consider the carbon sequestration, economic benefits, and ecological environment to formulate a forest management plan. We set the three parameters to 97.65, 83.17, and 91.10, respectively, by combining the model characteristics with the location characteristics of the Great Khingan forest by synthesizing relevant data and facilitating computer simulations [35]. We set the tourism income to a fixed value and solved the Equation (14) as the target function. We used particle swarm optimization as the inner loop to compute the new regeneration cutting age for this nonlinear program and iterate over time in the outer loop. We took the total value of the forest system as the target function and the control of forest resources as the constraint condition, and the established complete EEE model is as follows.
For ecological functions, we only considered carbon sequestration and the climatic conditions that affect carbon sequestration in the CS-H-P model. For economic benefits, we considered forest product income, tourism income, and forest maintenance costs. In order to simplify the calculation, we set the tourism cost as a constant. For environmental qualities, we equated it to the environmental management fee and constructed the following model.
The forest product income and maintenance cost of a type i forest are, respectively:
r e v e n u e = i = 1 n V 0 · ( 1 S ) · β i
c o s t 1 = i = 1 n V 0 · α i
The less the tree cover and the less the forest species, the more money needed to manage the environment such as air pollution, so we defined the environmental management cost of a type i forest as:
c o s t 2 = i = 1 n A i · δ i ,
where α and β are the constant factors for calculating the maintenance cost and product income, respectively. α means the cost required to maintain a unit volume of trees, and β is the income from harvesting a unit volume of wood. In order to calculate the ecological value of planted trees, the environmental management cost was calculated by planting a unit of wood. δ indicates the value gain from producing a unit area of trees. All three parameters are related to market price changes.
In summary, we finally constructed the EEE model as follows.
E E E = Ω 1 · i = 1 m W i j + Ω 2 · ( r e v e n u e + t o u r i s m c o s t 1 ) + Ω 3 · c o s t 2
For the EEE model, we discuss the impact of changes in the weight coefficients Ω 1 , Ω 2 , and Ω 3 of the ecological functions, economic benefits, and environmental quality on the calculation results. In order to integrate the uncertainty in the weight of the example, in the process of sensitivity analysis and on the basis of determining the weight in the TOPSIS algorithm, we set the calculated weight as the mean value of the Gaussian distribution and the initial value of the simulation. We then sampled the weights from a Gaussian distribution into a simulation exercise and analyzed the variation in the results.
In order to integrate the uncertainty in the weight of the algorithm, in the process of sensitivity analysis, the TOPSIS algorithm determines the weight (where the calculated weight is set to the mean of the Gaussian distribution and the initial value of the simulation). We sampled the weights from a Gaussian distribution, post-simulation, and performed sensitivity analysis.
Considering that forest managers and users have different emphases on the established models, we conducted a sensitivity analysis of carbon dioxide absorption for three uncertain parameters and verified the importance of managing forest harvesting for forest management accordingly.

3. Empirical Analysis

3.1. Initial Conditions of the Great Khingan Forest

The Great Khingan forest is the best preserved and largest primary forest in China, with a total area of 327,200 km2 (including approximately 240,000 km2 in the Inner Mongolia Autonomous Region and 84,800 km2 in Heilongjiang Province). The Great Khingan Mountains has dense virgin forests and is one of the most important forestry bases in China. The main trees include Larch forests (Larix gmelinii (Rupr.) Kuzen.), Scots pine (Pinus sylvestris var. mongolica Litv.), red spruce (Picea rubens), white birch (Betula platyphylla Suk.), Mongolian oak (Quercus mongolica Fisch. ex Ledeb.), and poplar (Populus tomentosa Carr.) [36].
We chose the current forest resource situation of the Great Khingan region in China to analyze and solve the above-established CS-H-P model. Although the natural forest and planted forest in the Great Khingan forest area are in the same area, they are actually two different forest systems. Therefore, for this example, the value of m in the model is 2, and the value of n is 5. According to the needs of the model, we searched the data related to five major trees of natural and regenerated forests in the Great Khingan forest [16,37], calculated the volume in the model according to the diameter at breast and tree height, dynamically adjusted the annual growth of trees, and solved the model by averaging the BFE and SVD, as shown in Table 1:

3.2. Data of Eight Forests Used to Calculate the Weights

We analyzed the data of the Great Khingan forest, Xishuangbanna Tropical Rainforest, Saihanba Forest, Changbai Mountain Forest, Xiaoxing’an Mountain, Shennongjia Forestry District, Mordaoga National Forest, and Jianfengling Tropical Rainforest as representative forests in China [16,39,40,41]. We collected relevant data from related literature and website, and used the TOPSIS algorithm combined with the EWM to calculate the weights of the indicators (Appendix C).
We used MATLAB software [42] to obtain the weights as 0.1396, 0.0045, 0.2007, 0.0392, 0.1926, 0.0313, 0.0885, 0.2171, 0.0515 and 0.0350 respectively. We follow the instructions in Equation (14) to sum the sub-indicator weights correspondingly. The weights of ecological function, economic benefit and environmental quality were calculated as 0.3840, 0.2239 and 0.3921. After determining the weight of each indicator, we can determine a model with the forest value as the research object:
E E E i j = 0.3840 · i = 1 2 W i j + 0.2239 · ( r e v e n u e + t o u r i s m c o s t 1 ) + 0.3921 · c o s t 2
It can be seen from the above analysis that the range of i is 1 to 2 and the range of j is 1 to 5 in Equations (1)–(6).

4. Results

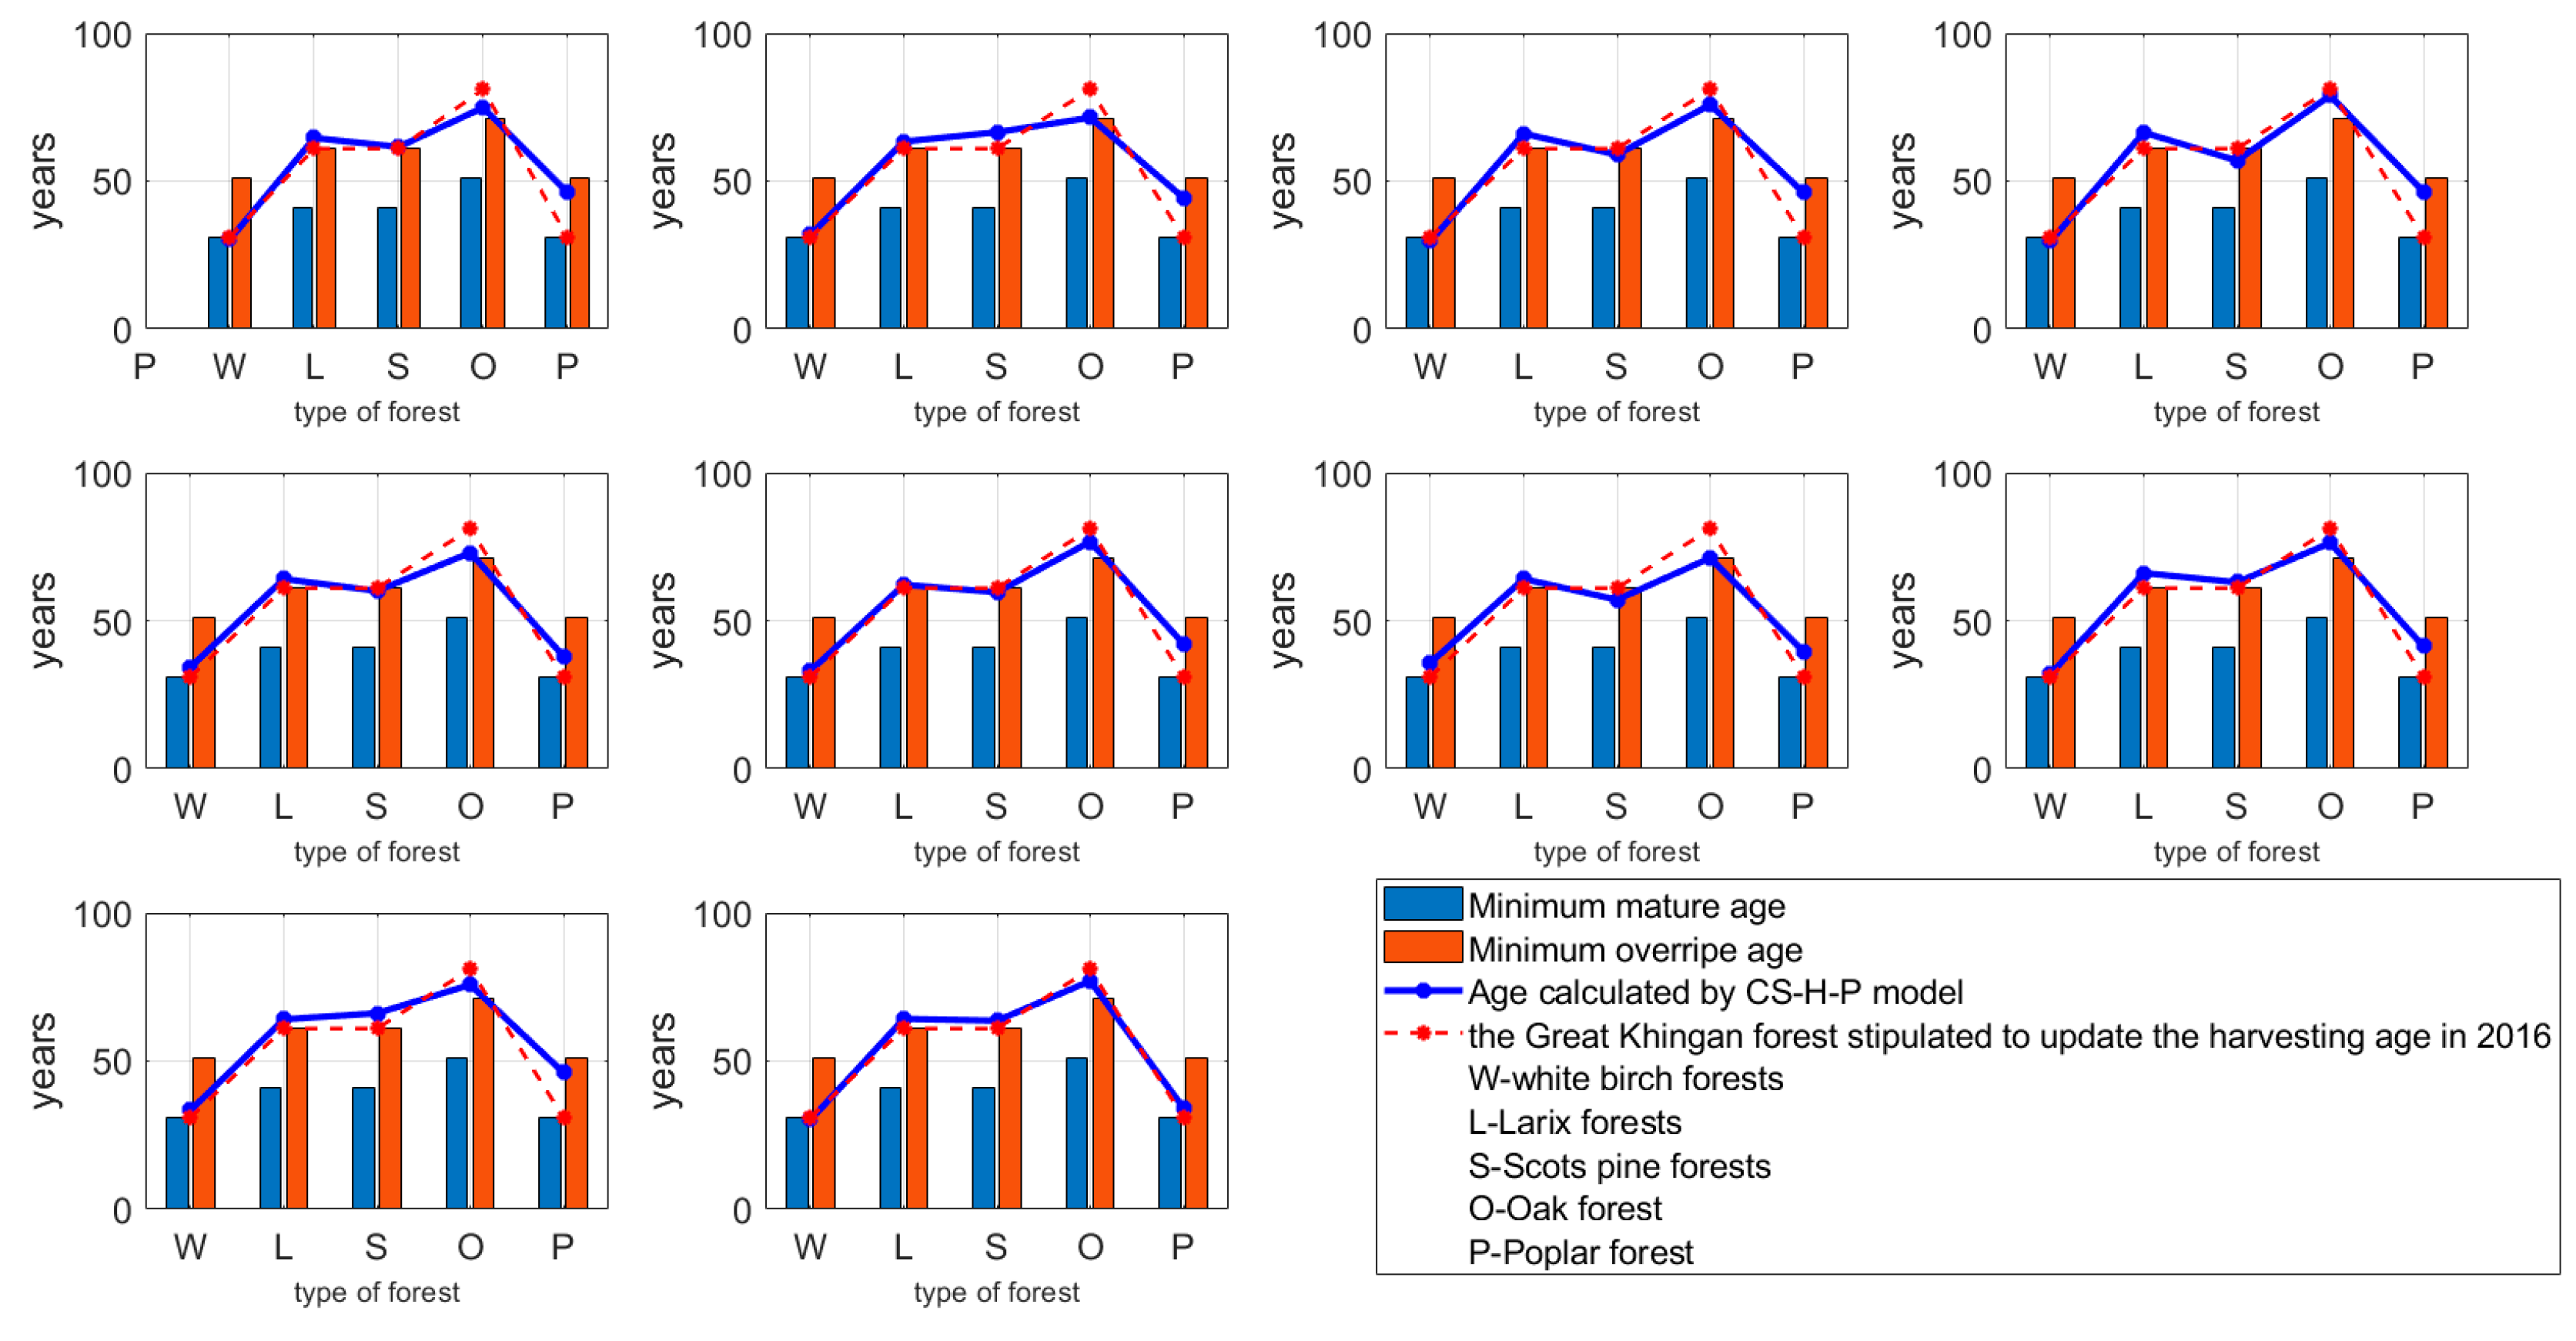
4.1. Regeneration Cutting Ages of Five Tree Species in the Great Khingan Forests by the CS-H-P Model

From the data in the table above and the established forest carbon sequestration model, computer simulation using MATLAB software was conducted to solve for the regeneration cutting age of each tree species in natural and planted forests. In computer simulation, the situation of falling into the local optimal solution is always encountered. Therefore, in order to find the global optimal solution, it is usually necessary to perform multiple simulations. In the simulation solution of this example, we actually performed five millions iterations. A total of ten different results appeared in ten hundred simulations, and then we obtained ten local optimal solutions, of which the one with the most carbon sequestration was the global optimal solution. For the optimal carbon sequestration level, we determined that the regeneration cutting age of white birch forests in natural forests is log(1.062001)/log(1.00098670327) years, that is, 60.99 years, and the final calculated total carbon sequestration is 1.4785 million tons, which is similar to the actual increase of carbon sequestration in the Great Khingan forest from 2000 to 2013 of 1.5791 million tons [43]. Therefore, we consulted relevant information and obtained the regeneration cutting age of five species of trees in natural and planted forests established by the Inner Mongolia government in 2016 for the forest management plan of the Great Khingan region (Appendix E) [44], compared it with the T i j ( T i j is the regenerated cutting age) we calculated, and then compared this age with the minimum age of maturity and the minimum age of over-maturity of each tree [16] to draw a comprehensive analysis chart of natural and planted forests, as shown in Figure 1 and Figure 2.
From Figure 1, the regeneration cutting age of Scots pine forests is slightly lower than the minimum over-mature age and significantly higher than the stipulated age. It can be found that the regeneration cutting age of natural forests obtained by the model is similar to the age specified by the Inner Mongolia Government. Among them, the regeneration cutting ages of white birch, Larch, and poplar forests are listed in the 10 optimal solutions. There regeneration cutting ages are between the minimum age of maturity and the minimum age of over-maturity. It can be seen that all of them have little difference to the regeneration cutting age set by the government, which indicates that the regeneration cutting age calculated by our model is consistent with the eco-efficiency logic and can be adopted. Although the regeneration cutting age of oak forests is between the minimum mature age and the minimum over-mature age, it is significantly lower than the age set by the government, suggesting that our model may only consider the impact of carbon sequestration without considering the impact of other factors such as economic factors.
Using this model, the average value of the regeneration cutting age of the five kinds of trees in the natural forest of the Great Khingan Mountains under investigation obtained by these ten local optimal solutions are 64, 116, 136, 110, and 71 years, with standard deviations of 2.1, 2.4, 3.7, 3.8, and 4.3 years, respectively.
Similarly, analyzing the images of the planted forests as shown in Figure 2, among the ten simulated harvesting age results, only the regeneration cutting age calculated by poplar forests is significantly different from the established one, but it is located between the two columns, which is ecologically logical and thus the regeneration cutting age could be adopted. Comparing the ten results with higher carbon sequestration levels, the overall trend of the regeneration cutting age is consistent with the regeneration cutting age based on the forest age, with only slight fluctuations, indicating the reliability and stability of the model.
The average regeneration cutting ages of the five kinds of trees in the planted forests are 32, 65, 61, 75, and 42 years, with standard deviations of 2.0, 1.3, 3.3, 2.4, and 4.0 years, respectively. Based on this, we provide the Inner Mongolia government with a forest management plan that can determine a new regeneration cutting age, and the resulting regeneration cutting age results in a more considerable amount of carbon sequestration.

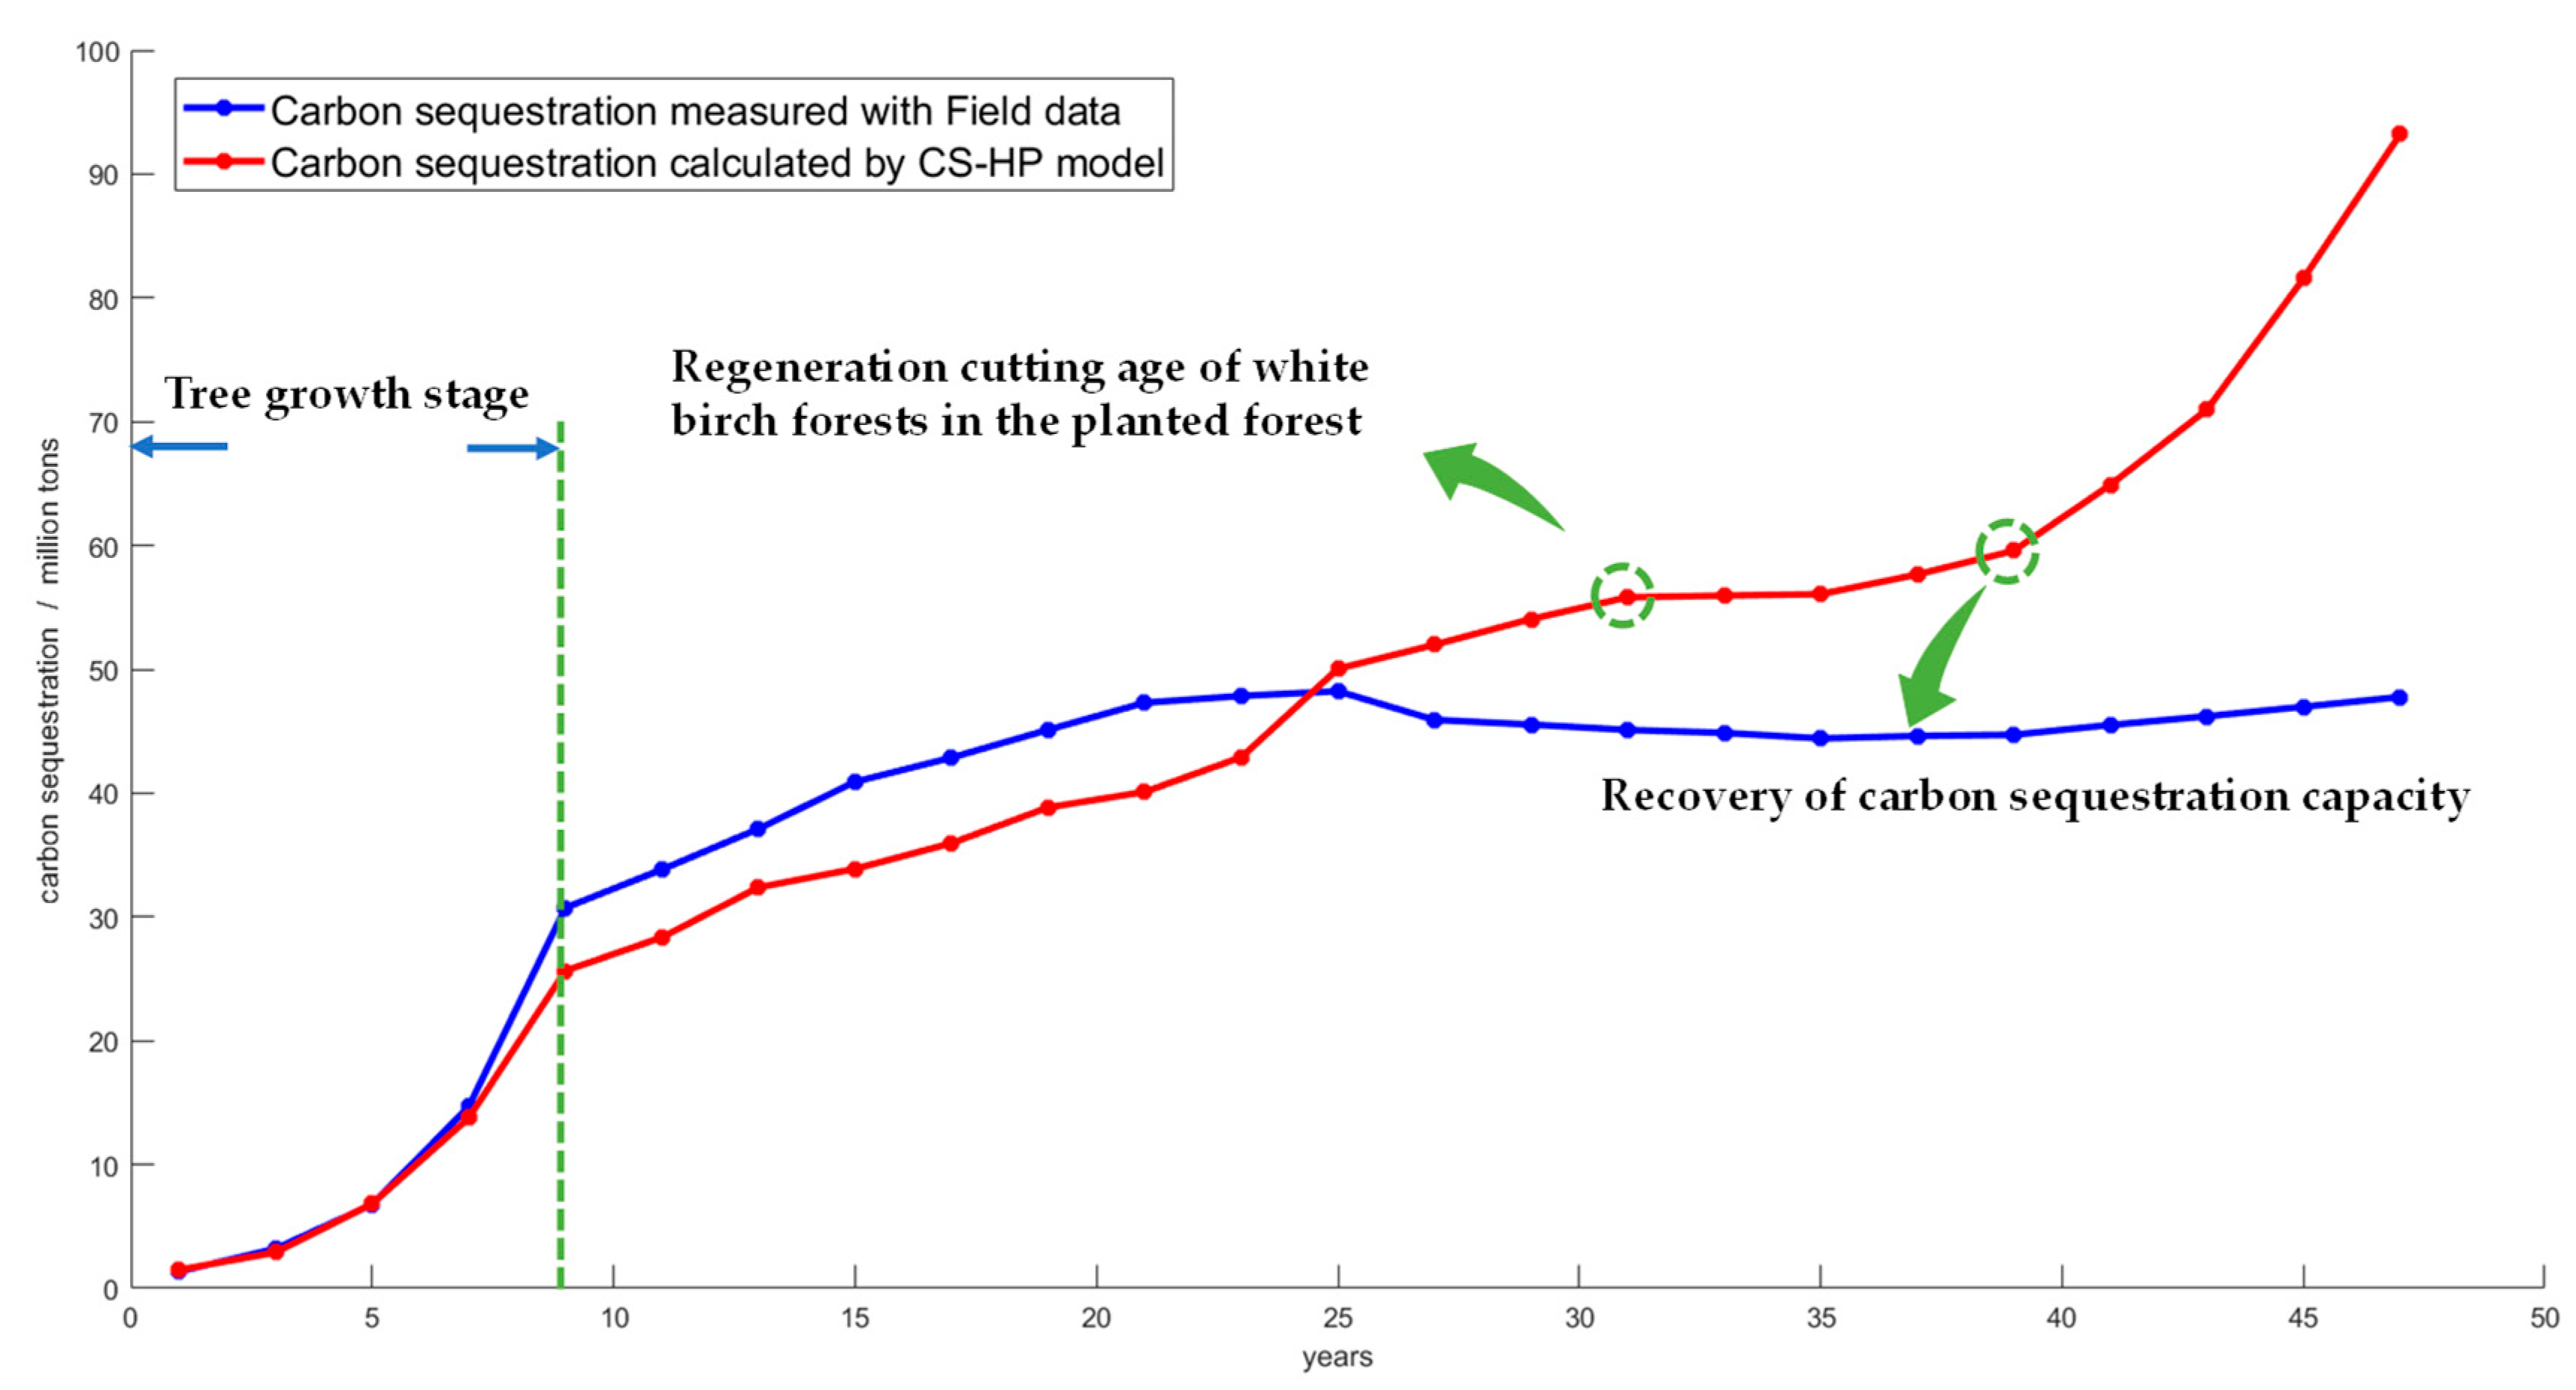
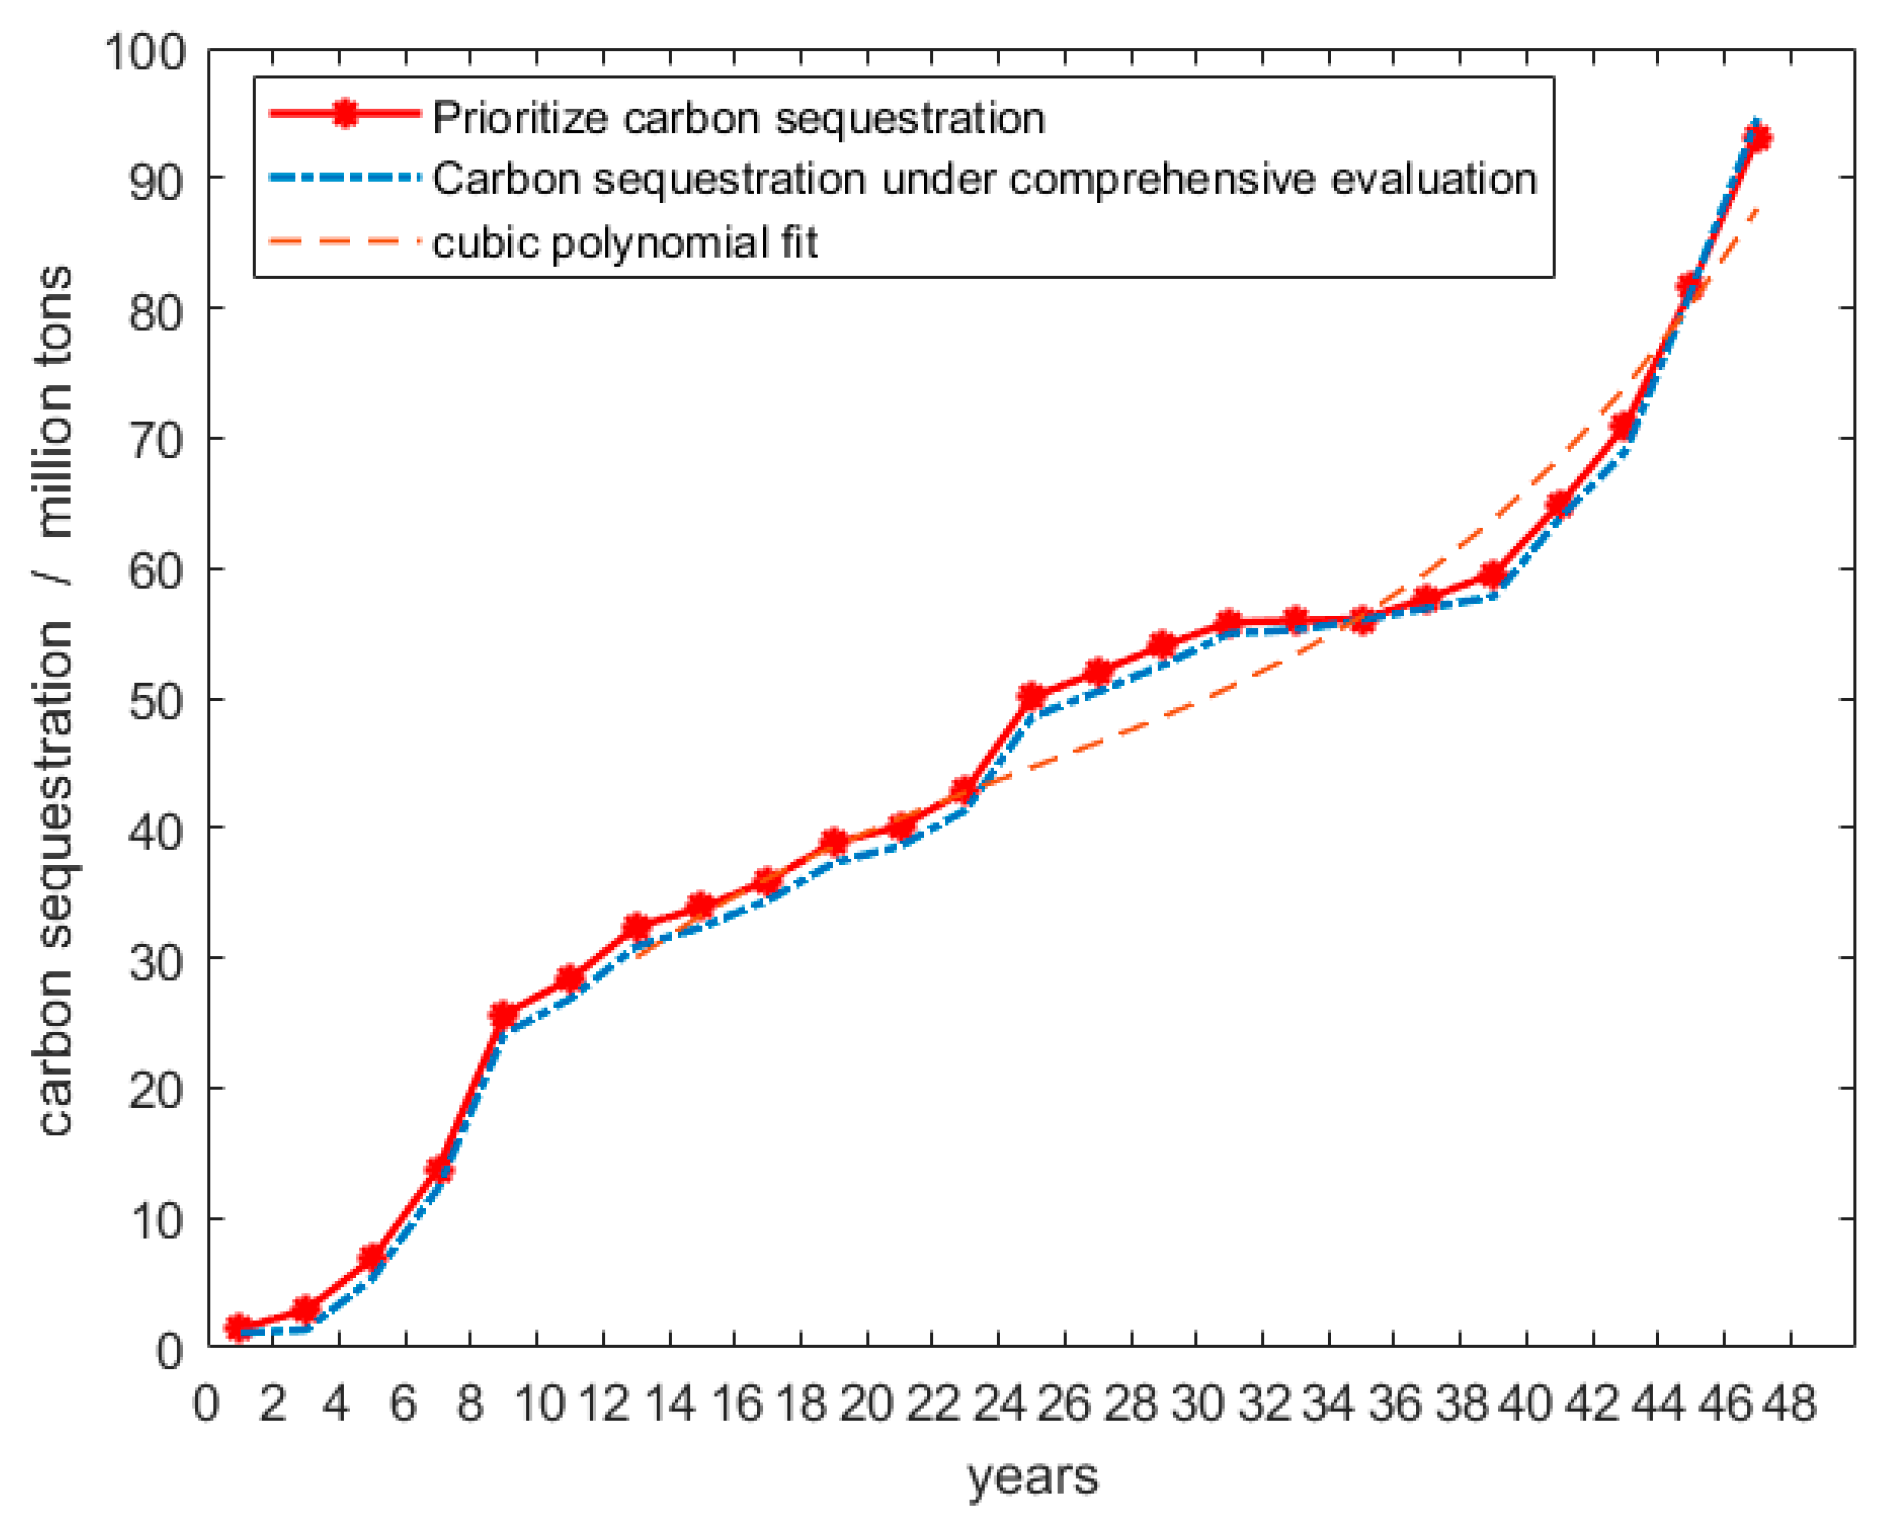
4.2. Analysis and Prediction of Carbon Dioxide Absorption

When we analyze the carbon sequestration in the Great Khingan forest in a short period of time, in order to make the simulation results more obvious, we first use the planted forests with a smaller regeneration cutting age to simulate, and then simulate the entire forest., and then calculated the carbon dioxide absorption amount of the forest every year, comparing it with the real carbon dioxide uptake of the Great Khingan forest over 48 years measured with Field data [13]. The change in the amount of carbon dioxide absorbed by the forests over time is shown in Figure 3.
It can be seen from the comparison that when the trees that exceed the upper limit of the tree age in that year are cut down, the carbon sequestration is slowly affected. In the first few years, it takes a certain amount of time to buffer the trees for new growth after being cut down and it takes a series of processes to plant new species in place before carbon sequestration can take effect, which is consistent with the actual situation. The carbon sequestration of the forests increases over time and gradually exceeds the carbon sequestration of the forests that have not been harvested. During the time period studied, the gap between the carbon sequestration of the forest after the implementation of the management plan and the carbon sequestration of the forest that had not been harvested became more and more obvious. This shows that the effect of implementing the management plan is very considerable. We analyzed the carbon dioxide absorption chart and found that the trend of carbon dioxide absorption changed significantly after the 33rd and 40th years, indicating that the renewal regeneration cutting age affects the carbon sequestration of a forest to a certain extent.
From the fitting equation (Appendix D), it is predicted that the carbon sequestration of the Great Khingan forest will be 956.62 million tons during this 100-year period, after 100 years. Based on the above model and calculation solution, we developed the forest management plan in Table 2.

4.3. Regeneration Cutting Ages of Five Tree Species in the Great Khingan Region by the EEE Model

In the same way, we calculated the EEE model to obtain the global optimal solutions of the five tree regeneration cutting ages in natural forests, which are 61.4, 130.5, 124.1, 112.4, and 69.5 years, respectively. Meanwhile, the regeneration cutting ages of planted forests are 32.2, 61.1, 66.1, 75.4, and 39.3 years, respectively. The images of the local optimal solutions for ten regeneration cutting ages of the EEE model with comprehensive evaluation as the target function value for natural forests and plantations in the Great Khingan Mountains are shown in Figure 4.
Using the model, the average value of the regeneration cutting age of the five kinds of trees in the natural forests of the Great Khingan Mountains obtained by these ten local optimal solutions are 65, 134, 123, 111, and 73 years, with standard deviations of 2.1, 5.3, 3.4, 2.8, and 3.4 years, respectively. Meanwhile, the average regeneration cutting ages of the five kinds of trees in planted forests are 34, 66, 64, 77, and 38 years, with standard deviations of 2.7, 3.2, 2.7, 3.5, and 3.6 years, respectively. Based on this, we provide a more comprehensive forest management plan to the government of Inner Mongolia that can determine a new regeneration cutting age, and the resulting regeneration cutting age results in a more considerable amount of carbon sequestration.
It can be seen from Figure 4 that after introducing the indicators of economic benefits and environmental quality on the basis of prioritizing carbon sequestration, the regeneration cutting age obtained by simulation calculations has a smaller average residual difference from the regeneration cutting age under the traditional government regulations. It can also be seen that the planning model with the introduction of multilevel indicators is more stable. Compared to the CS-H-P model that prioritizes carbon sequestration, the regeneration cutting age is located between the two columns after iteration of the three important parameters, which is more ecologically logical.
On the basis of optimizing carbon sequestration as the goal of the decision model considering the economic value and a comprehensive evaluation of the environmental quality, the carbon sequestration in 48 years was calculated as shown in Figure 5.
The average annual growth of carbon sequestration was calculated as 1.1424 million tons, and the total accumulated carbon sequestration after 100 years was obtained as 974.80 million tons according to the polynomial fit (Appendix D). The new regeneration cutting ages are shown in Table 3.
As can be seen from Figure 5, after the implementation of the first regeneration cutting age, the carbon sequestration of the integrated decision model can be significantly reduced compared to that of the optimized carbon sequestration case, and the average annual carbon sequestration growth is reduced by 336.1 thousand tons, but the predicted carbon sequestration after 100 years is close to or even exceeds the value calculated by the optimized carbon sequestration-only model, indicating that the regeneration cutting age determined by the integrated decision model still has the characteristic of optimizing carbon sequestration over time.

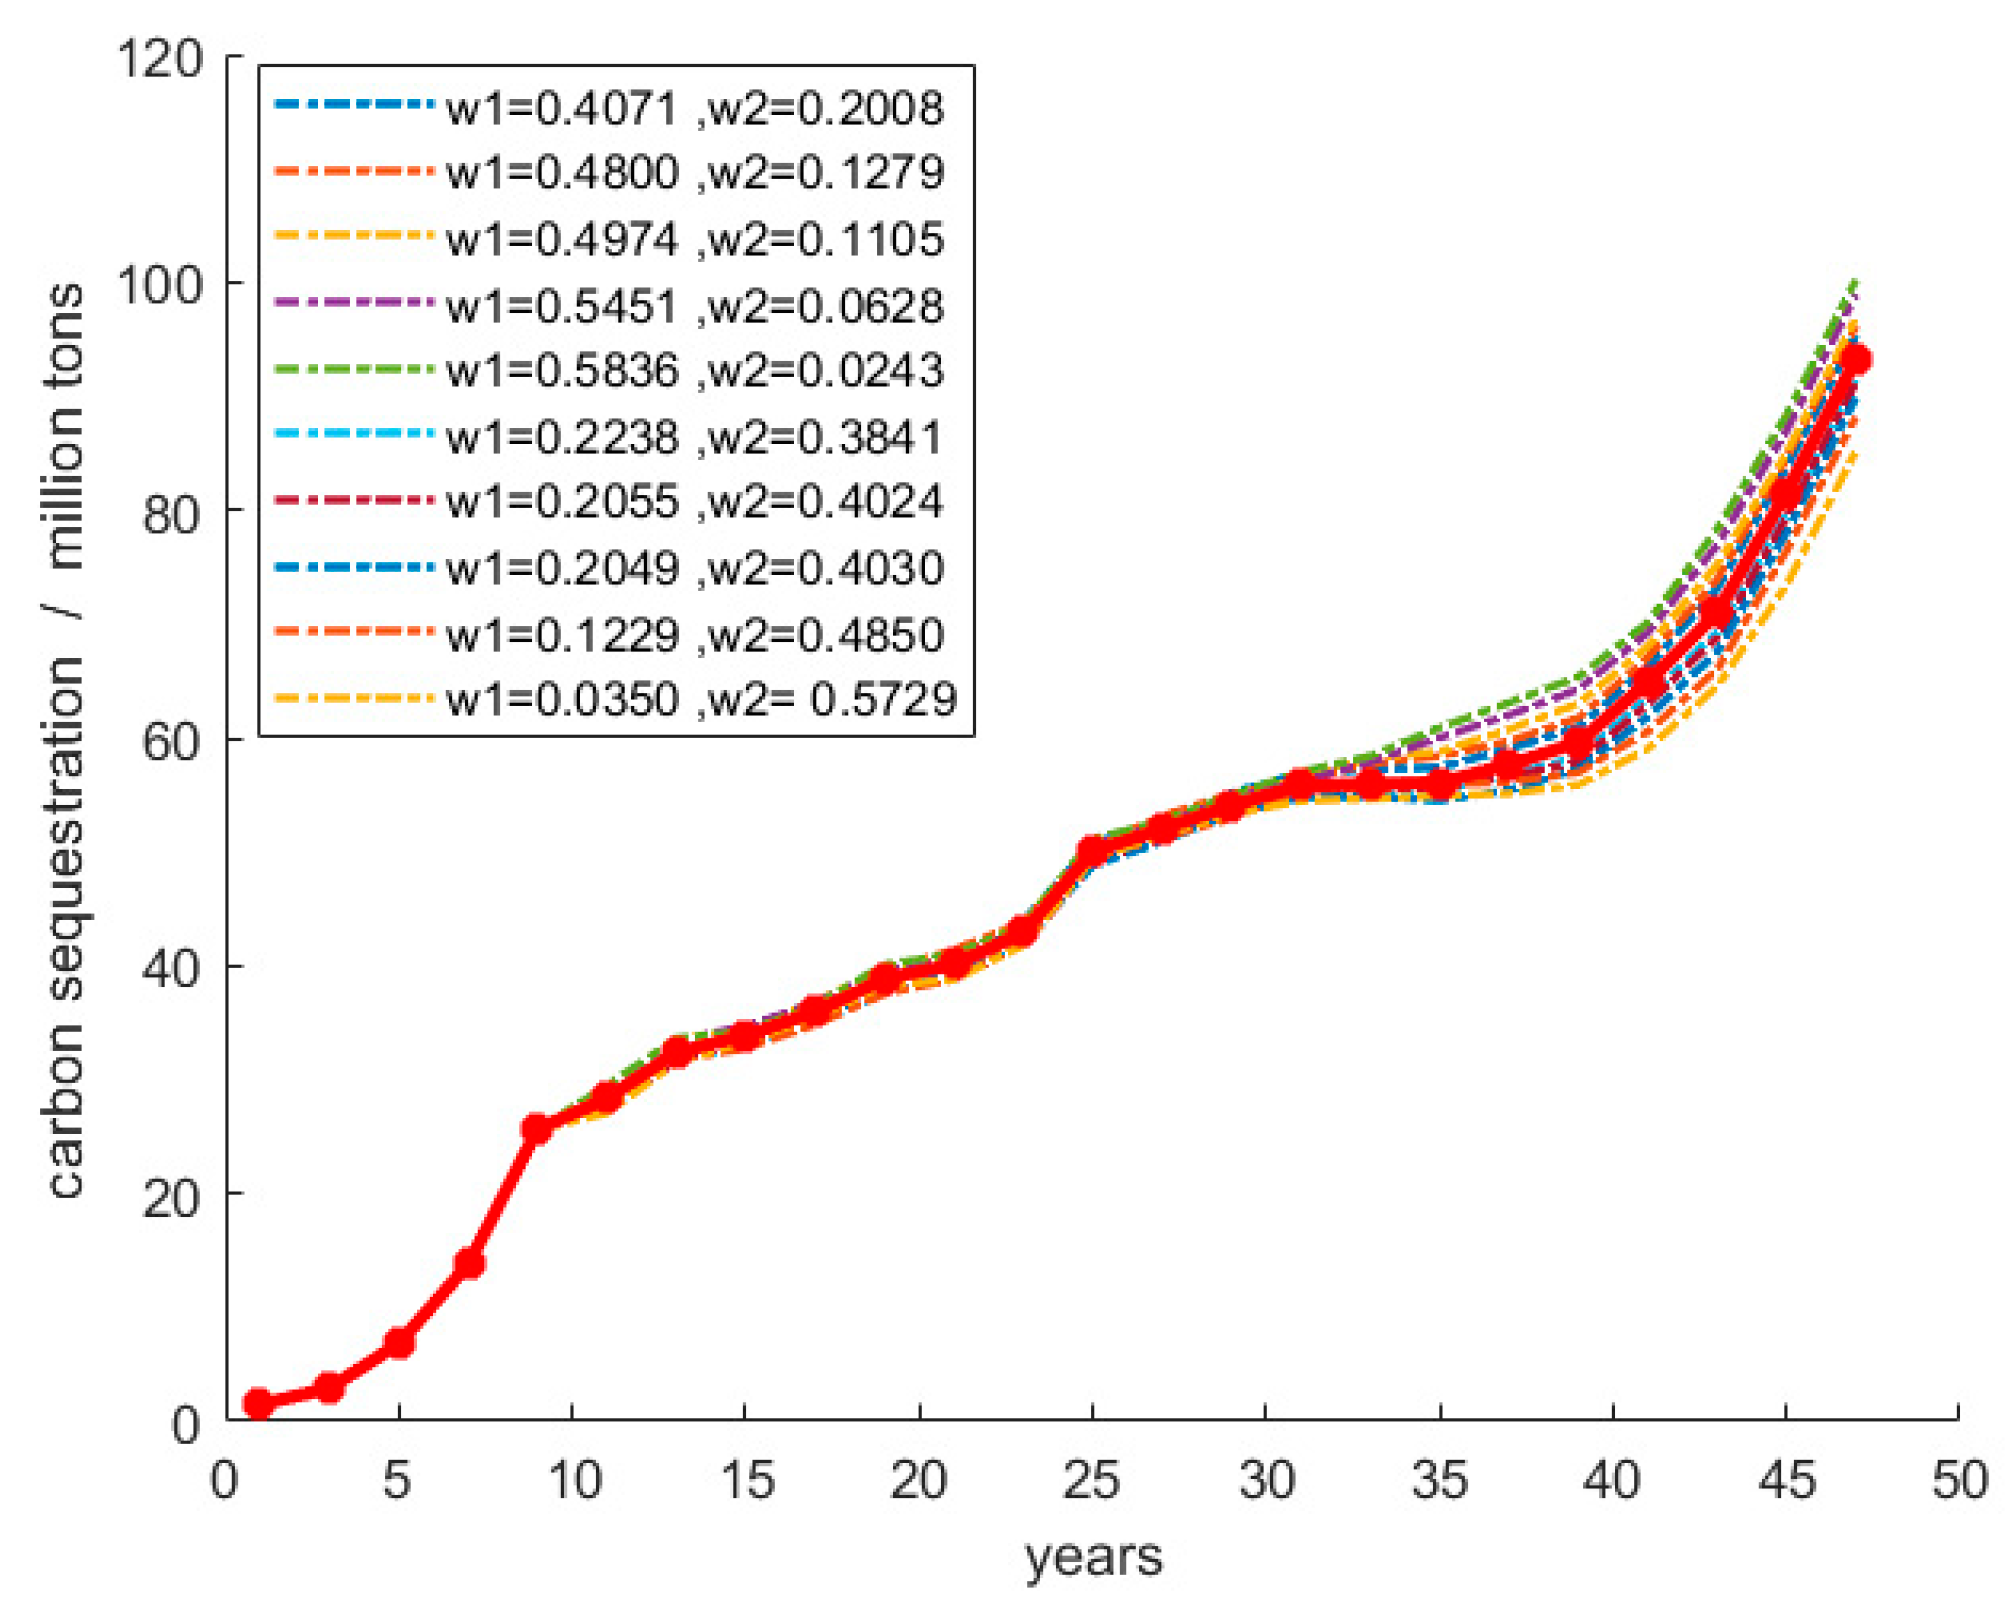
4.4. Sensitivity Analysis

4.4.1. The CS-H-P Model

The forest product loss rate S was set to 0.26–0.36, and the relationship between carbon sequestration and time corresponding to different loss rates is shown in Figure 6.
It can be seen from Figure 6 that the higher the loss rate setting, the lower the forest carbon sequestration and the higher the regeneration cutting age. That is, the greater the loss rate of forest products, the less easy it is to harvest.

4.4.2. The EEE Model

The sensitivity analysis for sampling the weights from a Gaussian distribution is shown in Figure 7.
The sensitivity analysis of the three important parameters α i , β i , and δ i in the EEE model is shown in Figure 8.
Based on Figure 8, it can be concluded that forest users are more concerned about the economic value generated by the forest system. Figure 8 is a three-dimensional columnar heat map with time as the horizontal axis and economic profit as the vertical axis. Since we had difficulty in determining the values of the three parameters, we performed a sensitivity analysis by varying these parameters.

5. Discussion

The CS-H-P model only considers optimization of the carbon sequestration of a forest, but the model that is most favorable to carbon sequestration is not necessarily favorable to the other values of said forest. Therefore, we should use both the carbon sequestration and the other values of the forest as the target function of the planning model to constitute a multi-objective planning for model improvement. Finally, a sustainable tree regeneration cutting age table for improving the carbon sequestration of the Great Khingan forest was provided for the Inner Mongolia government.
For the management scheme of regeneration cutting age with an average annual carbon sequestration of 1.4785 million tons, the regeneration cutting age of Scots pine and oak forests is between the minimum age of maturity and the minimum age of over-maturity, although they differ significantly from the regeneration cutting age under the traditional definition. This is because the growth rates of these two trees differ significantly at different times compared to other species of trees. Scots pine trees grow faster and are larger, so the carbon stock is larger for the same time span [45], and the calculated regeneration cutting age is closer to its over-mature age. According to Figure 1, combining the simulation results, we speculate that the carbon sequestration is higher due to the faster growth of Scots pine forests. In the case of only considering the carbon sequestration of forest products without economic benefits, cutting this type of tree that has reached a mature age will lead to more carbon sequestration. Oak forests are more used for protection and timber forest, and presumably, their growth rate fluctuates less. Therefore, their growth rate at young and middle ages should be properly adjusted over time when computer simulations are performed.
From Figure 7, the indicator Ω 1 of ecological functions is mainly about climatic conditions, and the global climate is roughly distributed by latitude and longitude. The longer the distribution distance of the selected forest system, the greater the variation degree of the selected index value and the greater the ecological function weight Ω 1 . Therefore, the calculated optimal harvest tree age is more focused on strengthening the ecological function of the forest system, and the carbon sequestration increases accordingly. This calculation method is mainly considered by forest managers. In the analysis of Ω 2 , for timber manufacturers, more consideration is given to the economic benefits of forests. The degree of variation of the economic benefit value represents the fluctuation range of product supply and demand in the timber market. The greater the fluctuation of the timber market, the greater the degree of variation of the value, and the greater the weight Ω 2 of the economic benefit. Therefore, the calculated optimal harvesting tree age is considered to accelerate economic development more, and carbon sequestration also decreases slightly. The weight Ω 3 of environmental quality is related to the specific forest system and was not analyzed here. Furthermore, from Figure 8, our analysis shows that the forest economic benefit decreases when the cost parameter increases; the environmental maintenance cost parameter has no significant effect on the economic return and can be negligible; and the forest economic benefit increases when the product profit parameter increases. It can be seen that the market has a great influence on the forest management system. In order to cope with the changes in the market, there should also be a transition strategy for the forest management plan.
There are some differences between the forest regeneration cutting age calculated in this example and the regeneration cutting age set by the government. The reason is that the traditional regenerative cutting age is based on the tree’s mature age, and communities or local governments must adhere to their national regenerative cutting age timeline [44]. However, this study includes a high-dimensional mathematical model for solving the regenerative cutting age by temporal logic. The average annual carbon sequestration in the Great Khingan forest calculated by the optimized carbon sequestration-only model in this study is 1.4785 million tons, which differs by 6.37% from the average annual carbon sequestration in the Great Khingan forest calculated by Wei et al. [43]. This is because Wei et al. used another biomass factor model that included carbon content for their study, whereas our study considered improved regeneration cutting ages on the basis of the biomass expansion factor method used in this paper to predict carbon sequestration in temporal logic. In addition, the reasons for the differences in carbon sequestration may also include the determination of indicator weights. Wu et al. used a VAR model to calculate the weights of indicators affecting forest carbon sequestration. Among the calculated indicators of ecological function, the weight of the mean annual precipitation of the forest is exactly twice the weight of the mean annual temperature of the forest. However, the proportion of the impact of wood production is only 58.6% of that of climatic conditions, which would result in higher carbon sequestration calculated by the model, but a lower economic profit [46]. Our study used the TOPSIS algorithm combined with EWM to calculate the weight, which also illustrates this phenomenon. At the same time, according to the sensitivity analysis of the weights of indicators affecting carbon sequestration in forests in this study, it can be speculated that increasing the weights of ecological functions such as climatic conditions will contribute to the growth of carbon sequestration. When increasing the weight of economic profit, we analyzed the trend of the curve and observed that carbon sequestration decreases for a period of time, but with time iteration, the level of carbon sequestration rises. Therefore, when forest managers use the model of this study to formulate forest management plans, they need to try to determine the weight of indicators using the methods mentioned in this study. Then, on this basis, the weights are sampled according to the Gaussian distribution, and then multiple simulations are carried out to analyze and formulate the regeneration cutting age plan according to local conditions. Finally, sustainable forest management is achieved.
The model established in this study still has some limitations. There are problems with double- and over-counting. For example, the ecological value of the forest system is directly assessed by the amount of carbon sequestration per year, ignoring the impact of other greenhouse gases on the ecological environment; there is a certain cross-value between the ecological and environmental management values, which makes the final evaluation value larger. We will optimize the algorithm and program for solving the model in our follow-up work and will add these influences into the calculation example to establish the model. In addition, forests in northern China are very sensitive to changes in climatic conditions, especially changes in temperature [47,48,49]. Our study does not analyze the mean annual temperature separately but integrates the mean annual temperature into the ecological function analysis. When the ecological function weight is higher, carbon sequestration will increase. However, in the simulations, it actually appears that carbon sequestration decreases as an indicator of temperature increases. It can be speculated that an increase in temperature within a certain range will lead to a reduction in carbon sequestration. The study by Liu et al. shows that in climatic conditions, the mean annual temperature has a much greater impact on forest biomass than the annual mean precipitation, and the increase in temperature caused by climate change will lead to a decrease in biomass, which will actually lead to a reduction in forest carbon sequestration [50]. The results of our study also show that the effect of annual mean temperature on carbon sequestration in forests is much greater than that of annual mean precipitation. The improved stem taper models and tree profile equations developed by Liu et al. nicely demonstrate the effect of temperature on forest biomass [45,50]. Therefore, our model needs to be considered to introduce an improved taper stem model to improve the analysis of climatic conditions.
In summary, we suggest that forest managers focus on three indicators in forest management: forest carbon sequestration level; economic benefits, and ecological environment to develop management plans. In particular, the influence of climatic conditions in the ecological function index cannot be ignored [33,51]. The geographical location of forests is different, and their temperature and precipitation are also different. Forest managers can collect the relevant data of the sub-indicators corresponding to the above three indicators by examining forests in different geographical locations, make a multi-level comprehensive evaluation of the value of these forests, and thus determine the indicator weights in order to find a more scientific regeneration cutting age. In addition, the geographical location of a forest will lead to different natural conditions. For example, forests in the southern and northern hemispheres, in mountainous and sandy areas, and in the middle and lower reaches of river basins have different dominant functions, so the appropriate forest management programs should be different [52]. Therefore, in the model we established, the parameters of the calculation model such as forest product income, maintenance costs and environmental compensation fee should also be improved according to the actual situation of the community or government.

6. Conclusions

In this work, we built a decision-making model for forest management, and then selected China’s Great Khingan forest to verify and analyze the model. The established carbon sequestration model developed a sustainable regeneration cutting age timeline for optimizing the carbon sequestration of the Great Khingan forest. Regarding carbon sequestration in the Great Khingan forest, this study has certain policy implications. Due to over-harvesting of the forests in the Great Khingan Mountains in recent years and frequent fire accidents, the level of carbon sequestration has decreased [53]. Therefore, the forest regeneration cutting age obtained by this model can be used as a new forest harvesting management plan to restore the level of forest carbon sequestration in the Great Khingan Mountains. In conclusion, the model established in this study is of great help for the improvement of forest carbon sequestration and forest sustainability. It would be an excellent decision for sustainable forest management if the community or government could further improve on this decision-making model.

Author Contributions

Conceptualization, Y.L. and T.L.; methodology, Y.L., T.L. and S.L.; software, Y.L. and T.L.; validation, Y.L., T.L. and S.L.; resources, Y.L. and S.L.; writing—original draft preparation, Y.L.; writing—review and editing, B.L. and S.L.; visualization, Y.L. and S.L.; supervision, B.L.; funding acquisition, B.L. All authors have read and agreed to the published version of the manuscript.

Funding

This research was funded by Education Department of Hunan Province, grant number HNJG-2021-0425; National Natural Science Foundation of China, grant number 62005234. The APC was funded by Education Department of Hunan Province, grant number HNJG-2021-0425.

Data Availability Statement

Publicly available datasets were analyzed in this study. This data can be found here: 1. https://baijiahao.baidu.com/s?id=1709573028362913257&wfr=spider&for=pc (accessed on 5 April 2022); 2. http://www.dxal.gov.cn/ztzl/zxzt/stjs/content_35402 (accessed on 5 April 2022); 3. https://www.xsbn.gov.cn/143.news.detail.phtml?news_id=20482 (accessed on 5 April 2022); 4. http://www.yn.gov.cn/zwgk/zcwj/zxwj/201607/t20160727_143040.html (accessed on 5 April 2022); 5. http://news.cctv.com/2017/08/04/ARTIQOhDqRoZfot45XBdFfBr170804.shtml (accessed on 5 April 2022); 6. http://www.gov.cn/zhengce/content/2021-02/09/content_5586306.htm (accessed on 5 April 2022); 7. https://baijiahao.baidu.com/s?id=1705872267192481239&wfr=spider&for=pc (accessed on 5 April 2022); 8. https://www.sohu.com/a/163363009_764932 (accessed on 5 April 2022); 9. https://baike.baidu.com/item/%E6%B9%96%E5%8C%97%E7%A5%9E%E5%86%9C%E6%9E%B6/4263798?fr=Aladdin (accessed on 18 April 2022); 10. http://jff.cern.ac.cn/content?id=40612 (accessed on 18 April 2022); 11. https://www.antpedia.com/news/67/n-120570.html (accessed on 18 April 2022); 12. http://gmm.gmw.cn/newsinfo/1913890.html?templateId=53440 (accessed on 18 April 2022); 13. https://www.nmg.gov.cn/asnmg/asnmg/asnmgxcp/202108/t20210820_1808276.html(accessed on 27 April 2022); 14. https://www.sohu.com/a/537495897_100117618 (accessed on 27 April 2022); 15. http://lyj.hainan.gov.cn/ywdt/zwdt/201604/t20160414_1393372.html (accessed on 13 May 2022); 16. http://www.hnszw.org.cn/xiangqing.php?ID=64251&Deep=6&Class=10076 (accessed on 13 May 2022). 17. http://lcj.nmg.gov.cn/xxgkzl/fdzdgknr/gzxzgfxwj/flfg/202111/t20211118_1954103.html (accessed on 24 May 2022).

Conflicts of Interest

The authors declare no conflict of interest.

Appendix A. Basic Model of the Biomass Expansion Factor

The formula is as follows:
W i j = A i · W s i n g l e   i j ,
where W i j is the total biomass of type i forests and type j trees, A i is the area of forest type i, W s i n g l e   i j is the biomass per unit area of forest type i and tree species type j.
The wood volume multiplied by its density is the wood volume, and is then multiplied by the biomass expansion factory to become biomass:
W s i n g l e   i j = V s i n g l e   i j · B E F i j · S V D i j ,
where B E F i j is the biomass expansion factor of type j tree species in type i forests, and S V D i j is the wood density of type j tree species in type i forest.
Thus, we can obtain the total biomass:
W i j = A i · V s i n g l e   i j · B E F i j · S V D i j
For forests that are not deforested, carbon sequestration mainly comes from tree growth, soil storage, and storage by other organisms, among which forest resources are mainly trees, while other resources are ignored. For a specific forest system, if we know its tree species and planting area, we can find the biomass of the forest system based on the above model and can then multiply the biomass by the carbon content rate to obtain the final carbon sequestration of the forest.

Appendix B. Description of the Ten Indicators and Their Interpretation

(1)
Ecological functions
(a)
Carbon sequestration X 1 (tons per 100 m2). Forest carbon sequestration refers to the process and mechanism by which forest plants absorb CO2 in the atmosphere and fix it in trees or soil, thereby reducing the concentration of this gas in the atmosphere [54], which can bring certain ecological benefits in the future. Therefore, we introduced carbon sequestration to assess forests.
(b)
Living wood growing stock X 2 (cubic meters per 100 m2). Living wood growing stock represents the timber productivity under the site ecological conditions of the local forest land, and it is an important factor reflecting the ecological value of forests.
(c)
Mean annual temperature X 3 (Celsius). Temperature can affect plant photosynthesis and respiration, resulting in changes in forest vegetation productivity and biomass [55]. Therefore, we chose the annual mean temperature as one of the eco-logical function indicators.
(d)
Mean annual precipitation X 4 (millimeters). Precipitation is an important way for plants to obtain water, which can affect the growth and development of plants, community characteristics and ecosystem structure, and then affect the distribution of forest biomass [56]. Thus, we introduced annual mean precipitation as an indicator for forest value assessment.
(2)
Economic benefits
(a)
Profits X 5 (100 million Chinese Yuan). Forests can be divided into commercial forests and ecological public welfare forests according to their resources [57], among which commercial forests can reflect their economic value in the form of currency, so it is necessary to use economic profit to make a comprehensive and objective assessment of the value of forests.
(b)
Forest harvesting X 6 (hectares). Timber and other forest products are essential raw materials in the construction of various industries, and forest harvesting is one of the ways to obtain raw materials. Appropriate forest harvesting can promote the economic development of society. Therefore, we introduced forest harvesting as an indicator for forest value assessment.
(3)
Environmental qualities
(a)
Number of tree species X 7 (number). Different types of trees have different abilities to absorb and fix carbon dioxide. Generally, the community structure is complex, and the species of higher plants that make up the community are abundant in places with favorable environmental conditions, whereas in places with harsh environmental conditions, only a few higher plants can adapt and the community structure is relatively simple. Therefore, the number of tree species is also a factor to be considered for the forest value.
(b)
Forest cover area X 8 (10,000 ha). Forest cover area is an important indicator reflecting the abundance of forest resources and ecological balance [58]. If the important natural factors affecting the forest system are considered, the forest cover area can also be used as an indicator for evaluating the value of forests.
(c)
Average number of fires per year X 9 (number). Forests have a long growth cycle and management cycle and are easily affected by natural disasters. After each disaster, the recovery of forests is very slow [59]. Among natural disasters, abiotic factors, including fire, are one of the main reasons that affect forest restoration and increase carbon sequestration. We chose the average number of fires per year as one of the environmental quality indicators.
(d)
Average annual pests and diseases area X 10 (10,000 ha). Biological factors, including pests and diseases, are the main natural risks faced when operating carbon sequestration forests [60]. we introduced average annual pests and diseases area as an indicator for forest value assessment.
Since the evaluation indicators contain be both positive and interval and there exists dimensional differences among most indicators, we used range normalization to normalize the data. Analyzing all of the indicators, we found that X 1 , X 2 , X 3 , X 4 , X 5 , X 8 are positive indicators: for these indicators, the higher the better. X 9 and X 10 are negative indicators: for these indicators, the lower the better. X 6 is an interval indicator. If the amount of forest harvesting is too small, the number of over-mature, diseased, and dead trees will increase, and a large number of decaying trees will lead to an increase in carbon emissions, and the carbon sequestration of the forest will decrease. Meanwhile, if the amount of forest harvesting is too large, it will lead to a decrease in forest biomass, and the carbon sequestration of the forest will also decrease, ultimately leading to a decline in forest values. X 7 is also an interval indicator. Too few species of trees may show that the forest is located in a harsher environment with less ecological value, while too many species of trees and a more complex community structure are not suitable for the development of tourism and other industries, with less economic value. Therefore, these two indicators should fall within a certain range.

Appendix C

Table A1. Data of ten indicators of eight forests.
(a)
ForestCarbon Sequestration
(t/hm2)
Living Wood Growing Stock
(m3/hm2)
Mean Annual Temperature
(°C)
Mean Annual Precipitation
(mm)
Profit
(100 MillionCNY)
Great Khingan0.1583 [38]80.370 [38]–1.42 [61]471.0 [61]8000
Xishuangbanna Tropical Rainforest8.9374 [62]124.621 [63]22.5 [64]1309.5 [64]1406
Saihanba Forest0.1120 [65]138.199 [66]–1.3460.3136 [66]
Changbai Mountain Forest2.5390 [67]108.2643.6 [68]632.8 [68]8899 [69]
Xiaoxing’an Mountain2.951994.000 [70]–1 [71]629.6 [71]74 [70]
Shennongjia Forestry District0.2451 [72]73.01912.6 [73]913.7 [73]286 [74]
Mordaoga National Forest0.9597 [75]100.435 [76]–5.3 [77]414.0 [78]6
Jianfengling Tropical Rainforest2.8789108.177 [79]24.5 [80]2100.0 [80]2045
(b)
ForestForest Harvesting
(10,000 m3)
Number of Tree SpeciesForest Cover Area
(10,000 hm2)
Average Number of Fires per YearAverage Annual Pests andDiseases Area
(10,000 hm2)
Great Khingan270.010 [38]997.883 [38]26 [81]13.33 [82]
Xishuangbanna Tropical Rainforest3259.620 [83]151.660 [63]0 [84]29.13 [85]
Saihanba Forest20.419 [86]7.333 [66]0 [87]0.5008 [88]
Changbai Mountain Forest56.3 [69]519.647 [69]2.46 [89]1.33 [90]
Xiaoxing’an Mountain25.015 [70]500.000 [70]30 [91]0
Shennongjia Forestry District20.0 [92]10 [73]27.650 [74]3.27 [93]0.3709 [94]
Mordaoga National Forest21.1 [76]6 [78]45.5003.2 [95]0
Jianfengling Tropical Rainforest10.9 [95]20 [79]8.59710.039

Appendix D

Table A2. Fitting equation of carbon dioxide absorption with time.
Decision ModelFitting EquationGoodness-of-Fit R2
CS-H-P Modelf(t)= 0.002t3 − 0.1505t2 + 4.702t − 8.5820.9896
EEE Modelf(t)= 0.002017t3 − 0.1498t2 + 4.654t − 9.598 0.9917
The goodness-of-fit R2 is close to 1, indicating that the fitting effect is good.

Appendix E

Table A3. Regeneration cutting age set by the Inner Mongolia government in 2016 [44].
SpeciesOriginRegeneration Cutting Age
Korean pine forests
Spruce forests
Natural forests161
Planted forests121
Larch forests
Fir forests
Scots pine forests
Natural forests121
Planted forests61
Sweet poplar forests
Willow forests
White birch forests
Oak tree
Soft broadleaf tree
Natural forests61
Planted forests31
Elm
Black birch
Oak tree
Hard broadleaf tree
Natural forests121
Planted forests81

References

  1. Lin, D. Research on the Marketization of Forest Carbon Sequestration Services. Ph.D. Thesis, Chinese Academy of Forestry, Beijing, China, 2005. [Google Scholar]
  2. Xu, L. The effect of forest management on forest carbon sequestration and its improvement measures. Mod. Agric. Technol. 2013, 179, 188. [Google Scholar]
  3. Zhao, H. Analysis on the importance of perfecting the forest harvesting management system. Biotech World 2012, 10, 59. [Google Scholar]
  4. Zhou, J. Research on Sustainable Forest Management and Management Mechanism in Southern Collective Forest Areas. Ph.D. Thesis, Beijing Forestry University, Beijing, China, 2010. [Google Scholar]
  5. Zhang, S.; Tang, X.; Cui, W.; Zhang, Y.; Wang, H.; Chen, Y.; Xie, S.; Wang, H.; Zhang, H.; Wang, Z. Compiled by the Forest Resources Management Department of the State Forestry Administration. Forest Harvesting Operation Regulations; China Forestry Publishing House: Beijing, China, 2007; Volume 6. [Google Scholar]
  6. Jiang, J.; Chen, A.; Han, J. Demonstration on the renewal and cutting age of farmland shelterbelts in aohan banner. Inn. Mong. For. Surv. Des. 2011, 34, 16–17. [Google Scholar] [CrossRef]
  7. Zhang, N.; Ning, Z.; Yang, H. The fursman model and its generalized improvement: Evolution of methodology based on woodland expectation. For. Econ. 2020, 42, 3–15. [Google Scholar] [CrossRef]
  8. Dai, Q. Simulation Research on Forest Harvesting Scheme Based on FSOS Model; Zhejiang Agriculture and Forestry University: Hangzhou China, 2020. [Google Scholar] [CrossRef]
  9. Faustmann, M. Calculation of the value which forest land and immature stands possess for forestry. In Economics of Forestry; Sedjo, R.A., Ed.; Ashgate: Burlington, MI, USA, 2003; pp. 1–40. [Google Scholar]
  10. Cui, W.; Wang, H.; Wang, S.; Zhang, J. A study on the renewal cutting age of farmland shelter forest in Nong’an county, Jilin province. For. Sci. Res. 2000, 13, 519–523. [Google Scholar] [CrossRef]
  11. Hu, H.; Jiang, Z.; Yuan, C. Discussion on the harvesting age of farmland shelterbelts. Jiangsu For. Technol. 1999, 1, 58–62. [Google Scholar]
  12. Li, H.; Fan, H.; Ma, H. Talking about the determination of cutting age from the view of forest benefit. Agric. Syst. Sci. Integr. Res. 1992, 1, 60–63. [Google Scholar]
  13. Hu, Y.; Su, Z.; Li, P.; Li, W. A comparative study of stand biomass carbon measurement models. J. Cent. South Univ. For. Technol. 2015, 35, 84–88. [Google Scholar] [CrossRef]
  14. Xu, S.; Yao, S. Analysis of regional differences in forest carbon storage in my country based on biomass conversion factor method. J. Beijing For. Univ. 2009, 8, 109–114. [Google Scholar]
  15. Xu, S. A review of forest, carbon storage estimation methods. For. Inventory Plan. 2014, 39, 28–33. [Google Scholar] [CrossRef]
  16. Hu, H.; Luo, B.; Wei, S.; Wen, Z.; Sun, L.; Luo, S.; Wang, L.; Ma, H. Forest biological carbon storage of five typical forest types in the Great Khingan Mountains. J. Ecol. 2015, 35, 16. [Google Scholar]
  17. Yang, H.; Ji, C.; Yang, H.; Nie, Y.; Yang, X. The emission reduction contribution of China’s forest products under global climate change: Accounting based on the carbon sequestration function of wood forest products. J. Nat. Resour. 2013, 28, 11. [Google Scholar]
  18. Gao, Y. Evaluation of Forest Resources in Beijing Mountains. Ph.D. Thesis, China Agricultural University, Beijing, China, 2005. [Google Scholar] [CrossRef]
  19. van Kooten, C.G.; Binkley, C.S.; Delcourt, G. Effect of carbon taxes and subsidies on optimal forest rotation age and supply of carbon services. Am. J. Agric. Econ. 1995, 77, 365–374. [Google Scholar] [CrossRef] [Green Version]
  20. Hou, G.; Delang, C.O.; Lu, X.; Olschewski, R. Optimizing rotation periods of forest plantations: The effects of carbon accounting regimes. For. Pol. Econ. 2020, 118, 102263. [Google Scholar] [CrossRef]
  21. Cambero, C.; Alexandre, M.H.; Sowlati, T. Life cycle greenhouse gas analysis of bioenergy generation alternatives using forest and wood residues in remote locations: A case study in British Columbia, Canada. Resour. Conserv. Recycl. 2015, 105, 59–72. [Google Scholar] [CrossRef] [Green Version]
  22. Kolo, H.; Kindu, M.; Knoke, T. Optimizing forest management for timber production, carbon sequestration and groundwater recharge. Ecosyst. Serv. 2020, 44, 101147. [Google Scholar] [CrossRef]
  23. Du, Z.; Su, T.; Ge, J.; Wang, X. Forest carbon sequestration and their spatial spillover effects in the context of carbon neutrality. Econ. Res. 2021, 56, 187–202. [Google Scholar]
  24. Wang, D.; Gu, J.; Holmes, T.P. Stochastic dynamic programming model for deforestation strategy optimization. Inf. Control. 1992, 21, 180–183. [Google Scholar]
  25. Fang, J.; Guo, Z.; Piao, S.; Chen, A. Estimation of China’s terrestrial tree carbon sequestration from 1981 to 2000. Chin. Sci. Ser. D Earth Sci. 2007, 37, 804–812. [Google Scholar]
  26. Neary, D.G.; Klopatek, C.C.; DeBano, L.F.; Ffolliott, P.F. Fire effects on belowground sustainability: A review and synthesis. For. Ecol. Manag. 1999, 122, 51–71. [Google Scholar] [CrossRef]
  27. Isaev, A.S.; Korovin, G.N.; Bartalev, S.A.; Ershov, D.V.; Janetos, A.; Kasischke, E.S.; Shugart, H.H.; French, N.H.F.; Orlick, B.E.; Murphy, T.L. Using Remote Sensing to Assess Russian Forest Fire Carbon Emissions. Clim. Change 2002, 55, 235–249. [Google Scholar] [CrossRef]
  28. Dixon, R.K.; Krankina, O.N. Forest fires in Russia: Carbon dioxide emissions to the atmosphere. Can. J. For. Res. 1993, 23, 700–705. [Google Scholar] [CrossRef]
  29. González-Pérez, J.A.; González-Vila, F.J.; Almendros, G.; Knicker, H. The effect of fire on soil organic matter—A review. Environ. Int. 2004, 30, 855–870. [Google Scholar] [CrossRef] [PubMed]
  30. Zavadskas, E.K.; Mardani, A.; Turskis, Z.; Jusoh, A.; Nor, K.M. Development of TOPSIS method to solve complicated decision-making problems:an overview on developments from 2000 to 2015. Int. J. Inf. Technol. Decis. Mak. 2016, 15, 645–682. [Google Scholar] [CrossRef]
  31. Cheng, Q. Structural Entropy Weight Method for Determining the Weight of Evaluation Index. Syst. Eng. Theory Pract. 2010, 4, 1225–1228. [Google Scholar]
  32. Yu, M.; Liu, X.; Xue, L. Research progress on the effects of temperature and precipitation on forest biomass allocation. Ecol. Sci. 2021, 40, 204–209. [Google Scholar] [CrossRef]
  33. Wu, Z.; Dijkstra, P.; Koch, G.W.; Peñuelas, J.; Hungate, B.A. Responses of terrestrial ecosystems to temperature and precipitation change: A meta-analysis of experimental manipulation. Glob. Change Biol. 2011, 17, 927–942. [Google Scholar] [CrossRef] [Green Version]
  34. Ye, Z. On the selection of index forwarding and dimensionless methods in multi-index comprehensive evaluation. Stat. Sci. Pract. 2003, 4, 24–25. [Google Scholar]
  35. Qin, X.; Si, Y.; Deng, L. A Study on the Maintenance and Management Fee Standards of Forest Parks in Big Cities: Taking Beijing Forest Park as an Example. J. Cent. South Univ. For. Technol. Soc. Sci. Ed. 2017, 11, 49–54. [Google Scholar] [CrossRef]
  36. Tong, B.; Yang, Y. Research on the application of main garden tree resources in the Great Khingan Mountains. Res. Land Nat. Resour. 2008, 4, 93–94. [Google Scholar] [CrossRef]
  37. State Forestry and Grassland Administration. Guidelines for Accounting of Carbon Pools in Forest Ecosystems: LY/T 2988-2018[S]; State Forestry and Grassland Administration: Beijing, China, 2018.
  38. Zhao, B.; Zhang, J. Evaluation of the status quo of forest resources in the Daxinganling forest area of Inner Mongolia. Inn. Mong. For. Surv. Des. 2014, 37, 29–30, 37. [Google Scholar] [CrossRef]
  39. Zhang, X.; Xu, Z.; Wang, J.; Song, W.; Qin, J.; Hu, X.; Zhang, W.; Zhou, J. Carbon stock dynamics and sequestration potential of forest tree in Xishuangbanna. J. Ecol. Environ. 2011, 20, 397–402. [Google Scholar] [CrossRef]
  40. Zhu, Q. Design and Realization of Forest Resources Data Visualization System in Saihanba Forest Farm. Master’s Thesis, Beijing Forestry University, Beijing, China, 2019. [Google Scholar] [CrossRef]
  41. Wu, Y.; Zeng, Y.; Wu, B.; Li, X.; Wu, W. Extraction and analysis of tree coverage in Three-North Shelter Forest Project area based on MODIS data. J. Ecol. 2009, 28, 1712–1718. [Google Scholar]
  42. Zhang, Z.; Xu, Y. MATLAB Tutorial (Version 7.0); Beihang University Press: Beijing, China, 2005. [Google Scholar]
  43. Wei, C.; Zhao, X.; Li, H. Estimation of forest carbon storage and carbon sequestration in Daxing’an Mountains, Heilongjiang. Shelter. For. Sci. Technol. 2016, 6, 51–53. [Google Scholar]
  44. Measures for the Administration of Regeneration and Cutting of Public Welfare Forests. Available online: http://lcj.nmg.gov.cn/xxgkzl/fdzdgknr/gzxzgfxwj/flfg/202111/t20211118_1954103.html (accessed on 18 November 2021).
  45. Wu, S.; Li, Y.; Yu, D.; Zhou, L.; Zhou, W.; Guo, Y.; Wang, X.; Dai, L. Analysis of factors affecting carbon storage in forest vegetation based on VAR model—taking Shaanxi Province as an example. Acta Ecol. 2015, 35, 196–203. [Google Scholar]
  46. Fu, Y.; He, H.S.; Zhao, J.; Larsen, D.R.; Zhang, H.; Sunde, M.G.; Duan, S. Climate and Spring Phenology Effects on Autumn Phenology in the Greater Khingan Mountains, Northeastern China. Remote Sens. 2018, 10, 449. [Google Scholar] [CrossRef] [Green Version]
  47. Ecology Research—Forest Ecology; Researchers at Public University of Navarre Release New Data on Forest Ecology (Incorporating Climate Effects In Larix Gmelinii Improves Stem Taper Models In the Greater Khingan Mountains of Inner Mongolia, Northeast China). Ecol. Environ. Conserv. 2020, 464, 118065.
  48. Jiang, Y.; Zhang, J.; Han, S.; Chen, Z.; Setälä, H.; Yu, J.; Zheng, X.; Guo, Y.; Gu, Y. Radial Growth Response of Larix gmelinii to Climate along a Latitudinal Gradient in the Greater Khingan Mountains, Northeastern China. Forests 2016, 7, 295. [Google Scholar] [CrossRef] [Green Version]
  49. Liu, Y.; Trancoso, R.; Ma, Q.; Yue, C.; Wei, X.; Blanco, J.A. Incorporating climate effects in Larix gmelinii improves stem taper models in the Greater Khingan Mountains of Inner Mongolia, northeast China. For. Ecol. Manag. 2020, 464, 118065. [Google Scholar] [CrossRef]
  50. Liu, Y.; Yue, C.; Wei, X.; Blanco, J.A.; Trancoso, R. Tree profile equations are significantly improved when adding tree age and stocking degree: An example for Larix gmelinii in the Greater Khingan Mountains of Inner Mongolia, northeast China. Eur. J. For. Res. 2020, 139, 443–458. [Google Scholar] [CrossRef]
  51. Wang, H.; Cheng, P.; Peng, J. Discussion on the development advantages of bamboo plants in forest carbon sequestration. Green Sci. Technol. 2012, 2, 45–46. [Google Scholar]
  52. Liu, B.; Tian, X. Estimation of carbon release from Huzhong forest fire in the Daxingan Mountains. For. Resour. Manag. 2011, 3, 47–51. [Google Scholar] [CrossRef]
  53. Jiang, R.; Wei, C.; Zhou, Y. Functional orientation and management strategies of forest resources around central cities. Econ. Res. Guide 2015, 6, 156–158. [Google Scholar]
  54. Ma, W.; Liu, Z.; Wang, Z.; Wang, W.; Liang, C.; Tang, Y.; He, J.; Fang, J. Climate change alters interannual variation of grassland aboveground productivity: Evidence from a 22-year measurement series in the Inner Mongolian grassland. J. Plant Res. 2010, 123, 509–517. [Google Scholar] [CrossRef] [PubMed]
  55. Knapp Alan, K.; Ciais, P.; Smith Melinda, D. Reconciling inconsistencies in precipitation-productivity re-lationships: Implications for climate change. New Phytol. 2017, 214, 41–47. [Google Scholar] [CrossRef] [Green Version]
  56. Cai, T.; Kong, F.; Jiang, D. Current situation, problems and countermeasures of forest classification management in China. J. Northeast. For. Univ. 2003, 31, 3. [Google Scholar]
  57. Forestry and Grassland Bureau of Gansu Province, China. Statistical Yearbook Main Statistical Indicators Explained; Forestry and Grassland Bureau of Gansu Province: Gansu, China, 2020.
  58. Qin, J.; Gao, L.; Zhou, W. Risk factors analysis of carbon sink forest management in Guangdong Province. Guangdong Agric. Sci. 2014, 41, 200–205. [Google Scholar] [CrossRef]
  59. Zhou, W.; Gao, L. An Empirical Analysis of the Impact of Forest Disasters on Carbon Sequestration: Taking Guangdong Province as an Example. J. Agric. For. Econ. Manag. 2017, 16, 224–229, 239. [Google Scholar] [CrossRef]
  60. Zhang, Y.; Hu, H. Climate change in the Greater Khingan Mountains and its impact on forest fires. J. Northeast. For. Univ. 2008, 7, 29–31, 36. [Google Scholar]
  61. Zhang, Y.; Zhao, S.; Yu, G.; Dou, J.; Liu, W.; Sun, X. Observation of microclimate characteristics and CO2 flux on the canopy of tropical seasonal rain forest in Xishuangbanna in dry and hot season. Acta Ecol. 2005, 25, 2540–2549. [Google Scholar]
  62. State Forestry and Grassland Administration. Biodiversity Conservation in China—Yunnan Forestry Chapter 1_Forest and Grass Science_State Forestry and Grassland Administration Government Network; State Forestry and Grassland Administration: Beijing, China, 2020.
  63. Yu, Y.; Meng, G.; Zhang, L. Characteristics of climate change in Xishuangbanna in the past 45 years. Meteorol. Sci. Technol. 2008, 4, 410–413. [Google Scholar] [CrossRef]
  64. Zhang, P. Research measures on carbon sinks for afforestation management in Saihanba Forest Farm. Jiangxi Agric. 2018, 6, 107. [Google Scholar] [CrossRef]
  65. Fu, L.; Yu, S.; Cheng, S.; Xu, Z.; Li, Y. Evaluation of service value of forest ecosystem in Saihanba Mechanical Forest Farm in Hebei Province. For. Ecol. Sci. 2022, 34, 386–392. [Google Scholar]
  66. Yu, J.; Luo, C.; Xu, Q.; Meng, S.; Li, J.; Liu, Q. Radial growth and carbon sequestration potential of Pinus koraiensis in primeval forest in Changbai Mountains. J. Ecol. 2016, 36, 2626–2636. [Google Scholar] [CrossRef]
  67. Xu, Z.; Dai, L.; Chen, J.; Wang, Z.; Dai, H.; Li, X. Study on natural regeneration conditions of mixed forest of Korean pine and broad-leaved forest in Changbai Mountain. Acta Ecol. 2001, 21, 1413–1420. [Google Scholar]
  68. Shi, Y.; Liu, S. Dynamic analysis of forest resources in key state-owned forest areas in Changbai Mountain: Taking Linjiang Forestry Bureau as an example. J. Beihua Univ. Nat. Sci. Ed. 2016, 17, 469–472. [Google Scholar]
  69. Ren, P.; Chen, W. Assessment of Forest Ecosystem Service Value in Xiaoxing’an Mountains. For. Sci. Technol. Inf. 2020, 52, 1–4. [Google Scholar]
  70. Zhou, W.; Mu, C.; Liu, X.; Gu, H. Carbon sink function of natural forest swamp ecosystem in Xiaoxing’an Mountains. J. Northeast. For. Univ. 2012, 40, 71–75, 127. [Google Scholar] [CrossRef]
  71. Kong, S. Research on low-carbon economic development in ecological functional areas: Taking Shennongjia forest area as an example. Mark. Wkly. Theor. Res. 2016, 8, 62–64. [Google Scholar]
  72. Chen, L.; Wang, Z.; Lei, Y.; Lin, L.; Liao, M.; Yang, J. Analysis on the characteristics of climate change in Shennongjia forest area from 1990 to 2010. J. Hubei Univ. Nat. Sci. Ed. 2013, 35, 11–16. [Google Scholar]
  73. Xiao, Y.; He, P.; Zhang, L.; Bao, L. Shennongjia: Making Forest Carbon Sink Sustainable. Hubei Daily, 3 August 2010. [Google Scholar] [CrossRef]
  74. Zhou, Y.; Liu, Q.; Meng, S.; Luo, C.; Chen, X. Forest carbon storage and its changes in Moerdaoga forest area. J. For. Environ. 2016, 36, 319–324. [Google Scholar]
  75. Wang, H.; Lu, D. Analysis of forest resources change in Moerdaoga Forestry Bureau. Inn. Mong. For. Surv. Des. 2012, 35, 56–58. [Google Scholar] [CrossRef]
  76. Bian, K. A brief discussion on the status of natural forest resources protection project of Mordaoga Forestry Bureau and the sustainable development of forest resources. Inn. Mong. For. Surv. Des. 2012, 35, 3–5, 127. [Google Scholar] [CrossRef]
  77. Ce, R.; Xie, Z.; Li, B. Shallow light on the landscape resources and tourism development of Moerdaoga National Forest Park in the Great Khingan Mountains. J. Inn. Mong. For. Surv. Des. 2001, 24, 32–34, 43. [Google Scholar]
  78. Guo, N.; Jiang, Z.; Li, Y.; Xie, M. Sustainable management of tropical forest ecosystem in Jianfengling, Hainan. Trop. For. 2002, 30, 16–19. [Google Scholar]
  79. Luo, W.; Zhong, Y.; Chen, J.; Chen, H.; Mo, S. Analysis of Geographical Flora of Ancient Trees in Jianfengling National Forest Park, Hainan. Trop. Agric. Sci. 2020, 40, 62–67. [Google Scholar]
  80. Yu, C.; Zhang, H.; Yang, X. Analysis on the characteristics of forest fires in the Daxing’an Mountains. Heilongjiang Meteorol. 2007, 4, 28–29, 34. [Google Scholar]
  81. Mei, M.; Liu, Z.; Cao, J. Analysis on the Causes and Control Countermeasures of Forest Diseases and Insect Pests in the Daxinganling Forest Region of Inner Mongolia. Inn. Mong. For. 2013, 4, 14–15. [Google Scholar] [CrossRef]
  82. Zhu, H. On the classification of forest vegetation in Xishuangbanna, southern Yunnan. Yunnan Plant Res. 2007, 4, 377–387. [Google Scholar]
  83. Wu, C. Xishuangbanna Nature Reserve has no forest fires for 10 consecutive years. Yunnan For. 1999, 4, 26. [Google Scholar]
  84. Li, Y. The occurrence and trend forecast of forest pests in Yunnan. Yunnan For. 2009, 30, 52. [Google Scholar]
  85. Ma, C. Study on Soil Species and Suitable Tree Species in Saihanba Forest. Jiangxi Agric. 2017, 99, 102. [Google Scholar] [CrossRef]
  86. Zhang, W.; Liu, G.; Ma, J. Thoughts on forest fire prevention and fire fighting in state-owned forest farms: Taking Hebei Saihanba Mechanical Forest Farm as an example. China Emerg. Manag. 2022, 1, 58–61. [Google Scholar]
  87. Liu, X. Occurrence characteristics and forecast analysis of major leaf-eating pests in Saihanba National Forest Park. Anhui Agric. Sci. Bull. 2019, 25, 62–64, 81. [Google Scholar] [CrossRef]
  88. Corps, J. Research on forest fire prevention and fighting strategies in Changbai Mountain Nature Reserve. In Proceedings of the 2016 Modern Forest Fire Development Forum, Xiamen, China, 1 November 2016. [Google Scholar]
  89. Zhang, Z. Research on the characteristics and control measures of forest pests in Changbai Mountain. China Agric. Mater. 2013, 40, 60. [Google Scholar]
  90. He, J.; Zhang, G.; Wang, G. The regularity of forest fire occurrence and the establishment of forest fire weather grade model in Xiaoxing’an Mountains. Heilongjiang Meteorol. 2011, 28, 21–22. [Google Scholar] [CrossRef]
  91. Editorial Department of This Journal. The leap from “wood finance” to “ecological tourism finance”—Financial support for ecological and tourism economic development in Shennongjia Forest Region. Hubei Financ. Tax. 2002, 21, 12–13. [Google Scholar]
  92. Li, C. Characteristics of forest fires in Shennongjia forest area and fire fighting countermeasures. For. Fire Prev. 1994, 4, 21–22. [Google Scholar]
  93. Li, W.; Zhou, J.; Tan, J. Strengthening the prevention and control of forest diseases and insect pests in Shennongjia and promoting regional social development. Hubei Agric. Sci. 2009, 48, 239–242. [Google Scholar]
  94. The Ministry of Civil Affairs of the People’s Republic of China. Inner Mongolia Autonomous Region of the People’s Republic of China Political Ceremony; Huang, S., Lan, E., Eds.; China Society Press: Beijing, China, 2018; Volume 1, pp. 0426–0428.
  95. Zeng, Q.; Qiu, J. Forest harvesting and climate in Jianfengling forest area of Hainan Island. Trop. For. Sci. Technol. 1980, 3, 26–34. [Google Scholar]
Figure 1. Analysis chart: The regeneration cutting age of natural forests.
Forests 13 00838 g001
Figure 2. Analysis chart: The regeneration cutting age of planted forests.
Forests 13 00838 g002
Figure 3. Comparison chart of forest carbon dioxide absorption (considering only carbon sequestration).
Forests 13 00838 g003
Figure 4. Regeneration cutting ages of the natural and planted forests in the Great Khingan region.
Forests 13 00838 g004
Figure 5. Comparison of carbon sequestration for comprehensive decision-making and carbon sequestration only.
Forests 13 00838 g005
Figure 6. Sensitivity analysis of the forest product loss rate S.
Forests 13 00838 g006
Figure 7. Sensitivity analysis with weights sampled from a Gaussian distribution.
Forests 13 00838 g007
Figure 8. Sensitivity analysis for changing three important parameters.
Forests 13 00838 g008
Table 1. Survey and statistical table of basic data of five forest types in the Great Khingan region [38].
Tree SpeciesMean BEF of Different AgesSVDAij/hm2Average DBII/cmAverage Tree Height/mq1j/%q2j/%
White birch forests (W)1.3140.5412,422,232.15.608.170.0930.090
Larch forests (L)1.6510.4135,067,690.36.727.530.1510.139
Scots pine forests (S)1.6510.413111,714.49.9810.060.2050.172
Oak forests (O)1.4140.676329,047.05.145.250.0720.071
Poplar forests (P)1.5150.478304,164.45.876.270.1070.104
where q 1 j and q 2 j represent the initial value of the annual growth rate, respectively, of the volume of type j tree species of the natural and planted forests in the Great Khingan region.
Table 2. Table of regeneration cutting ages.
SpeciesRegeneration Cutting Age
Natural ForestsPlanted Forests
White birch forests6432
Larch forests11665
Scots pine forests13661
Oak forests11075
Poplar forests7142
Table 3. Table of new regeneration cutting ages.
SpeciesRegeneration Cutting Age
Natural ForestsPlanted Forests
White birch forests6534
Larch forests13466
Scots pine forests12364
Oak forests11177
Poplar forests7338
Publisher’s Note: MDPI stays neutral with regard to jurisdictional claims in published maps and institutional affiliations.

