Article

Effects of Irrigation and Nitrogen Application on Soil Nutrients in Triploid Populus tomentosa Stands

1
The Key Laboratory for Silviculture and Conservation of Ministry of Education, College of Forestry, Beijing Forestry University, Beijing 100083, China
2
Huayang Forest Tree Nursery Field, Xingtai 054700, China
3
College of Biological and Food Engineering, Huaihua University, Huaihua 418000, China
4
College of Resource & Environment, Shanxi Agricultural University, Jinzhong 030810, China
5
Agriculture and Rural Bureau of Qingbaijiang District, Chengdu 610300, China
6
Institute of Agricultural Resources and Environment, Hebei Academy of Agriculture and Forestry Science, Shijiazhuang 050051, China
*
Author to whom correspondence should be addressed.
Forests 2022, 13(7), 1046; https://doi.org/10.3390/f13071046
Submission received: 16 May 2022 / Revised: 23 June 2022 / Accepted: 29 June 2022 / Published: 2 July 2022
(This article belongs to the Special Issue Soil Fertility as a Driver in Forest Ecosystems)

Abstract

:
Irrigation and nitrogen application directly affect the availability and distribution of soil nutrients. Understanding the response of soil nutrients to long-term water–fertilizer coupling conditions is helpful to improve the management and use efficiency. Irrigation was divided into three gradient levels, which accounted for 45%, 60%, and 75% (W1, W2, and W3) of the field water holding capacity. Based on pure nitrogen, four levels of nitrogen application were set: 0.0, 101.6, 203.2, and 304.8 kg·hm−2 (N0, N1, N2, and N3). We measured tree height and diameter at breast height (DBH), and we analyzed the chemical properties of the soil at 0–40 cm depth, from 2007 to 2020. The ranges of DBH, tree height, individual volume, and stand volume were 5.80–25.25 cm, 6.10–16.47 m, 0.01–0.37 m3, and 11.76–481.47 m3·hm−2, respectively. The contents of organic matter, total nitrogen, available phosphorus, and available potassium in the soil ranged from 8.60 g·kg−1 to 18.72 g·kg−1, from 0.21 g·kg−1 to 0.79 g·kg−1, from 8.09 mg·kg−1 to 47.05 mg·kg−1, and from 90 mg·kg−1 to 322 mg·kg−1, respectively. Soil pH value decreased rapidly at a rate of 0.31 units per year for the first five years. Irrigation and nitrogen application, and their interaction, had significant (p < 0.01) effects on soil total nitrogen, available phosphorus, available potassium, and nitrate-nitrogen. We suggest maintaining the field water holding capacity above 60%, with a nitrogen application rate of 203.2 kg·hm−2, to save water, maintain soil fertility, and optimize soil nitrogen supply. Our study aimed to achieve scientific and accurate fertilization of Populus tomentosa stands over different periods, to alleviate the decline of soil fertility, and to improve the utilization rate of water and fertilizer through long-term nutrient monitoring.

1. Introduction

Forests play an important role in timber production, controlling climate change by storing carbon in forest biomass, and being used as a substitute for fossil fuels to reduce net carbon emissions [1]. With the increasing demand for wood in the market, it is estimated that 75% of industrial wood will be provided by plantations by 2050, of which 50% will be provided by fast-growing forests [2,3]. At approximately 31 million hectares, poplar plantations are one of the most widely planted fast-growing forests in the world [4,5].
Compared with other fast-growing poplar cultivars, Populus tomentosa adapts to various climate and soil conditions, and has developed rapidly in northern China [6]. The height of these poplars grows the fastest, in 5–10 years; and its DBH grows faster than most others, in 10–15 years; with the fastest growth of volume occurring in a growing season from April to August [7,8].
Soil nutrient content plays a key role in soil–plant feedback, and is also the critical limiting factor affecting forest growth and net primary productivity [9,10]. Generally, organic matter, nitrogen, phosphorus, potassium, and other nutrient elements are vital indicators for evaluating soil fertility and nutrient status [11,12]. The soil nutrient pool is influenced by natural and anthropogenic factors, such as soil texture, climatic conditions, vegetation roots, cultivation, land use, irrigation, and fertilization. Fertilization and irrigation are the two major factors affecting soil nutrient pools [13,14]. Optimizing the utilization of water, fertilizer, and soil resources can improve the sustainability of the plantation ecosystem and maximize wood production without causing negative impacts to the environment.
Soil water content is one of the main limiting factors for forest production, and reasonable irrigation can improve the efficiency of fertilizer utilization [15], while excessive water use may lead to a large amount of leaching of soil nutrients [16,17]. Yu et al. found that a large amount of total nitrogen and total phosphorus were lost from bare and agricultural land when rainfall was less than 60 mm [18]. Studies have indicated that in semi-arid forests, a decrease in annual average soil water content at the surface layer might lead to a decrease in nutrient diffusion and volatility. The nutrients were locked into dry soil, which led to the slow decomposition of litter, the slow mineralization and circulation of nutrients, and a decrease in abundance and activity of fine roots and mycorrhizal fungi. Lupe León-Sánchez et al. used passive rainout shelters to intercept and exclude 30% of the incoming rainfall from impacting the Helianthemum squamatum shrub, and they found that the water use efficiency was dramatically reduced, by 50% [19,20,21].
Fertilization, along with irrigation, directly provides nutrition for the roots to meet the nutritional requirements of plants [22]. Mineral nitrogen fertilizer promotes the decomposition of soil organic matter, and the organic carbon reserves gradually decrease. An increase in vegetation litter provides additional organic matter input to supplement organic carbon consumption [23,24]. Zhang et al. found that long-term application of nitrogen fertilizer may significantly increase the soil ammonium nitrogen content [25], but excessive application may lead to the accumulation of nutrients in the field and the leaching of a large amount of nitrate. Long-term application of chemical and organic fertilizers increases the total, available, inorganic, and organic phosphorus content of the soil to varying degrees [26], while the effect of combining the application of nitrogen, phosphorus, and potassium fertilizers is more obvious. A large amount of phosphorus exists in soil colloids, which may promote the transformation of clay minerals [27]. Cherney et al. found that long-term application of an inorganic fertilizer alone, especially a nitrogen or phosphorus fertilizer, resulted in a declining trend in the content of both slow-acting and available potassium in the soil; the downward trend was slowed if potassium fertilizer was applied [28]. Quite a few researchers have concentrated on the fields of agriculture and horticulture [29,30], while there are few reports on the dynamic monitoring of nutrients in plantations. Various previous studies on poplar have either focused on irrigation or fertilization, including on the relationship between nitrogen application and nitrogen absorption, the effect of hydroponic fertilization on nitrogen content and distribution in the different organs of trees, and the effect of nitrogen forms on water absorption in pot plants over a short time [31,32]. However, the sustainable annual monitoring of forest soil nutrients under long-term irrigation fertilization is rarely reported.
Our objectives were (1) To predict the growth status of the stand and its relationship with changes in soil nutrients; (2) To explore the variation in the trends and correlations of soil nutrients; and (3) To understand the effects of irrigation and fertilization, and the interaction of water and nitrogen, on soil nutrients. The optimal combination of water and fertilizer management was put forward, while we found that attention should be paid to the decrease of available phosphorus in the soil after canopy closure. Our study aimed to achieve scientific and accurate fertilization of Populus tomentosa stands over different periods, to alleviate the decline of soil fertility, and to improve the utilization rate of water and fertilizer through long-term nutrient monitoring.

2. Materials and Methods

2.1. Study Site

The experiment site is located in Wei County Nursery (113°52′–115°49′ E, 36°50′–37°47′ N), at the National Key Poplar Fast-growing Forest Base of Wei County, Xingtai City, Hebei Province, China. It belongs to the southern part of the North China Plain, with low and flat terrain. It has a continental semi-arid monsoon climate of a warm temperate zone, with an annual average temperature of 13 °C. The average annual precipitation is 497.7 mm, which is mostly concentrated in late summer and early autumn (Figure 1). It experiences 2574.8 total sunshine hours, and the frost-free period is 198 days in the year. The forest land is sandy loam alluvial soil, with total porosity of 46.7%, a field water holding capacity of 26%, a soil pH of 8.6, and a soil density of 1.43 g·cm−3. The average buried depth of shallow groundwater is 15.12 m, and the average buried depth of deep groundwater is 52.81 m. In 2007, the soil organic matter content was 8.60 g·kg−1, total nitrogen was 0.58 g·kg−1, available nitrogen was 87.83 mg·kg−1, available phosphorus was 8.09 mg·kg−1, and available potassium was 90 mg·kg−1.

2.2. Experimental Design

The triploid Populus tomentosa S86 (♀ P. tomentosa × P. bolleana, ♂ P. alba × P. glandulosa) came from the nursery of Wei County, Hebei Province. In April 2007, 2-year-old seedlings with the same growth status, an average height of 5.8 m, and an average base diameter of 6.1 cm were selected for unified afforestation. The total afforestation area was 1.21 hm2, the distance between plants was 4 m × 3 m (the average afforestation density is 833 plants·hm−2), and the total number of plots with an area of 252 m2 was 36. Guard rows were present between the plots, and the plantation had no crops. The cultivated land was loosened once every March. In this experiment, a split-plot design was adopted, in which the main treatment was irrigation, and the auxiliary treatment was nitrogen. Irrigation was divided into three gradient levels, which accounted for 45%, 60%, and 75% (W1, W2, and W3) of the field water holding capacity. Based on pure nitrogen, four levels of nitrogen application were set: 0.0, 101.6, 203.2, and 304.8 kg·hm2 (N0, N1, N2, and N3). This experiment consisted of 12 treatments, 3 replicates, and 36 plots.
From 2007 to 2020, 1/3 of the annual fertilization amount was applied at the end of each of May, June, and July, respectively. Fertilizer was applied in two pits, 80 cm from the base of each tree. Each pit had a depth of 20–30 cm and one was dug on each side of a tree. The distance between the hole and the trunk was determined depending on the projection of the crown. The pit was covered with soil and watered immediately after fertilization. Nitrogen, phosphorus, and potassium fertilizers were applied at the same time; namely, urea (N, 46%), superphosphate (P2O5, 16%), and potassium sulfate (K2O, 50%). The amount of phosphate fertilizer applied, calculated based on P2O5, was 101.6 kg·hm−2, while that of potassium fertilizer, calculated based on K2O, was 50.80 kg·hm−2, with the same application amount of phosphate and potassium fertilizer for all treatments.
An ML 2X soil moisture meter (made in China) was used to monitor the soil moisture content, and the data were converted into the mass moisture content according to the formula “soil density = volume moisture content/mass moisture content” where the moisture content of each plot was lower than the experimental design value.

2.3. Growth Measurement and Calculation

The diameter at breast height (DBH) and height of all 833 trees in the 36 plots were measured using a DBH scale and altimeter. The volume was calculated following the standards (LY 208-77) promulgated by the Ministry of Agriculture and Forestry of the People’s Republic of China [33]:
V stem = 0.000065678245 × D1.9410626H0.84929086
where V stem is the individual tree volume in m3; and D and H respectively represent the DBH and tree height when the trees stopped growing in November of each year.
The standing volume of each subplot was calculated using the following equation:
V stand = average V stem × N tree
where V stand is the stand volume (m3·hm−2); average V stem (m3) is the average standing timber volume per Populus tomentosa plant; and N tree is the number of stumps per hectare (833).

2.4. Soil Sampling and Analysis

Soil samples were collected via auger boring in each plot in November of 2007, 2012, 2018, and 2020. Five sampling points were collected in each plot according to an S-shaped route to ensure that the samples were sufficiently representative. Each point was vertically divided into two levels: 0–20 cm and 20–40 cm. The five sampling points were then mixed, with approximately 1 kg of composite samples extracted by quartering using the level meter, and sealed in plastic bags. They were stored at a temperature of 0–4 °C and returned to the laboratory for analysis. Part of each sample was air-dried and passed through 1 and 0.25 mm sieves, to select for fine roots and gravel, respectively, and these sub-samples were marked for further use. The total organic carbon in the soil was measured using the Walkley–Black K2Cr2O7–H2SO4 digestion method. The total nitrogen in the soil was measured using the Kjeldahl method. Available phosphorus was determined using the method of Olsen et al. [34]. For the determination of soil-available potassium, air-dried soil samples were extracted by shaking for 30 min with 1 mol·L−1 CH3COONH4 (soil:solution ratio of 1:10), and then the available potassium content of the filtrate was determined using flame photometry.
Ammonium and nitrate were extracted from fresh soil samples by shaking for 1 h with 1 mol L−1 KCl (soil:solution ratio of 1:10). The extracts were filtered and then the analytes determined using a continuous-flow analyzer (AA3, Germany). The irrigation level was determined by drying the soil at 105 °C.

2.5. Data Analyses

Excel 2010 and Origin 2019 (OriginLab Corp., Northampton, MA, USA) were used to calculate means and standard deviations of the plot variables and to draw graphs. Two-way ANOVA (SPSS 24.0, Shanghai, China) was used to determine the effects of irrigation and nitrogen application rate, and their respective interactions with the soil nutrients. Duncan’s test was used to conduct multiple comparisons of the effects when the differences among the treatments were significant (p < 0.05). Pearson’s correlation was used to evaluate the relationships between the nutritional components.

3. Results

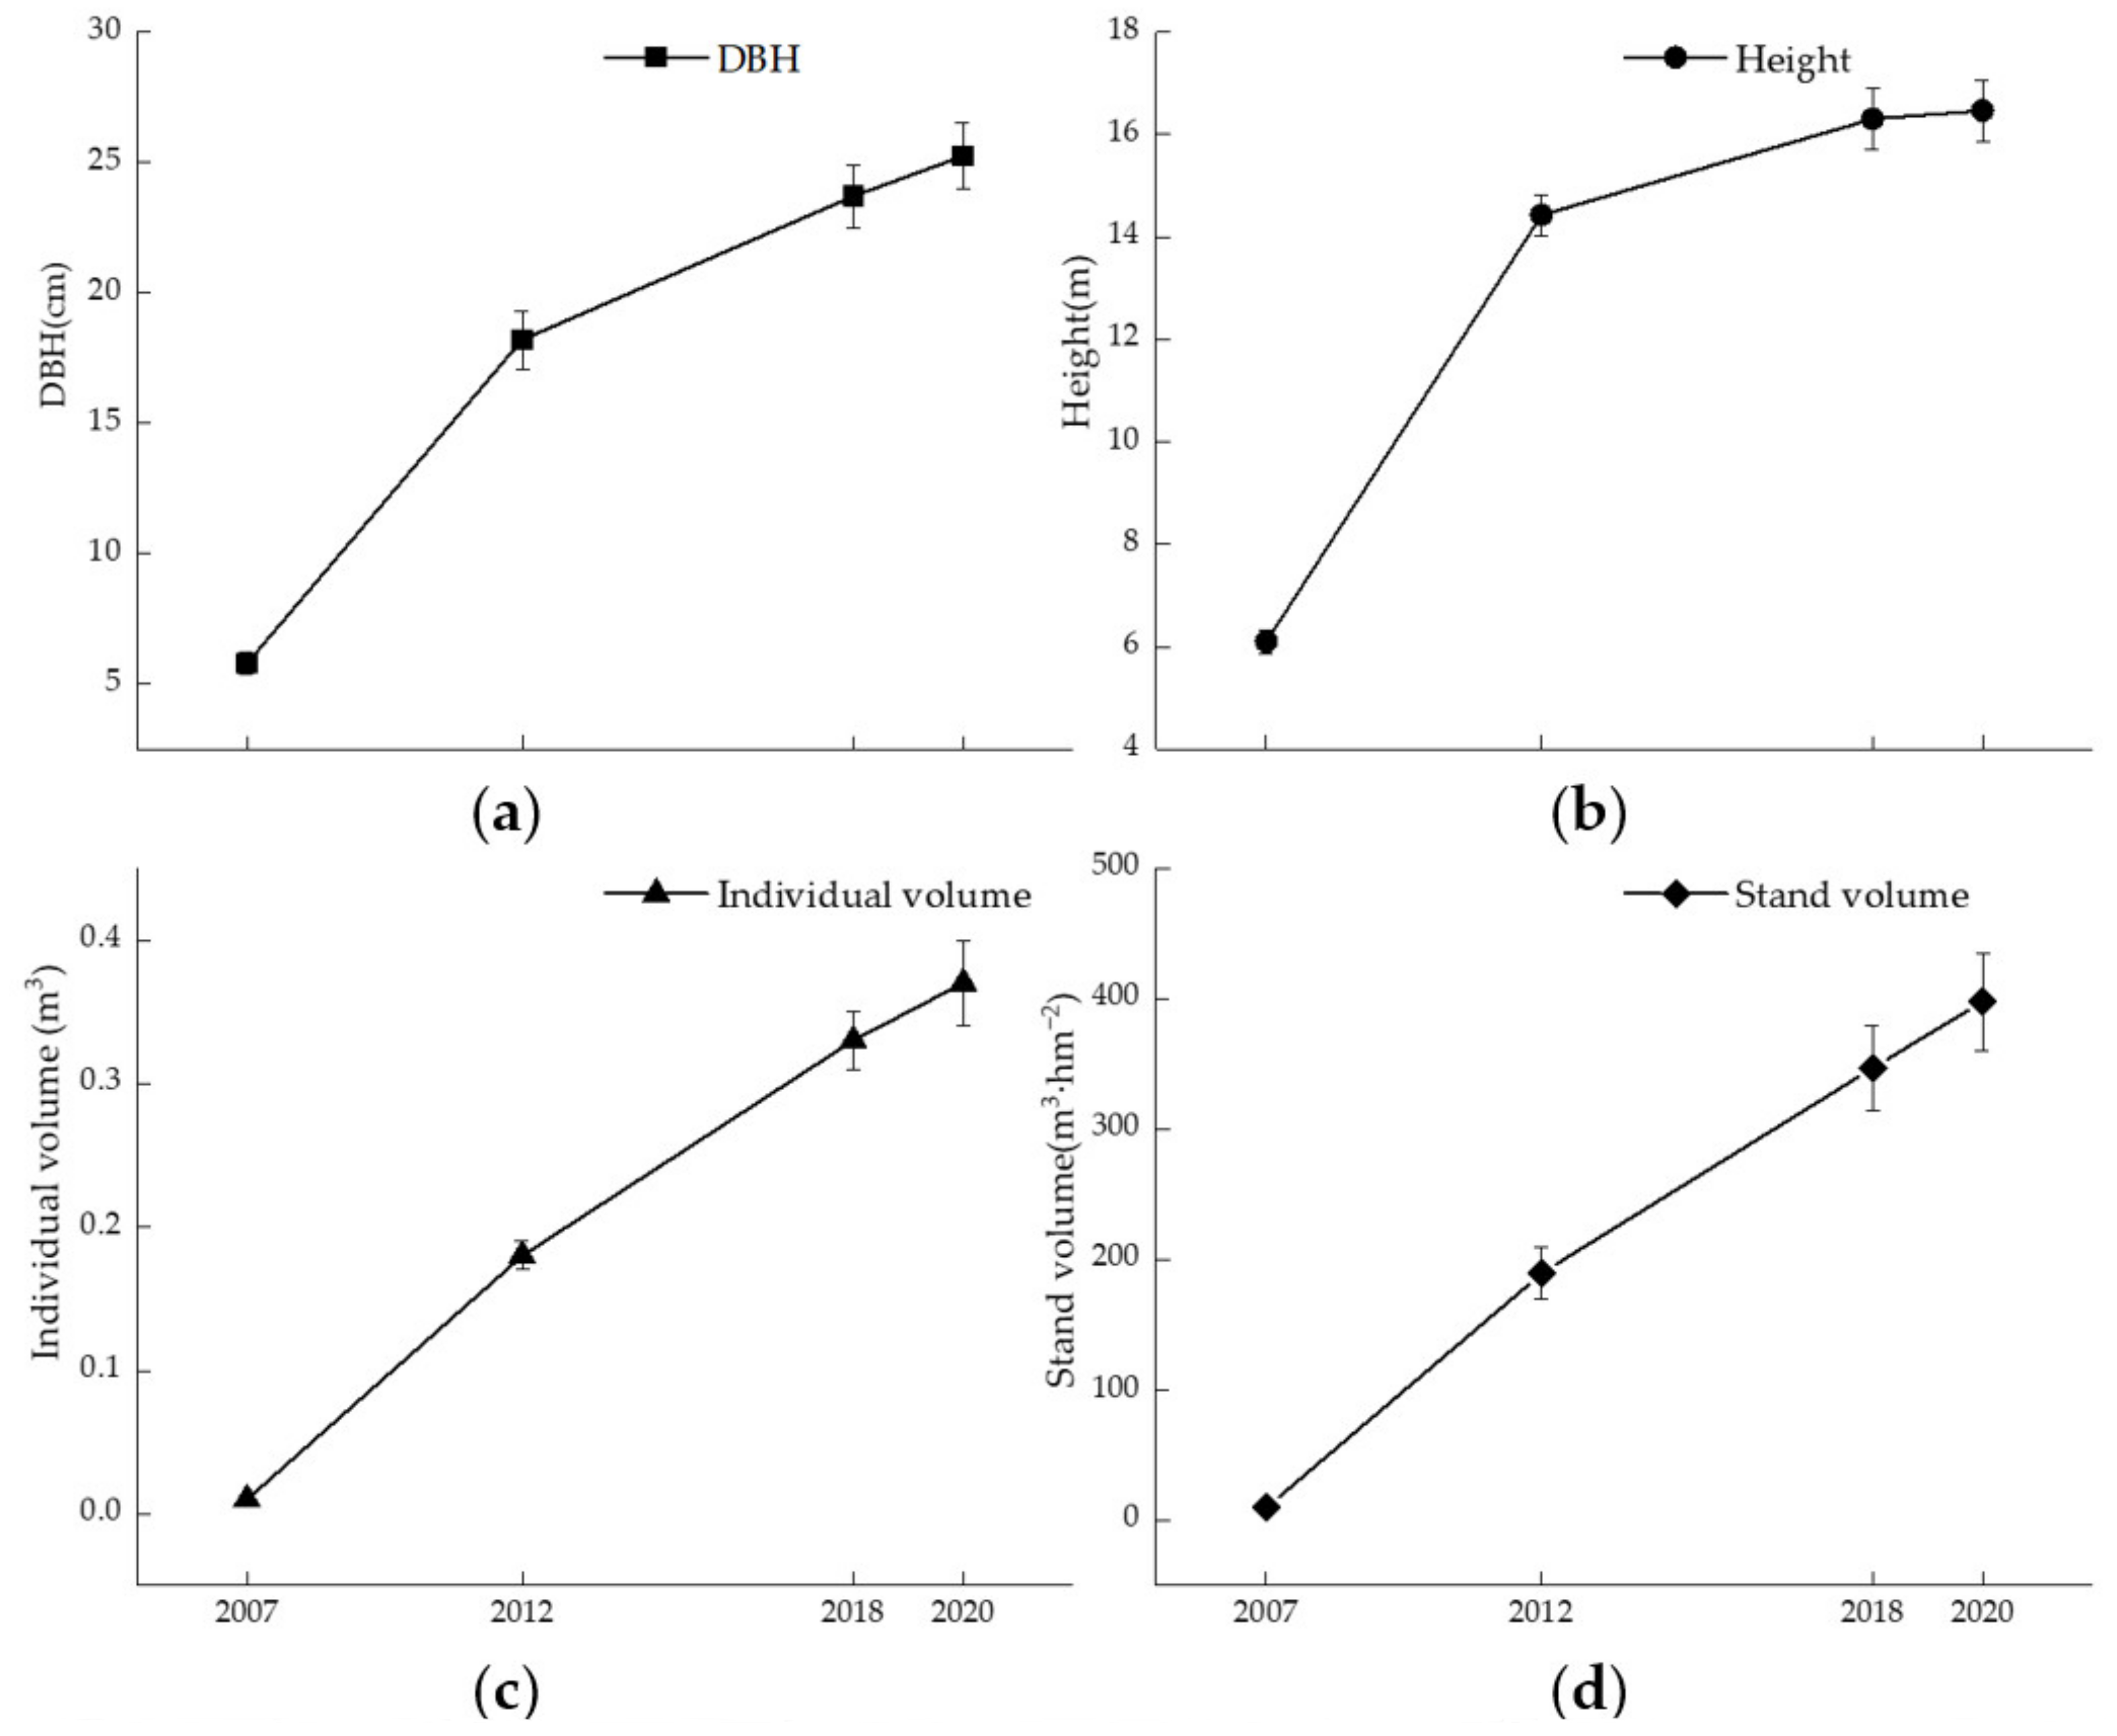
3.1. Effects on Tree Growth

The ranges of DBH, tree height, individual volume, and stand volume were 5.80–25.25 cm, 6.10–16.47 m, 0.01–0.37 m3, and 11.76–481.47 m3·hm−2, respectively (The DBH, tree height, individual volume, and volume per unit area of the experimental forest all showed a rising trend (Figure 2). From 2007 to 2012, the annual average growth amount for the unit area accumulation of the stands was 35.69 m3·hm−2; the average growth amount decreased to 26.28 m3·hm−2 in 2012–2018, and further decreased to 25.28 m3·hm−2 in 2018–2020.

3.2. Effects on Interannual Variation of Soil Chemical Properties

An inter-annual comparison of the chemical properties in the 0–20 cm soil layer was conducted (Table 1). The contents of soil organic matter, total nitrogen, available phosphorus, and available potassium ranged from 8.60 g·kg−1 to 18.72 g·kg−1, from 0.21 g·kg−1 to 0.79 g·kg−1, from 8.09 mg·kg−1 to 47.05 mg·kg−1, and from 90 mg·kg−1 to 322 mg·kg−1, respectively. Total nitrogen content decreased by 64% from 2007 to 2012, and increased by 24.1% from 2012 to 2020. The C/N ratio decreased after reaching its maximum in 2012. The soil pH was maintained in the neutral to alkaline range.

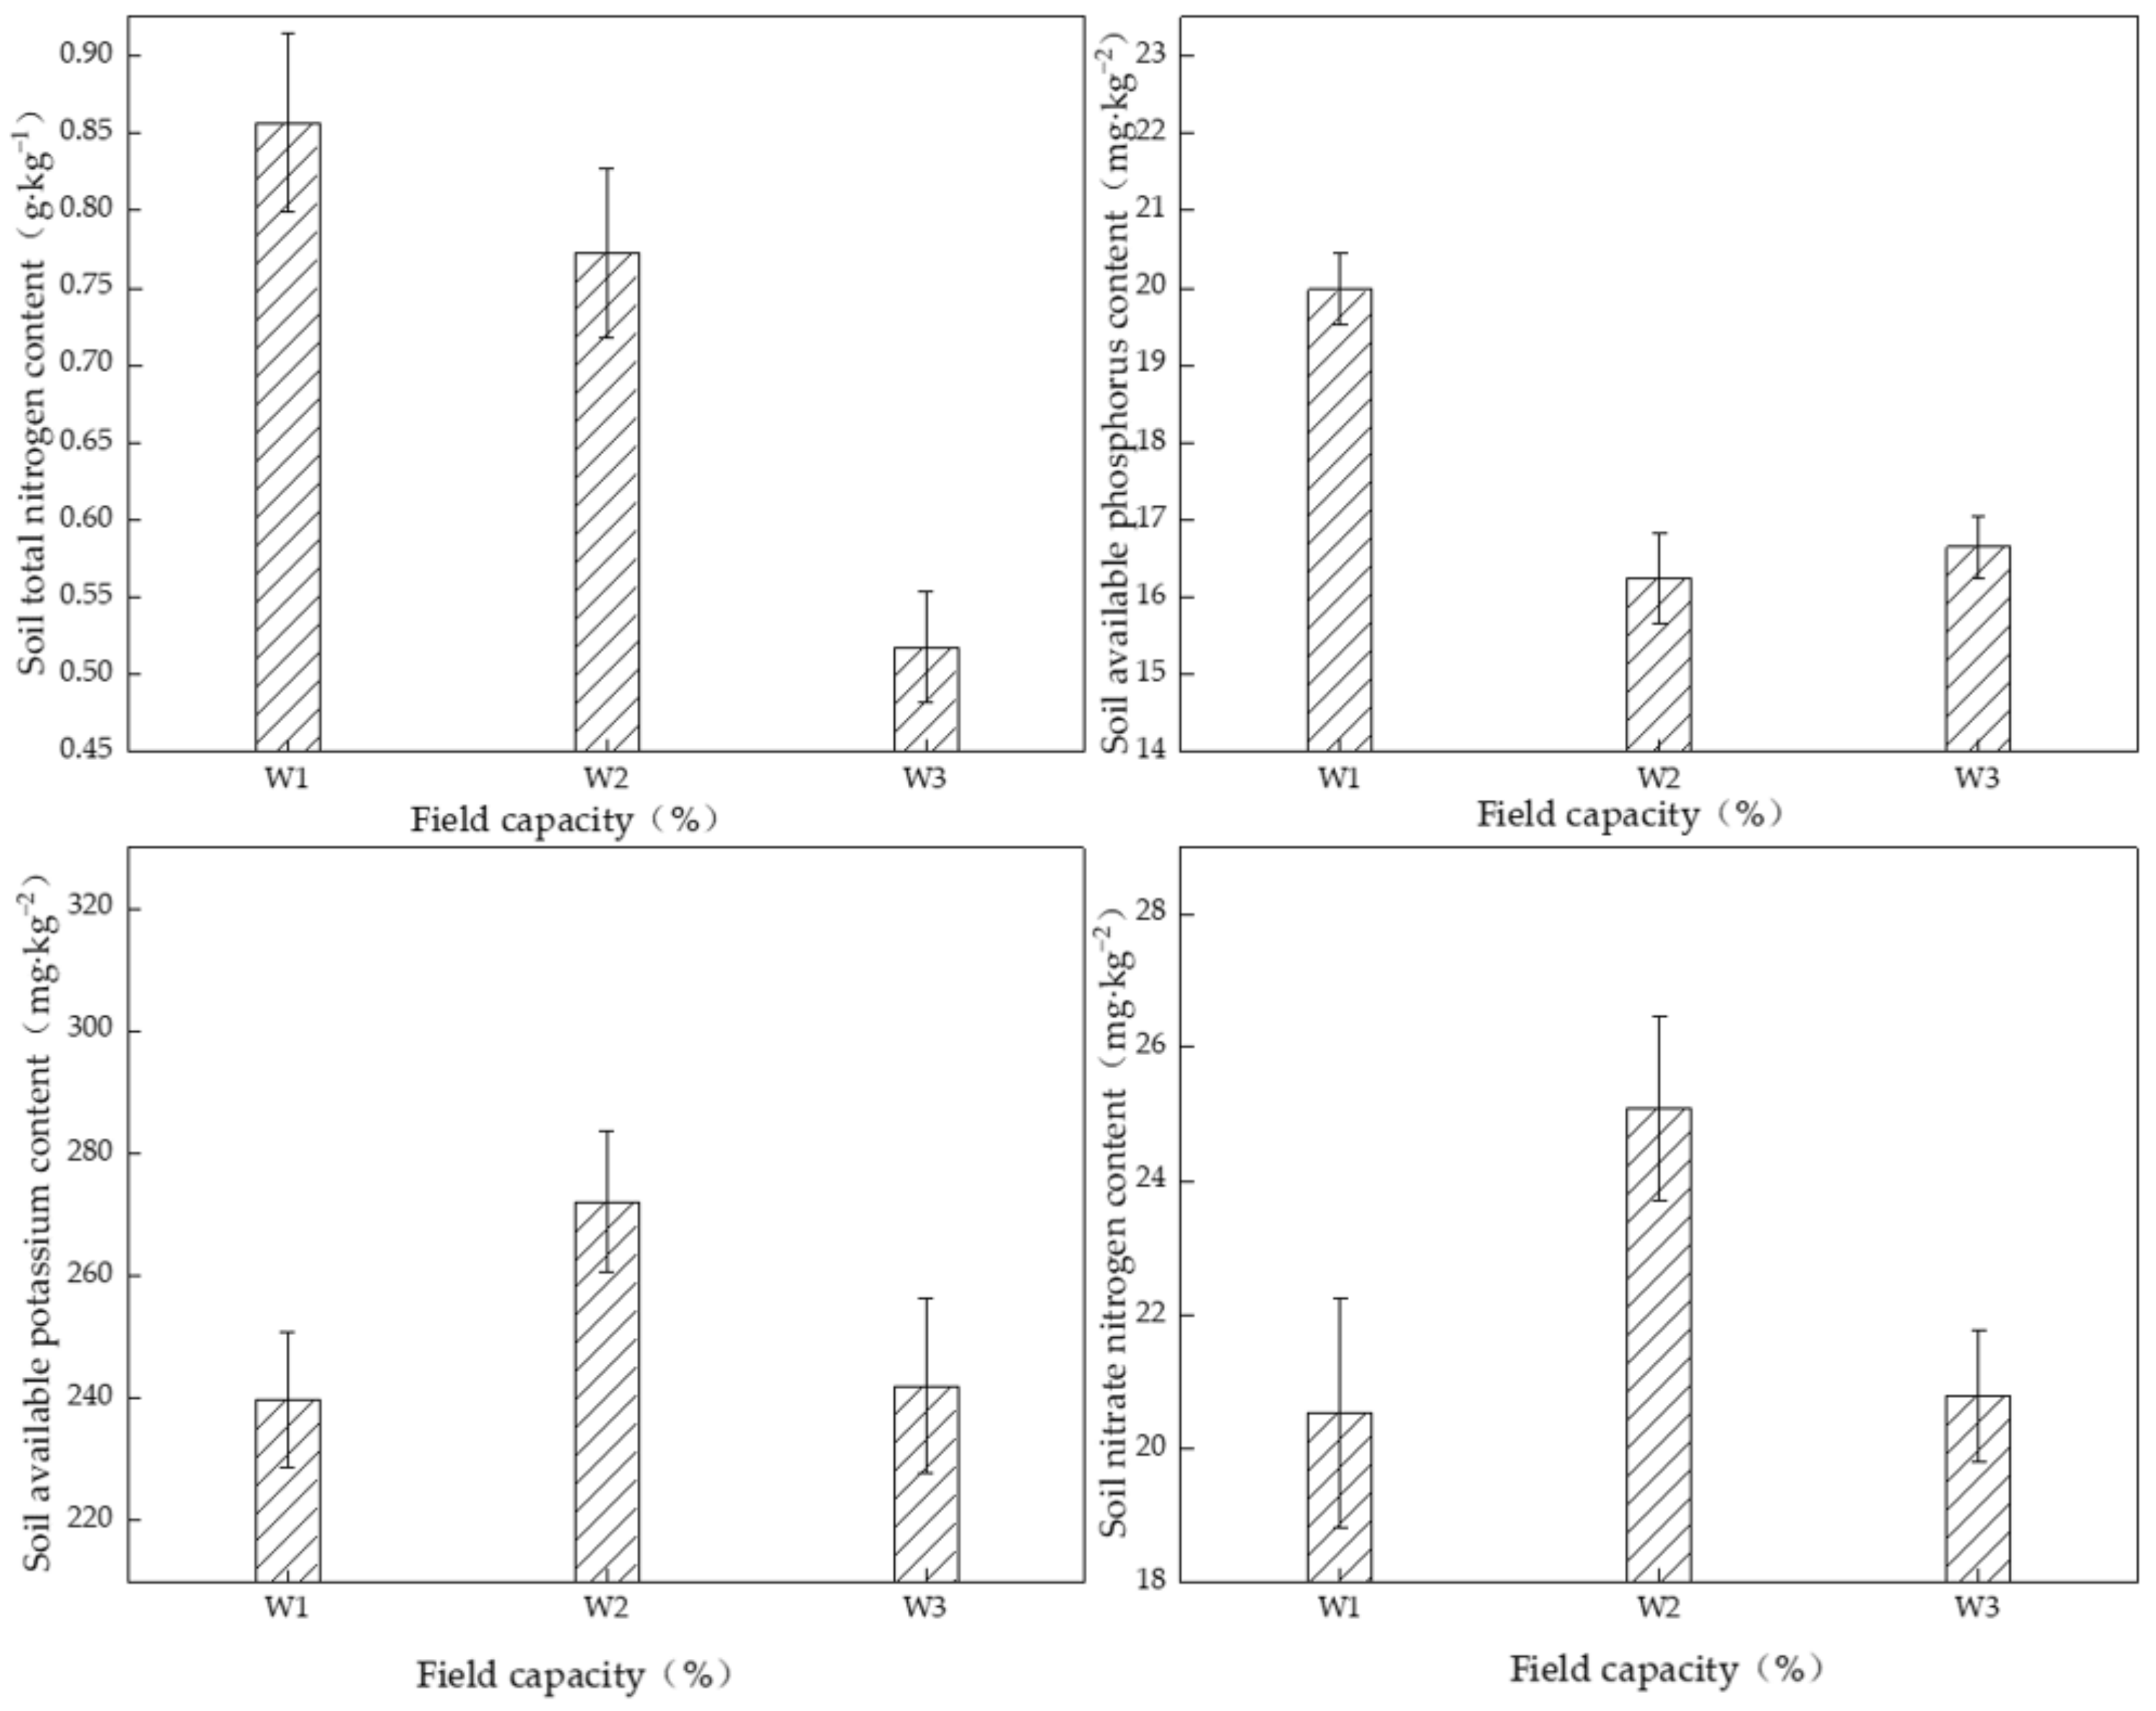
3.3. Effects of Irrigation and Nitrogen Application on Soil Nutrients

In the 0–40 cm soil layer, soil organic matter content ranged from 5.82 g·kg−1 to 19.40 g·kg−1, with the maximum of 19.40 g·kg−1 under W3N2 treatment, and it decreased with the increase in soil depth. Total nitrogen content ranged from 0.25 g·kg−1 to 1.25 g·kg−1, with a maximum of 1.25 g·kg−1 under W1N3 treatment. Irrigation and nitrogen application, and their interaction, had extremely significant effects on soil total nitrogen. Ammonia-nitrogen content ranged from 4.44 mg·kg−1 to 6.17 mg·kg−1, with a maximum of 6.17 mg·kg−1 under the W1N3 treatment. Nitrate-nitrogen content ranged from 3.62 mg·kg−1 to 37.15 mg·kg−1, with a maximum of 37.15 mg·kg−1 under the W1N3 treatment. Irrigation, and nitrogen application, and their interaction, had extremely significant effects on this. Available phosphorus content ranged from 4.00 mg·kg−1 to 26.54 mg·kg−1, with a maximum of 26.54 mg·kg−1 under the W1N0 treatment; available potassium content ranged from 153 mg·kg−1 to 306 mg·kg−1, with the maximum of 306 mg·kg−1 under the W2N0 treatment (Table 2).
Irrigation had a significant influence on the total nitrogen, available phosphorus, available potassium, and nitrate-nitrogen contents of the soil. Soil total nitrogen content decreased with an increase in water content (Figure 3), and it reached a maximum value of 0.86 g·kg−1 under W1 conditions, which was 1.6 times that of W3 (0.51 g·kg−1). With an increase in water content, soil available phosphorus content first decreased, and then rose. It reached a maximum of 19.98 mg·kg−1 under W1 conditions, and it decreased by 19% under W2 (16.25 mg·kg−1). They reached a maximum of 272 and 25.09 mg·kg−1, respectively, under W2 (60%). These values were 1.2 and 1.3 times those at W1 (240 and 20.54 mg·kg−1).
The nitrogen application rate had significant effects on the contents of total nitrogen, available phosphorus, available potassium, and nitrate-nitrogen in the soil (Figure 4). With an increase in the nitrogen application rate, the total nitrogen and nitrate-nitrogen contents of the soil rose under the N3 condition, and their maximum values were 1.02 g·kg−1 and 35.79 mg·kg−1, which were 1.9 and 6.4 times higher than those under N0 treatment (0.53 g·kg−1 and 5.74 mg·kg−1). Soil available phosphorus content presented a declining trend with an increase in nitrogen application amount, and it reached the maximum value of 23.1 mg·kg−1 at N0, which was increased by 71% compared with that at N3 (13.5 mg·kg−1). Soil available potassium content showed a downward trend with an increase in nitrogen application, and it reached the maximum value of 283 mg·kg−1 at N0, which was 1.37 times that at N3 (206 mg·kg−1).

3.4. Correlation between Soil Nutrients under Different Nitrogen Application and Irrigation Conditions

The correlation analysis indicated that a good correlation existed between the soil nutrients in stands under the influence of nitrogen application and irrigation. The soil could supply fertilizer and adapt to adversity up to a certain point. Soil nutrients did not play independent roles, but they jointly promoted the improvement of the soil environment and fertility. Under different nitrogen application and irrigation conditions, soil total nitrogen had a very significant negative correlation with available potassium, a significant negative correlation with available phosphorus, and a very significant (p < 0.01) positive correlation with soil organic matter, ammonia-nitrogen, and nitrate-nitrogen (Table 3).

4. Discussion

4.1. Effects on Interannual Variation of Soil Chemical Properties

Organic matter, nitrogen, phosphorus, and potassium, as the major physicochemical properties of soil, play vital roles in forest soil fertility [35]. In this study, the ranges of DBH, tree height, individual volume, and stand volume were 5.80–25.25 cm, 6.10–16.47 m, 0.01–0.37 m3, and 11.76–481.47 m3·hm−2, respectively. The growth rate of DBH and tree height slowed down from 2012 to 2020, and soil total nitrogen decreased sharply in 2012. Allen showed that nutrient demand depends on the stand development stage, and it is generally the greatest during canopy closure; our result was confirmed to some extent [36]. We applied nitrogen at an amount of approximately 140 kg·hm−2·yr−1, and the total nitrogen ranged from 0.21 g·kg−1 to 0.79 g·kg−1, gradually increasing after 2012. In the previous study, we measured the average nitrogen concentration of Populus tomentosa to be 8.89 g·kg−1 [37], and the forest biomass can be estimated according to the model proposed by Zhou [38]. By calculation, the amount of nitrogen fixation in the forest land in this study was approximately 70 kg·hm−2·yr−1. Lodhiyal et al. found that the nitrogen uptake of a 1–4 year-old poplar plantation was 151–174 kg·hm−2·yr−1 [39]. According to Cole’s compilation of global data, he surmised an average annual uptake for broadleaved stands is 95 kg of nitrogen [40]. Poplar plantations can rapidly accumulate nutrients in biomass at a young age, and the nitrogen concentrations in various tissues and organs of the stand will gradually decrease with age [40]. In addition, the inability to accurately calculate leaf biomass is one of the reasons for the low estimation of nitrogen uptake. Alain Berthelot found that in northwest France, about 60–80% of nutrient uptake returns to the soil each year through litterfall [41]. Of course, some phenomena, such as internal transfer and atmospheric deposits, have not been dealt with here.
The organic matter content ranged from 5.82 g·kg−1 to 19.40 g·kg−1 in 2007–2020, which was 233% higher than that before afforestation. During the growth of trees, the stands gradually began to become closed canopy, and organic matter began to accumulate. The C/N ratio decreased after reaching its maximum in 2012, possibly due to the increased total nitrogen content and decomposition of organic matter. Research has pointed out that the organic matter content of 4-year-old plantations of Pinus tabulaeformis and Bupleurum chinense was 15.52 g·kg−1 in Xiaolongshan Mountain region, Gansu province, China [42]. Mishra, U. showed that the mean SOC stock change in the forestation of cropland in the current study was +26.8% [43]. However, A. Schipper et al. demonstrated that in an alpine meadow with a high content of original organic matter, after phosphate fertilizer was applied for 20 years, the decomposition rate of organic matter was accelerated, and the organic carbon content decreased [44].
Available phosphorus ranged from 8.09 mg·kg−1 to 47.05 mg·kg−1, and showed a decreasing trend from 2012. Yang et al. also found that phosphorus concentration of the soil decreased over time in degraded subtropical broadleaved mixed forests [45]. Under normal circumstances, the availability of phosphorus reaches its highest level when the soil pH is close to neutral, and the soil pH in the experimental site decreased from 8.62 to 7.08, which became closer to the acid–base condition of soil with high available phosphorus. The total nitrogen content in the soil of the forest land increased every year, and so P and K absorption by the root system would be promoted. The available phosphorus content of the soil decreased with time, which might have also depended on the interactions among P, Fe, and Al [46,47]. Equally, according to Shi et al., there is a significant depletion of available phosphorus in soils after forestation on grassland and cropland with N-fixing species [48].
The available potassium content remained at a high level, which might be due to the difference in litter return. A high potassium demand and the small amount of potassium returned to the soil through litter, may lead to a decrease in the available potassium content of soil. Tan et al. studied potassium content in Larix principis-rupprechtii forests of different ages, and found that with the increase of forest age, the potassium content first decreased and then increased [49].

4.2. Effects of Irrigation on Soil Nutrients

In this study, the results showed that irrigation and nitrogen application significantly affected the total nitrogen, available phosphorus, available potassium, and nitrate-nitrogen contents. Some studies have shown that the soil water conditions significantly impact the absorption, leaching, and loss of nutrients [50,51]. The fertilizer utilization rate is directly proportional to the water supply when the soil water supply conditions are within a certain range, and the fertilizer efficiency decreases when the water content exceeds a certain limit. In 2020, we found that the total nitrogen content decreased, and the nitrate-nitrogen ranged from 20.54 to 25.09 mg·kg−1 with an increase in irrigation amount, reaching a maximum under W2 conditions. Huang et al. also showed that nitrate concentration in soil solution decreased with an increase in the amount of irrigation, and that it increased significantly with an increase in the amount of nitrogen application, especially when the seasonal nitrogen application was higher than 190 kg N·ha−1 [52]. The research showed that nitrogen leaching was directly proportional to the supply of water. Zhou found that when the soil water supply exceeded 300 mm, the nitrogen use efficiency began to decline. [53]. The total nitrogen level decreased rapidly with an increase in irrigation amount, which might be due to the fact that irrigation promoted the growth of stands which then absorbed more nitrogen. N. Shen. et al. found that with an increase in the amount of irrigation, the nitrogen absorbed by the shallow roots (0–40 cm) increased, and nitrate-nitrogen levels migrated downward [54]. The peak in NO3–N under W2 conditions might be because NO3–N was continuously absorbed and utilized by roots, and this caused the moisture in the lower soil layer to carry NO3 upward.
We found that available phosphorus ranged from 16.25 to 19.98 mg·kg−1 with an increase in soil water content. Miller et al. investigated soil phosphorus forms in Hawaiian forests in the tropical monsoon forest region, and they showed that the total phosphorus content of the soil decreased with an increase in precipitation [55]. The soil phosphorus content is closely related to the composition and size of soil particles. The higher the content of clay and silt, the higher the soil phosphorus content [56]. Previous studies have shown that inorganic phosphorus content is negatively correlated with soil moisture; because soil moisture is highly positively correlated with microbial activity, while soil dryness and lack of water lead to microbial death, which results in phosphorus being released from microbial biomass into the soil [57,58]. In addition, an increase in irrigation can inevitably promote the growth of Populus tomentosa and the absorption of soil nutrients. Thus, the growth and absorption of vegetation in the forest are also factors affecting the available phosphorus content of the soil.
With an increase in irrigation, available potassium ranged from 240 mg·kg−1 to 272 mg·kg−1, showing a trend of first rising and then falling; Li Meng and Liu Hui obtained similar research results [59,60]. Under the condition of low irrigation, the ability of plants to absorb available potassium from the soil was weak. Dobermann et al. found that soluble Fe2+ and Mn2+ in solution in the soil can replace exchangeable potassium in a clay complex under waterlogged conditions, and the exchangeable potassium can be maintained at a relatively high level in irrigated rice systems of Asia [61].

4.3. Effects of Nitrogen Application on Soil Nutrients

Nitrogen fertilization may affect soil chemical characteristics and nutrient distribution. The study showed a significant correlation between organic matter and total nitrogen content. Pathak and Reddy observed a significant positive correlation between soil organic carbon and TN in three land-use patterns at all depths [62]. We found that the contents of total nitrogen and nitrate-nitrogen in the soil increased significantly with the increase in nitrogen application rate, and that the total nitrogen content was positively correlated with nitrate-nitrogen. This finding was consistent with the research result of Huang et al. on the Huang–Huai–Hai Plain [52]. However, C. Somerset al. argued that nitrate-nitrogen accumulated significantly when the urea concentration was 300 kg·ha−1, while ammonia-nitrogen accumulated most significantly when the urea concentration was 1000 kg·ha−1 [63]. This result may be due to the inhibition of NO3 formation by high concentration urea, which led to the accumulation of NO2, followed by an increase in NH4+ caused by NO2 denitrification [64].
The contents of available phosphorus and available potassium in soil showed a downward trend with increasing nitrogen rates. Lu et al. reached a similar conclusion in a verification of Alfalfa absorbing soil nutrients [65]. A reasonable amount of nitrogen fertilizer can promote the absorption of phosphorus and potassium by plants.
The growth state of Populus tomentosa can be reflected by the transformations of nutrients. Unfortunately, we were unable to determine the leaf and root biomass in this plot, which limits the accurate calculation of nitrogen absorption. It deserves to be further studied, and we suggest that the relationship between nutrients and roots of Populus tomentosa, the relationship between nutrients and microorganisms, and the relationship between soluble nutrients and aboveground biomass should be selected as study topics.

5. Conclusions

Under long-term water and fertilizer management, the DBH, tree height, individual volume, and volume all increased significantly. Soil pH changed from alkaline to neutral, which helped to improve the availability of nutrients. Soil organic matter, total nitrogen, nitrate-nitrogen, and available potassium increased rapidly, while available phosphorus decreased gradually from 2012. The effects of irrigation and nitrogen application rates, and their interaction, on total nitrogen, available phosphorus, available potassium, and nitrate-nitrogen levels in the soil were significant. With an increase in the amount of irrigation, soil total nitrogen content decreased; soil nitrate-nitrogen and soil available potassium reached a maximum at W2; and soil available phosphorus content reached a maximum at W1. With an increase in nitrogen application rate, the contents of total nitrogen and nitrate-nitrogen in the soil rose significantly, while the contents of available phosphorus and available potassium decreased. Through long-term monitoring, we found that optimizing irrigation and nitrogen application systems can effectively improve soil fertility. However, attention should be paid to the decrease of available phosphorus in the soil after canopy closure. We found that irrigation and fertilizer management should be conducted to achieve a field water holding capacity above 60% and that a nitrogen application rate of 203.2 kg·hm−2 was optimal for saving water, maintaining soil fertility, and optimizing soil nitrogen supply.

Author Contributions

Additional support was provided by Huayang Forest Tree Nursery. L.N., L.S. and R.Z. conceived and designed the experiments; R.Z., J.Z., J.W., H.N., H.B., C.S. and M.H. performed the experiments; R.Z., Y.W. and H.Y. collected samples and analyzed the data; R.Z. wrote the paper. All authors have read and agreed to the published version of the manuscript.

Funding

2015BAD09B02, the Key Technologies R&D Program of China.

Institutional Review Board Statement

Not applicable.

Informed Consent Statement

Informed consent was obtained from all subjects involved in the study.

Data Availability Statement

Not applicable.

Acknowledgments

This work was supported by the Key Technologies R&D Program of China (2015BAD09B02). Additional support was provided by Huayang Forest Tree Nursery.

Conflicts of Interest

The authors declare no conflict of interest.

References

  1. Myint, Y.Y.; Sasaki, N.; Datta, A.; Tsusaka, T.W. Management of plantation forests for bioenergy generation, timber production, carbon emission reductions, and removals. Clean. Environ. Syst. 2021, 2, 100029. [Google Scholar] [CrossRef]
  2. Sedjo, R.A. From foraging to cropping: The transition to plantation forestry, and implications for wood supply and demand. Unasylva 2001, 204, 24–32. [Google Scholar]
  3. Truax, B.; Gagnon, D.; Fortier, J. Biomass and volume yield in mature hybrid mature hybrid poplar plantations on temperate abandoned farmland. Forests 2014, 5, 3107–3130. [Google Scholar] [CrossRef] [Green Version]
  4. Bo, H.; Wen, C.; Song, L.; Yue, Y.; Nie, L. Fine-Root Responses of Populus tomentosa Forests to Stand Density. Forests 2018, 9, 562. [Google Scholar] [CrossRef] [Green Version]
  5. Xi, B.Y.; Bloomberg, M.; Watt, M.S.; Jia, L.M. Modeling growth response to soil water availability simulated by HYDRUS for a mature triploid Populus tomentosa plantation located on the north China plain. Agric. Water Manag. 2016, 176, 243–254. [Google Scholar] [CrossRef]
  6. Zhang, Z.Y.; Shen, Y.B.; Lin, H.B.; Wang, J. A comparative study on early growth and photosynthetic activity among clones of Populus tomentosa and its hybrids. J. Beijing For. Univ. 1992, S9, 35–39. [Google Scholar]
  7. Liu, T.P.; Zhu, Z.X.; Zhang, Y. On the relationship between the law of growth of Poplus tomentosa carr. and the soil condition of forest land in the plain of western Shandong province. For. Res. 1988, 1, 588–597. [Google Scholar]
  8. Li, D.; Fernández, J.E.; Li, X.; Xi, B.; Jia, L.; Hernandez-Santana, V. Tree growth patterns and diagnosis of water status based on trunk diameter fluctuations in fast-growing Populus tomentosa plantations. Agric. Water Manag. 2020, 241, 106348. [Google Scholar] [CrossRef]
  9. Tian, L.; Zhao, L.; Wu, X.; Fang, H.; Zhao, Y.; Yue, G.; Liu, G.; Chen, H. Vertical patterns and controls of soil nutrients in alpine grassland: Implications for nutrient uptake. Sci. Total Environ. 2017, 607, 855–864. [Google Scholar] [CrossRef]
  10. Matías, L.; Castro, J.; Zamora, R. Soil-nutrient availability under a global-change scenario in a Mediterranean mountain ecosystem. Glob. Chang. Biol. 2011, 17, 1646–1657. [Google Scholar] [CrossRef]
  11. Xu, M.G.; Yu, R.; Wang, B.R. Labile organic matter and carbon management index in red soil under long-term fertilization. Acta Pedol. Sin. 2006, 43, 723–729. [Google Scholar]
  12. Zhang, S.; Zhang, W.; Shen, R.; Xu, M. Variation of soil quality in typical farmlands in China under long-term fertilization and research expedition. Plant Nutr. Fert. Sci. 2015, 21, 1389–1393. [Google Scholar] [CrossRef]
  13. Sandoval López, D.M.; Arturi, M.F.; Goya, J.F.; Pérez, C.A.; Frangi, J.L. Eucalyptus grandis plantations: Effects of management on soil carbon, nutrient contents and yields. J. For. Res. 2020, 31, 601–611. [Google Scholar] [CrossRef]
  14. Wan, F.; Ross-Davis, A.L.; Davis, A.S.; Song, X.; Liu, Y. Nutrient retranslocation in larix principis-rupprechtii mayr relative to fertilization and irrigation. New For. 2021, 52, 69–88. [Google Scholar] [CrossRef]
  15. Djaman, K.; Irmak, S.; Martin, D.L.; Ferguson, R.B.; Bernards, M.L. Plant nutrient uptake and soil nutrient dynamics under full and limited irrigation and rainfed maize production. Agron. J. 2013, 105, 527. [Google Scholar] [CrossRef]
  16. Xu, G.; Lu, D.; Wang, H. Morphological and physiological traits of rice roots and their relationships to yield and nitrogen utilization as influenced by irrigation regime and nitrogen rate. Agric. Water Manag. 2018, 203, 385–394. [Google Scholar] [CrossRef]
  17. Nikolskii, Y.N.; Aidarov, I.P.; Landeros-Sanchez, C.; Pchyolkin, V.V. Impact of long-term freshwater irrigation on soil fertility. Irrig. Drain. 2019, 68, 993–1001. [Google Scholar] [CrossRef]
  18. Han, Y.G.; Feng, G.; Ouyang, Y. Effects of Soil and Water Conservation Practices on Runoff, Sediment and Nutrient Losses. Water 2018, 10, 1333. [Google Scholar] [CrossRef] [Green Version]
  19. José Ignacio, Q.; Wei, R.; Prieto, I. Vertical decoupling of soil nutrients and water under climate warming reduces plant cumulative nutrient uptake, water-use efficiency and productivity. New Phytol. 2021, 230, 1378–1393. [Google Scholar] [CrossRef]
  20. León-Sánchez, L.; Nicolás, E.; Goberna, M.; Querejeta, J.I. Poor plant performance under simulated climate change is linked to mycorrhizal responses in a semiarid shrubland. J. Ecol. 2018, 106, 960–976. [Google Scholar] [CrossRef]
  21. Prieto, I.; Almagro, M.; Bastida, F.; Querejeta, J.I. Altered leaf litter quality exacerbates the negative impact of climate change on decomposition. J. Ecol. 2019, 107, 2364–2382. [Google Scholar] [CrossRef]
  22. Rani, P.; Batra, V.K.; Bhatia, A.K.; Sain, V. Effect of water deficit and fertigation on nutrients uptake and soil fertility of drip irrigated onion (Allium cepa L.) in semi-arid region of India. J. Plant Nutr. 2020, 44, 765–772. [Google Scholar] [CrossRef]
  23. Moeskops, B.; Buchan, D.; Van Beneden, S.; Fievez, V.; Sleutel, S.; Gasper, M.S.; De Neve, S. The impact of exogenous organic matter on SOM contents and microbial soil quality. Pedobiologia 2012, 55, 175–184. [Google Scholar] [CrossRef]
  24. Poffenbarger, H.J.; Barker, D.W.; Helmers, M.J.; Miguez, F.E.; Olk, D.C.; Sawyer, J.E.; Castellano, M.J. Maximum soil organic carbon storage in Midwest US cropping systems when crops are optimally nitrogen-fertilized. PLoS ONE 2017, 12, e0172293. [Google Scholar] [CrossRef]
  25. Zhang, X.; Li, X.; Luo, L.; Ma, Q.; Hui, X.; Ma, Q.; Hui, X.; Wang, S.; Liu, J.; Wang, Z. Monitoring wheat nitrogen requirement and top soil nitrate for nitrate residue controlling in drylands. J. Clean Prod. 2019, 241, 118372. [Google Scholar] [CrossRef]
  26. Yang, L.; Li, T.; Li, F.; Lemcoff, J.H. Long-Term Fertilization Effect on Fraction and Distribution of Soil Phosphorus in a Plastic-Film House in China. Commun. Soil Sci. Plan 2010, 42, 1–12. [Google Scholar] [CrossRef]
  27. Tao, L.; Wen, X.; Li, H.; Huang, C.; Jiang, Y.; Liu, D.; Sun, B. Influence of manure fertilization on soil phosphorous retention and clay mineral transformation: Evidence from a 16-year long-term fertilization experiment. Appl. Clay Sci. 2021, 204, 106021. [Google Scholar] [CrossRef]
  28. Cherney, J.H.; Ketterings, Q.M.; Orloski, J.L. Plant and Soil Elemental Status as Influenced by Multi-year Nitrogen and Potassium Fertilization. J. Plant Nutr. 2004, 27, 991–1014. [Google Scholar] [CrossRef]
  29. Danso, E.O.; Abenney-Mickson, S.; Sabi, E.B.; Plauborg, F.; Abekoe, M.; Kugblenu, Y.O.; Andersen, M.N. Effect of different fertilization and irrigation methods on nitrogen uptake, intercepted radiation and yield of okra (Abelmoschus esculentum L.) grown in the Keta Sand Spit of Southeast Ghana. Agric. Water Manag. 2015, 147, 34–42. [Google Scholar] [CrossRef]
  30. Li, Y. Principles and Applications of Modern Irrigation Water and Fertilizer Management; Yellow River Water Conservancy Press: Zhengzhou, China, 2008. [Google Scholar]
  31. DesRochers, A.; Driessche, R.; Thomas, B.R. Nitrogen fertilization of trembling aspen seedlings grown on soils of different pH. Can. J. For. Res. 2003, 33, 552–560. [Google Scholar] [CrossRef]
  32. Xi, B.; Li, G.; Bloomberg, M.; Jia, L. The effects of subsurface irrigation at different soil water potential thresholds on the growth and transpiration of Populus tomentosa in the North China Plain. Austral. For. 2014, 77, 159–167. [Google Scholar] [CrossRef] [Green Version]
  33. Agriculture and Forestry Ministry of China. Tree Volume Tables (LY208−77); China Standard Press: Beijing, China, 1977. [Google Scholar]
  34. Olsen, A.M. The biology, migration, and growth rate of the school shark, Galeorhinus australis (macleay) (carcharhanidae) in the South-Eastern Australian waters. Mar. Freshw. Res. 1954, 5, 353–410. [Google Scholar] [CrossRef]
  35. Yang, C.M.; Yang, L.Z.; Yan, T.M. Chemical and microbiological parameters of paddy soil quality as affected by different nutrient and water regimes. Pedosphere 2005, 15, 369–378. [Google Scholar]
  36. Allen, H.L. Forest fertilizers. J. For. 1987, 85, 37–46. [Google Scholar] [CrossRef]
  37. Wen, C.Y.; Zhu, J.L.; Bo, H.J.; Song, L.J.; Nie, L.S. Effects of irrigation and nitrogen application on carbon, nitrogen, and phosphorus stoichiometry of Populus tomentosa. Chin. J. Appl. Environ. Biol. 2019, 25, 0254–0261. [Google Scholar] [CrossRef]
  38. Zhou, G.; Wang, Y.; Jiang, Y.; Yang, Z. Estimating biomass and net primary production from forest inventory data: A case study of China’s Larix forests. For. Ecol. Manag. 2002, 169, 149–157. [Google Scholar] [CrossRef]
  39. Lodhiyal, L.S.; Lodhiyal, N. Variation in biomass and net primary productivity in short rotation high density central Himalayan poplar plantations. For. Ecol. Manag. 1997, 98, 167–179. [Google Scholar] [CrossRef]
  40. Cole, D.W. Nutrient Cycle in World Forests. In Forest Site and Productivity; Gessel, S.P., Ed.; Martinus Nijhoff: Dordrecht, The Netherlands, 1986. [Google Scholar]
  41. Berthelot, A.; Ranger, J.; Gelhaye, D. Nutrient uptake and immobilization in a short-rotation coppice stand of hybrid poplars in north-west France. For. Ecol. Manag. 2000, 128, 167–179. [Google Scholar] [CrossRef]
  42. Wan, P. Analysis of the soil microbial communities in Pinus tabulaeformis Carr. and Bupleurum chinense plantations of the Xiaolongshan Mountain Region, Gansu Province, China—ScienceDirect. Ecol. Inform. 2019, 53, 100981. [Google Scholar] [CrossRef]
  43. Nave, L.E.; Swanston, C.W.; Mishra, U.; Nadelhoffer, K.J. Afforestation effects on soil carbon storage in the United States: A synthesis. Soil Sci. Soc. Am. J. 2013, 77, 1035–1047. [Google Scholar] [CrossRef] [Green Version]
  44. Schipper, L.A.; Dodd, M.B.; Fisk, L.M.; Power, I.L.; Parenzee, J.; Arnold, G. Trends in soil carbon and nutrients of hill-country pastures receiving different phosphorus fertilizer loadings for 20 years. Biogeochemistry 2011, 104, 35–48. [Google Scholar] [CrossRef]
  45. Yang, S.; Feng, C.; Ma, Y.; Wang, W.; Huang, C.; Qi, C.; Chen, H.Y. Transition from N to P limited soil nutrients over time since restoration in degraded subtropical broadleaved mixed forests. For. Ecol. Manag. 2021, 494, 119298. [Google Scholar] [CrossRef]
  46. Toor, G.S.; Bahl, G.S.; Vig, A.C. Pattern of P availability in different soils as assessed by different adsorption equations. J. Indian Soc. Soi. Sci. 1997, 45, 719–723. [Google Scholar]
  47. Oelmann, Y.; Richter, A.K.; Roscher, C.; Rosenkranz, S.; Temperton, V.M.; Weisser, W.W.; Wilcke, W. Does plant diversity influence phosphorus cycling in experimental grasslands? Geoderma 2011, 167, 178–187. [Google Scholar] [CrossRef]
  48. Shi, S.; Peng, C.; Wang, M.; Zhu, Q.; Yang, G.; Yang, Y.; Zhang, T. A global meta-analysis of changes in soil carbon, nitrogen, phosphorus and sulfur, and stoichiometric shifts after forestation. Plant Soil 2016, 407, 323–340. [Google Scholar] [CrossRef]
  49. Tan, D.S.; Jin, J.Y.; Huang, S.W.; Li, S.T.; He, P. Effect of long-term application of K fertilizer and wheat straw to soil on crop yield and soil K under different planting systems. Sci. Agric. Sin. 2007, 6, 133–139. [Google Scholar] [CrossRef]
  50. Ronnenberg, K.; Wesche, K. Effects of fertilization and irrigation on productivity, plant nutrient contents and soil nutrients in southern Mongolia. Plant Soil 2011, 340, 239–251. [Google Scholar] [CrossRef]
  51. Hu, A.; Yu, Z.; Liu, X.; Gao, W.; He, Y.; Li, J. The effects of irrigation and fertilization on the migration and transformation processes of main chemical components in the soil profile. Environ. Geochem. Health 2019, 41, 2631–2648. [Google Scholar] [CrossRef]
  52. Huang, P.; Zhang, J.; Zhu, A.; Li, X.; Ma, D.; Xin, X.; Zhang, C.; Wu, S.; Garland, G.; Pereira, E.I.P. Nitrate accumulation and leaching potential reduced by coupled water and nitrogen management in the Huang-Huai-Hai Plain. Sci. Total Environ. 2018, 610, 1020–1028. [Google Scholar] [CrossRef]
  53. Zhou, L.Y. Effects of soil water conditions on fate of urea nitrogen. J. Plant. Nutr. Fertil. 1998, 4, 237–241. [Google Scholar] [CrossRef]
  54. Shen, L.F.; Bai, L.Y.; Zeng, X.B.; Wang, Y.Z. Effects of fertilization on NO3-N accumulation in greenhouse soils. J. Agro-Environ. Sci. 2012, 31, 1350–1356. [Google Scholar]
  55. Miller, A.J.; Schuur, E.A.; Chadwick, O.A. Redox control of phosphorus pools in Hawaiian montane forest soils. Geoderma 2001, 102, 219–237. [Google Scholar] [CrossRef]
  56. Luan, M.M. Spatial Distribution of Soil Phosphorus in Urban-Rural Fringe and Its Influencing Factors. Master’s Thesis, Sichuan Agricultural University, Ya’an, China, 2015. [Google Scholar]
  57. Magid, J.; Nielsen, N.E. Seasonal variations in organic and inorganic phosphorus fractions of temperate-climate sandy soils. Plant Soil 1992, 144, 155–165. [Google Scholar] [CrossRef]
  58. Chen, H.J. Phosphatase activity and P fractions in soils of an 18-year old Chinese fir plantation. For. Ecol. Manag. 2003, 178, 301–310. [Google Scholar] [CrossRef]
  59. Li, M.; Wang, D.; Ren, Y.; Wang, X. Influence of different drying-rewetting frequency on soil respiration and available nutrients. Acta. Ecol. Sin. 2018, 38, 1542–1549. [Google Scholar] [CrossRef] [Green Version]
  60. Liu, H. Study on Nutrient Dynamic Change and Distribution of Phosphorus and Potassium of Camellia oleifera Abel under Different Water Conditions. Master’s Thesis, Jiangxi Agricultural University, Nanchang, China, 2016. [Google Scholar]
  61. Dobermann, A.; Cassman, K.G.; Adviento, M.A.A.; Pampolino, M.F. Fertilizer inputs, nutrient balance and soil nutrient supplying power in intensive, irrigated rice system. III. Phosphorus. Nutr. Cycl. Agroecosyst. 1996, 46, 111–125. [Google Scholar] [CrossRef]
  62. Pathak, P.; Reddy, A.S. Vertical distribution analysis of soil organic carbon and total nitrogen in different land use patterns of an agro-organic farm. Trop. Ecol. 2021, 62, 386–397. [Google Scholar] [CrossRef]
  63. Somers, C.; Girkin, N.T.; Rippey, B.; Lanigan, G.J.; Richards, K.G. The effects of urine nitrogen application rate on nitrogen transformations in grassland soils. J. Agric. Sci. 2019, 157, 515–522. [Google Scholar] [CrossRef]
  64. Rex, D.; Clough, T.J.; Richards, K.G.; de Klein, C.; Morales, S.E.; Samad, M.S.; Grant, J.; Lanigan, G.J. Fungal and bacterial contributions to codenitrification emissions of N2O and N2 following urea deposition to soil. Nutr. Cycl. Agroecosyst. 2018, 110, 135–149. [Google Scholar] [CrossRef]
  65. Lu, J.; Yang, M.; Liu, M.; Lu, Y.; Yang, H. Nitrogen and phosphorus fertilizations alter nitrogen, phosphorus and potassium resorption of alfalfa in the Loess Plateau of China. J. Plant Nutr. 2019, 42, 2234–2246. [Google Scholar] [CrossRef]
Figure 1. Average monthly temperature and precipitation in Wei County from 2007 to 2020.
Forests 13 01046 g001
Figure 2. The growth of Populus tomentosa clone S86 in 2007, 2012, 2018, and 2020. Data are the mean ± standard deviation. (ad) describe the DBH, height, individual volume, and volume, respectively.
Forests 13 01046 g002
Figure 3. Effects of different field capacities on soil nutrient content in Populus tomentosa forestland.
Forests 13 01046 g003
Figure 4. Effects of different nitrogen application rates on soil nutrient content in Populus tomentosa forestland.
Forests 13 01046 g004
Table 1. Changes in 0–20 cm soil layer chemical properties in 2007, 2012, 2018, and 2020.
pHSOMTNAPAKC/N
(g·kg−1)(g·kg−1)(mg·kg−1)(mg·kg−1)
20078.62 ± 0.028.60 ± 0.880.58 ± 0.048.09 ± 1.0490 ± 89
20127.08 ± 0.0110.71 ± 1.020.21 ± 0.0547.05 ± 3.25322 ± 1130
20187.31 ± 0.0216.33 ± 1.330.52 ± 0.0534.11 ± 2.99229 ± 1818
20207.58 ± 0.0118.72 ± 1.210.73 ± 0.1417.62 ± 0.92260 ± 1614
Note: Means and standard deviation are shown for n = 36. SOM, soil organic matter; TN, total nitrogen; AP, available phosphorus; AK, available potassium; C/N, carbon nitrogen ratio. The same is below.
Table 2. Effects of soil water content and nitrogen application rates on soil nutrients in Populus tomentosa stands (2020).
DepthSWCNARSOMTNAPAKNH4+-NNO3-N
(cm)(%) (g·kg−1)(g·kg−1)(mg·kg−1)(mg·kg−1)(mg·kg−1)(mg·kg−1)
W1N014.38 ± 1.140.64 ± 0.04 efg26.54 ± 1.82 a 269 ± 14 b 5.18 ± 0.854.32 ± 0.17 f
N117.37 ± 2.370.73 ± 0.02 cde18.99 ± 2.08 bc254 ± 7 bc5.75 ± 0.2116.64 ± 1.29 e
N218.79 ± 0.270.80 ± 0.04 c18.22 ± 4.16 cd250 ± 13 bc5.82 ± 1.3424.06 ± 2.01 bc
N318.32 ± 1.871.25 ± 0.12 a16.16 ± 1.80 cde 186 ± 10 e 6.17 ± 2.3137.15 ± 3.38 a
0–20W2N012.90 ± 0.720.60 ± 0.03 fg22.88 ± 3.43 ab 306 ± 12 b 4.84 ± 0.116.90 ± 0.09 f
N117.75 ± 2.030.65 ± 0.09 def15.74 ± 0.20 cde284 ± 8 b5.10 ± 0.5425.41 ± 0.96 b
N212.86 ± 1.100.75 ± 0.03 cd14.48 ± 0.76 de 268 ± 9 b5.45 ± 0.9133.41 ± 2.44 a
N318.57 ± 0.831.09 ± 0.07 b11.90 ± 1.13 e 230 ± 17 cd5.55 ± 0.2834.65 ± 2.05 a
W3N011.37 ± 0.150.36 ± 0.05 i19.88 ± 3.94 bc 274 ± 14 b 4.88 ± 0.445.99 ± 0.14 f
N118.20 ± 4.180.46 ± 0.03 h18.14 ± 1.07 cd265 ± 14 cd4.94 ± 0.4920.07 ± 0.90 d
N219.40 ± 0.730.55 ± 0.03 g16.05 ± 1.72 cde226 ± 18 b5.14 ± 0.0821.48 ± 1.00 cd
N316.03 ± 0.61 0.71 ± 0.04 cde12.52 ± 0.71 e 203 ± 11 de5.44 ± 0.3735.58 ± 1.90 a
SWC ns****ns*
NAR ns*********
SWC×NAR ns******ns**
W1N09.99 ± 0.240.37 ± 0.13 abc8.81 ± 1.37 cd154 ± 8 fg4.54 ± 0.663.62 ± 0.36 g
N18.54 ± 0.340.40 ± 0.14 abc9.01 ± 1.78 cd162 ± 4 ef4.68 ± 0.2713.32 ± 1.31 f
N26.13 ± 0.160.46 ± 0.06 abc14.30 ± 2.45 a153 ± 6 fg5.42 ± 0.8627.24 ± 0.85 c
N39.25 ± 1.200.55 ± 0.06 a13.52 ± 2.20 ab202 ± 10 c5.51 ± 0.1332.8 ± 0.58 b
20–40W2N05.82 ± 0.570.27 ± 0.03 d8.89 ± 0.30 cd164 ± 11 ef4.50 ± 0.175.84 ± 0.49 g
N17.88 ± 2.090.37 ± 0.13 abc4.00 ± 0.12 e241 ± 11 b4.73 ± 0.5822.52 ± 0.70 d
N29.87 ± 1.450.38 ± 0.05 abc11.61 ± 3.48 abc171 ± 3 de4.79 ± 0.3129.48 ± 2.19 b
N312.19 ± 0.520.41 ± 0.09 abc7.48 ± 1.30 d273 ± 6 a4.96 ± 0.4028.25 ± 0.60 b
W3N011.97 ± 0.150.25 ± 0.07 d8.60 ± 0.87 cd146 ± 7 g4.44 ± 1.095.53 ± 0.58 g
N19.04 ± 1.250.27 ± 0.12 d8.69 ± 2.24 cd177 ± 5 d4.60 ± 0.0817.61 ± 1.41 e
N26.93 ± 0.680.33 ± 0.13 cd10.71 ± 1.04 bcd162 ± 2 ef4.64 ± 0.1416.08 ± 3.32 e
N39.07 ± 0.760.53 ± 0.07 ab8.37 ± 1.04 cd159 ± 6 ef4.66 ± 0.3535.69 ± 2.17 a
SWC ns****ns*
NAR ns*********
SWC×NAR ns******ns**
Note: The digital form is the mean ± standard deviation, n = 36. SWC and NAR are soil water content and nitrogen application rate, respectively. Irrigation was divided into three gradient levels, which account for 45%, 60%, and 75% (W1, W2, and W3) of the field water holding capacity. Based on pure nitrogen, four levels of nitrogen application were set, which were 0.0, 101.6, 203.2, and 304.8 kg·hm−2 (N0, N1, N2, and N3). Different letters indicate significant differences among the various soil water content and nitrogen fertilization treatments, as assessed by Duncan’s Multiple Range Test at p < 0.05. * and ** indicate significant differences at p < 0.05 and p < 0.01, respectively; ns, not significant. The same is below.
Table 3. Correlation analysis of soil chemical properties in Populus tomentosa stands under different nitrogen application rates and irrigation conditions.
N = 36SOMTNAPAKNH4+-NNO3-N
SOM10.431 *−0.424 *−0.539 *0.471 *0.500 *
TN 1−0.419 *−0.631 *0.691 *0.844 **
AP 10.567 *−0.365−0.891 **
AK 1−0.700 *−0.699 *
NH4+-N 10.635 *
NO3-N 1
Note: SOM, soil organic matter; TN, total nitrogen; AP, available phosphorus; AK, available potassium; * and ** indicate significant differences at p < 0.05 and p < 0.01, respectively.
Publisher’s Note: MDPI stays neutral with regard to jurisdictional claims in published maps and institutional affiliations.

