Article

Multiple-Temporal Scale Variations in Nighttime Sap Flow Response to Environmental Factors in Ficus concinna over a Subtropical Megacity, Southern China

1
School of Environment and Energy, Peking University Shenzhen Graduate School, Shenzhen 518055, China
2
Department of Forestry, Shaheed Benazir Bhutto University, Sheringal Dir Upper 25000, KPK, Pakistan
3
School of Environment, Tsinghua University, Beijing 100084, China
*
Author to whom correspondence should be addressed.
Forests 2022, 13(7), 1059; https://doi.org/10.3390/f13071059
Submission received: 21 May 2022 / Revised: 25 June 2022 / Accepted: 2 July 2022 / Published: 5 July 2022
(This article belongs to the Section Forest Hydrology)

Abstract

:
With ongoing climate change and rapid urbanization, the influence of extreme weather conditions on long-term nocturnal sap flow (Qn) dynamics in subtropical urban tree species is poorly understood despite the importance of Qn for the water budgets and development plantation. We continuously measured nighttime sap flow in Ficus concinna over multiple years (2014–2020) in a subtropical megacity, Shenzhen, to explore the environmental controls on Qn and dynamics in plant water consumption at different timescales. Nocturnally, Qn was shown to be positively driven by the air temperature (Ta), vapor pressure deficit (VPD), and canopy conductance (expressed as a ratio of transpiration to VPD), yet negatively regulated by relative humidity (RH). Seasonally, variations in Qn were determined by VPD in fast growth, Ta, T/VPD, and meteoric water input to soils in middle growth, and RH in the terminal growth stages of the trees. Annual mean Qn varied from 2.87 to 6.30 kg d−1 with an interannual mean of 4.39 ± 1.43 kg d−1 (± standard deviation). Interannually, the key regulatory parameters of Qn were found to be Ta, T/VPD, and precipitation (P)-induced-soil moisture content (SMC), which individually explained 69, 63, 83, and 76% of the variation, respectively. The proportion of the nocturnal to the total 24-h sap flow (i.e., Qn/Q24-h × 100) ranged from 0.18 to 17.39%, with an interannual mean of 8.87%. It is suggested that high temperatures could increase transpirational demand and, hence, water losses during the night. Our findings can potentially assist in sustainable water management in subtropical areas and urban planning under increasing urban heat islands expected with future climate change.

1. Introduction

Global warming and rapid urbanization are expected to intensify urban heat islands (UHIs) and frequent extreme weather conditions, e.g., heavy precipitations, droughts, and heatwaves [1]. During the 21st century, the first decade was observed as the warmest, and the forecasted increase in the global average surface air temperature is expected to be varied between 2 and 4 °C by 2040 [2,3], which may further increase the temperature in urban areas. The larger increases are observed in nighttime rather than daytime temperatures, especially in the tropics [4]. This warming asymmetry mainly happens by changing the levels of cloud cover. Increased cloud cover cools the surface during the day and retains the warmth at night, leading to a more significant increase in the nighttime temperature. Consequently, the higher nighttime temperature increases the nighttime vapor pressure deficit (VPD) and decreases the relative humidity (RH), leading to an elevated atmospheric demand for water [5]. These temperature differences may certainly affect the movement of water fluxes over plants and lead to higher nighttime transpiration (T) rates [6,7]. In addition, the nocturnal water use may have, in turn, modified the daily balance of water consumption by local vegetation [8]. Nighttime sap flow (Qn) has an effect not only on the local to regional water balances but also on the vegetation response to nutrient and water shortage (e.g., resilience and resistance) with ongoing climate change [9]. Furthermore, Qn provides benefits for plants such as the prevention of surplus leaf turgor at night [10], acceleration of nutrient acquisition [11], transport of O2 to xylem parenchyma [12], enhanced CO2 assimilation and advanced stomatal opening in the early morning [13]. In these circumstances, nighttime plant water-consumption dynamics and patterns recently have become a focus of attention for the sustainable management of ecologically important plants in urban areas.
In the past, it was generally presumed that low nighttime stomatal conductance, low VPD, and the absence of sunlight caused no transpiration or was very small at night [14,15]. Nowadays, there is growing proof that stomata remain partially open at night, reinforcing a non-trivial level of Qn in various plant species and ecosystems [5,10,16,17]. Previous studies documented that nighttime water loss and high stomatal aperture have been globally predicted to increase nighttime transpiration and exacerbate soil water deficits [18,19]. Furthermore, the documented contributions of Qn to total daily (Q24-h) water consumption of vegetation is highly variable with species and biomes [9,20]. For instance, over a wide range of habitats, the contribution ratio (i.e., Qn/Q24-h × 100%) is varied between 1% and 28% [6]; however, values up to 30–60% with an average of 12% have also been observed [18,21]. A higher ratio of Qn was observed in species that were less disposed to soil and atmospheric water scarcity or for wet areas (i.e., rainforests) [22]. Likewise, the Qn rate in trees significantly increases instantly after rainfall following low water conditions, further affecting the water balances [4]. However, there is limited research on Qn, despite the importance of estimating the water balances and vegetation’s functioning in an urban thermal environment.
Regarding large heterogeneous environmental conditions in the subtropical urban areas, the on-site hydrometeorological regulating parameters of Qn can be varied markedly within a very short interval, which might affect the nighttime water usage of plants differently across temporal scales [23,24]. Generally, air temperature (Ta), VPD, wind speed (Ws), precipitation (P), soil moisture content (SMC), and canopy conductance (as indicated by T/VPD) are the most important parameters influencing plant water fluxes and growth [25,26,27,28,29]. It has been documented that Qn is positively correlated to Ta and VPD at short timescales, e.g., nocturnally [30,31], and with SMC at longer scales, e.g., seasonally-interannually [5]. Furthermore, Ta and VPD determined the stomatal conductance and, as a result, they were considered the most important driving force for nighttime water loss [15,26], while SMC is most directly linked with plant transpiration [32,33], particularly in an urban thermal environment. Although the controls of Qn have been documented for quite a few plant species from different domains [9,17,23], the Qn regulating mechanisms are not fully understood in a subtropical urban environment. Roth reported that less than 20% of studies are from the subtropical areas concerning the documented research for all the urban climates [34]. Therefore, it is essential to investigate the environmental controls of Qn across multiple timescales to assess and predict how urban trees respond to and adapt to ongoing climate change, especially in subtropical regions.
The Qn rates and their response to environmental parameters fluctuate among different plant species due to differences in morphological traits, growth conditions, plant functional types, habitats, plant water consumption behaviors, and tree height and crown diameter [35,36]. Likewise, large interspecific variations in Qn rates were observed among species growing over similar geographic areas [10]. Additionally, the daily transpiration rate of Robinia pseudoacacia is three times smaller than Tilia cordata [37]. The previous researchers used different methods to determine in-depth plant water consumption rates, for example, lysimeter, gas analyzer, statistical models, and eddy covariance measurements [15,38,39,40,41]. However, the measurement requirements for these methods are difficult in urban areas concerning the large heterogeneous microclimate, and the approaches might not accurately determine the real conditions [24,42]. The sap flow measurement approach has been considered more reliable for continuously and directly monitoring the whole tree water fluxes in situ [43,44]. Investigations on sap flow rates in trees of urban surroundings are valuable not only to enhance our comprehension of the physiological responses of trees to their hydrometeorological environment but also could help to acknowledge the procedure of water consumption, as well as provide direction to determine the tradeoffs between water supply and demand [24,45].
Shenzhen, a fast developing and densely populated subtropical megacity in South China, has recently faced serious UHI problems with rapid urbanization [46]. In efforts to battle the UHI effect and improve the ecological environment in the area, urban vegetation coverage has been increased. However, the sustainability of many tree species in the region is predicted to be challenged by increasing temperatures and associated irregularities in precipitation with ongoing climate change [45]. Therefore, in this study, we investigated the nighttime sap flow of Ficus concinna, a native tree species, over the growing season of seven consecutive years, spanning from 2014 to 2020 under the urban thermal environment. The F. concinna trees are commonly used for the greening of subtropical cities. Its plays a vital role in improving the ecological environment and mitigating UHI due to its higher transpiration rate, strong wind and high-temperature resistance, strong shade, large crown structure, and low soil requirements [24,47]. Our objectives of this investigation were to: (1) examine the occurrence and magnitude of Qn and water-consumption strategies of F. concinna; (2) detect the major environmental parameters affecting nighttime sap flow at multiple timescales, and (3) quantify the contribution ratio of Qn to the overall 24 h sap flow over the entire study period.

2. Materials and Methods

2.1. Site Descriptions and Tree Species

This study was carried out at the campus of Peking University, Shenzhen Graduate School (PUSGS; 22°26′59″–22°51′49″ N, 113°45′44″–114°37′21″ E, ~17 m above mean sea level), in Shenzhen megacity, Guangdong province, southern China. Shenzhen is a coastal megacity that took about 40 years to develop from a small village, with a permanent population of around 13.44 million at the end of 2019. The site has a predominant subtropical humid climate, mainly affected by the South Asian monsoon and thus characterized by a pronounced wet season (May to October) and dry season (November to April). Generally, episodic precipitation events with large intra- and interannual fluctuations are common. Based on long-term meteorological data from the closest Xili Weather Station ~4.5 km from the PUSGS, the mean annual rainfall is approximately 1924.7 mm, on average 75% of which occurs in the growing seasons of each year [24]. The annual mean temperature is 23.3 °C, with the lowest monthly mean Ta (i.e., 14.9 °C) occurring over the coldest month (January) and the highest (i.e., 28.6 °C) during the hottest month (July). The tropical cyclone affects the region about 4–5 times every year. The soils are dominated by brown loamy soil, where the SMC varied mainly in the uppermost part of the soil complex entirely by evapotranspiration and the infiltration of meteoric rainwater. Approximately 50% of this site is covered by vegetation, including shrubs, lawns, and trees [48]. The major tree species growing at the site are F. concinna, Terminalia mantaly, Michelia alba, Ficus altissima, Khaya senegalensis, Delonix regia, Zoysia matrella, and Ficus religiosa. Measurements were made on 10 trees of F. concinna of different ages in the current study. It is a fast-growing tree with a developed root system and a profusion of leathery leaves [49]. For the targeted trees, the height ranged between ~8 and 10 m, with the mean crown area and diameter at breast height (DBH) being 27 ± 1.84 m2 and 22 ± 2.37 cm (± standard deviation), respectively. The sample trees were randomly selected, representing the study site’s DBH class distribution, and were in good condition.

2.2. Sap Flow and Transpiration Measurements

We used manual Granier thermal dissipation probes (TDPs, Ecomatik, Munich, Germany) to continuously assess sap flux density (Fd) of F. concinna tree species for 24-h every day over the growing seasons (i.e., May–October) for seven consecutive years (i.e., 2014–2020) [50]. These sap flow measurement sensors (type SF-G) contained a pair of stainless-steel probes (20-mm-long, 2-mm-diameter) inserted at a depth of 20 mm at 90° angles into the stem’s sapwood. The sensors were fixed about 1.3 m above the ground after removing the targeted trees’ dead tissues and rough bark. In addition, to minimize the thermal effect caused by direct solar radiation, the sensors were attached to the Northside of the trees. All probes were wrapped with transparent plastic and aluminum foil to reduce the influence of light, rainwater, and externally-induced temperature inclines [51,52]. The upper probe was heated with a continuous, direct current (DC, 120 mA) of the heating power of 0.2 W, while the lower probe was unheated and installed about 10 cm beneath the upper one to avoid thermal interference [24]. Furthermore, the sensors were replaced with new ones for more accurate data observation by the start of the growing season over each year. The temperature difference (ΔT, °C) between the probes (i.e., upper and lower sensors) was recorded once every minute and then stored as 10-min averages in a Campbell CR1000-dataloggers (Campbell Scientific, Inc., Logan, UT, USA). These temperature differences were subsequently converted to sap flux densities (Fd, g m−2 s−1) by Granier [50], based on a commonly-used equation:
F d = 119 Δ T m Δ T Δ T 1.231
where ΔTm is the estimation of maximum ΔT under zero sap flow conditions. To evade the undervaluation of nocturnal sap flux, ΔTm was determined separately for each tree over 7–10 days during the observation period [53]. Accordingly, ΔTm was defined when nighttime VPD < 0.05 kPa. Likewise, Fd was calculated using the baseliner program (version 3.0.11, Hydro-Ecology Group, Duke University) [54]. Although this equation can measure absolute water use, it is not affecting the Qn response to environmental factors.
Daily sap flow (Q, kg d−1) was calculated as reported by Chen et al. with the following equation [9]:
Q = F d × A s × 3600 1000 × 24
where As is the sapwood area (m2), and 3600/1000 × 24 is the unit conversion factor to hourly and then daily values. The sapwood area was obtained for 10–12 trees close to the trees observed for the sap flow measurements by using the Haglof increment corer to drill out a wood core at the breast height of the trunks. The width of the sapwood was measured by the different coloration changes between the heartwood and sapwood after dyeing. Subsequently, the relationship between the As and the DBH was established based on:
As = a × DBHb
where a and b denote the coefficients from the other trees of F. concinna, obtained by nonlinear regression analysis (specifically a = 1.01, b = 1.79 in this study). The DBH ranged between 4.8 and 24.5 cm for these trees. We calculated the whole tree transpiration, i.e., water use (T, in mm h−1 or d−1) as follows [41]:
T = F d × As Ac × 3600 1000 × 24
where Ac is the crown area (m2). The detailed descriptions of Ac calculation can be found in Hayat et al. [24]. Previous studies have shown that transpiration (T) could also be calculated by the product of canopy conductance and water vapor pressure deficit [26,55,56], with the ratio (i.e., T/VPD) being a proxy for canopy conductance.

2.3. Hydrometeorological Parameters

Micro-hydrometeorological measurements together with the sap flow estimations, were taken from the pre-installed Bowen ratio (BR) tower with an exhibition of sensors located in the experimental area for the same period. The parameters such as Ta (in °C; 225–050YA, Novalynx, Grass Valley, CA, USA), RH (in %), and Ws (in m s−1; 200-WS-02, Novalynx, Grass Valley, CA, USA) were measured at heights of 2, 1.5 and 2 m, respectively, above the ground level. The sensor resolutions for Ta, RH and Ws were ±0.6 °C, ±3% and ±0.2 m s−1, respectively. To characterize the atmospheric demand of water, VPD (in kPa) was subsequently calculated based on recorded Ta and RH [57]. The tipping bucket raingauge (7852M-AB, Davis, CA, USA) was used to record the rainfall amounts (in mm), installed in an opening close to the representative area. The SMCs (in %) were monitored using time-domain reflectometry probes (SM300, Delta-T Devices Ltd., Burwell, Cambridge, UK) at four depths of the soil layer (i.e., 10, 30, 40, and 50 cm) next to the BR system tower. In the present analysis, we used the average values of SMC measured at these four soil depths. All of these micro-hydrometeorological parameters were averaged or summed every 10-min from 60-s over the entire observation period and archived on a CR1000-datalogger (Campbell Scientific, Logan, UT, USA).

2.4. Date Treatment and Gap-Filling

Nighttime and daytime sap flow (i.e., Qn and Qd) were characterized as the average sap flow rate from 20:00 to 05:00 and 06:00 to 19:00 local standard time (LST) [5,58]. The current study defined the entire growing season length as the duration ranging from 1 May to 31 October across seven years, except for 2014, which started on 15 July. Similarly, we divided the time of the year, i.e., May as fast growth, June–August as middle growth, and September–October as terminal growth stages of the plants, following Chu et al. [59].
The sap flux measurements were regularly screened and checked to acquire the quality of extracted data based on key principles, i.e., the influence of weather (e.g., cyclone, rainfall, and dewdrops on sensor), instrument failure, out of range fluxes, and atmospheric stability [60]. Missing rainfall data were fulfilled from the daily rainfall measured at the Xili Meteorological Station close to the site. Furthermore, for the missing data in other selected micro-hydrometeorological parameters, the small data gaps (e.g., <2 h in duration) were filled via linear interpolation, whereas longer gaps were filled using the mean diurnal variation approach (MDV) by referring to Falge et al. [61].

2.5. Statistical Analysis

To analyze the potential effects of micro-hydrometeorological variables (e.g., Ta, VPD, RH, Ws, P, SMC, and T/VPD) on Qn, linear and nonlinear regressions were conducted at multiple temporal scales (i.e., nocturnal-interannual). For the comparison of temporal variations, the data were accumulated to daily nighttime values (Figure 1). We used regression slopes as evidence of Qn total sensitivity to the various selected site parameters. To test the statistical significance between Qn and Qd rates, the one-way ANOVA (analysis of variance) was used at 0.05 critical probability (i.e., αcrit). In addition, the F-statistic was also applied to investigate the significance of the numerous regressions achieved between Qn and environmental parameters (also, with an αcrit = 0.05). The percentage of nighttime to the total 24-h sap flow (i.e., Qn/Q24-h × 100%) was calculated for the growing seasons across seven years. The coefficient of variation (i.e., CV) of a parameter was determined as the proportion of its standard deviation (SD) to its mean. All statistical analyses were conducted within a software package such as Excel 2016 (Microsoft Corporation, Redmond, WA, USA) for descriptive statistics and percentile, SPSS (ver.17.0; SPSS Inc., Chicago, IL, USA) for one-way ANOVA and F-statistic, AMOS (ver.17.0; SPSS Inc.) for path analysis, and MATLAB (ver. R2017a, MathWorks Inc., Chicago, IL, USA) for regression analysis, data binning and plots.
A path coefficient model was developed to elucidate and determine the direct and indirect regulating mechanisms of micro-hydrometeorological parameters on Qn. The coefficients of direct paths between two parameters exhibit the standardized partial-regression, whereas indirect pathways designate the product of possible path coefficients, which are summed across all indirect tracks. Furthermore, the sum of the direct and indirect coefficients is the total path coefficient [62,63]. The value of a path coefficient fluctuates from −1.0 to 1.0, representing negative or positive causality. The standardized path coefficient and the discrepancy were estimated by using standardized data on the basis of the maximum likelihood method. To derive the final path diagram, all statistically insignificant paths (e.g., p > 0.05) were removed, and coefficients were re-assessed [64].

3. Results

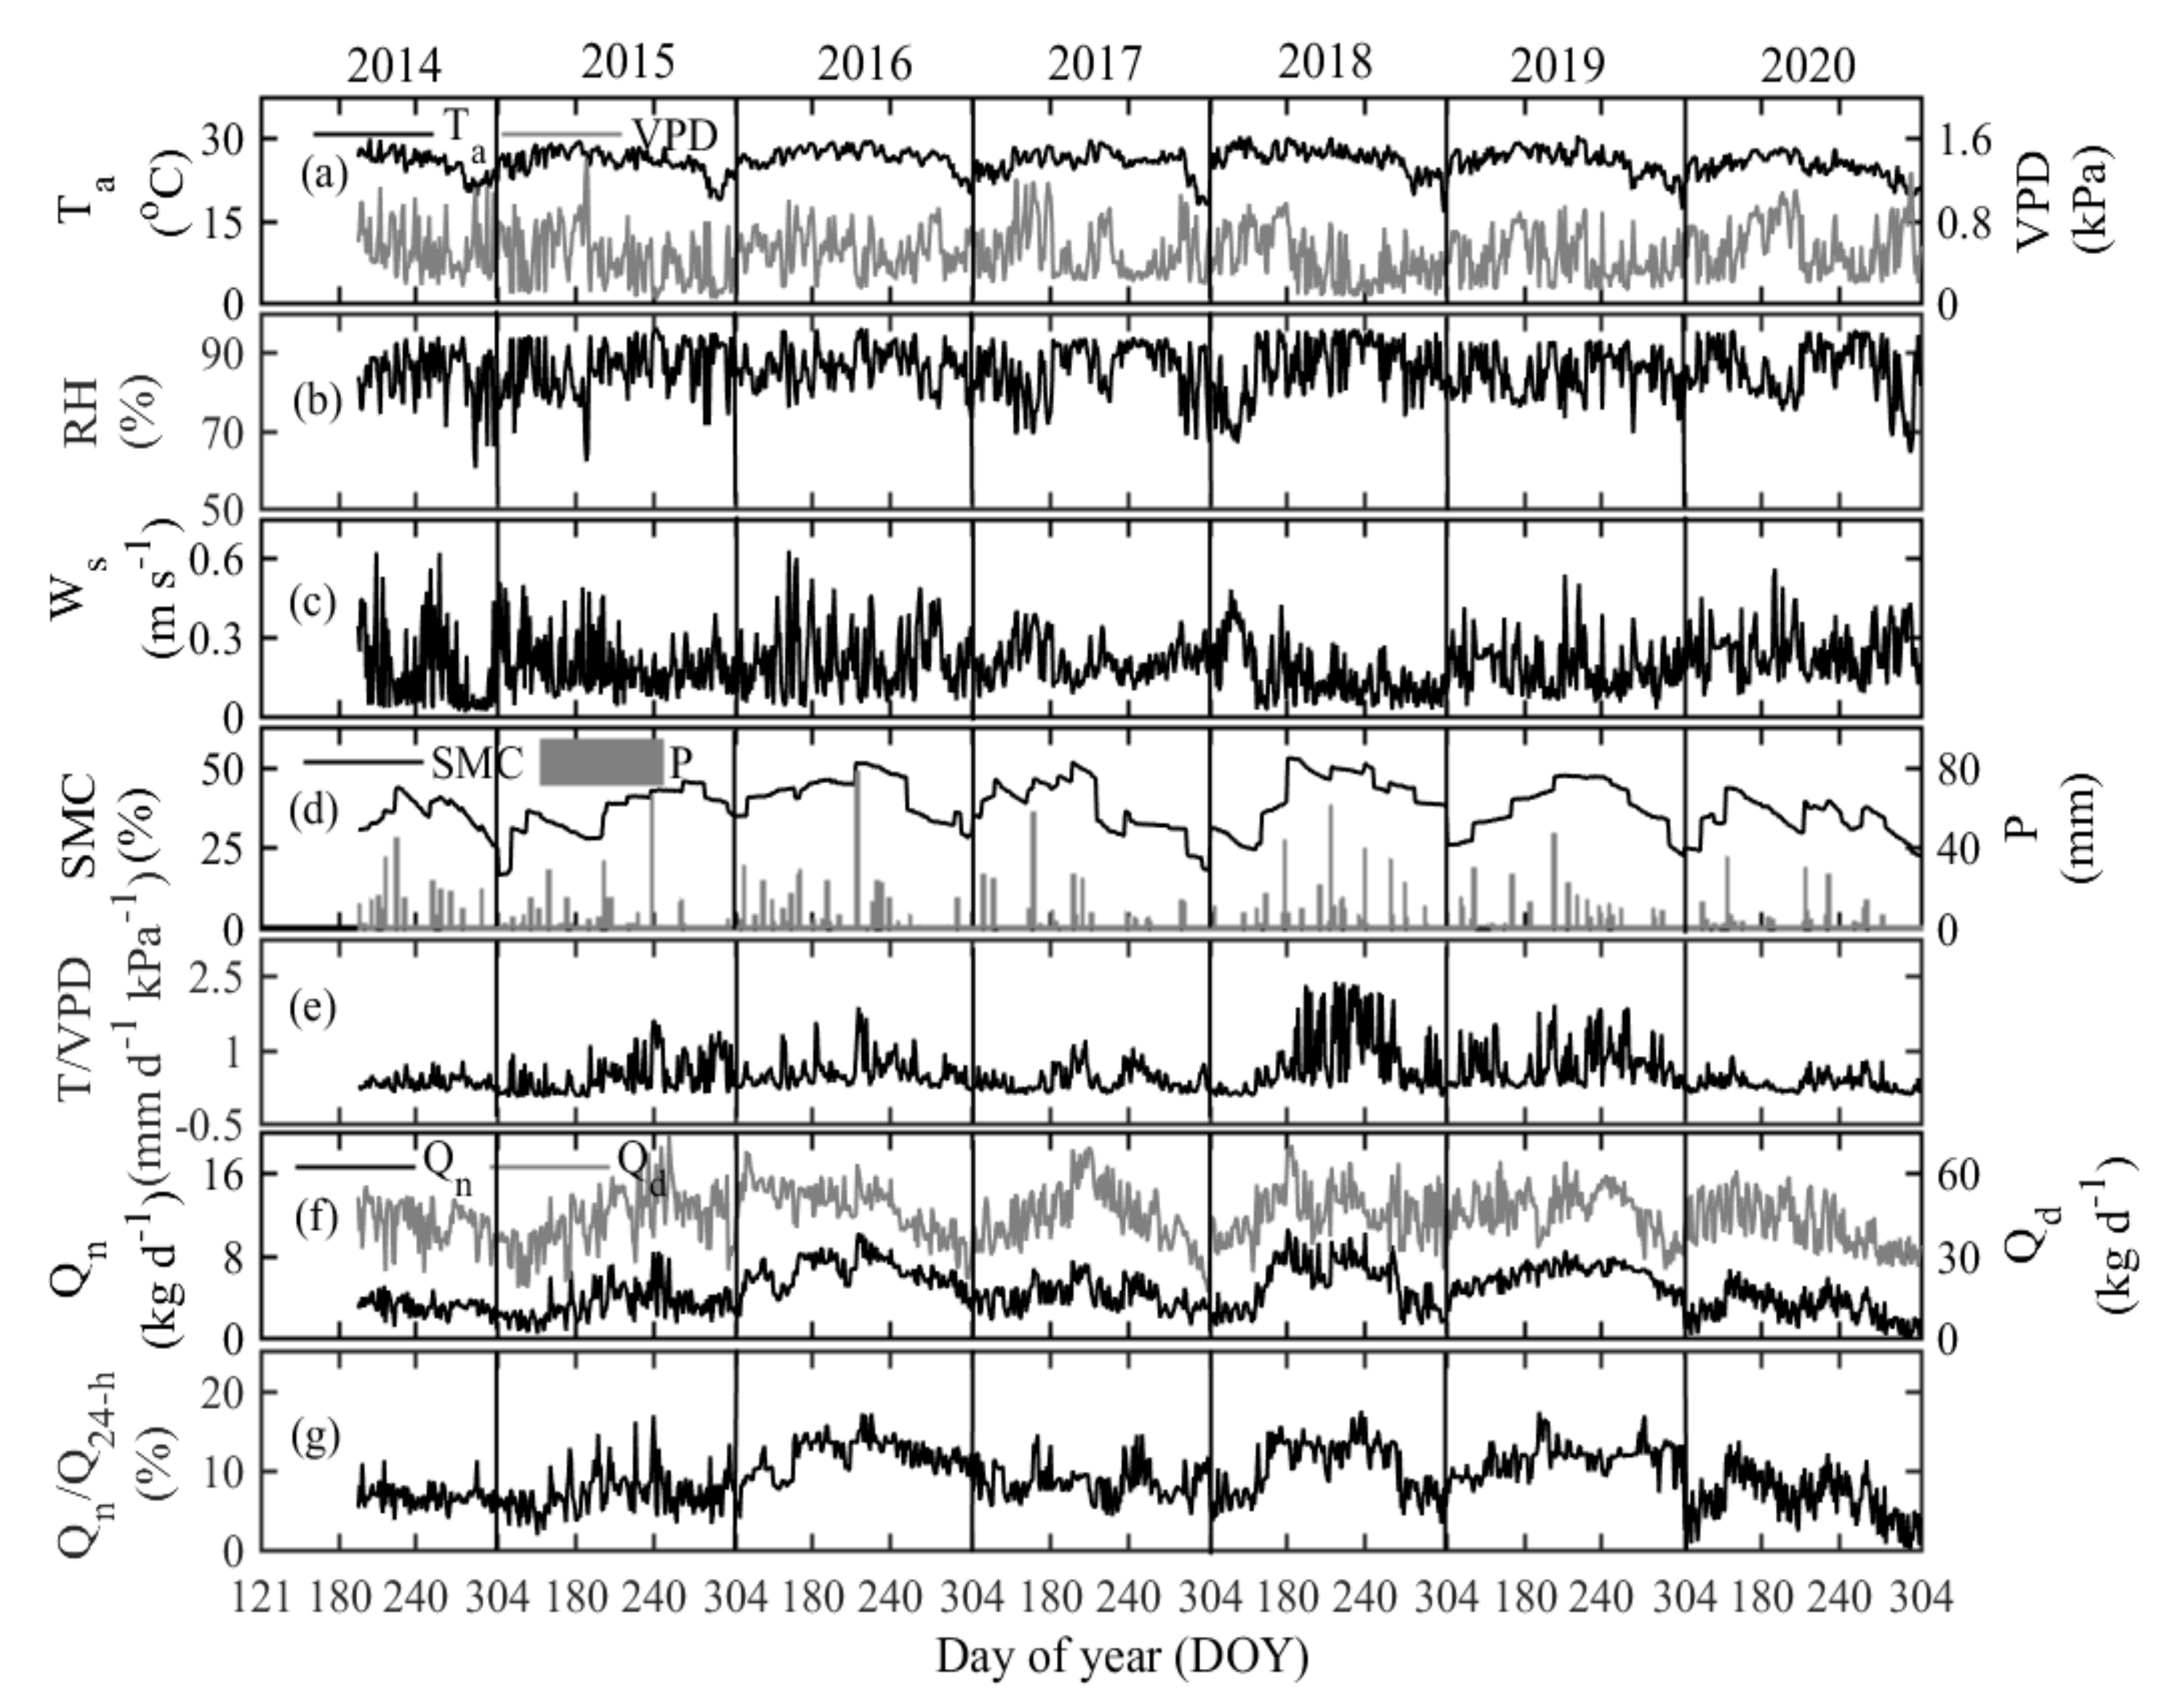
3.1. Variations in Hydrometeorological Parameters

Figure 1a–e shows the daily mean nighttime variations in major hydrometeorological parameters during the observation period of the growing season (1 May–31 October) over seven years. The nighttime Ta, VPD, RH, and Ws were (mean ± standard deviation) 25.68 ± 2.31 °C, 0.48 ± 0.24 kPa, 85.45 ± 6.52%, and 0.194 ± 0.10 m s−1, respectively, during 2014–2020 (Figure 1a–c). The range of Ta, VPD, RH, and Ws across the seven years was 16.51–30.42 °C, 0.03–1.39 kPa, 60.29–96.24%, and 0.01–0.63 m s−1, respectively. During the study period, the interannual monthly mean nighttime Ta had its maximum values in July (27.17 °C), VPD in June (0.66 kPa), RH in September (88.44%), and Ws in May (0.226 m s−1), respectively (Table 1). The growing season annual mean of Ta, VPD, RH, and Ws varied, i.e., 24.73–26.57 °C, 0.41–0.55 kPa, 84.39–86.25%, and 0.15–0.24 m s−1, respectively.
The study site had ample nighttime rainfall during the growing season, with the maximum falling in the month of August (31.37% of the total) and the lowest in October (6.5% of the total) for 2014–2020 (Figure 1d, Table 1). Unusually, in the year of 2016, one large nighttime rainfall event occurred on DOY (day of the year) 215, contributing 77.8 mm of rain, which accounted for 16.2% of the growing season precipitation of that year. Growing season nighttime rainfall summed to 2468.55 mm over seven years, ranging between 252.38 and 479.40 mm, yielding a mean of 352.65 ± 80 mm with a CV of 22.68%. In 2020, minimal amounts of rainfall were observed to be 252.38 mm, about 28.4% lower than the average rainfall amounts (352.65) received in the seven years.
The nighttime SMC varied significantly from season to season, similarly increased in response to rainfall events, and gradually decreased afterward across the seven years (Figure 1d). The daily nighttime SMC, averaged from the measured depths at 10–50 cm, varied from 16.56 to 52.72% for 2014–2020. The high episodes of SMC were evident in the month of August, with the mean value of 42.18%, and the low values occurring in either May or October being 33.05 and 32.27%, respectively (Table 1). The highest annual mean SMC was observed to occur in 2016 (i.e., 41.44%), and the lowest during 2020 (i.e., 33.87%) among the considered seven-year duration. The nighttime T/VPD ranged from 0.026 to 2.38 mm d−1 kPa−1, with the maximum values of 0.77, 1.59, 1.86, 1.19, 2.38, 1.91, 0.87 mm d−1 kPa−1 in years 2014–2020, respectively (Figure 1e). Similar to SMC, the T/VPD clearly showed seasonal pulse dynamics, generally largest in August with the interannual monthly mean of 0.67 mm d−1 kPa−1 (Table 1). The low SMC in 2020 caused an extreme clampdown in T/VPD for that year. The highest nighttime annual mean T/VPD was observed in the wet year of 2018, which was 58% higher than the lowest values that occurred in the dry year of 2020.

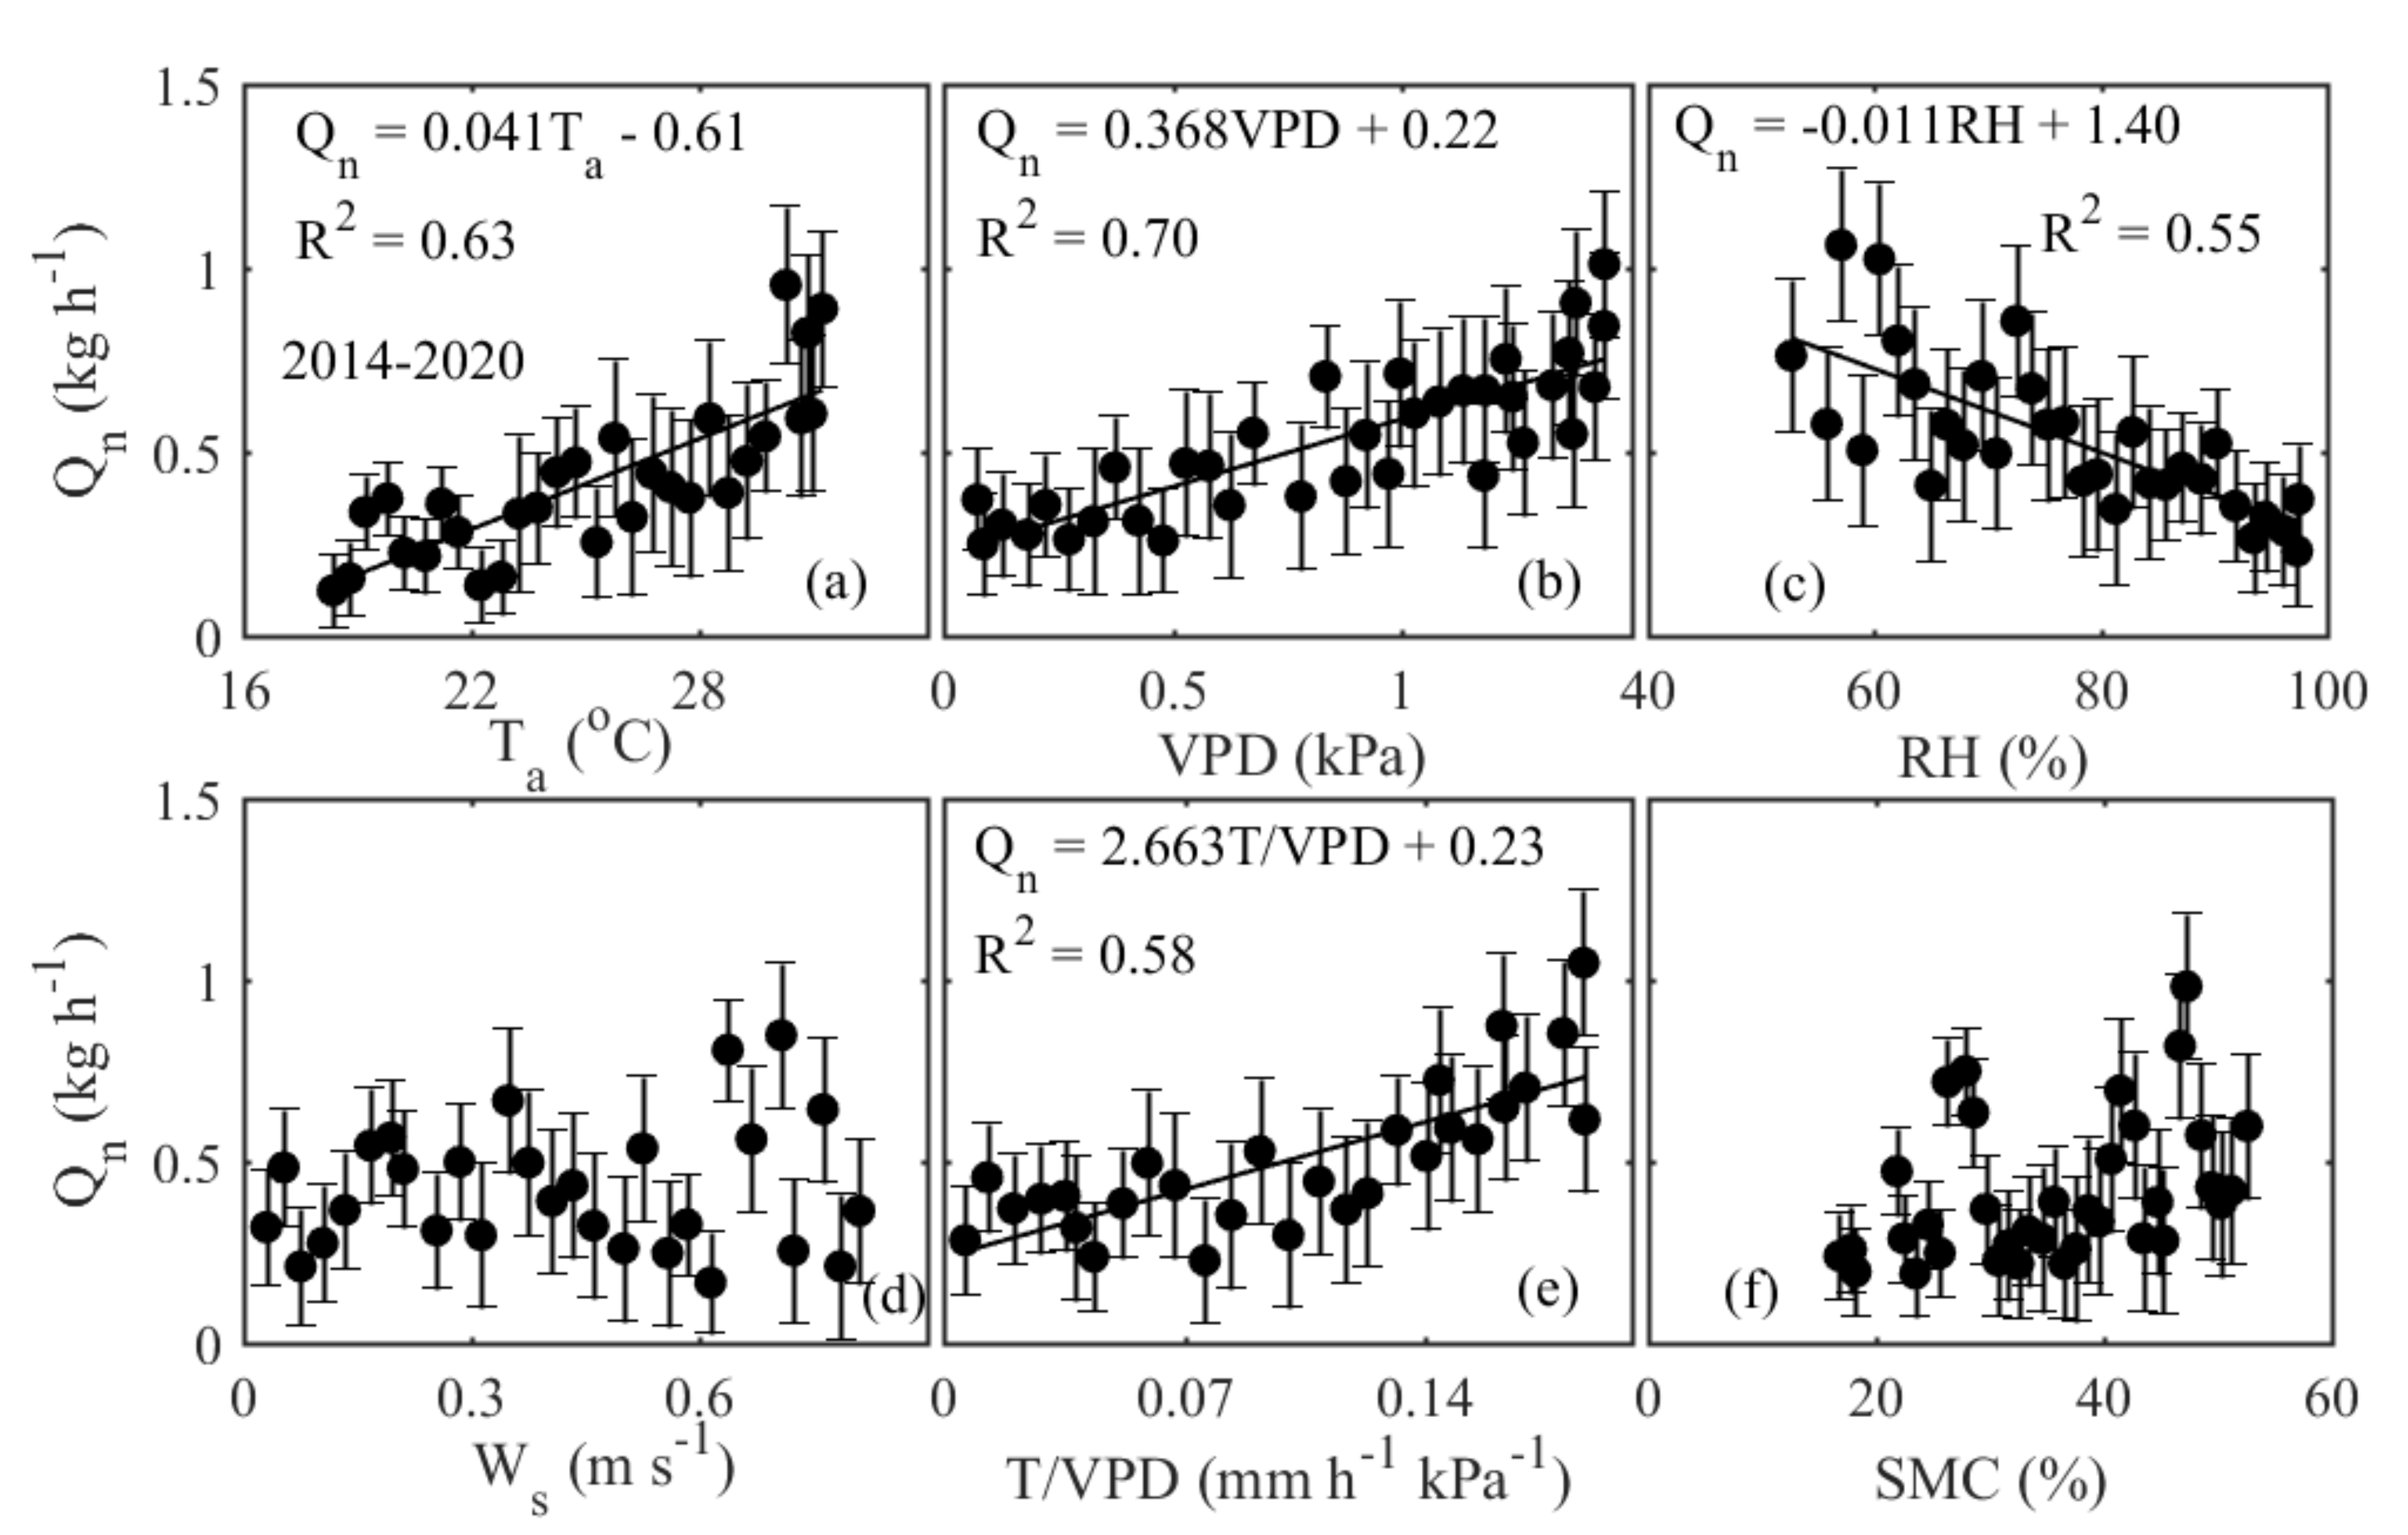
3.2. Nocturnal Variation in Sap Flow Rates and Its Regulating Parameters

The mean nocturnal pattern in Qn is consistent with prevailing nighttime hydrometric conditions (Figure 2a–f), with the mean values ranging from about 0.23 kg h−1 in May to 0.53 kg h−1 in August over seven years. Depending on the time of the night, Qn showed a steadily decreasing trend from sunset, i.e., from 20:00 to 04:00 LST, and then a progressively increasing trend was observed soon afterward. Both Ta and VPD displayed clear nocturnal variations and gradually decreased to the minimum values after sunset (Figure 2b,c). At the hourly resolution, Ta remained elevated in the month of July, while VPD in June. In contrast, nocturnal RH showed an increasing trend after sunset (20:00 LST), ranging between 88.06% and 94.53% in September and 79.87% and 85.42% in June (Figure 2d). There was no clear pattern observed in Ws, while T/VPD decreased before 03:00 LST and then began to increase afterward, yielding the highest mean value (i.e., 0.06 mm h−1 kPa−1) in August and lowest (i.e., 0.02 mm h−1 kPa−1) in May (Figure 2e,f).
At the hourly resolution, Qn had a significant positive linear correlation and was responsive to fluctuations in Ta, VPD, and T/VPD, whereas it was negatively correlated and was less responsive to RH during the growing seasons of 2014–2020 (Figure 3a–f). The hourly values were bin-averaged at every 0.5 °C, 0.05 kPa, 1.5%, 0.03 m s−1, 0.008 mm h−1 kPa−1, and 1% intervals of Ta, VPD, RH, Ws, T/VPD, and SMC, respectively. Nocturnal variation in Ta, VPD, and T/VPD independently explained 63, 70, and 58% of the variation in Qn, respectively (Figure 3a,b,e). Moreover, Qn showed no significant linear correlation with Ws and SMC at the hourly resolution (Figure 3d,f).

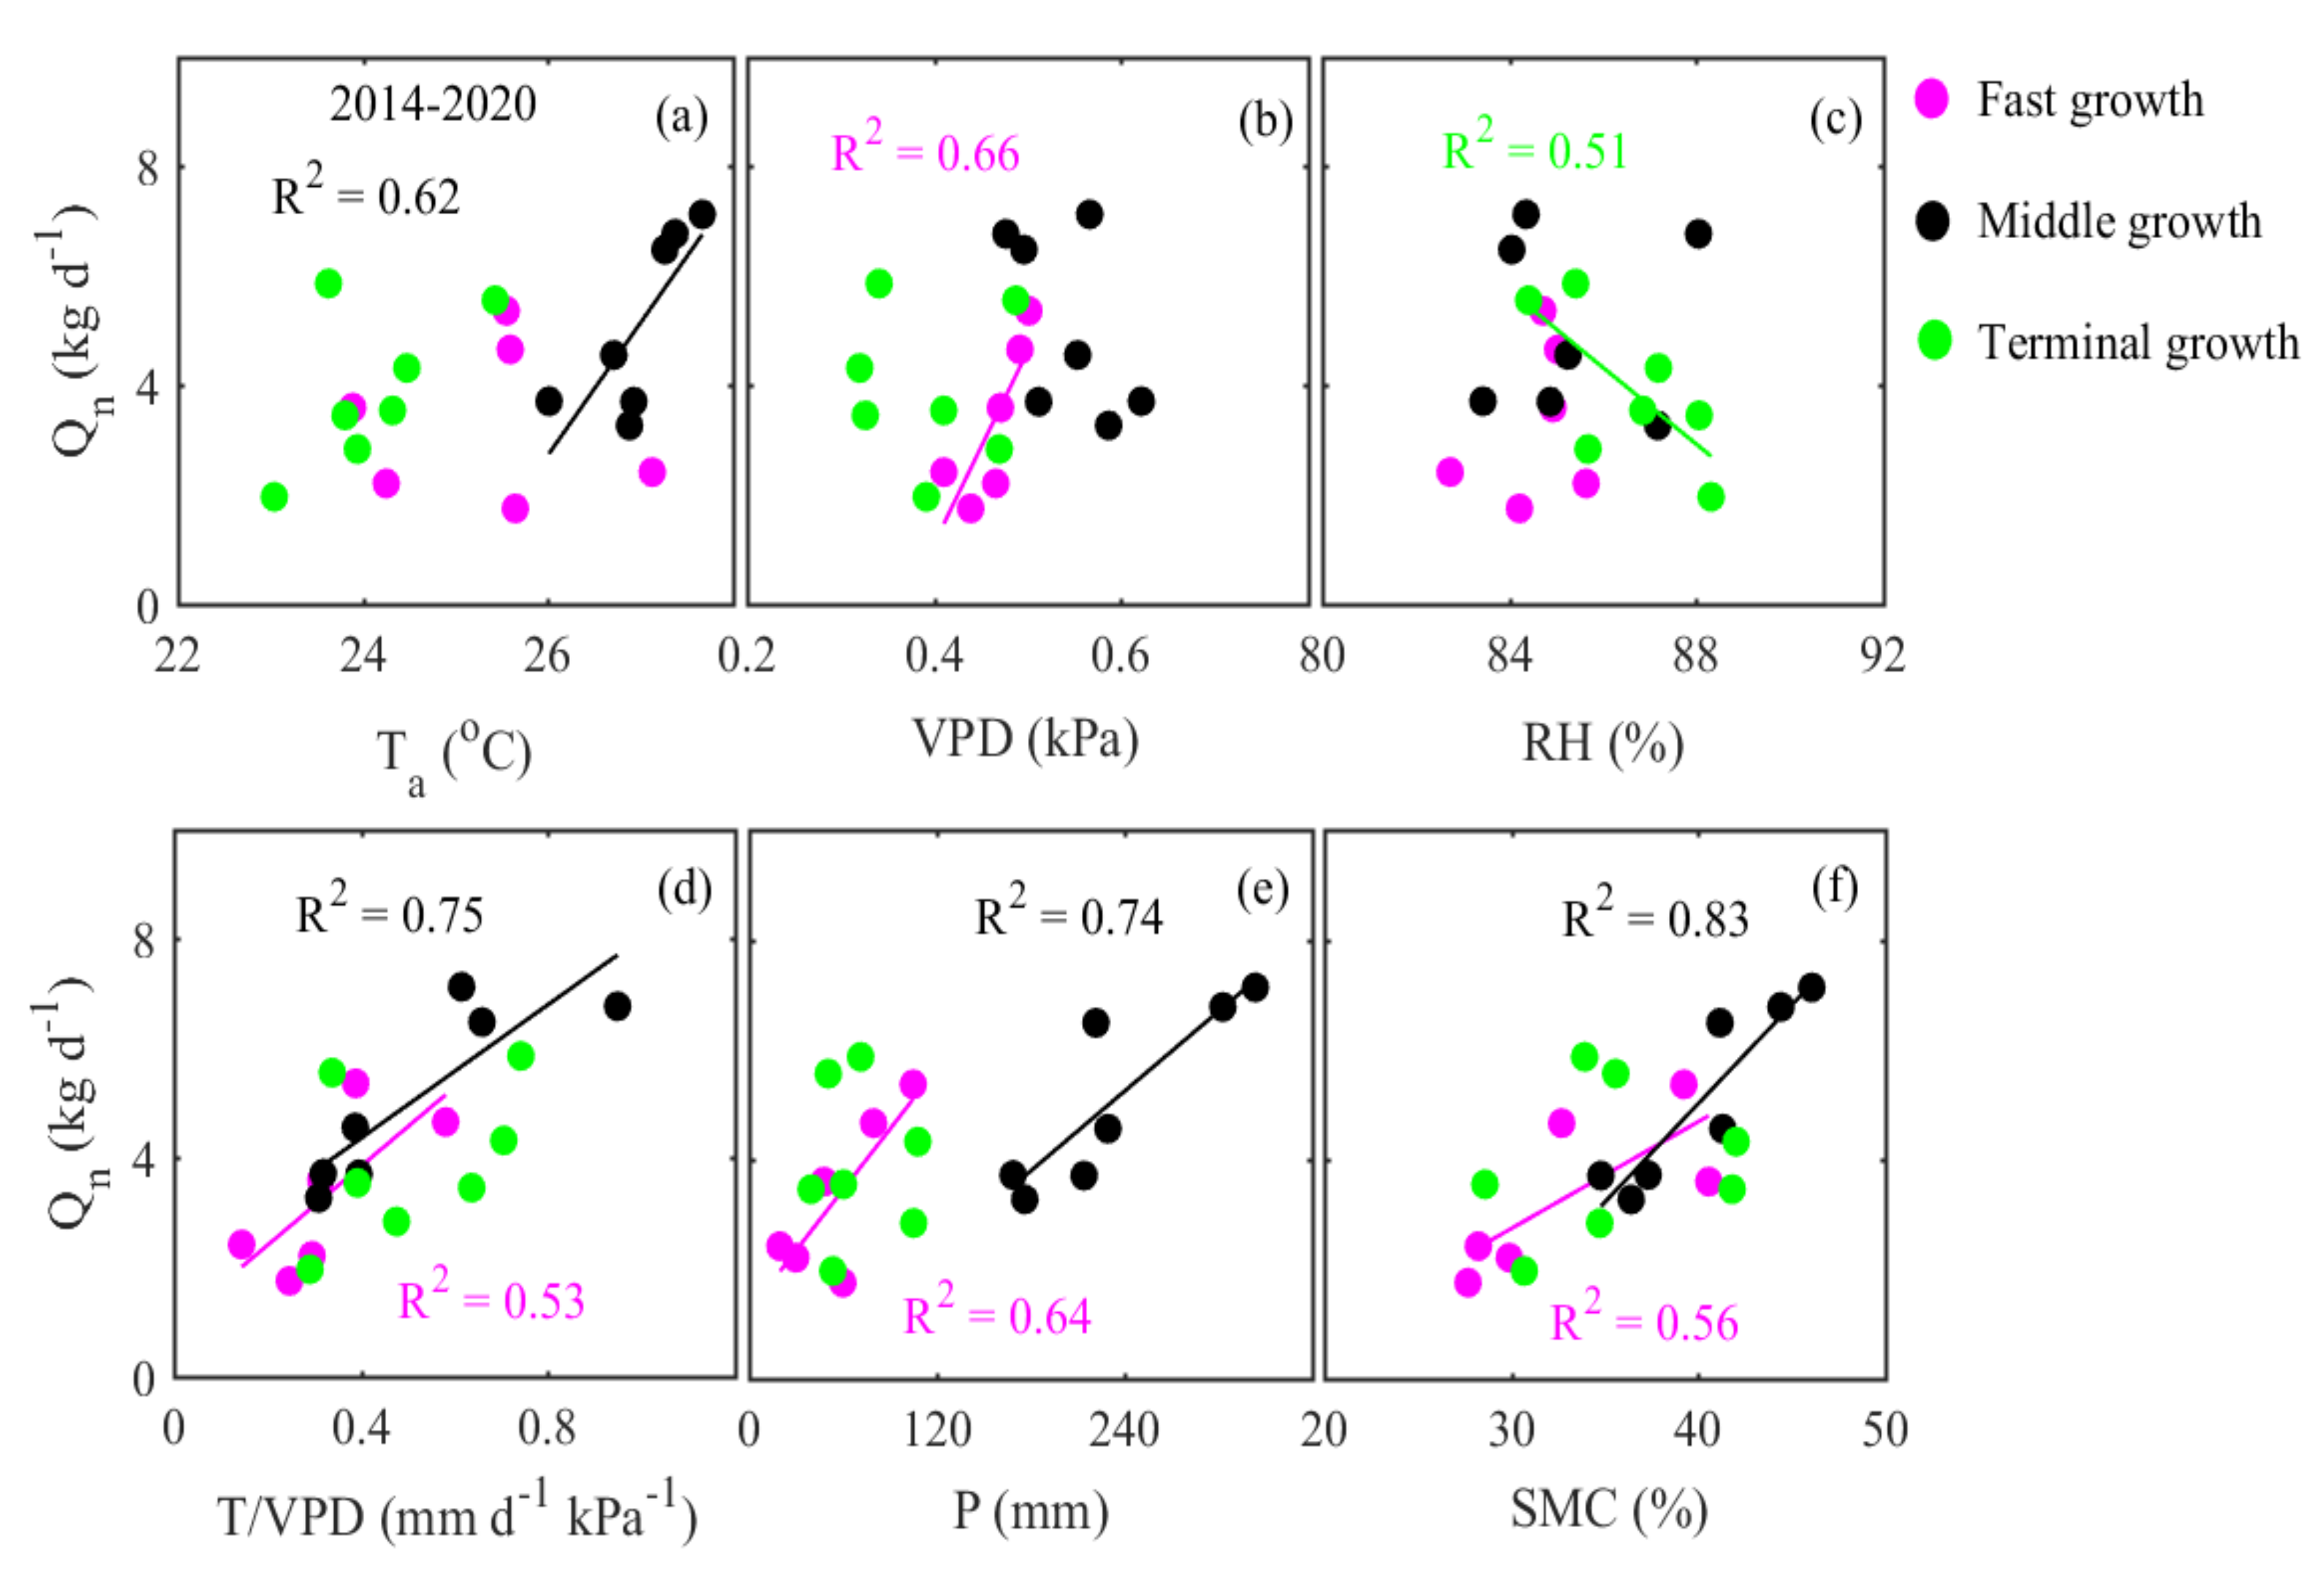
3.3. Seasonal Variation in Nighttime Sap Flow Rates and Its Regulating Parameters

Daily mean Qn displayed a pronounced seasonal pattern and tracked the pattern of rainfall and SMC over seven years (Figure 1d,f). Daily Qn remarkably decreased on rainy days and rapidly increased following the event. The Qn was much lower than Qd, ranging from 0.005 to 10.53 kg d−1 and 16.66 to 73.54 kg d−1, respectively. The mean difference between Qn and Qd was 39.88 ± 7.54 kg d−1 with a CV of 18%. The maximum daily Qn was 5.03, 8.35, 10.14, 7.48, 10.53, 8.35, and 6.65 kg d−1 for 2014–2020, respectively. The interannual monthly Qn was highest in August, yielding a mean value of 5.39 kg d−1, and lowest in May with a mean value of 3.28 kg d−1 (Table 1). The annual mean Qn varied over the growing season with corresponding hydrometeorological parameters, peaked in the middle growth seasons with its values changing from 3.26 (in 2014) to 7.12 kg d−1 (in 2016) and then gradually declined during the terminal growth period (Figure 4a–g). The nighttime to daily sap flow (Qn/Q24-h) ratio showed obvious day-to-day variation, ranging between 0.18% and 17.39% (Figure 1g). The Qn/Q24-h had a higher value in August with an interannual monthly mean of 10.03% and lower values in the month of May and October being 7.26 and 7.88%, respectively (Table 1). The Qn/Q24-h exhibited a similar seasonal pattern with Qn over seven years, reaching its maximum in the middle growth period with the mean values ranging between 6.79% and 12.70%, followed by the terminal growth period (Figure 4h).
The on-site environmental regulating parameters of seasonal variation in Qn differed among growth stages (Figure 5a–f). At the fast growth stage, an important regulating parameter was VPD, explaining 66% of Qn variability. During the middle growth stage, the regulating parameters were Ta, T/VPD, P, and SMC, which independently explained 62, 75, 74, and 83% of Qn variability, respectively, across the seven years. Furthermore, seasonal variation in RH explained 51% of Qn variability during the terminal growth stage.

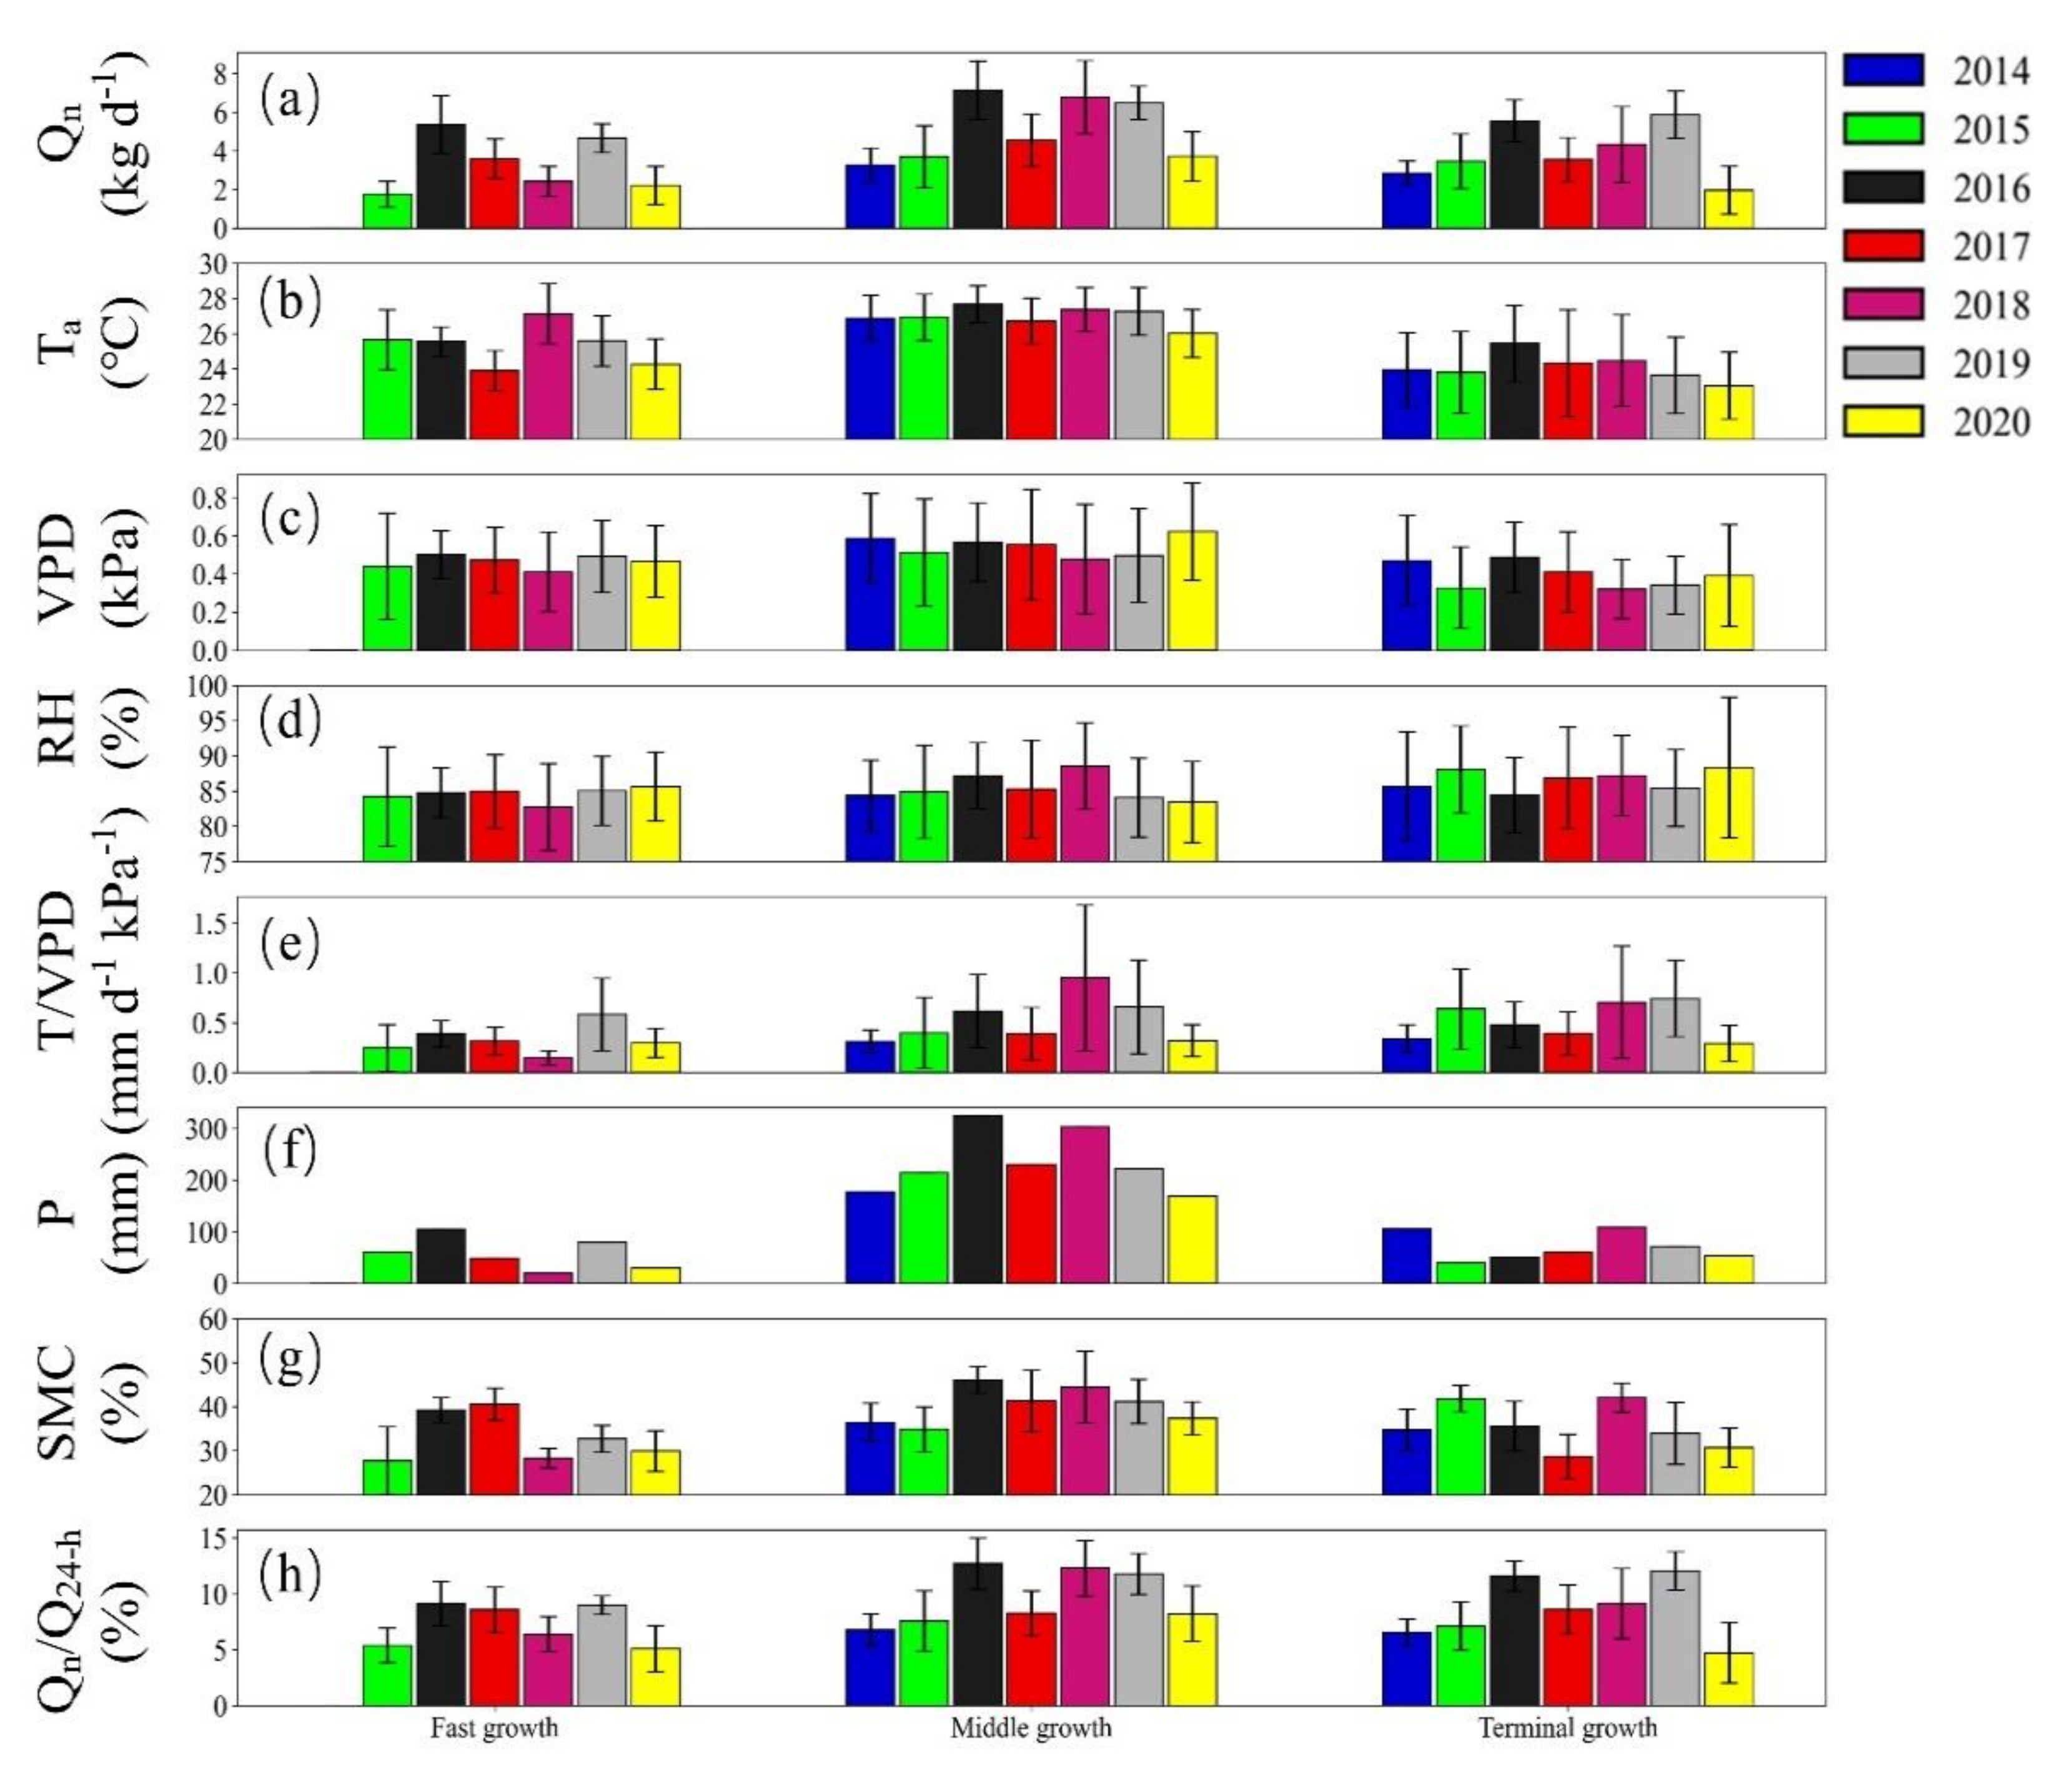
3.4. Interannual Variation in Nighttime Sap Flow Rates and Its Regulating Parameters

Across the seven consecutive growing seasons, there were significant differences in Qn corresponding to prevailing nighttime hydrometeorological parameters (i.e., Ta, VPD, RH, Ws, T/VPD, P, and SMC) with an interannual mean of 4.39 ± 1.43 kg d−1 and CV of 32.72% (Figure 6a–h, Table 1). Large values of Qn were observed during wet years, i.e., 2016, 2018, and 2019 with an annual mean of 6.30, 5.22, and 5.97 kg d−1, and low values occurred during dry years, i.e., 2014, 2015, 2017, and 2020 being 3.02, 3.27, 4.05, and 2.87 kg d−1, respectively. The growing season annual mean Qn significantly contributed to the total 24 h sap flow rate during 2014–2020 by 6.68, 7.05, 11.73, 8.43, 10.26, 11.40, 6.54%, respectively, with an interannual mean ratio of 8.87 ± 2.24% (Figure 6i, Table 1).
Figure 7a–g illustrates the pairwise linear relationships between annual mean Qn and the corresponding hydrometeorological variables over the growing seasons of 2014–2020. Annual mean Qn increased with increasing Ta, T/VPD, P, and SMC, with the parameters individually explaining 69, 63, 83, and 76% of the variability in Qn, respectively (Figure 7a,e–g; with p-values, all <0.05). The annual mean Qn had a tight, positive correlation with P and SMC among these parameters, with the goodness-of-fit being strongest, i.e., 83 and 76%, respectively. In contrast, the effects of VPD, RH, and Ws on annual mean Qn were weak and statistically insignificant (Figure 7b–d; p > 0.05). Furthermore, path analysis demonstrated that the dynamics of annual mean Qn were mainly regulated by Ta, T/VPD, P, and SMC with direct path coefficients of 0.58, 0.55, 0.73, and 0.62, respectively (Figure 8). As mediated by T/VPD and SMC, the indirect path coefficients through separate pathways of Ta and P on Qn were 0.18 and 0.24, respectively. Ws significantly enhanced VPD, yielding a path coefficient of 0.61, but had no discernible direct effect on Qn. The indirect path coefficients of VPD and Ws on Qn (i.e., −0.29 and −0.18) are equivalent to the total path coefficients.

4. Discussion

4.1. Environmental Control on Sap Flow Rates at the Hourly/Nocturnal Scale

Several prior researchers have suggested the possible causes and significance of the wide occurrence of nocturnal sap flow (transpiration), such as transferring carbohydrates [16], promoting nutrient acquisition [65], and advanced opening of stomata in the early morning [13]. However, the robust understanding of nighttime sap flow significance and physiological basis remains unexplained [20,23,66], particularly at multiple timescales. We installed one commercial sap flow sensor for each tree because we assumed no azimuthal variability in the sap flow for the current study. In addition, the need for tree protection and the required number of instruments also limited the use of more sap flow sensors. Our results showed that the Qn rate was relatively more stable during nighttime than the Qd rate during daytime (Figure 1f) and varied with changes in micro-hydrometeorological parameters, which is consistent with previous studies [4,31]. The Qn rate decrease after sunset from May to October may be related to the decreasing trend of Ta and VPD and increasing RH at nighttime before dawn (Figure 2a–d) [5,58,67]. The results show that nocturnal patterns in Qn and Ta and VPD match during nighttime, supporting that Ta and VPD are Qn’s primary drivers during the night. Moreover, maximum Ta and minimum RH was observed in the early night, whereas minimum Ta and maximum RH were in the early morning. A previous study revealed a better cooling effect of urban vegetation on the thermal environment during nighttime (particularly from 20:00 to 24:00 LST) than during daytime [68], which supports our findings of a higher Qn rate in the early night. The higher Ws at the beginning of the night (Figure 2e) can contribute to the magnitude and nocturnal variation of VPD and, thus, nocturnal sap flow, which is in line with previous researchers who revealed that higher Ws lead to higher VPD [27,69]. Our results are unified with previous studies, indicating that Qn has a firm positive relationship with Ta and VPD [8,70], T/VPD [26] and a significant negative correlation with RH at the hourly resolution (Figure 3). The influence of canopy conductance on Qn can deviate within species and fluctuate in environmental parameters such as Ta, VPD, and SMC over many sites [5,71]. In general, T/VPD has a drastic control on Qn under scarce soil water availability. However, the parameters, i.e., Ws and SMC elucidated a very small segment of Qn variability at an hourly resolution because Ws had no clear pattern [67,72], and the temporal variations in SMC were generally very gradual [35].

4.2. Environmental Control on Nighttime Sap Flow Rates at the Seasonal Scale

Mean nighttime sap flow and its seasonal variability with response to variations in micro-hydrometeorological variables fluctuated by plant functional type in a way that is parallel with prior observations [4,5,40] (Figure 1). The seasonal precipitation distribution and associated soil water availability were the most important stimulants in regulating the Qn rate (Figure 1d,f) and accelerating trees’ carbon assimilation. As a result, the response of Qn was examined to be highest after ample amounts of rainfall, triggering soil water replenishment, which is consistent with previous studies that suggested sap flow should increase with an increase in precipitation [29,45,73]. The Qn showed a strong dependence on SMC boosted by rainfall during August at the monthly timescales, leading to the large interannual variation in monthly Qn and T/VPD over the same period (Table 1). Furthermore, the greatest variability in Qn was observed during the middle growth stage (Figure 4), matching larger variations in Ta and infiltration of meteoric water into the soil during this period [7,74], typically associated with the start of the site monsoon season. Consequently, the conversion from the excessively dry to wet season occurred with the onset of the monsoon season, leading to considerable seasonal variations in most micro-hydrometeorological parameters and plant characteristics [59,75]. This seasonal pattern was found to be consistent with those in many subtropical urban tree species, including Eucalyptus citriodora, Acacia auriculaeformis and Schima superba [45,74].
Previous studies revealed that the proportion of Qn to total daily sap flow differs significantly based on trees’ morphological traits, age [31,76], and contrasting habitats [9]. The average Qn accounted for up to 0.18%–17.39% of the Q24-h aggregate sap flow (Figure 1g), which can affect the water balance and cause disequilibrium between the status of soil water and predawn leaf water potential [8,77]. Therefore, the estimation of nocturnal water use of trees could provide evidence for the selection of suitable plantation species on the basis of their seasonal behavior of nighttime transpiration. However, there is a dearth of studies on the nighttime water use of F. concinna in subtropical urban areas; hence, the current study’s findings were related to other tree species growing in different biomes. Our results are in line with prior achievements, showing that the seasonal contribution of nocturnal to 24-h sap flow (i.e., 6.79%–12.70%, Figure 4h) during the middle growth stage across seven years fell within the mean Qn/Q24-h, ranging between 3.0% and 18%, as documented for other ecosystems [4,78,79]. Some other studies carried out on many woody plants reported the fractions for up to 15%–30% over a savanna site [65], 10%–32% in semiarid regions of western USA [18], 10%–30% in Mediterranean holm oak forests [80], and reached to the maximum ratios of 50% in arid to semiarid regions of northwestern Australia [81]. As a result, large proportions point to low water consumption during the daytime and high sap flow at night. The possible reason for substantial water loss during the night through transpiration was demonstrated as the overall high atmospheric water demand, i.e., Ta and VPD.
At seasonal scales, the effect of micro-hydrometeorological forcing on nighttime sap flow has seldom been investigated over subtropical urban plantations [58]. In several other ecosystems, it has been previously revealed that site environmental parameters, including Ta, VPD, and SMC, were generally the most significant variables affecting Qn [5,8,9,80]. The high VPD reflects the changes in water potential between atmospheric demand and leaves, which influences the canopy conductance, resulting in nighttime water losses [4,82]. Similarly, SMC dynamics were observed to be crucial in defining the timing of the growth rates in plants because water availability is fundamental for increases in both photosynthetic capacity and transpiration rates [59,83,84,85]. Furthermore, the prior study revealed that water scarcity might change the plant physiology, delay the development of the canopy structure and even cause tree mortality, which underscores the impact of precipitation variability on the existing plantation growth [86]. At our site, the Qn was strongly correlated and highly responsive to VPD during fast growth, Ta, T/VPD, and P-induced-SMC during middle growth, and RH in the terminal growth stages (Figure 5a–f), because of the pronounced variability in Ta and P-induced-soil water conditions (Figure 4b,f,g). These results are comparable with the findings obtained by previous research, which showed that SMC did not only affect transpiration but also mediated the influences of other micro-hydrometeorological parameters on the sap flow rate [4,9,24,28,58]. Another explanation may be the irrigation practices, i.e., roughly once a week during the dry period (according to the management services office), which support the nighttime plants’ water consumption. Therefore, to optimize tree growth development and functioning, irrigation practices during the dry seasons are more productive than irrigation during any other time of the year [24,87]. To further elucidate, the Qn rate positively increased with increasing Ta and T/VPD under sufficient water availability during the middle growth stage while negatively decreased with high seasonal RH over the terminal growth stage. Additionally, the fluctuations in Qn rates may deliver ecophysiological improvements to plants via boosting photosynthesis and promoting fast growth [8] and could be adaptive feedback to dry environmental conditions [35].

4.3. Environmental Control on Nighttime Sap Flow Rates at the Interannual Scale

The consecutive seven-year nighttime observation period (i.e., covered wet and dry years) provided an opportunity to investigate Qn’s long-term variations and responses under thermal environmental conditions. The growing season means annual Qn varied significantly with response to environmental drivers, largely congruent to the rain-fed soil water (Figure 6a–h, Table 1). Typically, over a longer timescale (i.e., interannually), SMC can explain a massive fraction of variability in transpiration because, in a short-time period, the physical fluctuations in SMC are very moderate [29,67]. In the current study, we found the highest growing season mean annual Qn in the wet and warm years (i.e., 2016, 2018, and 2019), which is in line with the previous observations that atmospheric water demand increases with higher Ta under an ample soil water environment [45,70,88]. In contrast, during the dry and cold years of 2014, 2015, 2017, and 2020, the T/VPD and Qn were observed to be low because there was frequent scarce SMC to meet the atmospheric demand for water. Furthermore, over the periods of excessive dryness, the Qn decreased rapidly, accentuating the water conservation strategy retained by woody plants [23,35]. Similarly, trees can lessen the impacts of higher nighttime water losses through stomatal closure in the dry periods to prevent functional damage to themselves [33,58,72]. The different plant species growing in different habitats with diverging traits lead to species-specific differences in transpiration rate. In our previous research, we found that the daily mean transpiration rate of F. concinna ranged from 0.27 to 2.80 mm d−1 with a mean value of 1.46 mm d−1 [24], which was higher than the transpiration rate of other urban tree species ranging from 0.1 to 0.6 mm d−1 [45]. The nighttime water consumption (i.e., transpiration) of F. concinna ranged from 0.003 to 0.35 mm per night, with an average of 0.15 mm per night (data not shown). However, the differences can often be related to species-specific hydraulic characteristics and the amount of precipitation received. Our findings are in line with earlier studies, which showed that Qn could contribute considerably to Q24-h (Figure 6i, Table 1) [18,21,79]. However, the growing season annual mean proportions were highest in the wet years compared to dry years because the promotion in stomatal aperture and physiological activity in wet conditions causes Qn to be more sensitive to environmental drivers (i.e., Ta and VPD), while the reduction in stomatal conductance generally leads Qn to be less responsive to environmental stress conditions [5,17,29]. Previous studies documented that stem refilling may also occur at night, which may be responsible for recharging the depleted water storage of plants primarily caused by daytime transpiration [89,90]. Furthermore, the nighttime sap flow is more elevated before midnight, indicating to fill up the water storage deficit reduced by daytime water consumption [91]. The refilling of the stem water storage deficit could contribute up to 15%–25% of daily sap flow [8]. The basal sap flow starts rising nearly simultaneously with environmental parameters in the morning.
Generally, the regulating mechanism of the hydrometeorological parameters on nighttime sap flow of vegetation growing in an urban thermal environment at interannual scales is quite a new concept. Estimating the relationship between the plant’s water use at night with these regulating parameters encourages water management aspects and also improves the understanding of the role of urban design in the water budget [72]. We found that at interannual scales, Qn was significantly conformed to the regulating parameters of Ta, T/VPD, P, and SMC; however, this connection was shown to be more tightly coupled between Qn and P-induced changes in SMC (Figure 7a–g). These findings are supported by prior studies which demonstrated that unlike VPD and Ws influencing Qn at a short timescale [9,23], meteoric water input to soils would be an important regulating parameter of Qn over a longer timescale [5,35,92] because the temporal variations in soil water are generally very gradual over a short period. The scale issue in the nighttime sap flow response to hydrometeorological parameters is a long-lasting topic [91]. The plants’ water consumption differs primarily with atmospheric demand under sufficient water availability. Over short timescales (i.e., hourly/daily), Ta and VPD exert significant control on Qn by affecting the stomatal conductance. In addition, Chen et al. also anticipated that variations of SMC over the longer term could explain a large level of interannual alterations of transpiration [45]. Path analysis further reinforced these relationships (Figure 8). The parameters Ta, T/VPD, and meteoric water to soil had a direct positive control on Qn, while VPD and Ws had an indirect control on Qn by influencing T/VPD and soil water availability. Consequently, this indirect relation counterbalanced the direct control on Qn. In addition, the influences of VPD and Ws on Qn are dependent on canopy conductance and soil water conditions [9,62].

5. Conclusions

Magnitude and patterns of nighttime sap flow in urban trees (e.g., F. concinna) with the influences of environmental parameters were analyzed at multiple timescales over seven years. The results indicate that predominant nighttime hydrometeorological parameters may cause Qn to vary from nocturnal to interannual timescales. Variations in Ta, VPD, and T/VPD largely regulated Qn at the hourly resolutions during the growing seasons. However, regulating parameters of variation in Qn differed seasonally, with VPD exhibited to be the most important during the fast growth, Ta, T/VPD, and P-induced-SMC during the middle growth, and RH during the terminal growth stages of the trees. During wet years, Qn was generally higher than in dry years. Interannually, the variability in Qn was mainly regulated by Ta, T/VPD, P, and SMC. The soil water availability, together with changing environmental parameters across temporal scales, caused Qn to respond differently, indicating that plants had a physiological capacity to acclimatize to soil dryness. Across the seven years, Qn was lower than Qd with a CV of 18%. The significant contribution of Qn to the 24 h sap flow ranged between 0.18% and 17.39%, suggesting the importance of Qn to the water status and tree’s transpiration-induced cooling in a thermal environment in urban areas. However, further investigation requires evaluating the nighttime transpiration-induced cooling efficiency in the context of increasing the UHI effect (specifically under high nighttime Ta and VPD) with future climate change and urbanization.

Author Contributions

All authors intellectually contributed to this study. M.H.: conceptualization, methodology, writing—original draft. C.Y.: conceptualization, funding acquisition. J.X.: data curation, investigation, B.X.: investigation, data acquisition, L.Q.: visualization, resources, B.W.: investigation, data acquisition, A.K.: validation, writing—review and editing, M.K.: investigation, writing—review and editing, Z.Z.: formal analysis, methodology, G.Q.: supervision, conceptualization, funding acquisition. All authors have read and agreed to the published version of the manuscript.

Funding

The study was supported by grants from Shenzhen Science and Technology Project (GXWD20201231165807007-20200827105738001, JCYJ20180504165440088), the Chinese Ministry of Science and Technology Projects (YS2017YFE0116500, 2017FY100206-03), and the National Natural Science Foundation of China (42001022).

Data Availability Statement

Contact Guo Yu Qiu ([email protected]) or Chunhua Yan ([email protected]) to access this research data.

Acknowledgments

We thank Shenglin Tan, Zhenhua Wang, Tong Li, Xiaohui Yu, Chenghaoxian Jiang, and Haiyan Wen for their assistance with field measurements and instrument maintenance.

Conflicts of Interest

The authors declare no conflict of interests.

References

  1. Bahn, M.; Reichstein, M.; Guan, K.; Moreno, J.M.; Williams, C. Preface: Climate extremes and biogeochemical cycles in the terrestrial biosphere: Impacts and feedbacks across scales. Biogeosciences 2015, 12, 4827–4830. [Google Scholar] [CrossRef]
  2. Domec, J.C.; Ogée, J.; Noormets, A.; Jouangy, J.; Gavazzi, M.; Treasure, E.; King, J.S. Interactive effects of nocturnal transpiration and climate change on the root hydraulic redistribution and carbon and water budgets of southern United States pine plantations. Tree Physiol. 2012, 32, 707–723. [Google Scholar] [CrossRef] [PubMed] [Green Version]
  3. Davy, R.; Esau, I.; Chernokulsky, A.; Outten, S.; Zilitinkevich, S. Diurnal asymmetry to the observed global warming. Int. J. Climatol. 2017, 37, 79–93. [Google Scholar] [CrossRef] [Green Version]
  4. Siddiq, Z.; Cao, K.F. Nocturnal transpiration in 18 broadleaf timber species under a tropical seasonal climate. For. Ecol. Manag. 2018, 418, 47–54. [Google Scholar] [CrossRef]
  5. Hayat, M.; Iqbal, S.; Zha, T.; Jia, X.; Qian, D.; Bourque, C.P.A.; Yang, R. Biophysical control on nighttime sap flow in Salix psammophila in a semiarid shrubland ecosystem. Agric. For. Meteorol. 2021, 300, 108329. [Google Scholar] [CrossRef]
  6. Zeppel, M.J.B.; Lewis, J.D.; Phillips, N.G.; Tissue, D.T. Consequences of nocturnal water loss: A synthesis of regulating factors and implications for capacitance, embolism and use in models. Tree Physiol. 2014, 34, 1047–1055. [Google Scholar] [CrossRef] [Green Version]
  7. Fu, Y.H.; Liu, Y.; De Boeck, H.J.; Menzel, A.; Nijs, I.; Peaucelle, M.; Janssens, I.A. Three times greater weight of daytime than of night-time temperature on leaf unfolding phenology in temperate trees. New Phytol. 2016, 212, 590–597. [Google Scholar] [CrossRef] [Green Version]
  8. Daley, M.J.; Phillips, N.G. Interspecific variation in nighttime transpiration and stomatal conductance in a mixed New England deciduous forest. Tree Physiol. 2006, 26, 411–419. [Google Scholar] [CrossRef] [Green Version]
  9. Chen, Z.; Zhang, Z.; Sun, G.; Chen, L.; Xu, H.; Chen, S. Biophysical controls on nocturnal sap flow in plantation forests in a semi-arid region of northern China. Agric. For. Meteorol. 2020, 284, 107904. [Google Scholar] [CrossRef]
  10. Caird, M.A.; Richards, J.H.; Donovan, L.A. Nighttime stomatal conductance and transpiration in C3 and C4 plants. Plant Physiol. 2007, 143, 4–10. [Google Scholar] [CrossRef] [Green Version]
  11. Goldstein, G.; Bucci, S.J.; Scholz, F.G. Why do trees adjust water relations and hydraulic architecture in response to nutrient availability? Tree Physiol. 2013, 33, 238–240. [Google Scholar] [CrossRef] [Green Version]
  12. Gansert, D. Xylem sap flow as a major pathway for oxygen supply to the sapwood of birch (Betula pubescens Ehr.). Plant Cell Environ. 2003, 26, 1803–1814. [Google Scholar] [CrossRef] [Green Version]
  13. Resco de Dios, V.; Loik, M.E.; Smith, R.; Aspinwall, M.J.; Tissue, D.T. Genetic variation in circadian regulation of nocturnal stomatal conductance enhances carbon assimilation and growth. Plant Cell Environ. 2016, 39, 3–11. [Google Scholar] [CrossRef] [Green Version]
  14. Benyon, R.G. Nighttime water use in an irrigated Eucalyptus grandis plantation. Tree Physiol. 1999, 19, 853–859. [Google Scholar] [CrossRef]
  15. Fisher, J.B.; Baldocchi, D.D.; Misson, L.; Dawson, T.E.; Goldstein, A.H. What the towers don’t see at night: Nocturnal sap flow in trees and shrubs at two AmeriFlux sites in California. Tree Physiol. 2007, 27, 597–610. [Google Scholar] [CrossRef] [Green Version]
  16. Marks, C.O.; Lechowicz, M.J. The ecological and functional correlates of nocturnal transpiration. Tree Physiol. 2007, 27, 577–584. [Google Scholar] [CrossRef] [Green Version]
  17. Zhao, C.; Si, J.; Feng, Q.; Yu, T.; Li, P.; Forster, M.A. Nighttime transpiration of Populus euphratica during different phenophases. J. For. Res. 2019, 30, 435–444. [Google Scholar] [CrossRef]
  18. Snyder, K.A.; Richards, J.H.; Donovan, L.A. Night-time conductance in C3 and C4 species: Do plants lose water at night? J. Exp. Bot. 2003, 54, 861–865. [Google Scholar] [CrossRef]
  19. Lombardozzi, D.L.; Zeppel, M.J.; Fisher, R.A.; Tawfik, A. Representing nighttime and minimum conductance in CLM4. 5: Global hydrology and carbon sensitivity analysis using observational constraints. Geosci. Model Dev. 2017, 10, 321–331. [Google Scholar] [CrossRef] [Green Version]
  20. Dawson, T.E.; Burgess, S.S.; Tu, K.P.; Oliveira, R.S.; Santiago, L.S.; Fisher, J.B.; Ambrose, A.R. Nighttime transpiration in woody plants from contrasting ecosystems. Tree Physiol. 2007, 27, 561–575. [Google Scholar] [CrossRef] [Green Version]
  21. Forster, M.A. How significant is nocturnal sap flow? Tree Physiol. 2014, 34, 757–765. [Google Scholar] [CrossRef] [Green Version]
  22. Wallace, J.; McJannet, D. Processes controlling transpiration in the rainforests of north Queensland, Australia. J. Hydrol. 2010, 384, 107–117. [Google Scholar] [CrossRef]
  23. Rosado, B.H.; Oliveira, R.S.; Joly, C.A.; Aidar, M.P.; Burgess, S.S. Diversity in nighttime transpiration behavior of woody species of the Atlantic Rain Forest, Brazil. Agric. For. Meteorol. 2012, 158, 13–20. [Google Scholar] [CrossRef]
  24. Hayat, M.; Xiang, J.; Yan, C.; Xiong, B.; Wang, B.; Qin, L.; Qiu, G.Y. Environmental control on transpiration and its cooling effect of Ficus concinna in a subtropical city Shenzhen, southern China. Agric. For. Meteorol. 2022, 312, 108715. [Google Scholar] [CrossRef]
  25. Bosch, D.D.; Marshall, L.K.; Teskey, R. Forest transpiration from sap flux density measurements in a Southeastern Coastal Plain riparian buffer system. Agric. For. Meteorol. 2014, 187, 72–82. [Google Scholar] [CrossRef]
  26. Resco de Dios, V.; Roy, J.; Ferrio, J.P.; Alday, J.G.; Landais, D.; Milcu, A.; Gessler, A. Processes driving nocturnal transpiration and implications for estimating land evapotranspiration. Sci. Rep. 2015, 5, 10975. [Google Scholar] [CrossRef]
  27. Rahman, M.A.; Moser, A.; Rötzer, T.; Pauleit, S. Microclimatic differences and their influence on transpirational cooling of Tilia cordata in two contrasting street canyons in Munich, Germany. Agric. For. Meteorol. 2017, 232, 443–456. [Google Scholar] [CrossRef]
  28. Hayat, M.; Zha, T.; Jia, X.; Iqbal, S.; Qian, D.; Bourque, C.P.A.; Yang, R. A multiple-temporal scale analysis of biophysical control of sap flow in Salix psammophila growing in a semiarid shrubland ecosystem of northwest China. Agric. For. Meteorol. 2020, 288, 107985. [Google Scholar] [CrossRef]
  29. Iqbal, S.; Zha, T.; Jia, X.; Hayat, M.; Qian, D.; Bourque, C.P.A.; Khan, A. Interannual variation in sap flow response in three xeric shrub species to periodic drought. Agric. For. Meteorol. 2021, 297, 108276. [Google Scholar] [CrossRef]
  30. Phillips, N.G.; Lewis, J.D.; Logan, B.A.; Tissue, D.T. Inter-and intra-specific variation in nocturnal water transport in Eucalyptus. Tree Physiol. 2010, 30, 586–596. [Google Scholar] [CrossRef] [Green Version]
  31. Yu, T.; Feng, Q.; Si, J.; Zhang, X.; Alec, D.; Zhao, C. Evidences and magnitude of nighttime transpiration derived from Populus euphratica in the extreme arid region of China. J. Plant Biol. 2016, 59, 648–657. [Google Scholar] [CrossRef]
  32. Ma, F.; Kang, S.; Li, F.; Zhang, J.; Du, T.; Hu, X.; Wang, M. Effect of water deficit in different growth stages on stem sap flux of greenhouse grown pear-jujube tree. Agric. Water Manag. 2007, 90, 190–196. [Google Scholar] [CrossRef]
  33. Zha, T.; Qian, D.; Jia, X.; Bai, Y.; Tian, Y.; Bourque, C.P.A.; Peltola, H. Soil moisture control of sap-flow response to biophysical factors in a desert-shrub species, Artemisia ordosica. Biogeosciences 2017, 14, 4533–4544. [Google Scholar] [CrossRef] [Green Version]
  34. Roth, M. Review of urban climate research in (sub) tropical regions. Int. J. Climatol. J. R. Meteorol. Soc. 2007, 27, 1859–1873. [Google Scholar] [CrossRef]
  35. Fang, W.; Lu, N.; Zhang, Y.; Jiao, L.; Fu, B. Responses of nighttime sap flow to atmospheric and soil dryness and its potential roles for shrubs on the Loess Plateau of China. J. Plant Ecol. 2018, 11, 717–729. [Google Scholar] [CrossRef]
  36. Rahman, M.A.; Stratopoulos, L.M.; Moser-Reischl, A.; Zölch, T.; Häberle, K.H.; Rötzer, T.; Pauleit, S. Traits of trees for cooling urban heat islands: A meta-analysis. Build. Environ. 2020, 170, 106606. [Google Scholar] [CrossRef]
  37. Rahman, M.A.; Moser, A.; Gold, A.; Rötzer, T.; Pauleit, S. Vertical air temperature gradients under the shade of two contrasting urban tree species during different types of summer days. Sci. Total Environ. 2018, 633, 100–111. [Google Scholar] [CrossRef]
  38. Young, M.H.; Wierenga, P.J.; Mancino, C.F. Monitoring near-surface soil water storage in turfgrass using time domain reflectometry and weighing lysimetry. Soil Sci. Soc. Am. J. 1997, 61, 1138–1146. [Google Scholar] [CrossRef]
  39. Gill, S.E.; Rahman, M.A.; Handley, J.F.; Ennos, A.R. Modelling water stress to urban amenity grass in Manchester UK under climate change and its potential impacts in reducing urban cooling. Urban For. Urban Green. 2013, 12, 350–358. [Google Scholar] [CrossRef]
  40. Konarska, J.; Uddling, J.; Holmer, B.; Lutz, M.; Lindberg, F.; Pleijel, H.; Thorsson, S. Transpiration of urban trees and its cooling effect in a high latitude city. Int. J. Biometeorol. 2016, 60, 159–172. [Google Scholar] [CrossRef]
  41. Qiu, G.Y.; Yu, X.; Wen, H.; Yan, C. An advanced approach for measuring the transpiration rate of individual urban trees by the 3D three-temperature model and thermal infrared remote sensing. J. Hydrol. 2020, 587, 125034. [Google Scholar] [CrossRef]
  42. Goulden, M.L.; Field, C.B. Three methods for monitoring the gas exchange of individual tree canopies: Ventilated-chamber, sap-flow and Penman-Monteith measurements on evergreen oaks. Funct. Ecol. 1994, 8, 125–135. [Google Scholar] [CrossRef] [Green Version]
  43. Granier, A.; Biron, P.; Breda, N.; Pontailler, J.Y.; Saugier, B. Transpiration of trees and forest stands: Short and long-term monitoring using sapflow methods. Glob. Change Biol. 1996, 2, 265–274. [Google Scholar] [CrossRef]
  44. Litvak, E.; McCarthy, H.R.; Pataki, D.E. A method for estimating transpiration of irrigated urban trees in California. Landsc. Urban Plan. 2017, 158, 48–61. [Google Scholar] [CrossRef] [Green Version]
  45. Chen, X.; Zhao, P.; Hu, Y.; Ouyang, L.; Zhu, L.; Ni, G. Canopy transpiration and its cooling effect of three urban tree species in a subtropical city-Guangzhou, China. Urban For. Urban Green. 2019, 43, 126368. [Google Scholar] [CrossRef]
  46. Zou, Z.; Yan, C.; Yu, L.; Jiang, X.; Ding, J.; Qin, L.; Qiu, G. Impacts of land use/land cover types on interactions between urban heat island effects and heat waves. Build. Environ. 2021, 204, 108138. [Google Scholar] [CrossRef]
  47. Zhang, Z.; Jiang, D.; Xu, Y.; Xiao, J.; Wang, J.; He, F.; Pan, H. Arrangement of landscape plants in parks of Shenzhen. J. Northeast. For. Univ. 2011, 39, 102–105. [Google Scholar]
  48. Qiu, G.; Tan, S.; Wang, Y.; Yu, X.; Yan, C. Characteristics of evapotranspiration of urban lawns in a sub-tropical megacity and its measurement by the ‘Three Temperature Model+ Infrared Remote Sensing’method. Remote Sens. 2017, 9, 502. [Google Scholar] [CrossRef] [Green Version]
  49. Hao, G.Y.; Sack, L.; Wang, A.Y.; Cao, K.F.; Goldstein, G. Differentiation of leaf water flux and drought tolerance traits in hemiepiphytic and non-hemiepiphytic Ficus tree species. Funct. Ecol. 2010, 24, 731–740. [Google Scholar] [CrossRef]
  50. Granier, A. Evaluation of transpiration in a Douglas-fir stand by means of sap flow measurements. Tree Physiol. 1987, 3, 309–320. [Google Scholar] [CrossRef]
  51. Lundblad, M.; Lagergren, F.; Lindroth, A. Evaluation of heat balance and heat dissipation methods for sapflow measurements in pine and spruce. Ann. For. Sci. 2001, 58, 625–638. [Google Scholar] [CrossRef] [Green Version]
  52. Delzon, S.; Sartore, M.; Granier, A.; Loustau, D. Radial profiles of sap flow with increasing tree size in maritime pine. Tree Physiol. 2004, 24, 1285–1293. [Google Scholar] [CrossRef] [Green Version]
  53. Lu, P.; Urban, L.; Zhao, P. Granier’s thermal dissipation probe (TDP) method for measuring sap flow in trees: Theory and practice. Acta Bot. Sin. 2004, 46, 631–646. [Google Scholar]
  54. Oishi, A.C.; Hawthorne, D.A.; Oren, R. Baseliner: An open-source, interactive tool for processing sap flux data from thermal dissipation probes. SoftwareX 2016, 5, 139–143. [Google Scholar] [CrossRef] [Green Version]
  55. Jarvis, P.G.; McNaughton, K.G. Stomatal control of transpiration: Scaling up from leaf to region. Adv. Ecol. Res. 1986, 15, 1–49. [Google Scholar]
  56. Whitehead, D. Regulation of stomatal conductance and transpiration in forest canopies. Tree Physiol. 1998, 18, 633–644. [Google Scholar] [CrossRef]
  57. Tetens, O. Uber einige meteorologische Begriffe. Z. Geophys. 1930, 6, 297–309. [Google Scholar]
  58. Wang, H.; Zhao, P.; Hölscher, D.; Wang, Q.; Lu, P.; Cai, X.A.; Zeng, X.P. Nighttime sap flow of Acacia mangium and its implications for nighttime transpiration and stem water storage. J. Plant Ecol. 2012, 5, 294–304. [Google Scholar] [CrossRef] [Green Version]
  59. Chu, X.; Han, G.; Xing, Q.; Xia, J.; Sun, B.; Yu, J.; Li, D. Dual effect of precipitation redistribution on net ecosystem CO2 exchange of a coastal wetland in the Yellow River Delta. Agric. For. Meteorol. 2018, 249, 286–296. [Google Scholar] [CrossRef]
  60. Van Gorsel, E.; Harman, I.N.; Finnigan, J.J.; Leuning, R. Decoupling of air flow above and in plant canopies and gravity waves affect micrometeorological estimates of net scalar exchange. Agric. For. Meteorol. 2011, 151, 927–933. [Google Scholar] [CrossRef]
  61. Falge, E.; Baldocchi, D.; Olson, R.; Anthoni, P.; Aubinet, M.; Bernhofer, C.; Burba, G.; Ceulemans, R.; Clement, R.; Dolman, H. Gap filling strategies for long term energy flux data sets. Agric. For. Meteorol. 2001, 107, 71–77. [Google Scholar] [CrossRef] [Green Version]
  62. Tang, Y.; Wen, X.; Sun, X.; Zhang, X.; Wang, H. The limiting effect of deep soil water on evapotranspiration of a subtropical coniferous plantation subjected to seasonal drought. Adv. Atmos. Sci. 2014, 31, 385–395. [Google Scholar] [CrossRef]
  63. Jeon, J. The strengths and limitations of the statistical modeling of complex social phenomenon: Focusing on SEM, path analysis, or multiple regression models. Int. J. Econ. Manag. Eng. 2015, 9, 1634–1642. [Google Scholar]
  64. Jia, X.; Zha, T.S.; Gong, J.N.; Wu, B.; Zhang, Y.Q.; Qin, S.G.; Peltola, H. Energy partitioning over a semi-arid shrubland in northern China. Hydrol. Processes 2016, 30, 972–985. [Google Scholar] [CrossRef]
  65. Scholz, F.G.; Bucci, S.J.; Goldstein, G.; Meinzer, F.C.; Franco, A.C.; Miralles-Wilhelm, F. Removal of nutrient limitations by long-term fertilization decreases nocturnal water loss in savanna trees. Tree Physiol. 2007, 27, 551–559. [Google Scholar] [CrossRef] [Green Version]
  66. Novick, K.A.; Oren, R.; Stoy, P.C.; Siqueira, M.B.S.; Katul, G.G. Nocturnal evapotranspiration in eddy-covariance records from three co-located ecosystems in the Southeastern US: Implications for annual fluxes. Agric. For. Meteorol. 2009, 149, 1491–1504. [Google Scholar] [CrossRef] [Green Version]
  67. Guo, X.; Shang, G.; Tian, Y.; Jia, X.; Zha, T.; Li, C.; Zhang, X. Dynamics of Nocturnal Evapotranspiration and Its Biophysical Controls over a Desert Shrubland of Northwest China. Forests 2021, 12, 1296. [Google Scholar] [CrossRef]
  68. Yan, C.; Guo, Q.; Li, H.; Li, L.; Qiu, G.Y. Quantifying the cooling effect of urban vegetation by mobile traverse method: A local-scale urban heat island study in a subtropical megacity. Build. Environ. 2020, 169, 106541. [Google Scholar] [CrossRef]
  69. Montaldo, N.; Oren, R. The way the wind blows matters to ecosystem water use efficiency. Agric. For. Meteorol. 2016, 217, 1–9. [Google Scholar] [CrossRef] [Green Version]
  70. Zhao, C.Y.; Si, J.H.; Feng, Q.; Yu, T.F.; Du Li, P. Comparative study of daytime and nighttime sap flow of Populus euphratica. Plant Growth Regul. 2017, 82, 353. [Google Scholar] [CrossRef]
  71. Baldocchi, D.D.; Xu, L.; Kiang, N. How plant functional-type, weather, seasonal drought, and soil physical properties alter water and energy fluxes of an oak–grass savanna and an annual grassland. Agric. For. Meteorol. 2004, 123, 13–39. [Google Scholar] [CrossRef] [Green Version]
  72. Wang, Q.; Gao, J.; Zhao, P.; Zhu, L.; Ouyang, L.; Ni, G.; Zhao, X. Biotic-and abiotic-driven variations of the night-time sap flux of three co-occurring tree species in a low subtropical secondary broadleaf forest. AoB Plants 2018, 10, ply025. [Google Scholar] [CrossRef] [Green Version]
  73. Zhao, W.; Liu, B. The response of sap flow in shrubs to rainfall pulses in the desert region of China. Agric. For. Meteorol. 2010, 150, 1297–1306. [Google Scholar] [CrossRef]
  74. Zhu, L.W.; Zhao, P. Temporal variation in sap-flux-scaled transpiration and cooling effect of a subtropical Schima superba plantation in the urban area of Guangzhou. J. Integr. Agric. 2013, 12, 1350–1356. [Google Scholar] [CrossRef]
  75. Zha, T.; Barr, A.G.; van der Kamp, G.; Black, T.A.; McCaughey, J.H.; Flanagan, L.B. Interannual variation of evapotranspiration from forest and grassland ecosystems in western Canada in relation to drought. Agric. For. Meteorol. 2010, 150, 1476–1484. [Google Scholar] [CrossRef]
  76. Alvarado-Barrientos, M.S.; Asbjornsen, H.; Holwerda, F. Is nighttime transpiration enhanced after fog events? Acta. Hort. 2013, 991, 133–139. [Google Scholar] [CrossRef]
  77. Bucci, S.J.; Goldstein, G.; Meinzer, F.C.; Franco, A.C.; Campanello, P.; Scholz, F.G. Mechanisms contributing to seasonal homeostasis of minimum leaf water potential and predawn disequilibrium between soil and plant water potential in Neotropical savanna trees. Trees 2005, 19, 296–304. [Google Scholar] [CrossRef]
  78. Cavender-Bares, J.; Sack, L.; Savage, J. Atmospheric and soil drought reduce nocturnal conductance in live oaks. Tree Physiol. 2007, 27, 611–620. [Google Scholar] [CrossRef] [Green Version]
  79. Zeppel, M.; Tissue, D.; Taylor, D.; Macinnis-Ng, C.; Eamus, D. Rates of nocturnal transpiration in two evergreen temperate woodland species with differing water-use strategies. Tree Physiol. 2010, 30, 988–1000. [Google Scholar] [CrossRef] [Green Version]
  80. Barbeta, A.; Ogaya, R.; Peñuelas, J. Comparative study of diurnal and nocturnal sap flow of Quercus ilex and Phillyrea latifolia in a Mediterranean holm oak forest in Prades (Catalonia, NE Spain). Trees 2012, 26, 1651–1659. [Google Scholar] [CrossRef]
  81. Pfautsch, S.; Keitel, C.; Turnbull, T.L.; Braimbridge, M.J.; Wright, T.E.; Simpson, R.R.; Adams, M.A. Diurnal patterns of water use in Eucalyptus victrix indicate pronounced desiccation–rehydration cycles despite unlimited water supply. Tree Physiol. 2011, 31, 1041–1051. [Google Scholar] [CrossRef] [Green Version]
  82. Kavanagh, K.L.; Pangle, R.; Schotzko, A.D. Nocturnal transpiration causing disequilibrium between soil and stem predawn water potential in mixed conifer forests of Idaho. Tree Physiol. 2007, 27, 621–629. [Google Scholar] [CrossRef]
  83. Yoshifuji, N.; Kumagai, T.O.; Tanaka, K.; Tanaka, N.; Komatsu, H.; Suzuki, M.; Tantasirin, C. Inter-annual variation in growing season length of a tropical seasonal forest in northern Thailand. For. Ecol. Manag. 2006, 229, 333–339. [Google Scholar] [CrossRef]
  84. Liu, H.; Park Williams, A.; Allen, C.D.; Guo, D.; Wu, X.; Anenkhonov, O.A.; Badmaeva, N.K. Rapid warming accelerates tree growth decline in semi-arid forests of Inner Asia. Glob. Change Biol. 2013, 19, 2500–2510. [Google Scholar] [CrossRef]
  85. Wu, X.; Liu, H.; Li, X.; Liang, E.; Beck, P.S.; Huang, Y. Seasonal divergence in the interannual responses of Northern Hemisphere vegetation activity to variations in diurnal climate. Sci. Rep. 2016, 6, 19000. [Google Scholar] [CrossRef] [Green Version]
  86. Ma, J.; Zha, T.; Jia, X.; Tian, Y.; Bourque, C.P.A.; Liu, P.; Chen, W. Energy and water vapor exchange over a young plantation in northern China. Agric. For. Meteorol. 2018, 263, 334–345. [Google Scholar] [CrossRef]
  87. Xie, J.; Zha, T.; Zhou, C.; Jia, X.; Yu, H.; Yang, B.; Peltola, H. Seasonal variation in ecosystem water use efficiency in an urban-forest reserve affected by periodic drought. Agric. For. Meteorol. 2016, 221, 142–151. [Google Scholar] [CrossRef]
  88. Wang, H.; Tetzlaff, D.; Dick, J.J.; Soulsby, C. Assessing the environmental controls on Scots pine transpiration and the implications for water partitioning in a boreal headwater catchment. Agric. For. Meteorol. 2017, 240, 58–66. [Google Scholar] [CrossRef] [Green Version]
  89. Meinzer, F.C.; James, S.A.; Goldstein, G. Dynamics of transpiration, sap flow and use of stored water in tropical forest canopy trees. Tree Physiol. 2004, 24, 901–909. [Google Scholar] [CrossRef] [Green Version]
  90. Verbeeck, H.; Steppe, K.; Nadezhdina, N.; de Beeck, M.O.; Deckmyn, G.; Meiresonne, L.; Janssens, I.A. Stored water use and transpiration in Scots pine: A modeling analysis with ANAFORE. Tree Physiol. 2007, 27, 1671–1685. [Google Scholar] [CrossRef] [Green Version]
  91. Wang, H.; Tetzlaff, D.; Soulsby, C. Hysteretic response of sap flow in Scots pine (Pinus sylvestris) to meteorological forcing in a humid low-energy headwater catchment. Ecohydrology 2019, 12, e2125. [Google Scholar] [CrossRef]
  92. Ewers, B.E.; Oren, R.; Phillips, N.; Strömgren, M.; Linder, S. Mean canopy stomatal conductance responses to water and nutrient availabilities in Picea abies and Pinus taeda. Tree Physiol. 2001, 21, 841–850. [Google Scholar] [CrossRef] [PubMed]
Figure 1. Temporal variations in nighttime mean (a) air temperature (Ta), vapor pressure deficit (VPD), (b) relative humidity (RH), (c) wind speed (Ws), (d) soil moisture content (SMC), total nighttime precipitation (P), (e) canopy conductance (as indicated by T/VPD), (f), nighttime (20:00–05:00), and daytime (06:00–19:00) sap flow rates (Qn and Qd, respectively), and (g) fraction of nighttime to total 24-h sap flow (Qn/Q24-h × 100) during the growing seasons (1 May–31 October) of 2014–2020. The values of SMC are the means of measurements at different depths of 10, 30, 40, and 50 cm over the study site. Note: the data from 1 May to 14 July are missing for 2014.
Forests 13 01059 g001
Figure 2. The nocturnal patterns of hourly means of (a) sap flow rate (Qn) and micro-hydrometeorological parameters, including (b) air temperature (Ta), (c) vapor pressure deficit (VPD), (d) relative humidity (RH), (e) wind speed (Ws), and (f) canopy conductance (as indicated by T/VPD) over the growing seasons of 2014–2020. At a specific time (i.e., 20:00–05:00), each data point shows the mean value for each month, and bars represent the standard error across the 2014–2020 observation period.
Forests 13 01059 g002
Figure 3. Relationship between nocturnal means of sap flow (Qn) vs. site micro-hydrometeorological parameters, i.e., (a) air temperature (Ta), (b) vapor pressure deficit (VPD), (c) relative humidity (RH), (d) wind speed (Ws), (e) canopy conductance (T/VPD), and (f) soil moisture content (SMC) during the growing seasons of 2014–2020. Data points represent the binned averages of pooled data from 1 May to 31 October for seven years at every 0.5 °C, 0.05 kPa, 1.5%, 0.03 m s−1, 0.008 mm h−1 kPa−1, and 1% intervals of Ta, VPD, RH, Ws, T/VPD, and SMC, respectively. Bars denote standard error.
Forests 13 01059 g003
Figure 4. Seasonal courses of nighttime mean (a) sap flow rate (Qn), (b) air temperature (Ta), (c) vapor pressure deficit (VPD), (d) relative humidity (RH), (e) canopy conductance (T/VPD), (f) total nighttime precipitation (P), (g) soil moisture content (SMC), and (h) proportion of nighttime sap flow to total 24-h sap flow (Qn/Q24-h × 100) at each of three growing periods (i.e., fast growth, middle growth, and terminal growth) over 2014–2020. The data bars are the annual mean values for all parameters, except for the annual total for P at each growing stage. Note: (n = 6 for fast growth period, and n = 7 for middle and terminal growth periods).
Forests 13 01059 g004
Figure 5. Mean nighttime sap flow (Qn) at each of the three growing stages (i.e., fast growth, May; middle growth, June–August; and terminal growth, September–October) over 2014–2020 as a function of corresponding selected main explanatory micro-hydrometeorological parameters, including (a) air temperature (Ta), (b) vapor pressure deficit (VPD), (c) relative humidity (RH), (d) canopy conductance (T/VPD), (e) total nighttime precipitation (P), and (f) soil moisture content (SMC). The data points are the annual mean, with the exception of the annual total for P at each growing period, and the given solid lines are statistically significant (p < 0.05). Note: (n = 6 for fast growth period, and n = 7 for middle and terminal growth periods).
Forests 13 01059 g005
Figure 6. Interannual courses in nighttime growing season annual means of (a) sap flow rate (Qn), (b) air temperature (Ta), (c) vapor pressure deficit (VPD), (d) relative humidity (RH), (e) wind speed (Ws), (f) canopy conductance (T/VPD), (g) soil moisture content (SMC), (h) total nighttime precipitation (P), and (i) ratio of nighttime sap flow to total 24-h sap flow (Qn/Q24-h × 100) during 2014–2020. Error bars are given for annual mean of all the selected variables except total precipitation.
Forests 13 01059 g006
Figure 7. Interannual response of growing season nighttime mean sap flow (Qn) to site micro-hydrometeorological parameters, i.e., (a) air temperature (Ta), (b) vapor pressure deficit (VPD), (c) relative humidity (RH), (d) wind speed (Ws), (e) canopy conductance (T/VPD), (f) soil moisture content (SMC), and (g) total nighttime precipitation (P) over 2014–2020. Data points indicate growing season annual nighttime means for all parameters but annual total for P.
Forests 13 01059 g007
Figure 8. Direct and indirect effects of nighttime micro-hydrometeorological parameters, including air temperature (Ta), vapor pressure deficit (VPD), wind speed (Ws), canopy conductance (T/VPD), soil moisture content (SMC), and total nighttime precipitation (P) on interannual variation in nighttime sap flow (Qn). Standardized path coefficients (i.e., −1 to 1) are given for each arrow, where negative and positive effects are indicated by negative and positive values, respectively. Asterisks one, two and three (i.e., “*”, “**” and “***”) stand for significance levels < 0.05, 0.01 and 0.001, respectively. Data used were the growing season annual nighttime means for all parameters, but annual total for P from 2014–2020.
Forests 13 01059 g008
Table 1. Seasonal and interannual variation in nighttime micro-hydrometeorological parameters, sap flow (Qn) and the ratio of nighttime to 24-h sap flow aggregation (Qn/Q24-h × 100) over the growing season (1 May–31 October) of the 2014–2020 observation period. In the table, “CV” and “NA” stand for coefficient of variation and not available, respectively.
VariablesYearMayJunJulAugSepOctAverage or SumCV
Ta
(°C)
2014NANA27.0426.5925.2122.0825.238.87
201525.6427.6326.9626.2025.4522.2125.687.34
201625.5527.5727.8627.5526.6724.2226.575.37
201723.8926.8426.2027.0825.8822.8025.456.75
201827.1227.2227.7127.1826.2022.5126.327.33
201925.5927.4727.4026.9124.6422.6425.787.35
202024.2526.1827.0024.8524.5721.5624.737.57
Mean25.3427.1527.1726.6225.5222.5725.68
VPD
(kPa)
2014NANA0.600.570.420.470.5216.13
20150.430.620.540.370.330.260.4231.11
20160.500.580.520.440.480.530.519.57
20170.470.800.360.490.300.500.4935.36
20180.410.730.400.320.280.320.4139.14
20190.490.580.460.420.310.350.4321.84
20200.460.630.810.410.360.620.5530.53
Mean0.460.660.530.430.360.440.48
RH
(%)
2014NANA83.8384.6487.2281.8584.392.63
201584.2182.3583.7988.4088.2187.9085.813.10
201684.7285.3086.8089.6587.1283.8986.252.40
201784.93 78.5287.0389.9991.1082.74 85.725.47
201882.7384.2387.1189.8488.2683.4885.943.34
201985.0381.8984.3985.8186.8983.9984.672.02
202085.6484.5680.7789.7590.5980.9385.374.91
Mean84.5482.8185.2487.8888.4483.5885.45
Ws
(m s−1)
2014NANA0.240.140.200.070.1645.51
20150.250.180.220.150.160.180.1919.28
20160.170.260.200.170.240.220.2117.38
20170.170.290.160.19 0.170.230.2023.89
20180.290.150.130.120.110.090.1548.24
20190.210.190.150.190.150.160.1812.72
20200.240.230.270.200.220.270.2411.57
Mean0.2260.2210.2000.1700.1840.1800.194
P
(mm)
2014NANA50.70125.6072.0033.30281.6014.22
201548.0052.1090.5083.6032.906.80313.90 9.97
2016105.00104.6044.10175.0016.5034.20479.40 12.40
201760.0097.90103.1016.50 29.4031.00 337.90 10.97
201819.78100.2139.51184.1572.8214.10430.57 14.87
201979.6051.2069.40101.2037.6033.80372.80 7.00
202029.9857.0014.4097.4044.808.80252.38 12.91
Mean57.0677.1658.81111.9243.7123.14352.65
SMC
(%)
2014NANA33.2939.0238.3331.2435.47 10.71
201527.6932.1331.6240.5343.5740.1035.94 17.49
201639.2343.0245.3049.7839.2732.0241.44 14.69
201740.56 42.8647.5633.54 32.1825.12 36.97 22.13
201828.2434.1549.7249.0444.5739.5640.88 20.90
201932.6935.1642.1345.9840.5230.5037.8315.83
202029.9040.9133.7837.3633.8827.3733.87 14.45
Mean33.0538.0440.4942.1838.9032.2737.48
T/VPD (mm d−1 kPa−1)2014NANA0.290.310.350.320.327.03
20150.240.190.360.620.570.670.44 45.85
20160.380.470.540.820.550.400.5330.16
20170.31 0.210.600.330.510.27 0.3740.61
20180.140.440.971.440.970.440.73 64.74
20190.580.470.680.810.900.580.67 23.59
20200.290.360.190.390.390.190.30 30.02
Mean0.320.350.520.670.610.410.48
Qn
(kg d−1)
2014NANA3.473.152.782.693.0211.87
20151.742.593.794.373.943.163.27 29.75
20165.366.087.098.166.134.996.30 18.44
20173.59 4.31 5.27 4.074.112.99 4.05 18.76
20182.415.766.887.625.603.075.22 39.65
20194.655.766.786.876.834.915.97 16.93
20201.954.623.043.492.741.402.87 40.56
Mean3.284.855.195.394.593.324.39
Qn/Q24-h
(%)
2014NANA7.076.646.426.606.684.14
20155.396.327.998.407.017.207.05 15.54
20169.1311.0312.9614.0412.2510.9511.73 14.76
20178.58 8.888.577.358.918.328.43 6.79
20186.4011.0712.4113.3411.366.9610.26 28.16
20198.9910.9312.7211.6412.0512.0511.40 11.55
20205.097.967.998.806.313.096.54 32.95
Mean7.269.369.9610.039.197.888.87
Publisher’s Note: MDPI stays neutral with regard to jurisdictional claims in published maps and institutional affiliations.

