Abstract
Studying the early changes in post-fire vegetation communities may improve the overall resilience of forests. The necessity for doing so was demonstrated by the Bobcat Fire, which seriously threatened the central San Gabriel Mountains and the Angeles National Forest in California. This study aimed to monitor and quantify the effects of climatological and topographic conditions along with burn severity on early (within 1 year) post-fire forests and shrubs community regeneration. In this study, we used Sentinel-2(MSI) intensive time-series imagery (July 2020–October 2021) to make a confusion matrix combined with 389 vegetation sample points on Google Earth Pro. The overall accuracy (OA) and the Kappa coefficient, calculated from the confusion matrix, were used as evaluation parameters to validate the classification results. With multiple linear regression models and Environmental Systems Research Institute (ESRI) historical images, we analyzed the effects of climate and slope aspects on the regeneration of post-fire forest and shrub communities. We also quantitatively analyzed the regeneration rates based on five burn severity types. The results show that the normalized burning rate (NBR) was the most accurate vegetation classification indicator in this study (OA: 92.3–99.5%, Kappa: 0.88–0.98). The vegetation classification accuracy based on SVM is about 6.6% higher than K-Means. The overall accuracy of the burn area is 94.87%. Post-fire climate factors had a significant impact on the regeneration of the two vegetation communities (R2: 0.42–0.88); the optimal regeneration slope was 15–35°; and the fire severity changed the original competition relationship and regeneration rate. The results provide four main insights into the regeneration of post-fire vegetation communities: (1) climate factors in the first regenerating season have important impacts on the regeneration of forest and shrub communities; (2) daytime duration and rainfall are the most significant factors for forests and shrubs regeneration; (3) tolerable low burn severity promotes forests regeneration; and (4) forests have a certain ability to resist fires, while shrubs can better tolerate high-intensity fire ecology. This study could support the implementation of strategies for regionalized forest management and the targeted enhancement of post-fire vegetation community resilience.
1. Introduction
Wildfires in the U.S. have roughly tripled in size over the past 40 years, with “wildfire season” emerging as a growing threat in California [1,2]. The frequent occurrence of fires has prompted adaptive changes in vegetation communities in forest systems to cope with ecological reconstruction [3,4,5]. Nevertheless, the regeneration of post-fire vegetation communities still depends on many external factors, such as short-term and long-term changes in the climate and environment in the fire area, the topography and geomorphological composition of the burned area, burn severity, and species competition in the post-fire vegetation community [6,7,8,9].
The Earth’s average surface air temperature has risen by 0.07 °C (0.13 °F) per decade since 1880, and the rate of temperature change over time has more than doubled to 0.18 °C (0.32 °F) since 1981 [10]. According to the State of the Global Climate 2020 report, 2011–2020 was the warmest decade on record, and 2020 was one of the three warmest years ever recorded [11]. Global warming has emerged as the most prominent risk of our time. Zhuang et al. (2021) found that atmospheric changes can explain up to one-third of the climate trends favoring wildfires, while global warming contributes to at least two-thirds [12]. This also seems to explain why 2020 was the worst wildfire season in California’s modern history [13].
Climate factors may alter the regeneration of post-fire vegetation communities. Applestein et al. (2021) evaluated a dataset from the Soda Fire area on the Idaho/Oregon border and found that sagebrush density increased with increasing temperature and rainfall. The annual sagebrush area increase was associated with increased spring rainfall in the year following the fire, but not with fall rainfall in that same year [14]. This suggests that the climate in the first growing season experienced by vegetation may be very important for the post-fire regeneration of vegetation communities [15]. Examining satellite imagery of burning subtropical savannas in different seasons, Danielle et al. (2020) found that post-fire vegetation took less time to recover during wet growing seasons than during dry dormant seasons [16]. However, hot and dry climates were negatively correlated with the recent post-fire seedling abundance [17]. In addition, a dry climate means a longer regeneration time for forests, and the resulting long-term damage could lead to increased permanent carbon loss in these fragile ecosystems [18,19,20].
Wildfires directly change the original form and composition of forest ecosystems, and different burn severities have different gradient effects on the regeneration of vegetation communities [21,22,23]. Furthermore, wildfires provide a new scenario for species competition. Repeated high-intensity wildfires in the forests of the Klamath Mountains in Northern California catalyzed the invasion of non-native plant species. These invasive species increase fire frequency and compete with native vegetation for early moisture, possibly accelerating the loss of previously dominant species in the region [24,25].
Due to its wide coverage, instantaneous imaging, and dynamic monitoring, remote sensing technology has been used as an efficient method to capture wildfires when they occur and to monitor the environment and post-fire vegetation regeneration [26,27,28,29,30]. Sentinel-2(MSI), provided by the European Space Agency, is a high-resolution multispectral imaging satellite, and its unique three red-edge band data (B5, B6, B7) cover the 703–783 nm band, making it is very effective for monitoring vegetation growth [31,32,33]. In addition, the revisit period of the A and B satellites is shortened to 5 days, which is very suitable for capturing a time-series observation of post-fire vegetation regeneration [34,35].
Most previous research has focused on using remote sensing data to estimate burn severity and map wildfire burn areas [36,37]; to measure the impact of burn severity and climate factors on post-disaster vegetation communities [38,39,40,41]; or to conduct long-term, large-span observations of vegetation categories of interest [42,43,44,45]. However, few studies have conducted short-term intensive time-series change observations on the integration of multiple environmental factors in post-fire vegetation communities.
This paper verifies the regeneration trend of post-fire forest and shrub communities in the short-term (367 days) period using two topographic factors, three climate factors, and five burn severities. The research includes: (1) the classification of vegetation communities and the division of burn severity; (2) the use of 13 monthly Sentinel-2(MSI) image data to track and analyze changes in vegetation communities and burn severity; (3) the use of a multiple linear regression model to analyze the effects of temperature, rainfall, and daytime on the regeneration of vegetation communities; (4) the use of slope and aspect data, combined with 0.5 m resolution historical images from ESRI World Imagery Wayback, to analyze the impact of sunny slopes and shady slopes on the regeneration of two vegetation communities; and (5) the quantification of the regeneration of forest and shrub communities under different burn severities.
2. Materials
2.1. Study Area
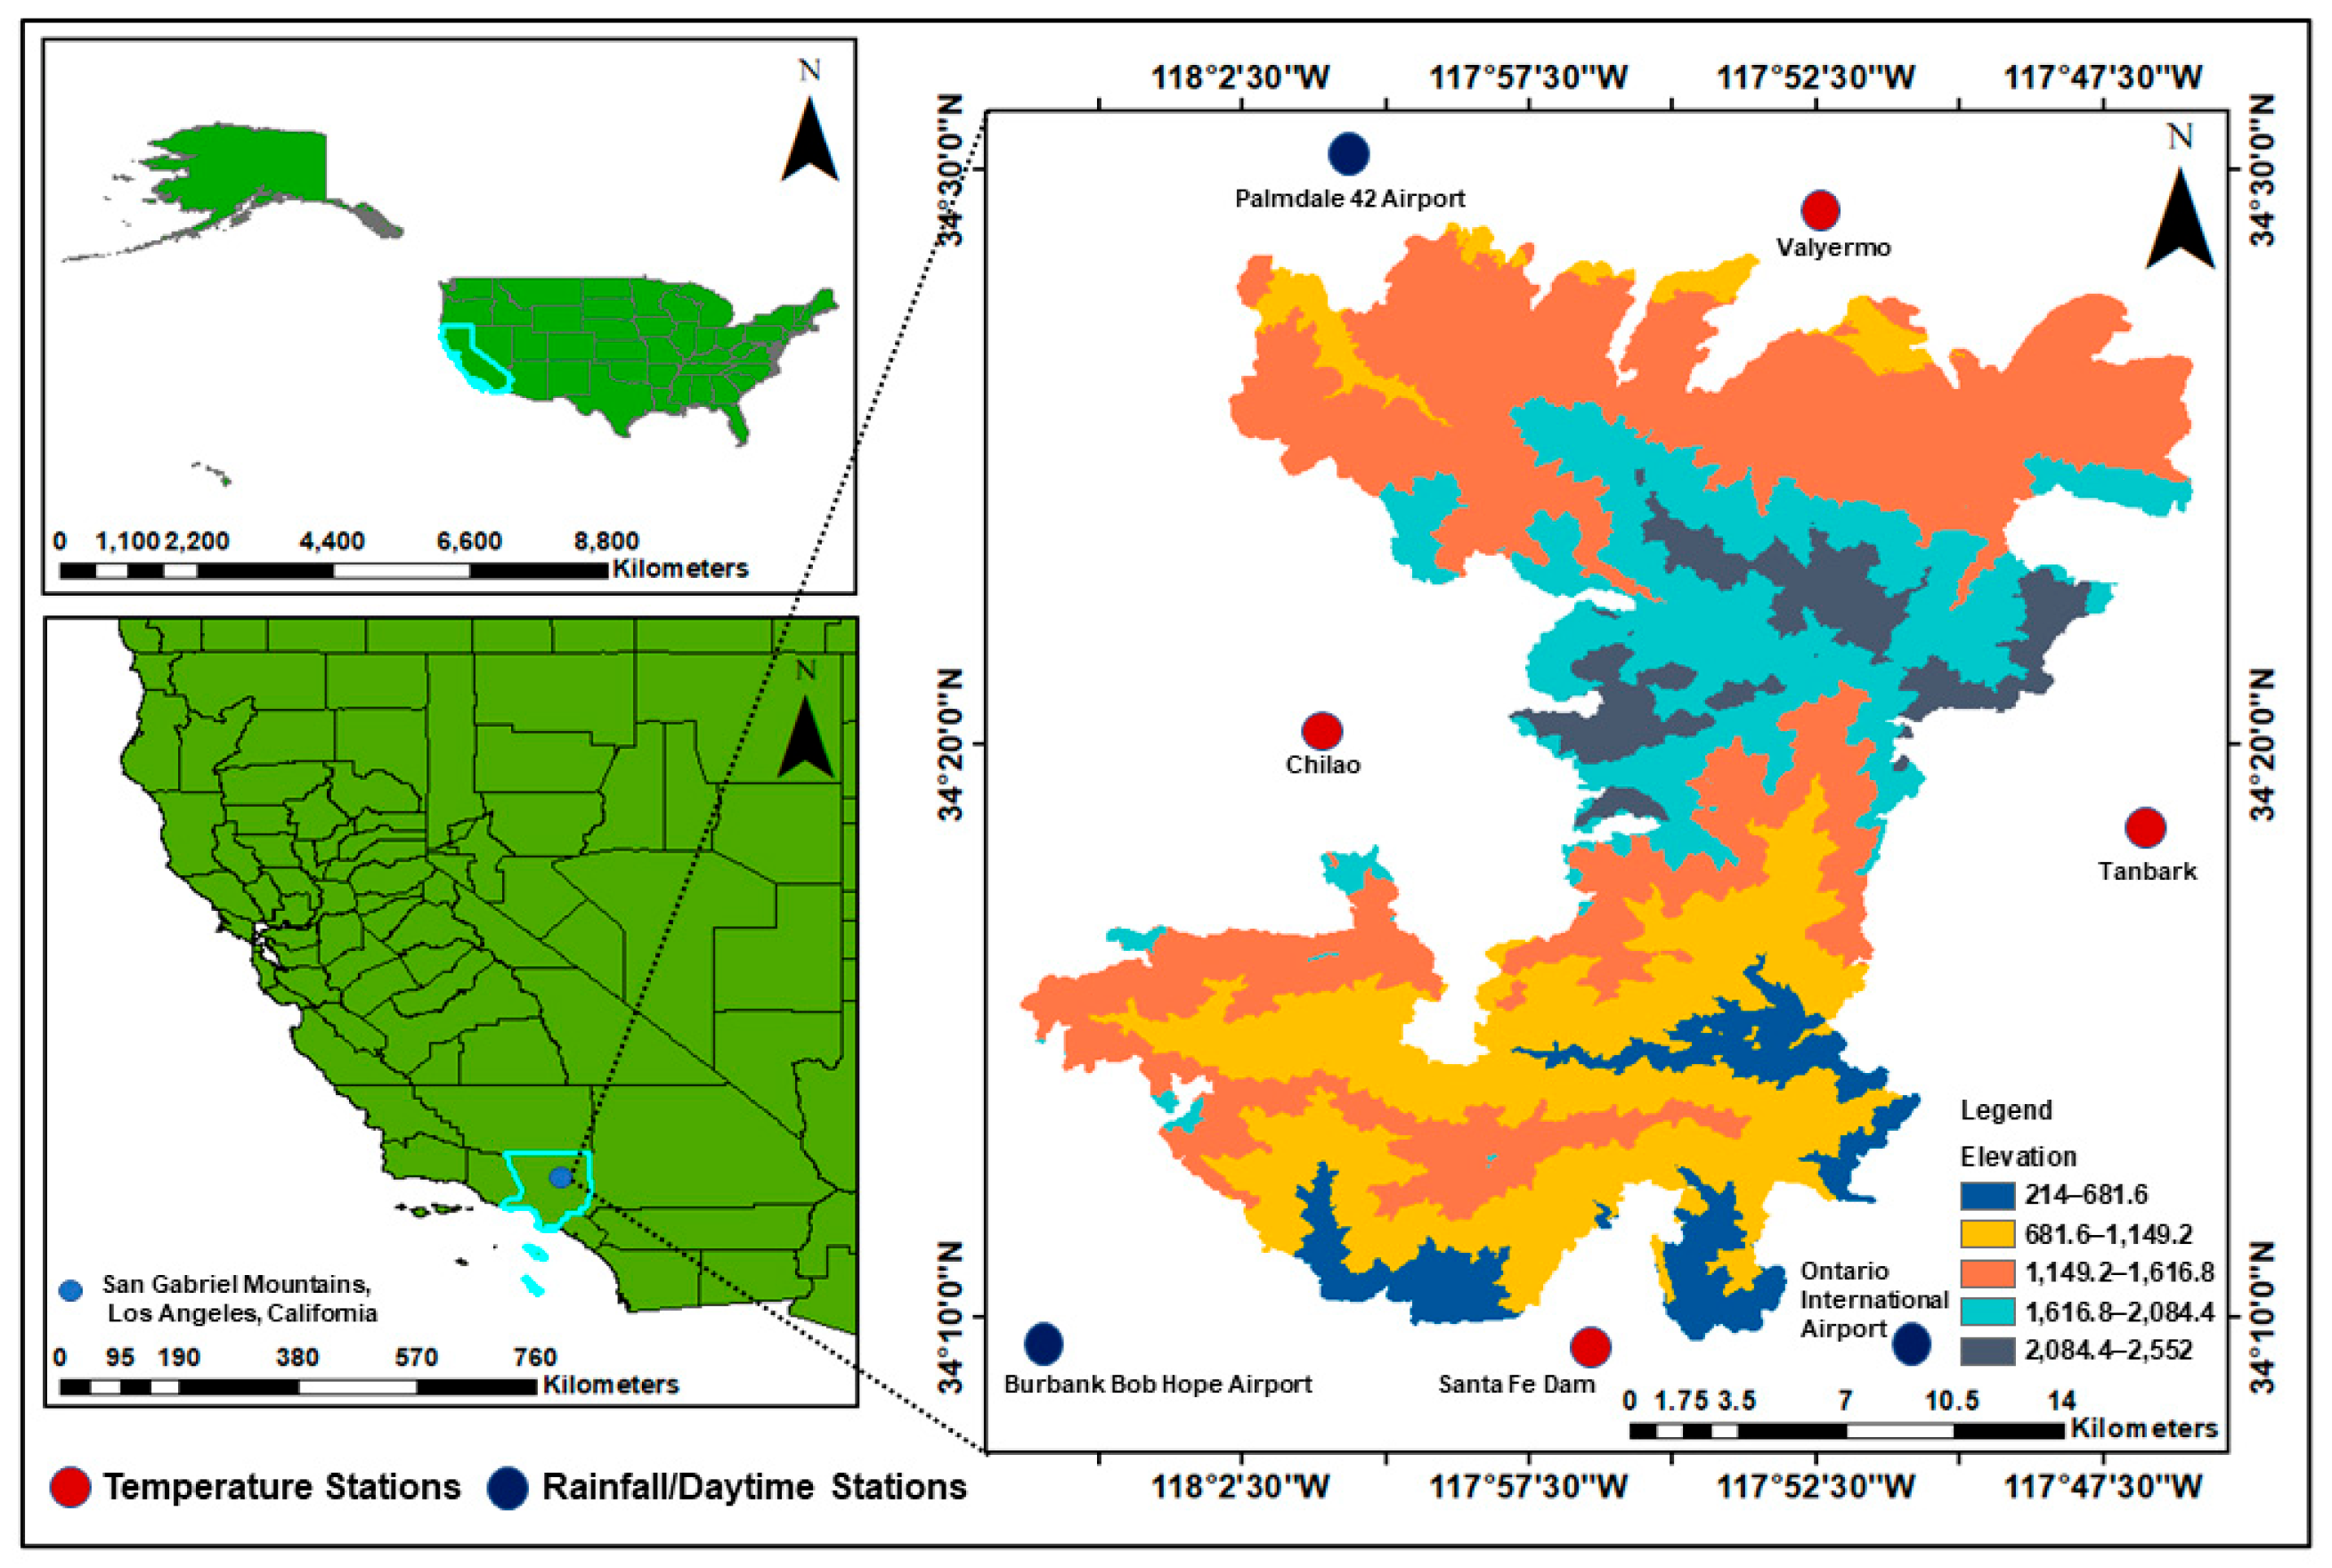
The study area encompassed the extent of two elevation tiles derived from 30 m spatial resolution DEM (digital elevation model), covering the central portion of the San Gabriel Mountains range with an area of approximately 518.05 km2 (117°45′0″ W–118°6′30″ W, 34°9′30″ N–34°26′0″ N) (Figure 1) and an altitude range of 215–2552 m. The terrain in this area is steep and it contains a large number of peaks and canyons that are very rugged and difficult to traverse. As post-fire meteorological data of the study area acquired from the National Oceanic and Atmospheric Administration (NOAA) only included temperature data, rainfall, and daytime data of three airports climate stations nearby were added. According to the climate data of seven weather stations near the study area, the climate of this region is the Mediterranean, with mostly dry summers and wet winters. The annual precipitation range is 1.3–72.7 mm and the annual temperature ranges from 10.4 °C to 26.74 °C. The rainfall is mostly concentrated in spring, with an average rainfall of 68.23 mm from January to March. Shrubs are widespread in low-altitude areas without continuous tall forest cover; coniferous and oak forests are densely distributed above high altitudes (1500 m). The study area maintains a highly primitive state, which is suitable for exploring the spatiotemporal relationship between vegetation regeneration, burn severity, and climate and terrain factors.
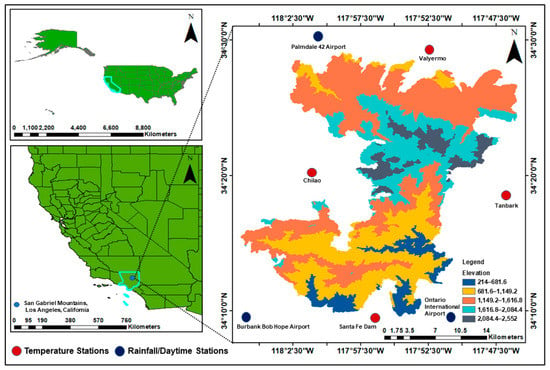
Figure 1.
The geographical location of the study area.
2.2. Sentinel-2(MSI) Image Data
The Bobcat Fire began in September 2020 and ended on December 18. During this period, it burned approximately 46,861 hectares in the central San Gabriel Mountains, Angeles National Forest, and surrounding areas. This paper uses 13 scenes (52 in total) of time-series Sentinel-2(MSI) images obtained from the USGS (https://glovis.usgs.gov/, accessed on 10 December 2021) from July 2020 to October 2021 covering the study area as a primary dataset to characterize post-fire vegetation regeneration (Table 1). The spatial resolution is 10–60 m, and the replay period during the operation of the twin satellites is 5 days. Meanwhile, in the optical data, Sentinel-2(MSI) is equipped with a multispectral imager (MSI), consisting of two satellites, S2A and S2B. Its band range can cover a total of 13 bands from visible light to near-infrared (442–2202 nm), and it is the only one that contains three bands in the red-edge range, which is very effective for monitoring vegetation information. Therefore, it has the spatial and temporal features needed to capture the time-series changes and trends in post-fire vegetation regeneration [46,47]. In addition, the study area was screened in terms of cloud cover, image quality, and imaging time. Images with cloud cover of less than 9.4%, with relatively high quality, and an intake time close to the middle of the month were selected to improve the quality and comparability of the data. Finally, a research area of interest was established based on the 52 acquired images of the research area.

Table 1.
The time-series Sentinel-2 image data used in this study.
2.3. Climate and Topographic Data
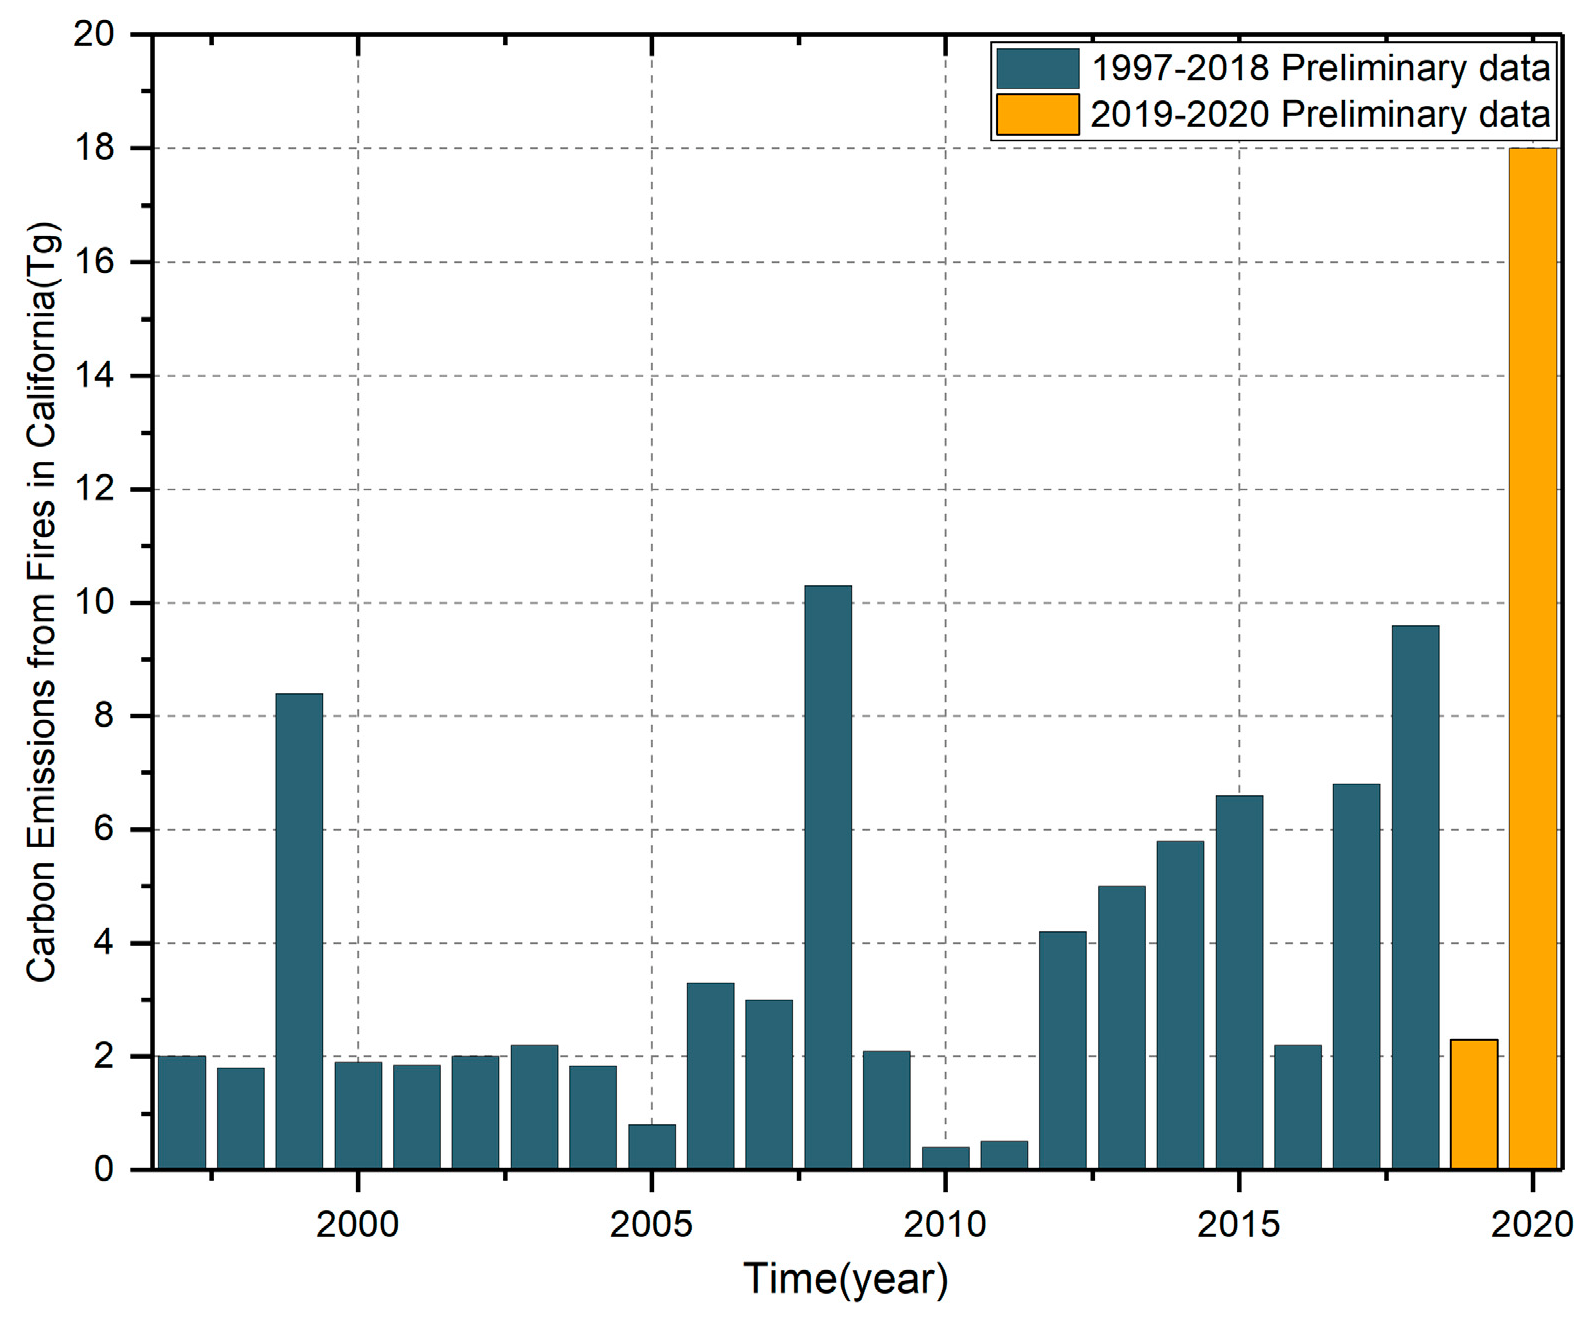
The 2020 California wildfire season was a record year for wildfires, with nearly 10,000 fire incidents burning more than 4.2 million acres. Wildfires are usually concentrated in August and September, mainly due to the dry and hot climate. Excessive carbon emissions from fires could lead to prolonged droughts and increased temperatures (Figure 2) [48].
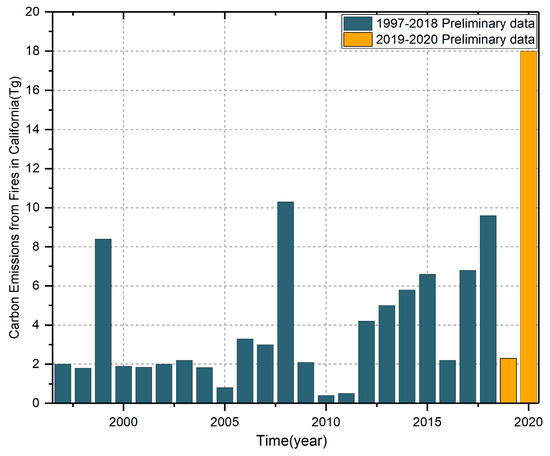
Figure 2.
California wildfire carbon emissions from 1997 to 2020 (from NASA Earth).
Meteorological data for post-fire 12 months on temperature, rainfall, and daytime duration were acquired from the National Oceanic and Atmospheric Administration (NOAA) and the Weather Spark website (https://weatherspark.com, accessed on 11 December 2021) (Table 2). The data contained the monitoring results of seven climate stations within the study area. The spatial distribution of the climate stations is shown in Figure 1. We also collected slope and aspect data of the study area derived from 30 m spatial resolution DEM (digital elevation model), which were acquired from the SRTM (Shuttle Radar Topography Mission) website (http://www2.jpl.nasa.gov/srtm/, accessed on 20 October 2021).

Table 2.
Monthly meteorological data.
2.4. Other Auxiliary Data
This paper draws on the 2019 California landcover map created by the Copernicus Global Land Service Center (http://land.copernicus.eu, accessed on 11 December 2021) from the interpretation of very high-resolution reference datasets from multiple sources that were regularly updated over successive years (RapidEye, SkySat, PlanetScope), and which enables an overall accuracy of land cover better than 80%. Google Earth Pro historical imagery and ESRI World Imagery Wayback historical imagery were used to verify the classification accuracy of vegetations and classified according to the dNBR threshold classification proposed by the European Forest Fire Information Service (EFFIS).
3. Methods
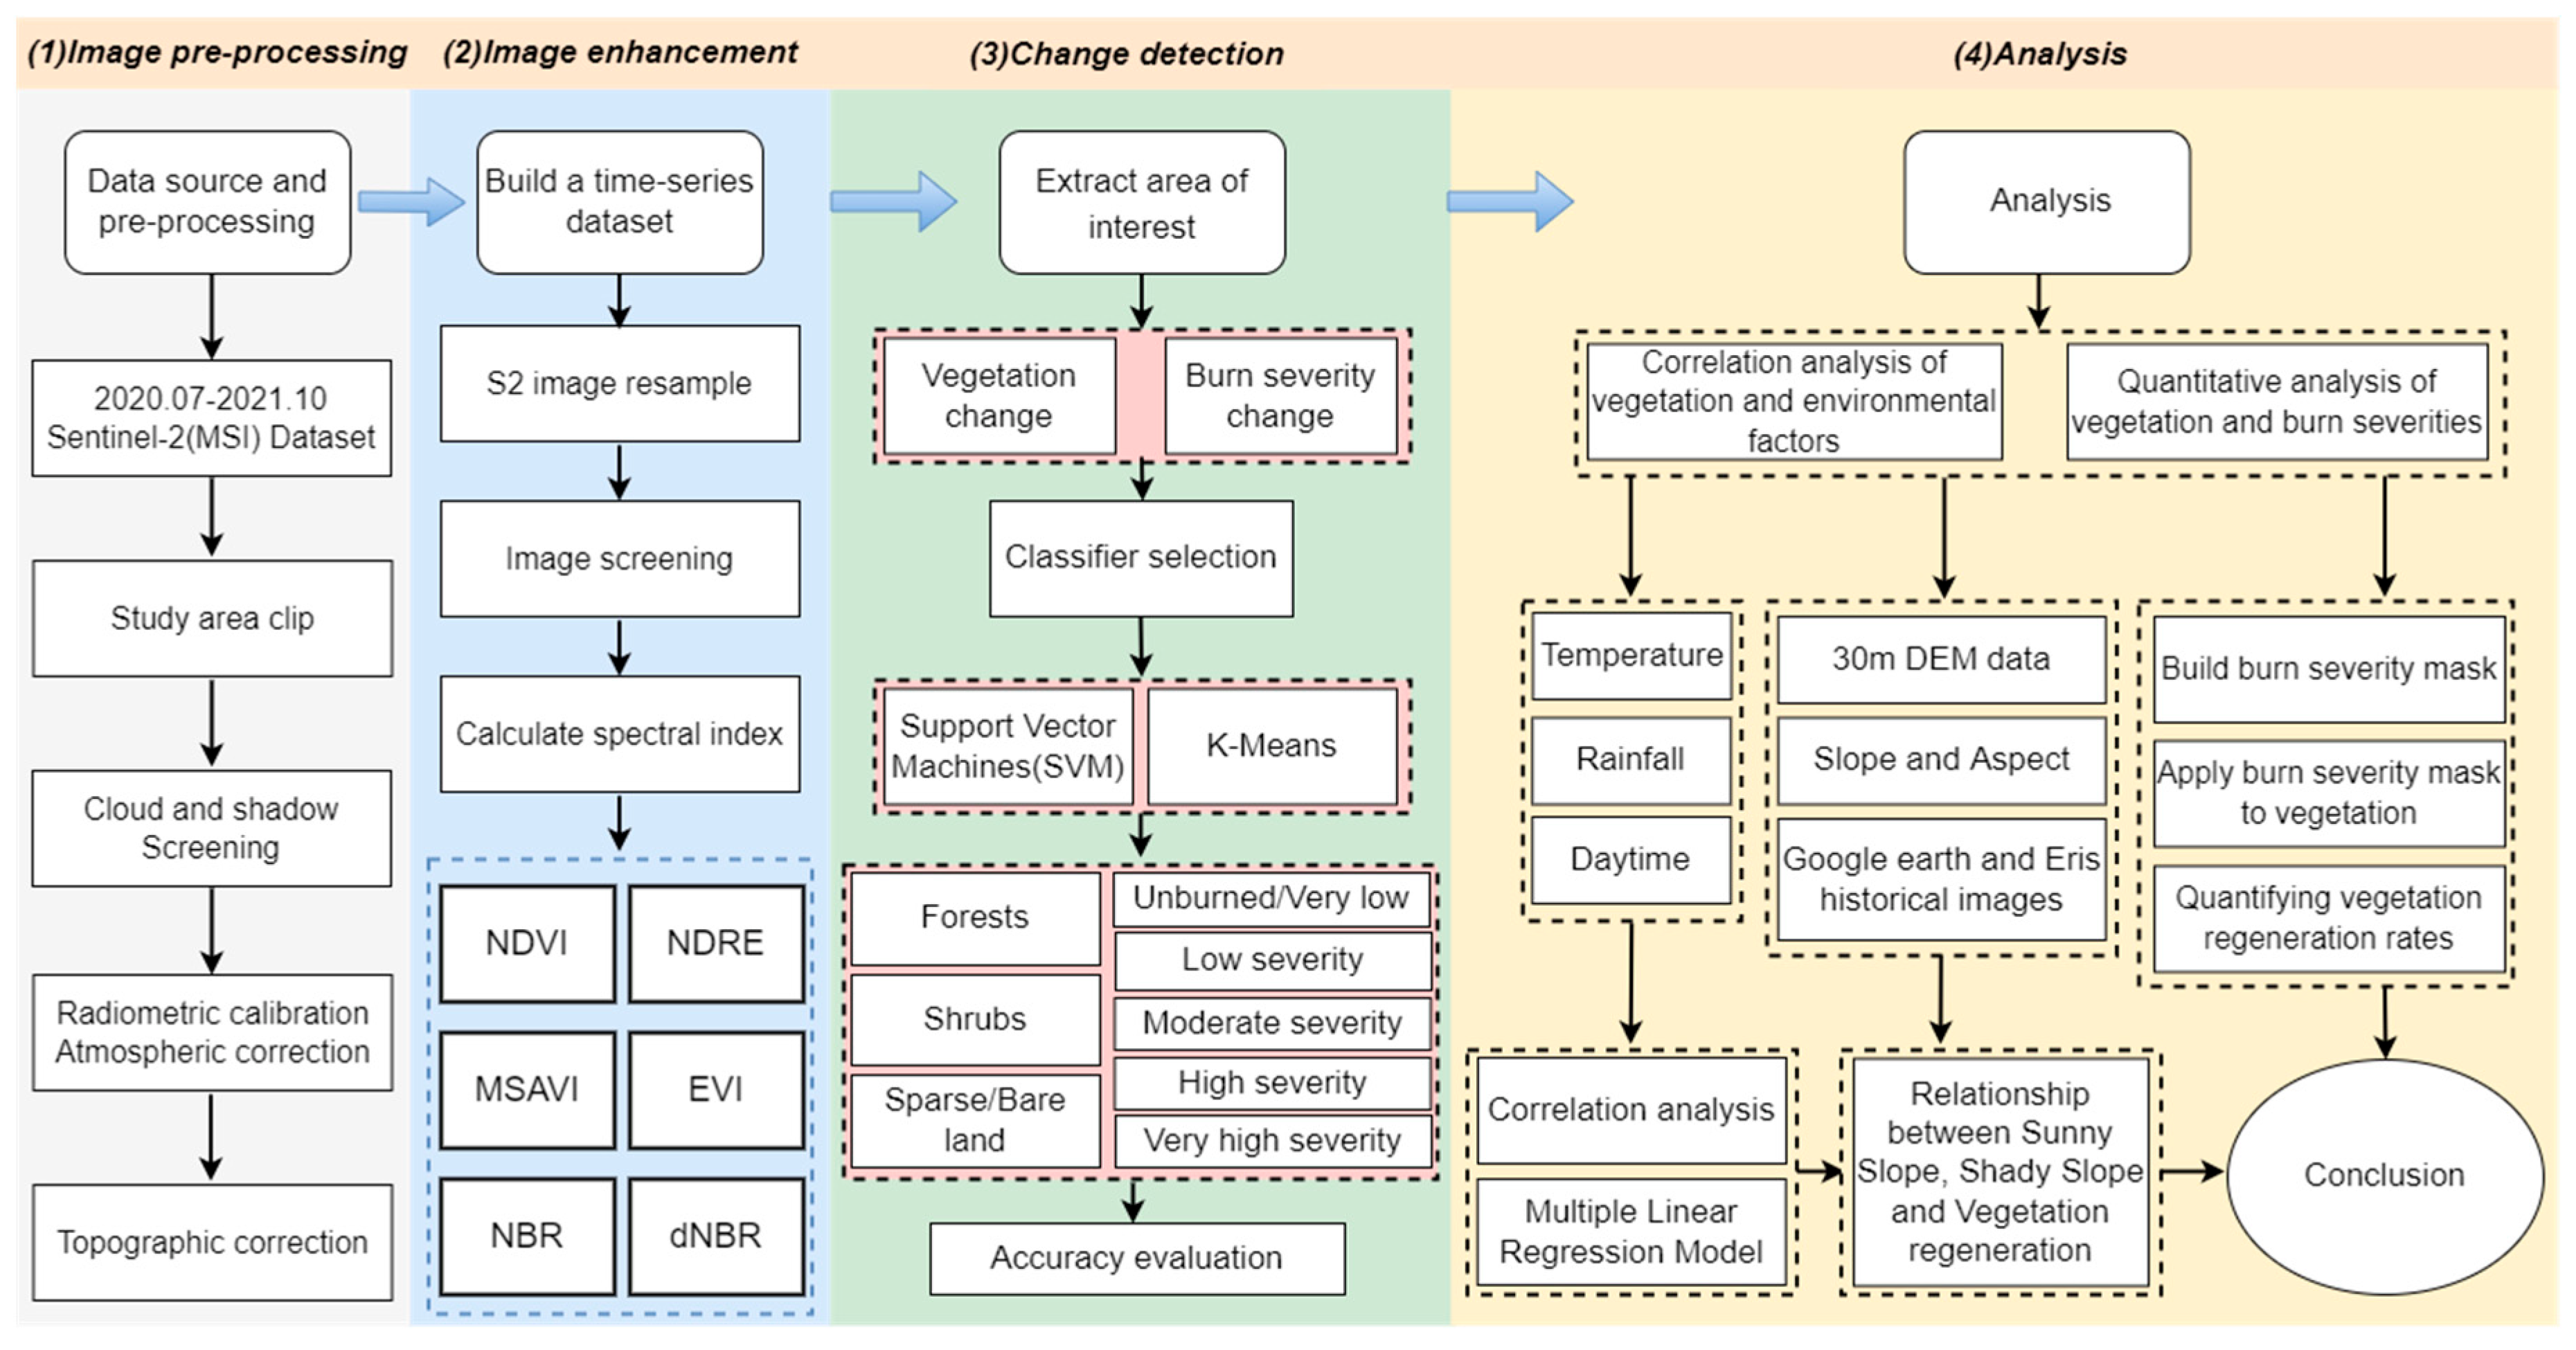
Figure 3 displays a flow chart of the spatiotemporal monitoring and analysis of post-fire vegetation regeneration. First, this paper constructs 13 Sentinel-2 time-series datasets that were available in certain months between July 2020 and October 2021. By resampling and preprocessing to improve the images and to calculate the spectral indices, the spatiotemporal features of vegetation pixels and fire pixels were obtained. Second, according to the spectral index and the spectral information of ground objects, the data of time-series vegetation and burn severity for each of these 13 months were classified by Support Vector Machine (SVM) and K-Means. In addition, the changes in the vegetation communities over time were quantitatively analyzed. Third, we analyzed the relationship between the regeneration of vegetation and three climate factors: temperature, rainfall, and daytime. The relationship was verified by establishing a multiple linear regression model. Furthermore, slope and aspect data, combined with ESRI World Imagery Wayback historical images, were used to analyze the effects of sunny and shady slopes on the two vegetation communities. Finally, the regeneration rate of vegetation under different burn severities was quantitatively analyzed by extracting the burn severity mask.
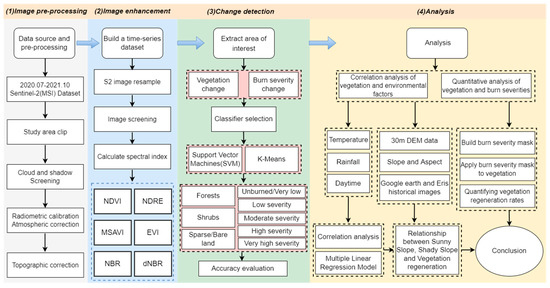
Figure 3.
Flow chart of spatiotemporal monitoring and analysis of post-fire vegetation regeneration.
3.1. Pre-Processing
First, all Sentinel-2 image data used in this study were radiometrically calibrated and atmospherically corrected by Sen2Cor, and the image spatial resolution was resampled to 10 m in SNAP (Sentinel Application Platform). Next, mosaicking, clipping, band calculation, and other processing methods were carried out using Envi v5.3. Of these, SNAP is a remote sensing image processing software developed by the European Space Agency, which is mainly used to process sentinel data [49].
As the study area was located in a high-altitude, mountainous region, the terrain shadow caused by light and shadow considerably affected the classification effect of ground objects. This required the correction of the Sentinel-2(MSI) imagery for terrain and different lighting effects that was finished using Envi v5.3 based on the C correction method. The digital elevation model (DEM) was resampled and used in conjunction with the S2 images to form terrain slope and aspect data. These two variables, along with the solar zenith angle and azimuth at the time of the capture of the images, were used as the C correction algorithm input parameters [50].
This paper uses the normalized difference vegetation index (NDVI), the enhanced vegetation index (EVI), the modified soil-adjusted vegetation index (MSAVI), the normalized difference red edge vegetation index (NDRE), the normalized burn rate (NBR) as vegetation classification indicators (Table 3). We first visually interpret the classification capabilities of these five vegetation indices through the K-Means pre-classification method. Then, use the SVM algorithm to compare the classification accuracy of the vegetation index. Relying on these spectral indices can effectively eliminate the influence of external factors (such as atmosphere and terrain) on the vegetation classification results. They are also suitable for capturing and tracking the calculation of vegetation communities and burn severity in large-scale wildfires, which can effectively improve the accuracy of time-series monitoring. The NDVI is sensitive to chlorophyll and is very useful and reliable in tracking changes in vegetation over time, especially for monitoring forest disturbances, such as wildfires and pests [51,52]. The EVI is an improvement on the NDVI and is superior in reducing background and atmospheric effects and saturation. The combination of the two can complement and improve the monitoring of vegetation changes [53,54]. The MSAVI can minimize the influence of soil background on vegetation classification [55,56]. The NDRE uses the characteristic red edge band of Sentinel-2 combined with the near-infrared band, which has a better monitoring effect on dense vegetation in the overgrowth period [57,58]. The dNBR is derived from the NBR and is suitable for burn severity classification calculations [59,60,61].

Table 3.
The spectral indices used in this study.
3.2. Mapping the Classification of Vegetation Communities and Burn Severity
3.2.1. Classification Method
Based on the obtained time-series Sentinel-2(MSI) image dataset, this paper uses SVM and dNBR threshold to classify vegetation and burn severities in 13 images [62,63]. The vegetation community and burn severity were classified using image data from 17 July 2020 and 20 October 2020. July is a season of lush vegetation, so it is suitable for collecting data on vegetation distribution pre-fire. Meanwhile, 20 October was the sixth day that the fire stopped expanding, so the fire signs were clear and suitable for collecting burn severity data. This paper defines the vegetation classification in the study area in three categories: forests, shrubs, and sparse/bare land; and burn severity was defined across five gradients: no severity/very low severity, low severity, moderate severity, high severity, and very high severity.
3.2.2. Accuracy Assessment
Specifically, this paper compares the classification results of five effective vegetation indices, selecting the classification combination with the highest accuracy. The accuracy was verified by selecting high-resolution image data with similar imaging dates from Google Earth Pro historical images, and 389 sample points were randomly collected and nested in the classified vegetation images for interpretation. The results were interpreted using confusion matrix mapping, with producer’s accuracy (PA), user accuracy (UA), overall accuracy (OA), and KAPPA coefficients (Equations (1)–(4)) as the accuracy verification standards [64]. The burn severity was classified according to the classification proposed by the European Forest Fire Information Service (EFFIS) using the dNBR threshold as the calculation index. The classification results were compared with the fire area information published by the US Forest Service to verify the accuracy.
where Pii is the number of correctly classified samples; N denotes the total number of samples; and Ri and Ci represent the total number of vegetation community i in the correct data and the total number from the classification results, respectively.
3.3. Relationships between Post-Fire Vegetation Community Regeneration and Environmental Factors
In this paper, three climate factors (temperature, rainfall, and daytime) and two topographical factors (slope and aspect) were examined within one post-fire year as environmental factors that may be related to the regeneration of vegetation communities. By using the unary Linear Regression and multiple linear regression model, a relationship analysis was carried out between the three climate factors and the regeneration evolution of the two vegetation communities. In addition, through World Imagery Wayback high-resolution historical image data provided by ESRI, combined with slope and slope aspects, the forest and shrub communities were examined in three periods (pre-fire, post-fire, and short-term regeneration). Growth images were used to analyze and compare the topographic effects of sunny slopes, shady slopes, and slopes on vegetation community regeneration.
3.4. Vegetation Community Regeneration under Different Burn Severity
To further quantify the relationship between burn severity and vegetation regeneration (see Section 4.3), we used Envi v5.3 software to create masks for the burn severity of four gradients, respectively, and nested the mask samples within the time-series vegetation area, obtaining a vegetation area map at different burn severities. We then used statistical analysis to obtain the regeneration rates of forest and shrub communities under five burn severities.
4. Results
4.1. Accuracy Verification and Monitoring Results of Total Vegetation Community Regeneration and Burn Severity
4.1.1. Index Classification Visual Interpretation
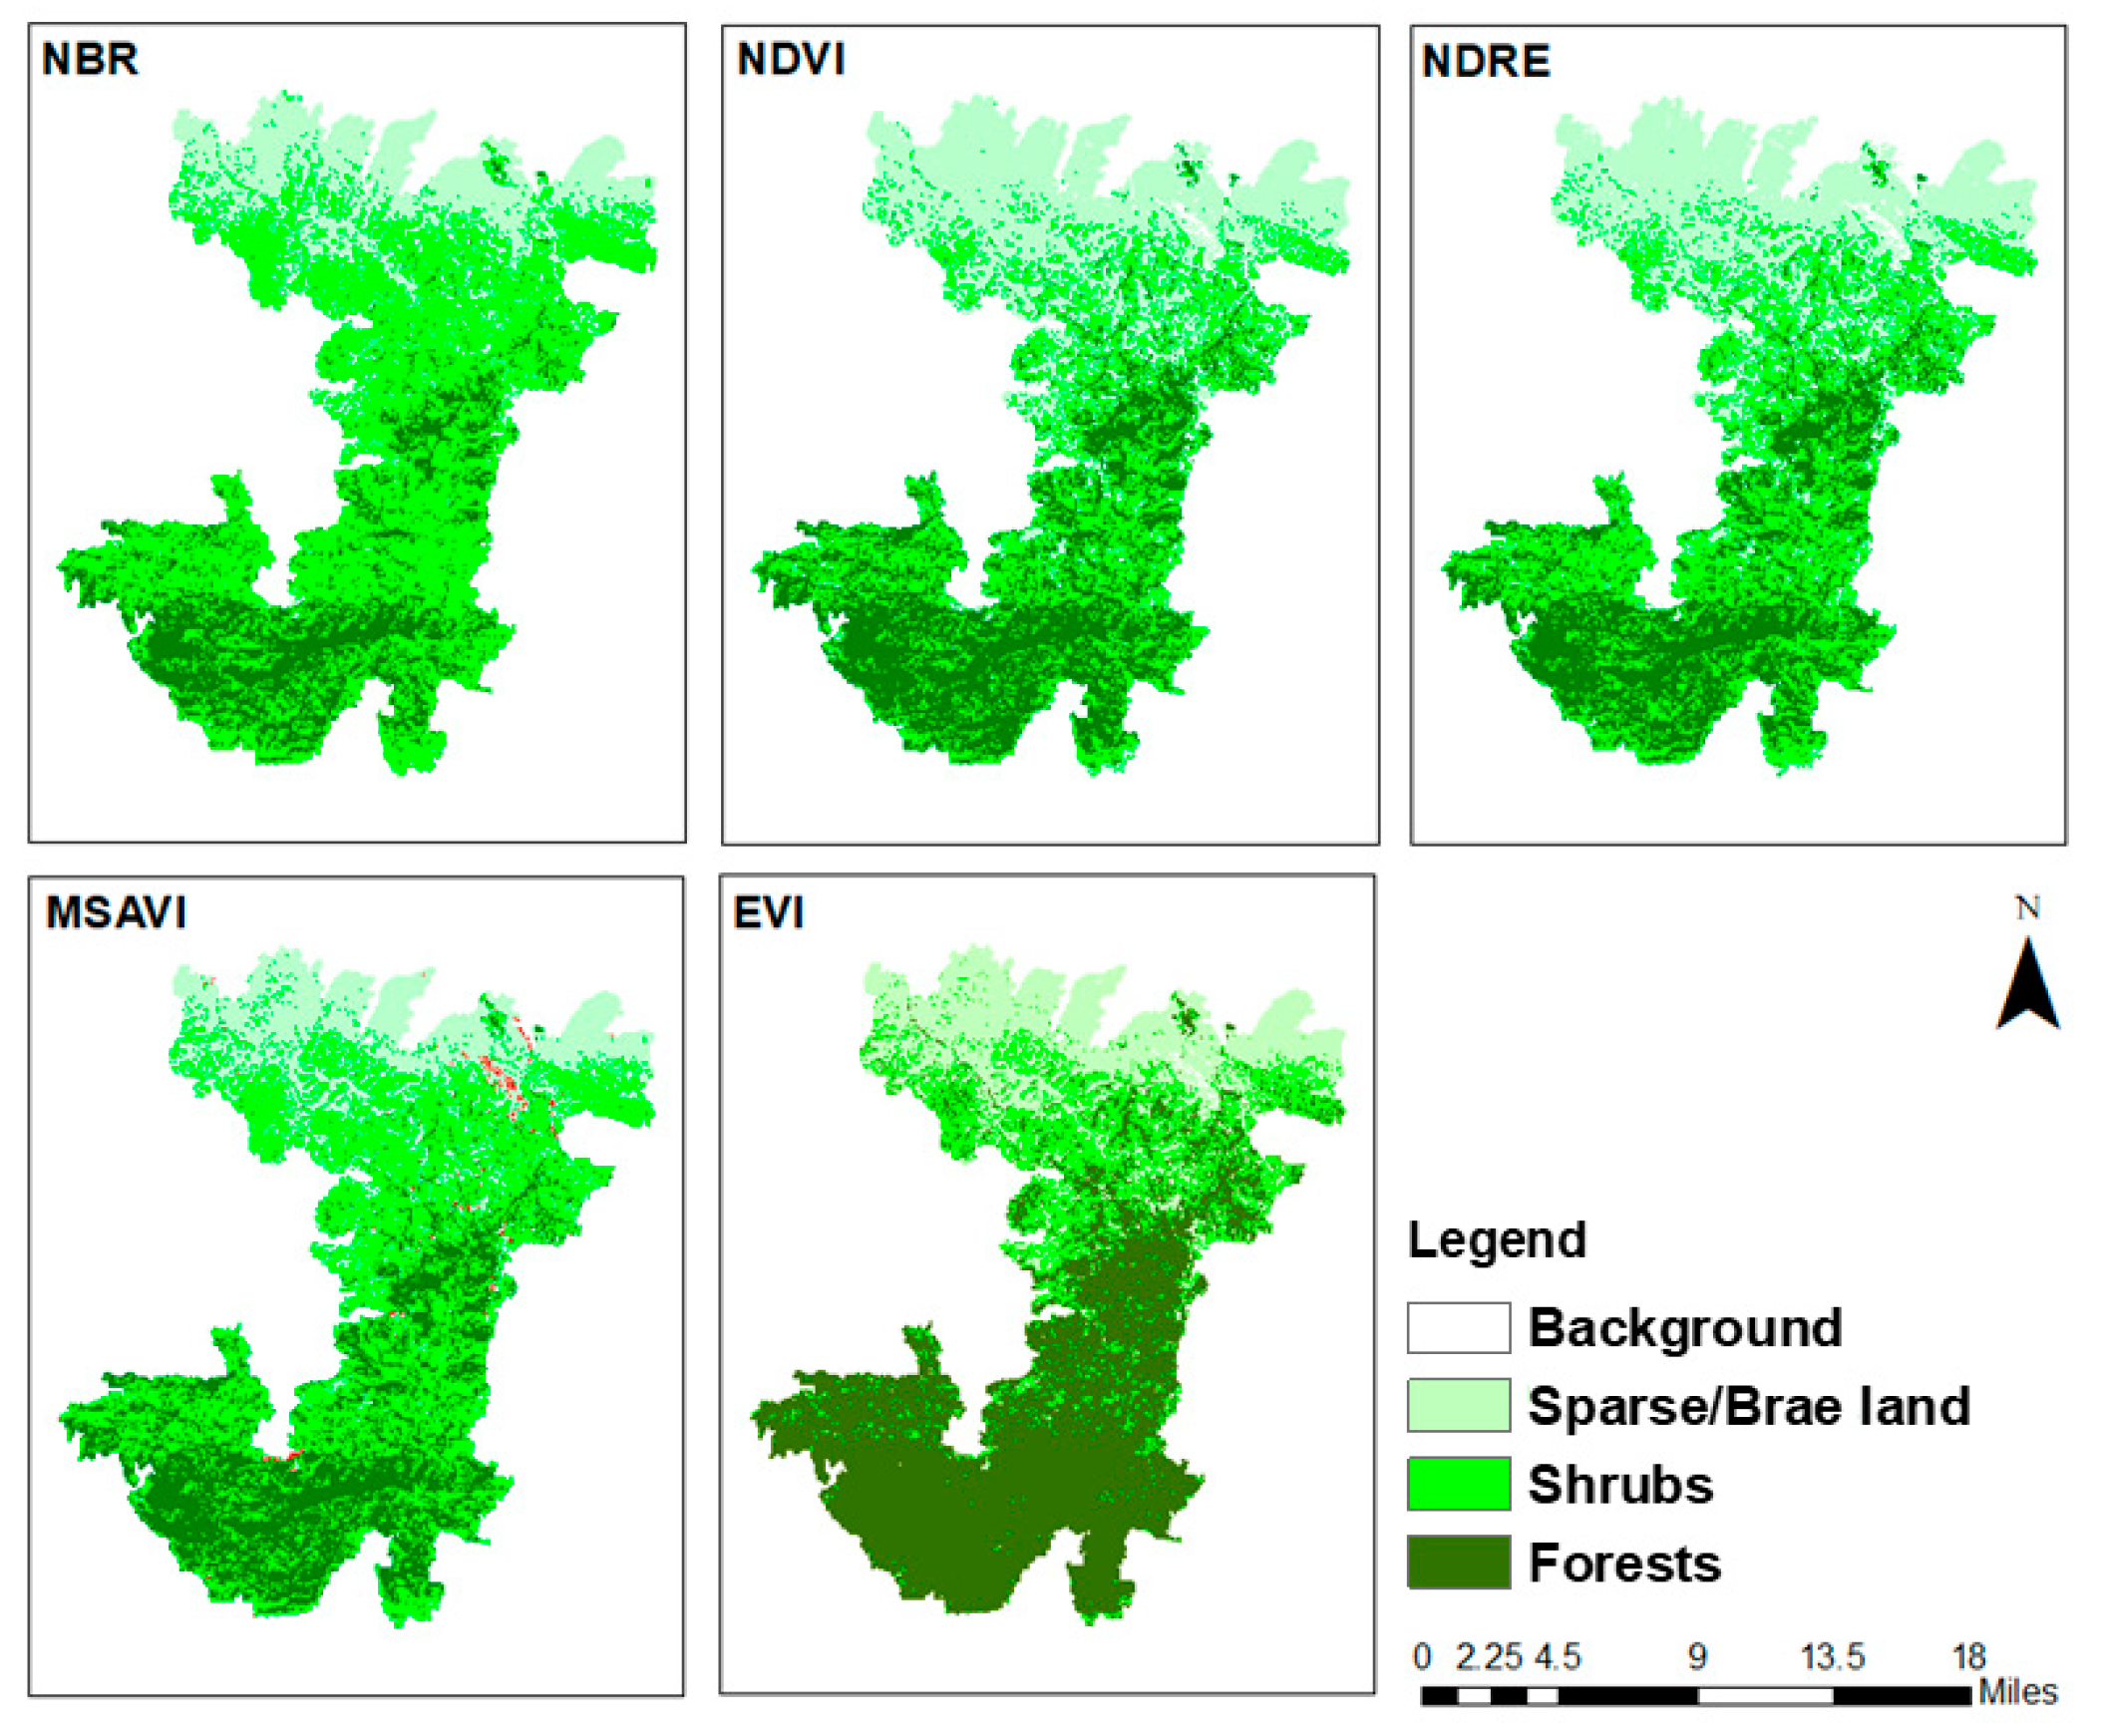
To optimize the spectral index suitable for the classification and time-series monitoring of the two vegetation communities, in this study, the K-Means clustering algorithm was used for the pre-classification test for NBR, NDVI, NDRE, MSAVI, and EVI pre-classification. The classification accuracy was set to 0.001% and the number of iterations to 300. According to Figure 4, the EVI can clearly classify vegetation and non-vegetation, but has difficulty discerning between forest vegetation and shrubs vegetation in densely mixed areas, where the detection effect is not good. The classification results of the NBR, NBVI, NDRE, and MSAVI are difficult to distinguish by visual interpretation.
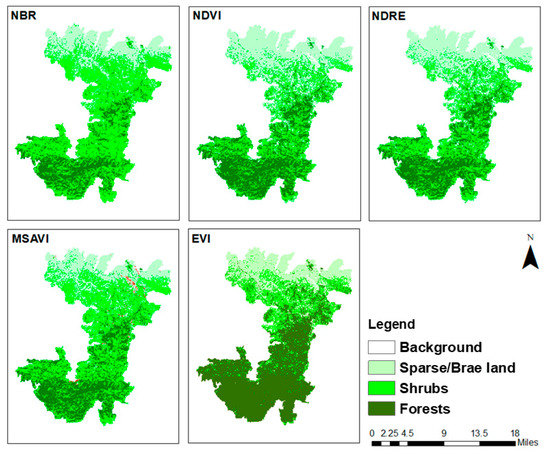
Figure 4.
Comparative analysis of monitoring results with different spectral indexes.
4.1.2. Comparison of Index Classification
The EVI index can be easily excluded by a method of visual interpretation, but the other four indexes are difficult to distinguish. Therefore, we used the SVM method to classify the three groups of samples in July 2020, October 2020, and March 2021 with NBR, NDVI, NDRE, and MSAVI indices. The classification results were verified for accuracy with 389 sample points from high-resolution historical imagery from Eris and Google Earth Pro. The validation criteria are overall accuracy (OA) and the Kappa coefficient, and the results are shown in Table 4. Compared with the NDVI, NDRE, and MSAVI, the NBR has the best classification effect, improving the overall accuracy by approximately 3.7–6.1%. As the SWIR2 and NIR bands used by the NBR are highly complementary to vegetation disturbance monitoring [65], according to previous research, we chose the NBR as the spectral index for the time-series monitoring of vegetation communities.

Table 4.
Index classification accuracy.
4.1.3. Verification of Vegetation Classification Accuracy
Historical images with 0.5 m resolution taken on 6 July 2020 in the study area were obtained from Google Earth Pro. From these images, 161 forest samples, 142 shrub samples, and 86 sparse/bare land samples were extracted and superimposed on the vegetation classification map on 16 July 2020 for accuracy verification. The result shows that the overall accuracy is 97.1% and the kappa coefficient is 0.92, indicating that the classification method can well reflect the distribution of forest and shrub communities in this area. In addition, the overall accuracy based on the SVM algorithm is 6.6% higher than that of K-Means.
In addition, as this paper only focuses on monitoring the forest vegetation and shrub post-fire vegetation communities, there is no distinction between detailed forest species. The classification accuracy of subsequent months is verified by calculating the confusion matrix (Table 5).

Table 5.
Accuracy assessment and statistics for monitoring vegetation community regeneration changes.
4.1.4. Burn Severity Classification and Accuracy Verification
The dNBR index is very useful to determine burn surfaces and burn severity levels. Moreover, a large number of studies have shown that the classification of combustion degree based on dNBR index has high accuracy [66,67,68]. It could be classified according to the dNBR threshold classification proposed by the European Forest Fire Information Service (EFFIS) (Table 6). In this study, the burned area based on the dNBR threshold classification method was compared with the 115,796 acres published by the US Forest Service, with an overall accuracy of about 94.87%, which was highly representative.

Table 6.
Differenced Normalized Burn Ratio (dNBR) thresholds proposed by the European Forest Fire Information Service (EFFIS).
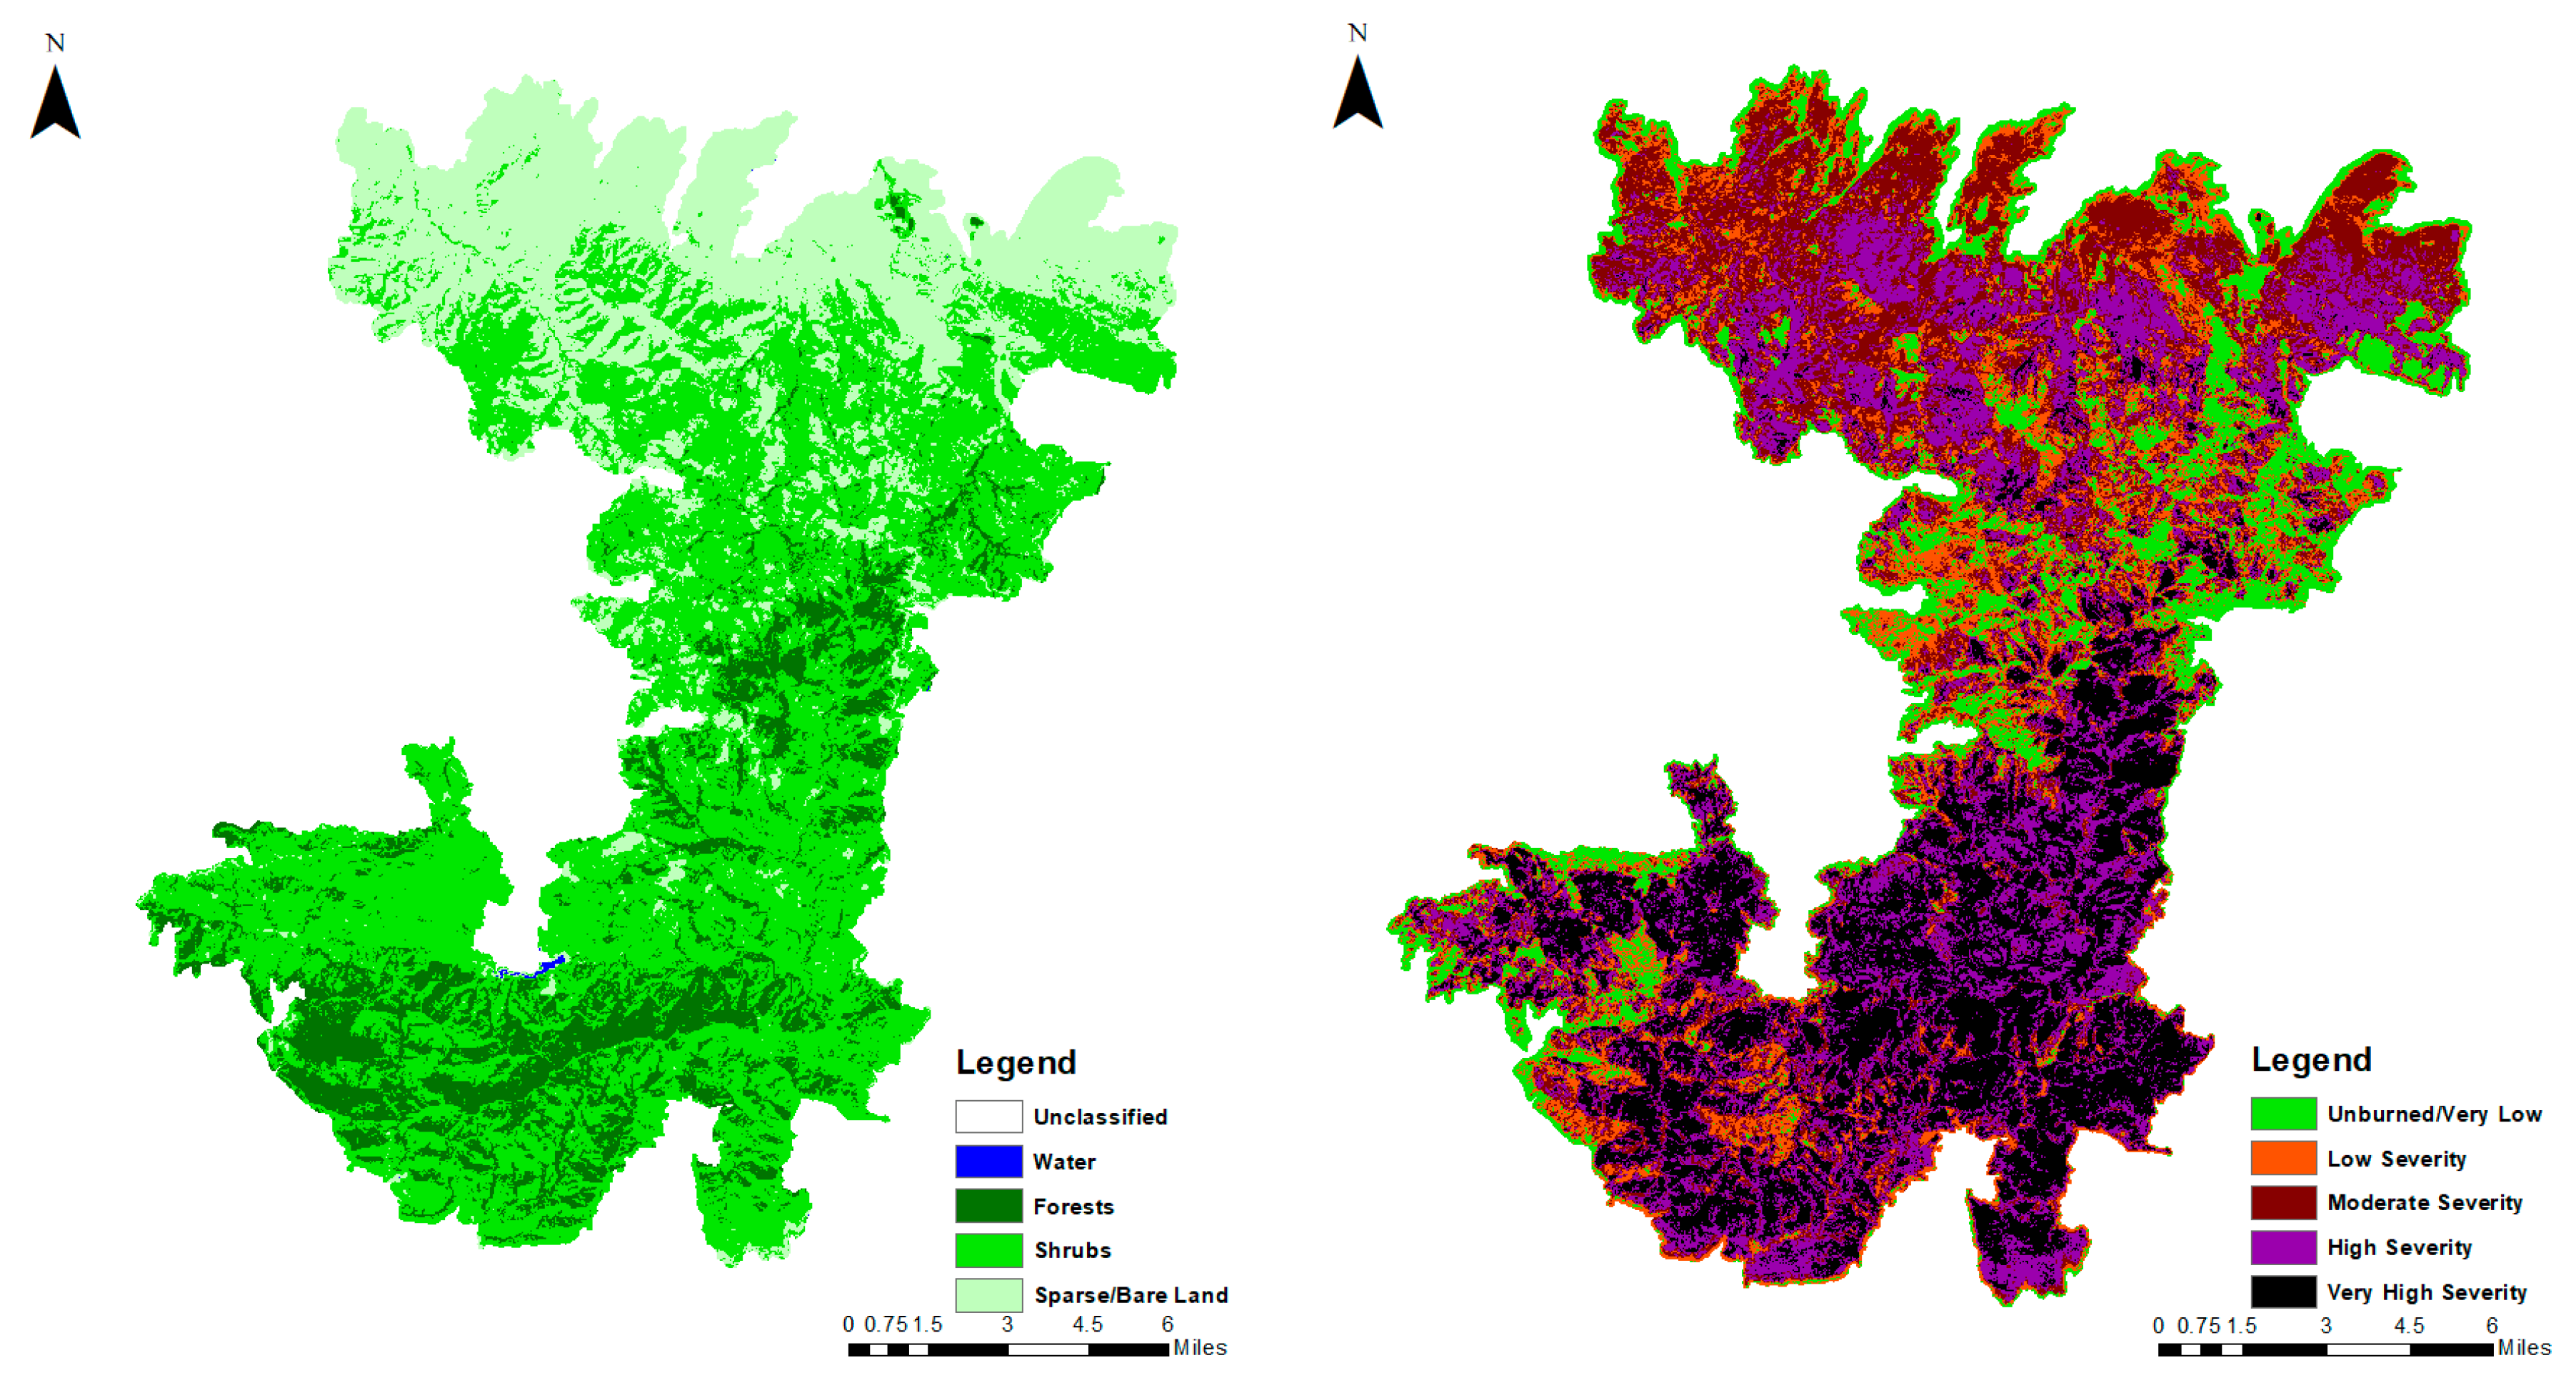
Figure 5 shows the classification map of vegetation communities and burn severity. The northern part of the study area is bordered by the Mojave Desert, and the vegetation is relatively sparse, so the severity of burns was chiefly low and moderate. The southern part of the study area is close to the Angeles National Forest, and the density of forest and shrub communities is high. Therefore, the damage to vegetation communities and burn severity were more serious than in the north, and the burns were chiefly medium and high. This study also attempted to use the K-Means clustering method to distinguish the burning area. However, the results show that the overall accuracy based on the dNBR threshold is approximately 4.67% higher than that of K-Means.
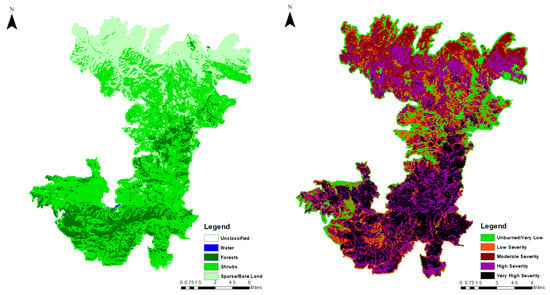
Figure 5.
Classification map of vegetation community and burn severity.
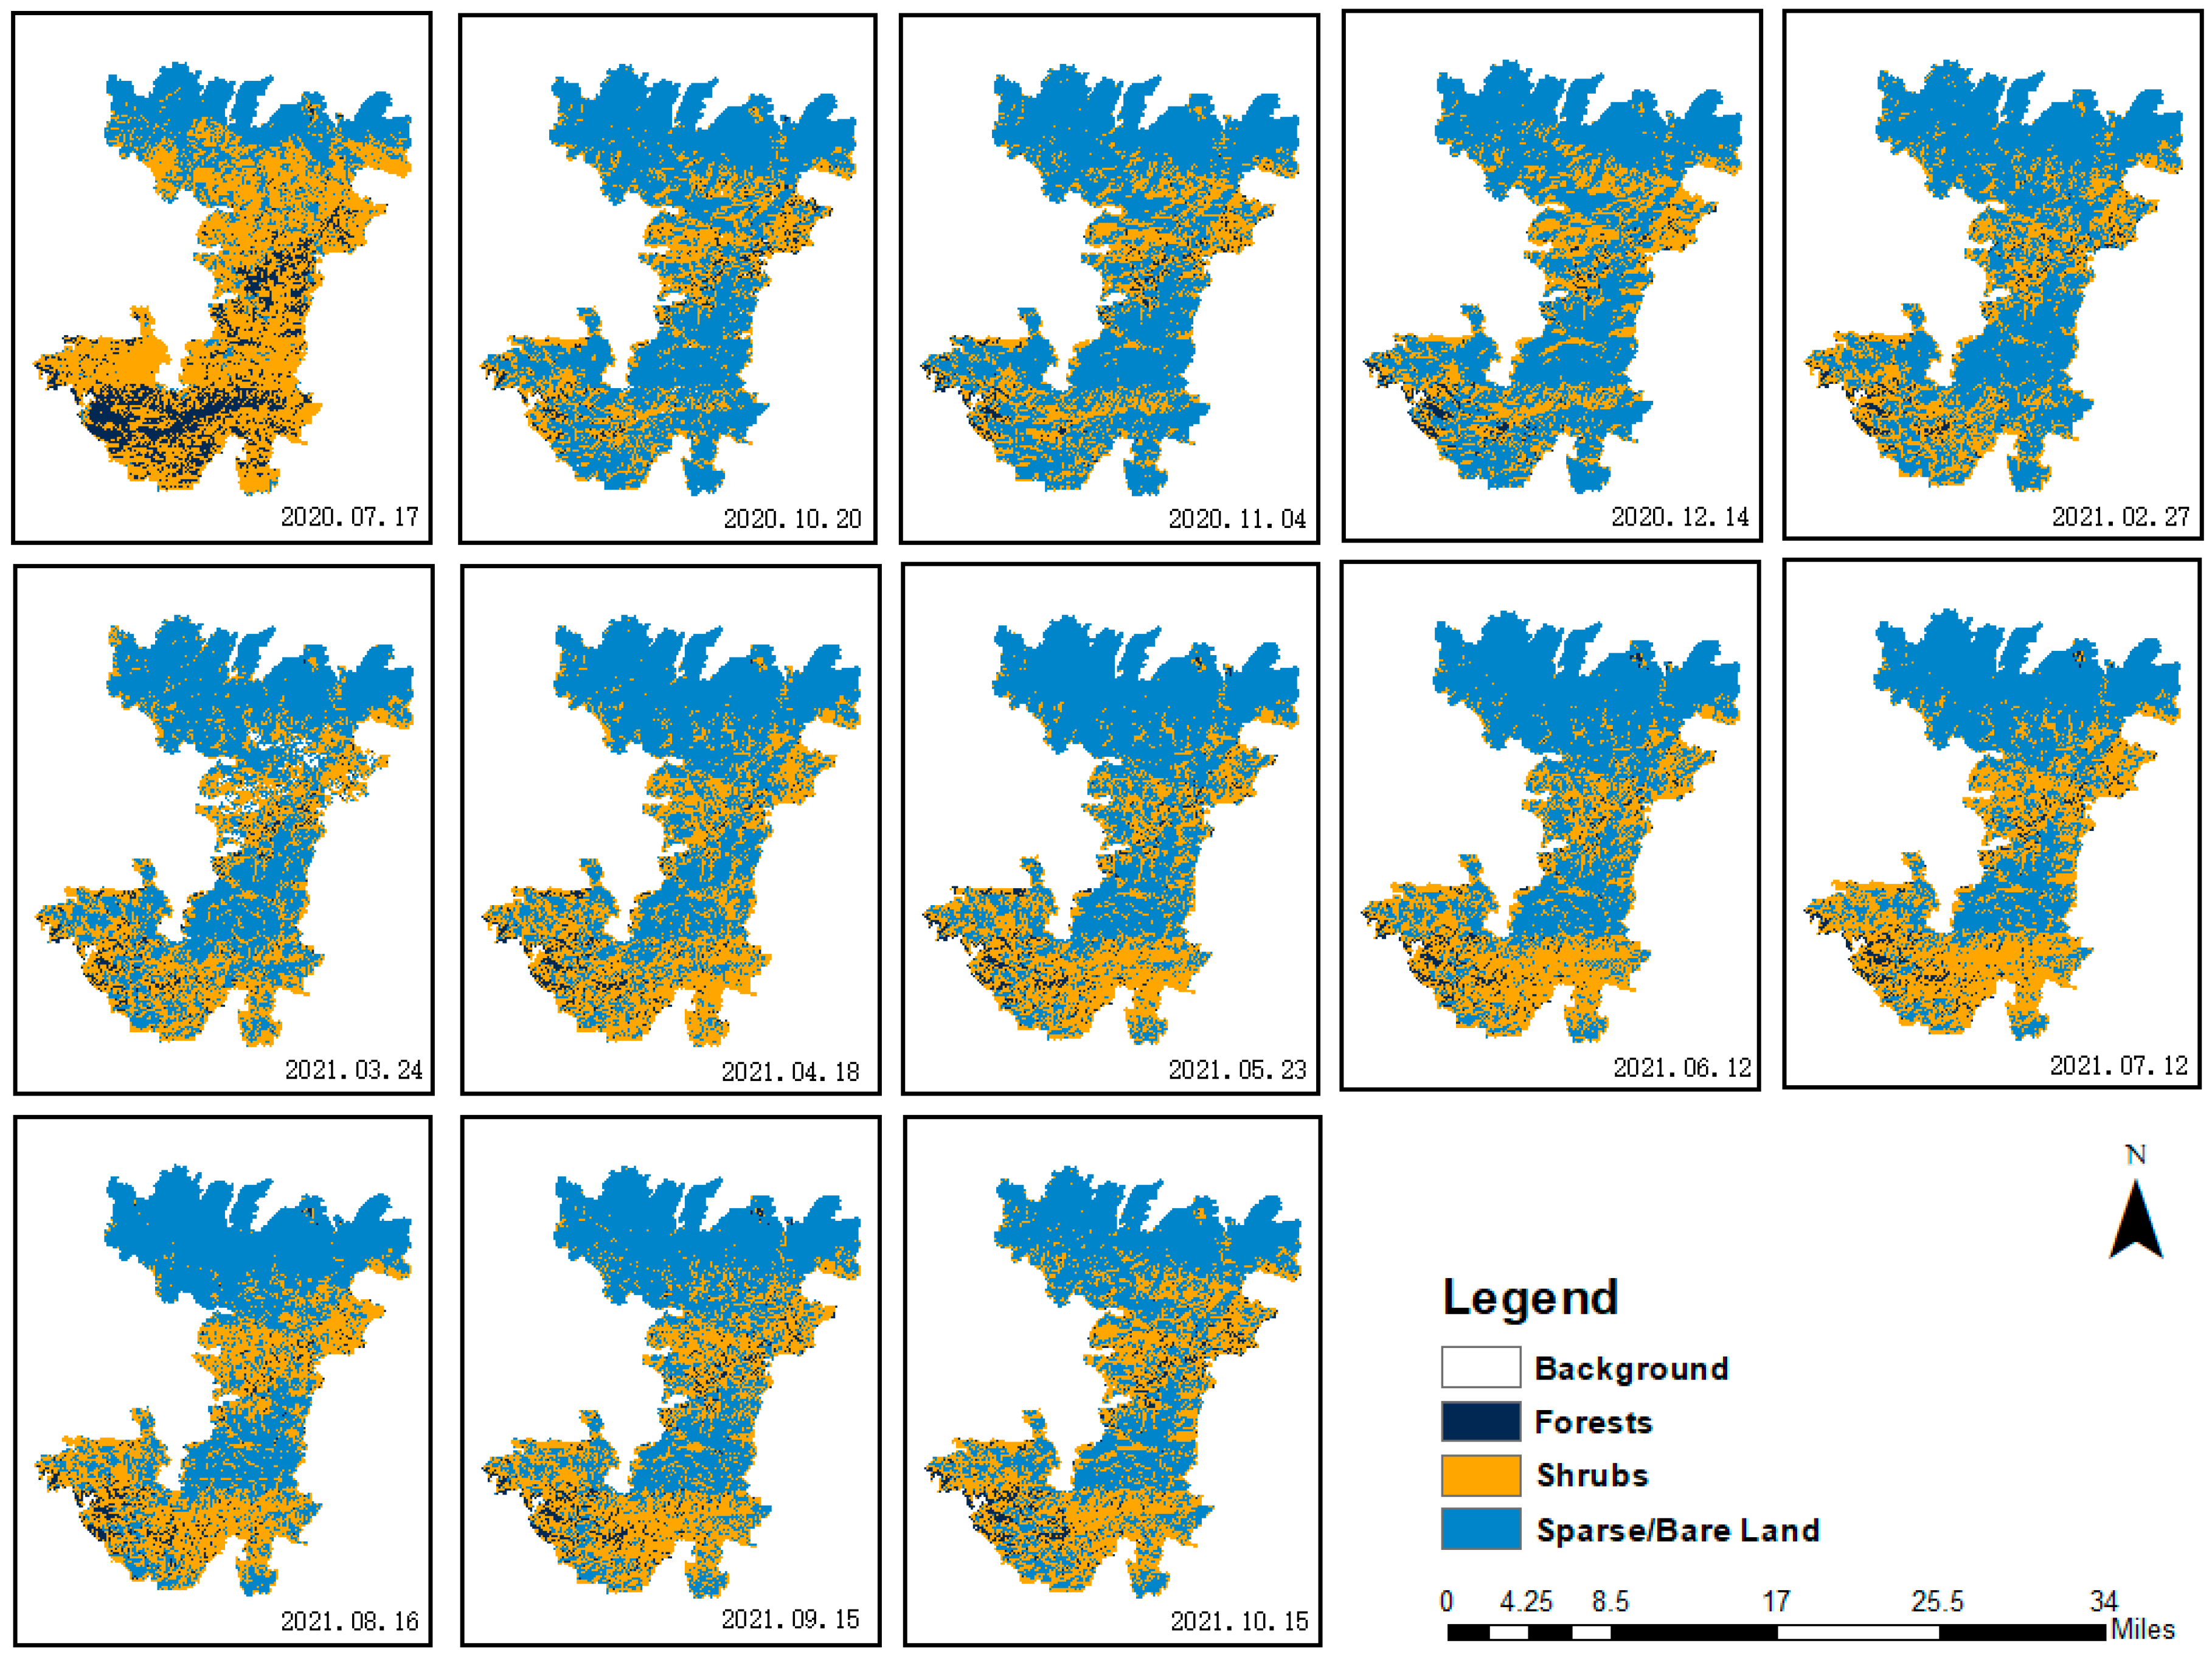
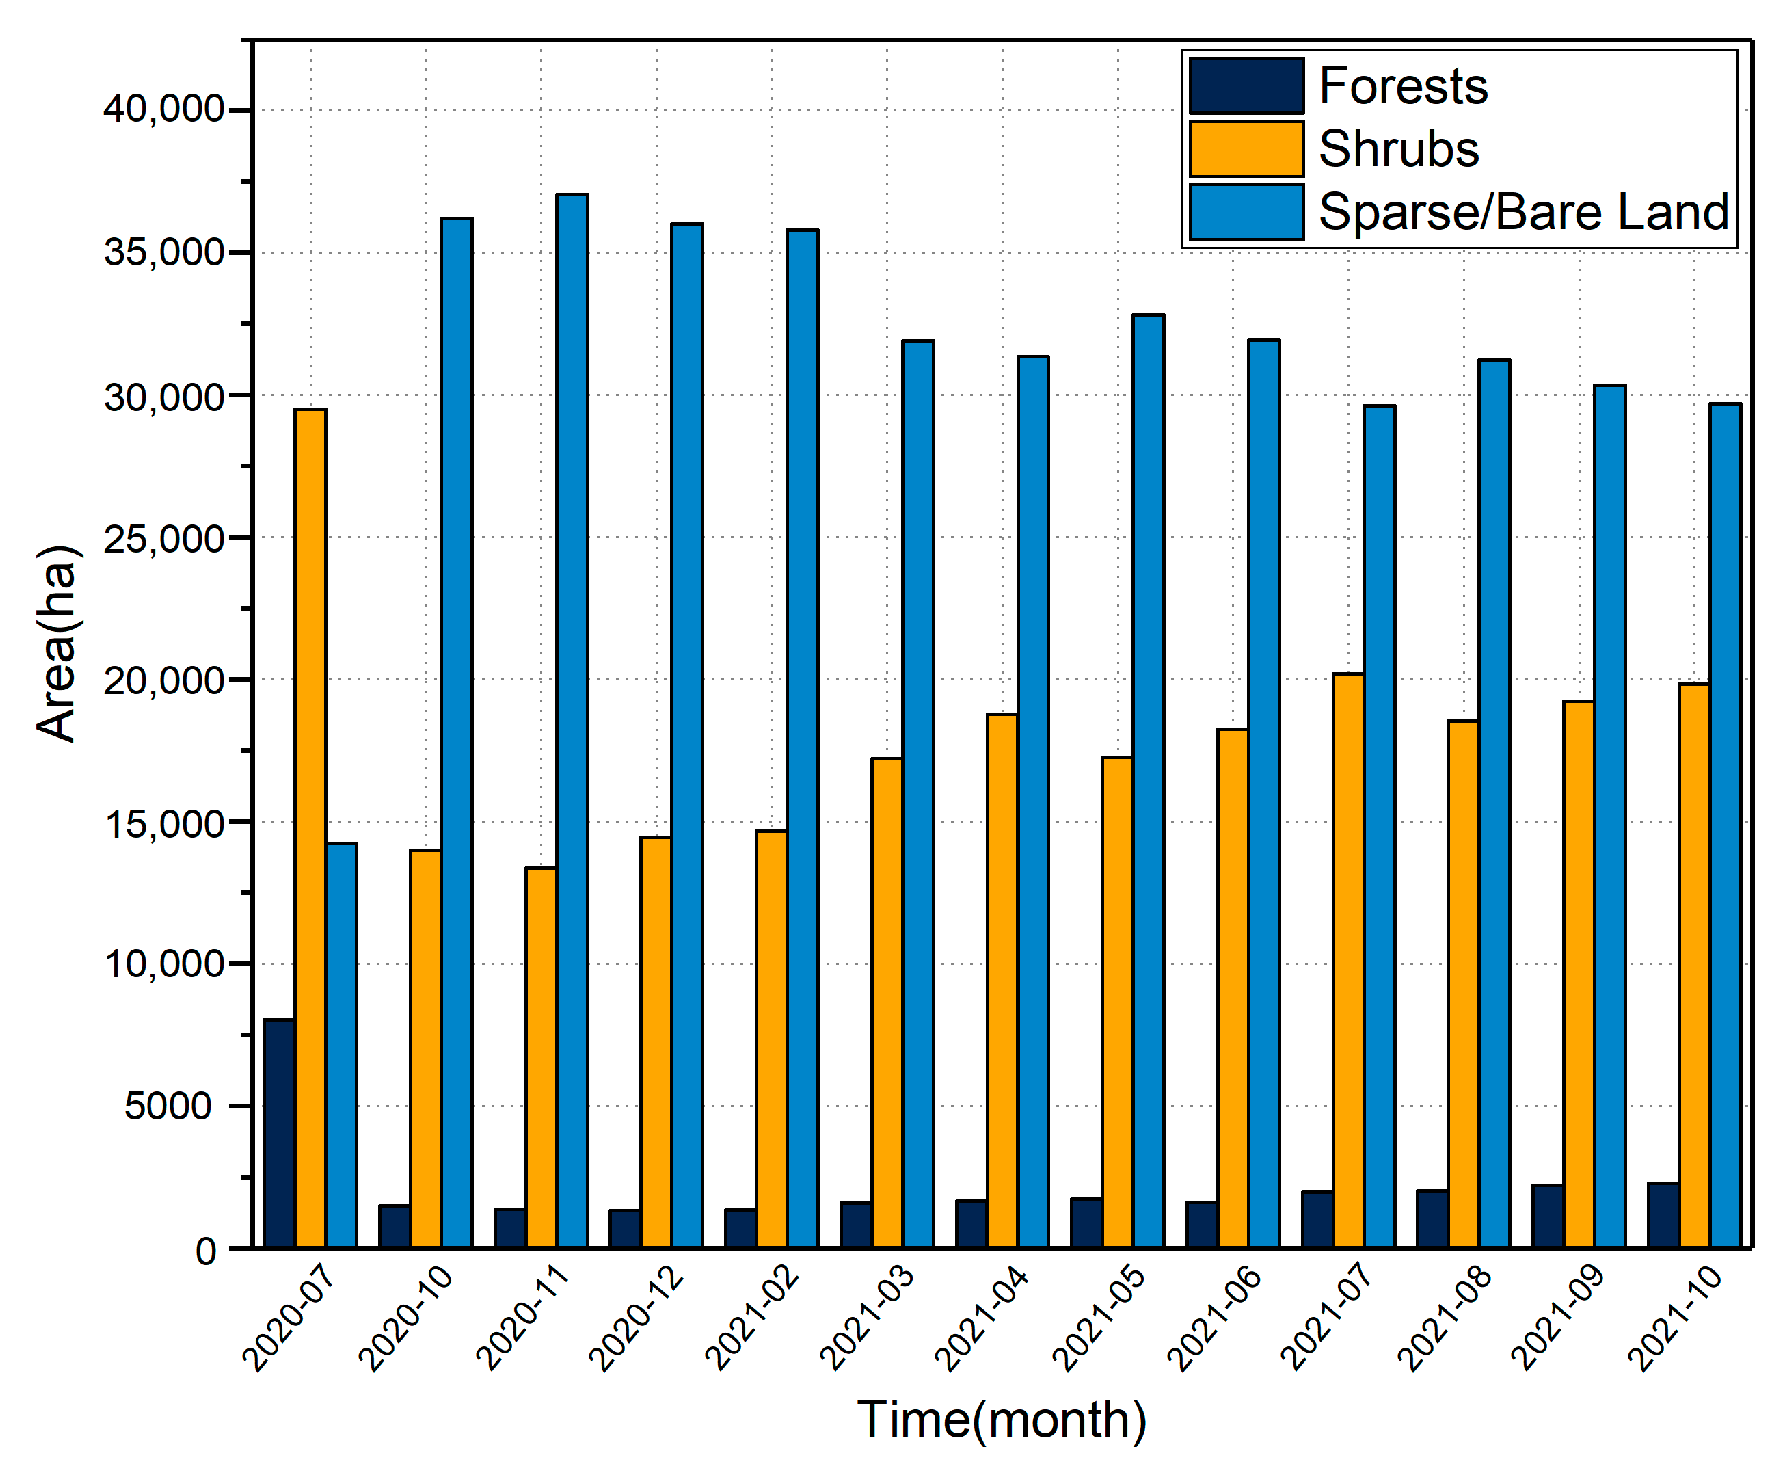
The vegetation community time-series change chart (Figure 6) shows that the forest vegetation coverage dropped sharply from pre-fire (July 2020) to post-fire (October 2020). It also reveals that the forest communities decreased from 8046.8 hectares to 1498.07 hectares, a decrease of 81.4% (approximately 6548.73 hectares), while the shrub communities decreased from 29,504.35 hectares to 14,003.73 hectares, a decrease of 52.5% (approximately 15,500.62 hectares). Furthermore, it indicates that the bare soil/sparse land area increased from 14,225.63 hectares to 36,202.32 hectares, an increase of 154.5% (approximately 21,976.69 hectares) and that the vegetation damage was very serious (Figure 7).
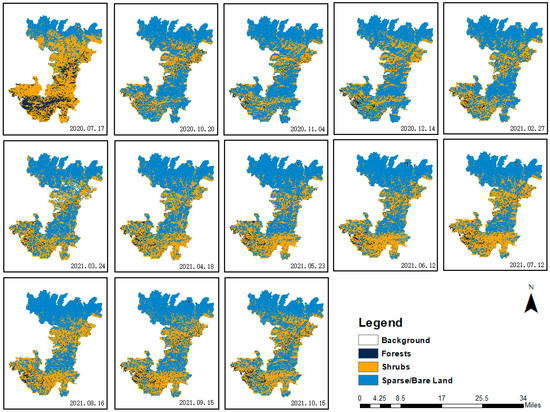
Figure 6.
Map of vegetation community time-series change.
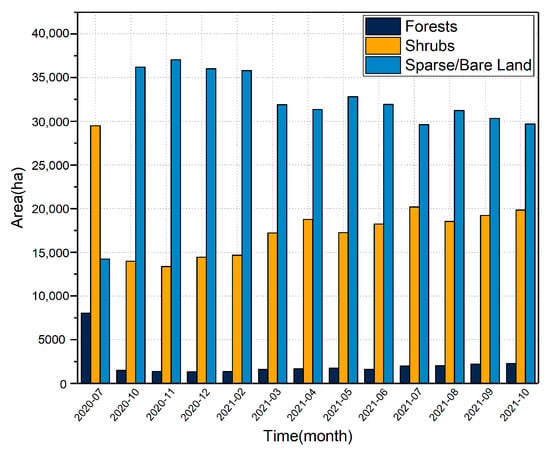
Figure 7.
Vegetation community area change map.
Fortunately, from the fourth month post-fire (February 2021), the vegetation began to show its resilience: it can be distinctly observed that the overall vegetation developed towards a regeneration trend, and that the bare/sparse land began to decline significantly for the first time. After 367 days of natural regeneration: the overall regeneration area of the forest communities was approximately 784.83 hectares, with an average regeneration rate of 65.4 hectares/month; the overall regeneration area of the shrub communities was approximately 5828.7 hectares, with an average regeneration rate of 485.7 hectares/month; and the sparse/bare land area decreased by 6511.9 hectares, with an average decline rate of 542.7 hectares/month.
4.2. Relationships between Environmental Factors and Post-Fire Vegetation Regeneration
Environmental factors may change the trend of the original vegetation growth [69,70]. To quantify the impact of post-fire climate factors on the regeneration of forest and shrub communities, a linear regression model was used for independent and mixed analysis between temperature, rainfall, and daytime. Regression models were fitted to the dynamics of the regeneration process in agreement to other studies [71,72]. In addition, we used the slope analysis tool in ArcGIS 10.8 to divide the study area was divided into shaded slopes (315–45°), sunny slopes (135–225°), and five gradients (0–15°, 15–25°, 25–35°, 35–45°, 45–62°) of slope type. By combining the World Imagery Wayback high-resolution historical image data, the impact of the sunny slopes, shady slopes, and slopes on post-fire vegetation regeneration was verified.
4.2.1. Single Factor Analysis of the Environment
Starting in September 2020, the vegetation growth in the study area was disturbed by wildfire, and began to enter a regeneration period in December of the same year. Changes in fractional vegetation coverage are beneficial to reflect the situation of post-fire vegetation regeneration [73]. The data in this section were intercepted from the average data from December 2020 to September 2021 at seven sites and used the fractional vegetation coverage (FVC) to monitor forest and shrub regeneration. The aim is to accurately express the impact of environmental factors on vegetation regeneration. Missing data for February is due to image quality issues. The analysis results are shown in Table 7.

Table 7.
Regression analysis of vegetation regeneration and post-fire climate factors.
Post-Fire Vegetation Regeneration—Temperature
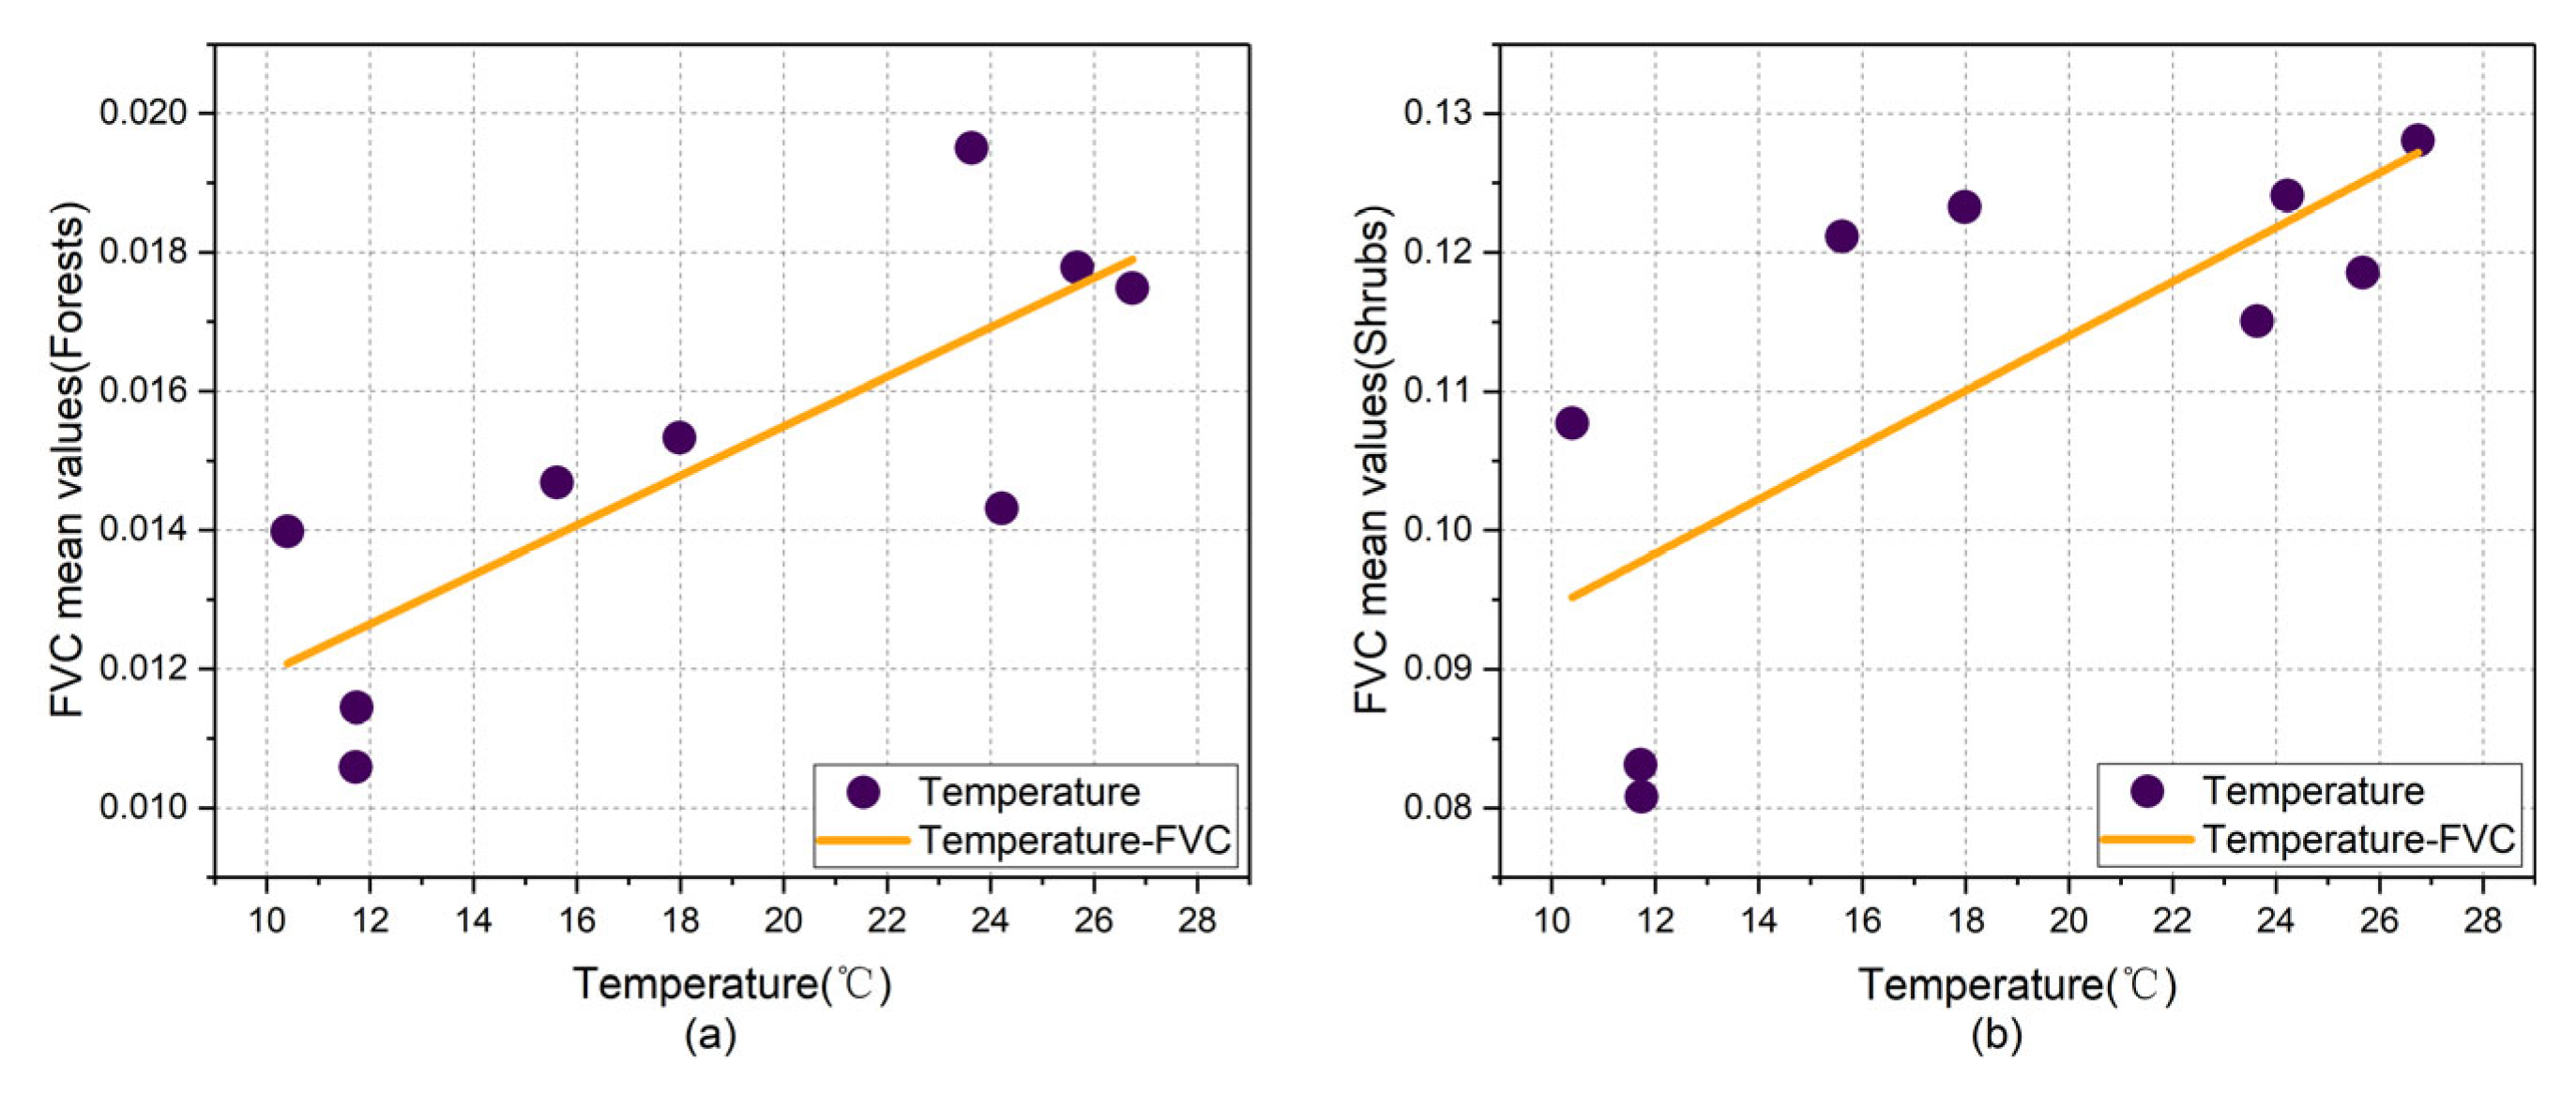
This section analyzes the monthly average temperature data and establishes a linear regression model (Figure 8). The relationship between temperature factor and vegetation regeneration was significant (R2 was 0.64 and 0.53, respectively). The results reveal that temperature showed good consistency in the regeneration of forest and shrub communities. In the linear range, the gradual increase in air temperature accelerated the regeneration rate of vegetation.
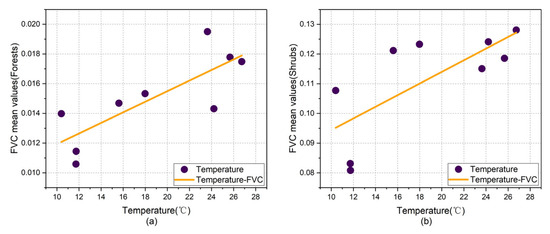
Figure 8.
Temperature and vegetation regeneration relationship map: (a) forests-temperature and (b) shrubs-temperature.
Post-Fire Vegetation Regeneration—Rainfall
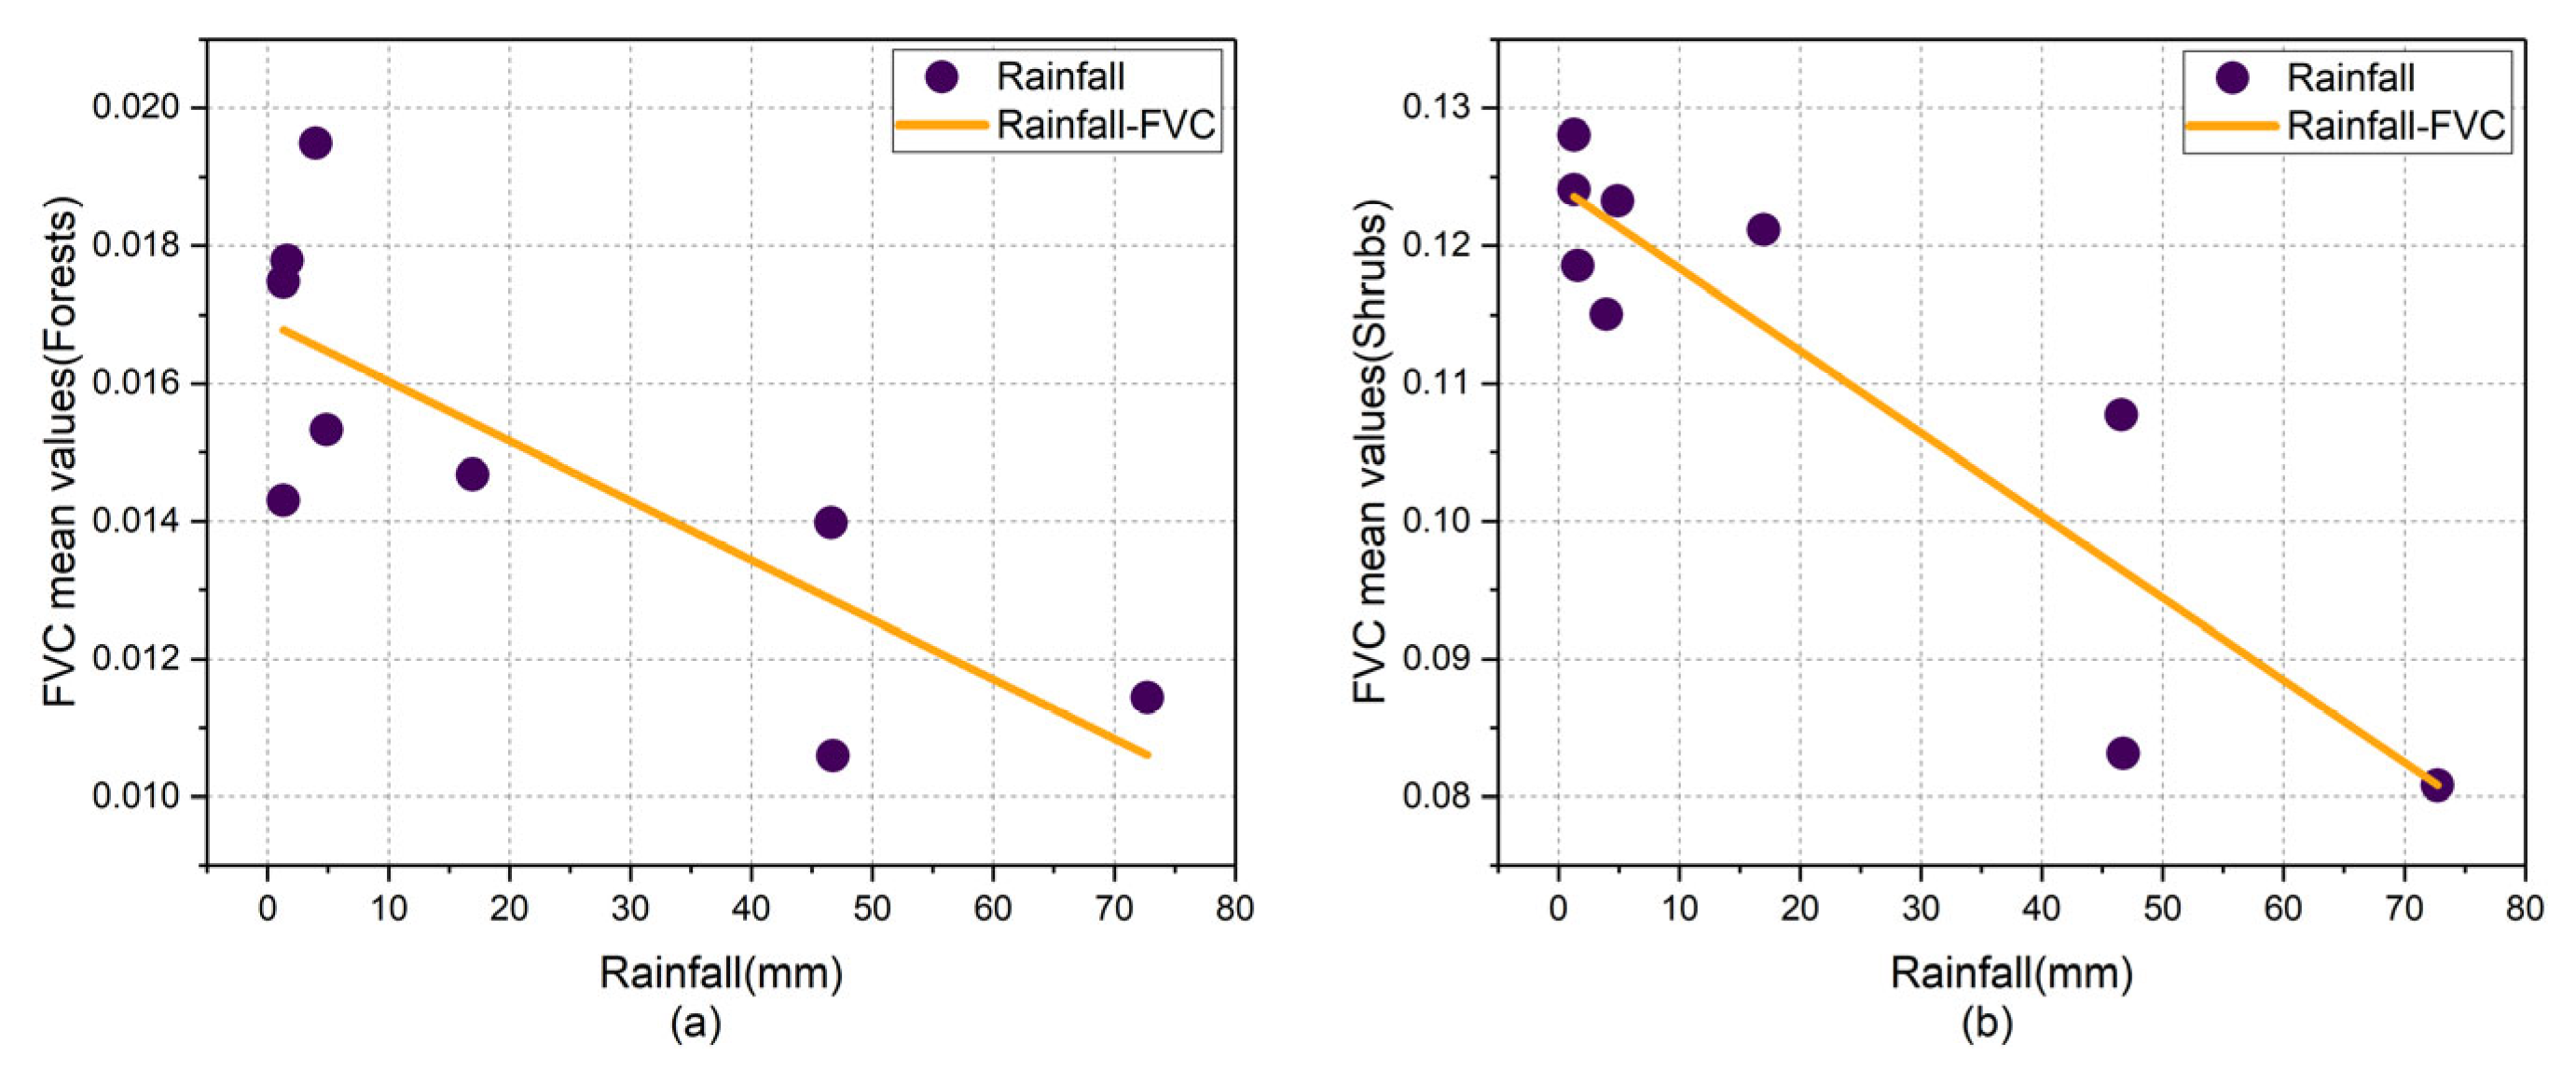
The typical Mediterranean climate brings about dry summers and wet winters, resulting in large seasonal variations in monthly rainfall in the study area. In this section, the relationship between rainfall and the regeneration of two vegetation communities is fitted, respectively (Figure 9). The results show that the relationship between rainfall and vegetation regeneration was significant (R2 was 0.63 and 0.82, respectively). However, the rainfall gradually decreased at the end of winter, and the increasingly arid environment had an obvious negative impact on the regeneration of the forest and shrub communities.
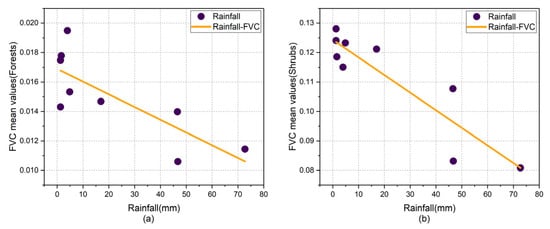
Figure 9.
Rainfall and vegetation regeneration relationship map: (a) forests-rainfall and (b) shrubs-rainfall.
Post-Fire Vegetation Regeneration—Daytime
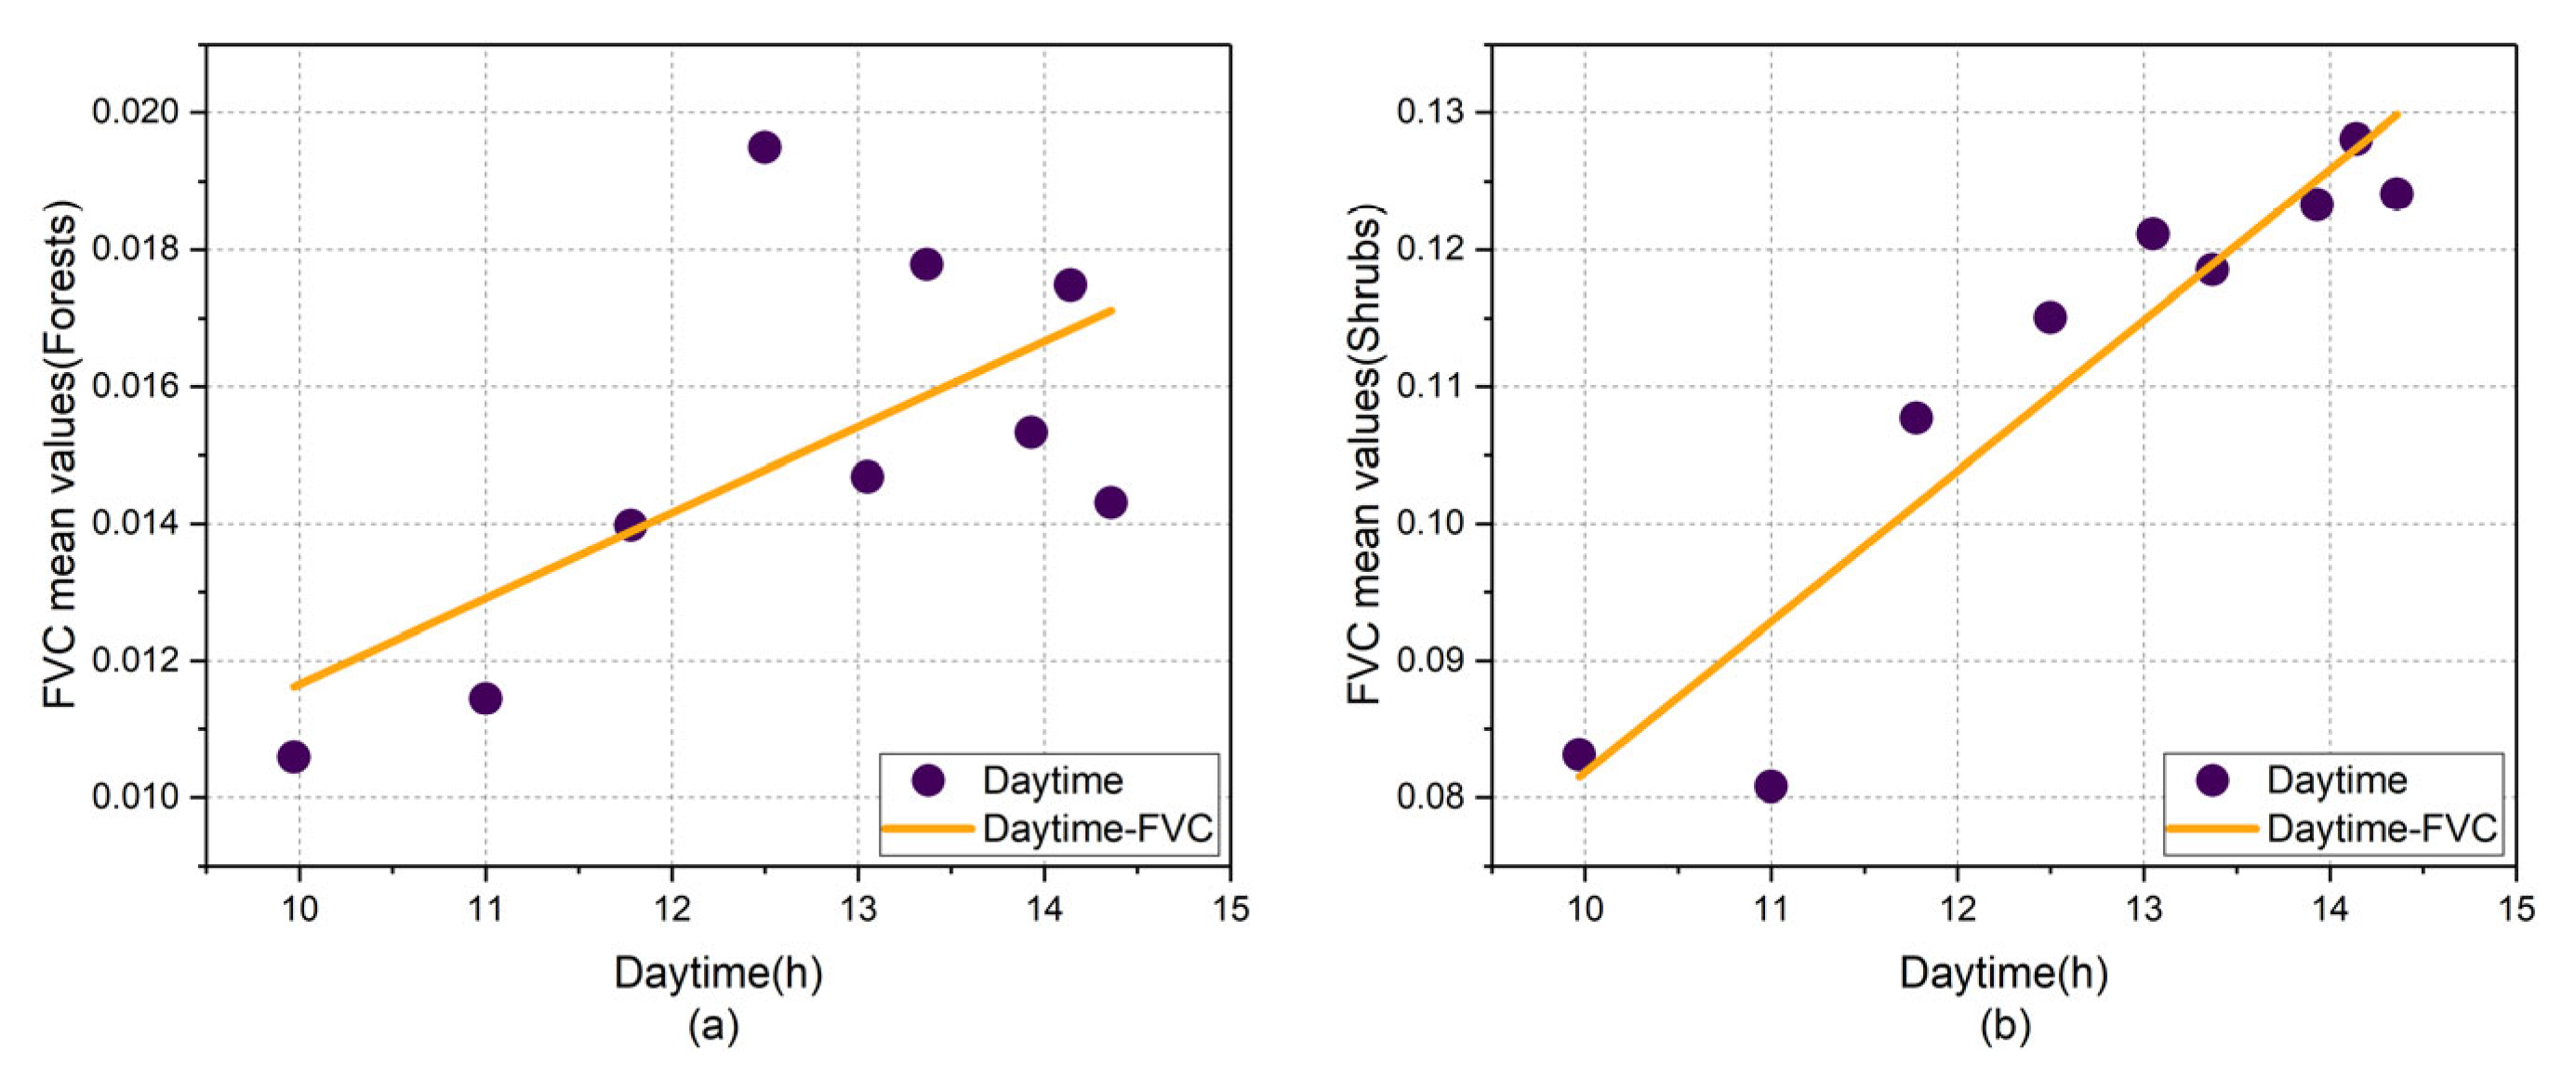
Light is a significant regulator during plant growth and development [74]. This section verify the effect between the monthly average daytime duration and the regeneration of the post-fire forest and shrub communities (Figure 10). The results show that daytime had a high relationship (R2 was 0.88) with the regeneration of shrubs. This indicates that the gradual increase in daytime from winter to summer provided favorable conditions for the regeneration of the shrub community. However, the forest community had a weaker relationship with daytime (R2 was 0.42), which may be because the forest community has more severely lost. In addition, light, as a regulatory factor, usually plays a role in the differentiation and vegetative growth of plant seedlings and affects the regeneration of vegetation [75]. Therefore, the high relationship between daytime duration and the regeneration of the shrub community may indicate that the shrub communities are more adaptable to fire ecology and that most vegetation was in a state of regrowth. This view also corroborates the results of the fast regeneration rate of the shrub communities in Section 4.1.
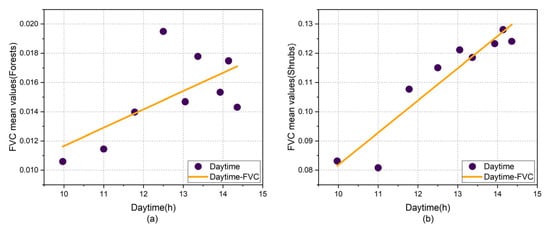
Figure 10.
Daytime and vegetation regeneration relationship map: (a) forests-daytime and (b) shrubs-daytime.
In addition to the effects of climate factors on vegetation regeneration discussed above, the P−P plots of residuals were obtained for the FVC and Climate factors to test the assumption of normality (Figure 11). It is evident from the figure that data points lie very close to the diagonal line, which indicates that residuals are normally distributed. These showed that there were no significant deviations from the assumptions of normality for the error terms associated with the regression models. The residual analysis performed therefore provides a good validation of the regression models [76,77].


Figure 11.
P−P plot of regression standardized residuals: (a) FVC (forests)-temperature; (b) FVC (forests)-rainfall; (c) FVC (forests)-daytime; (d) FVC (shrubs)-temperature; (e) FVC (shrubs)-rainfall; and (f) FVC (shrubs)-daytime.
Post-Fire Vegetation Regeneration—Aspect and Slope
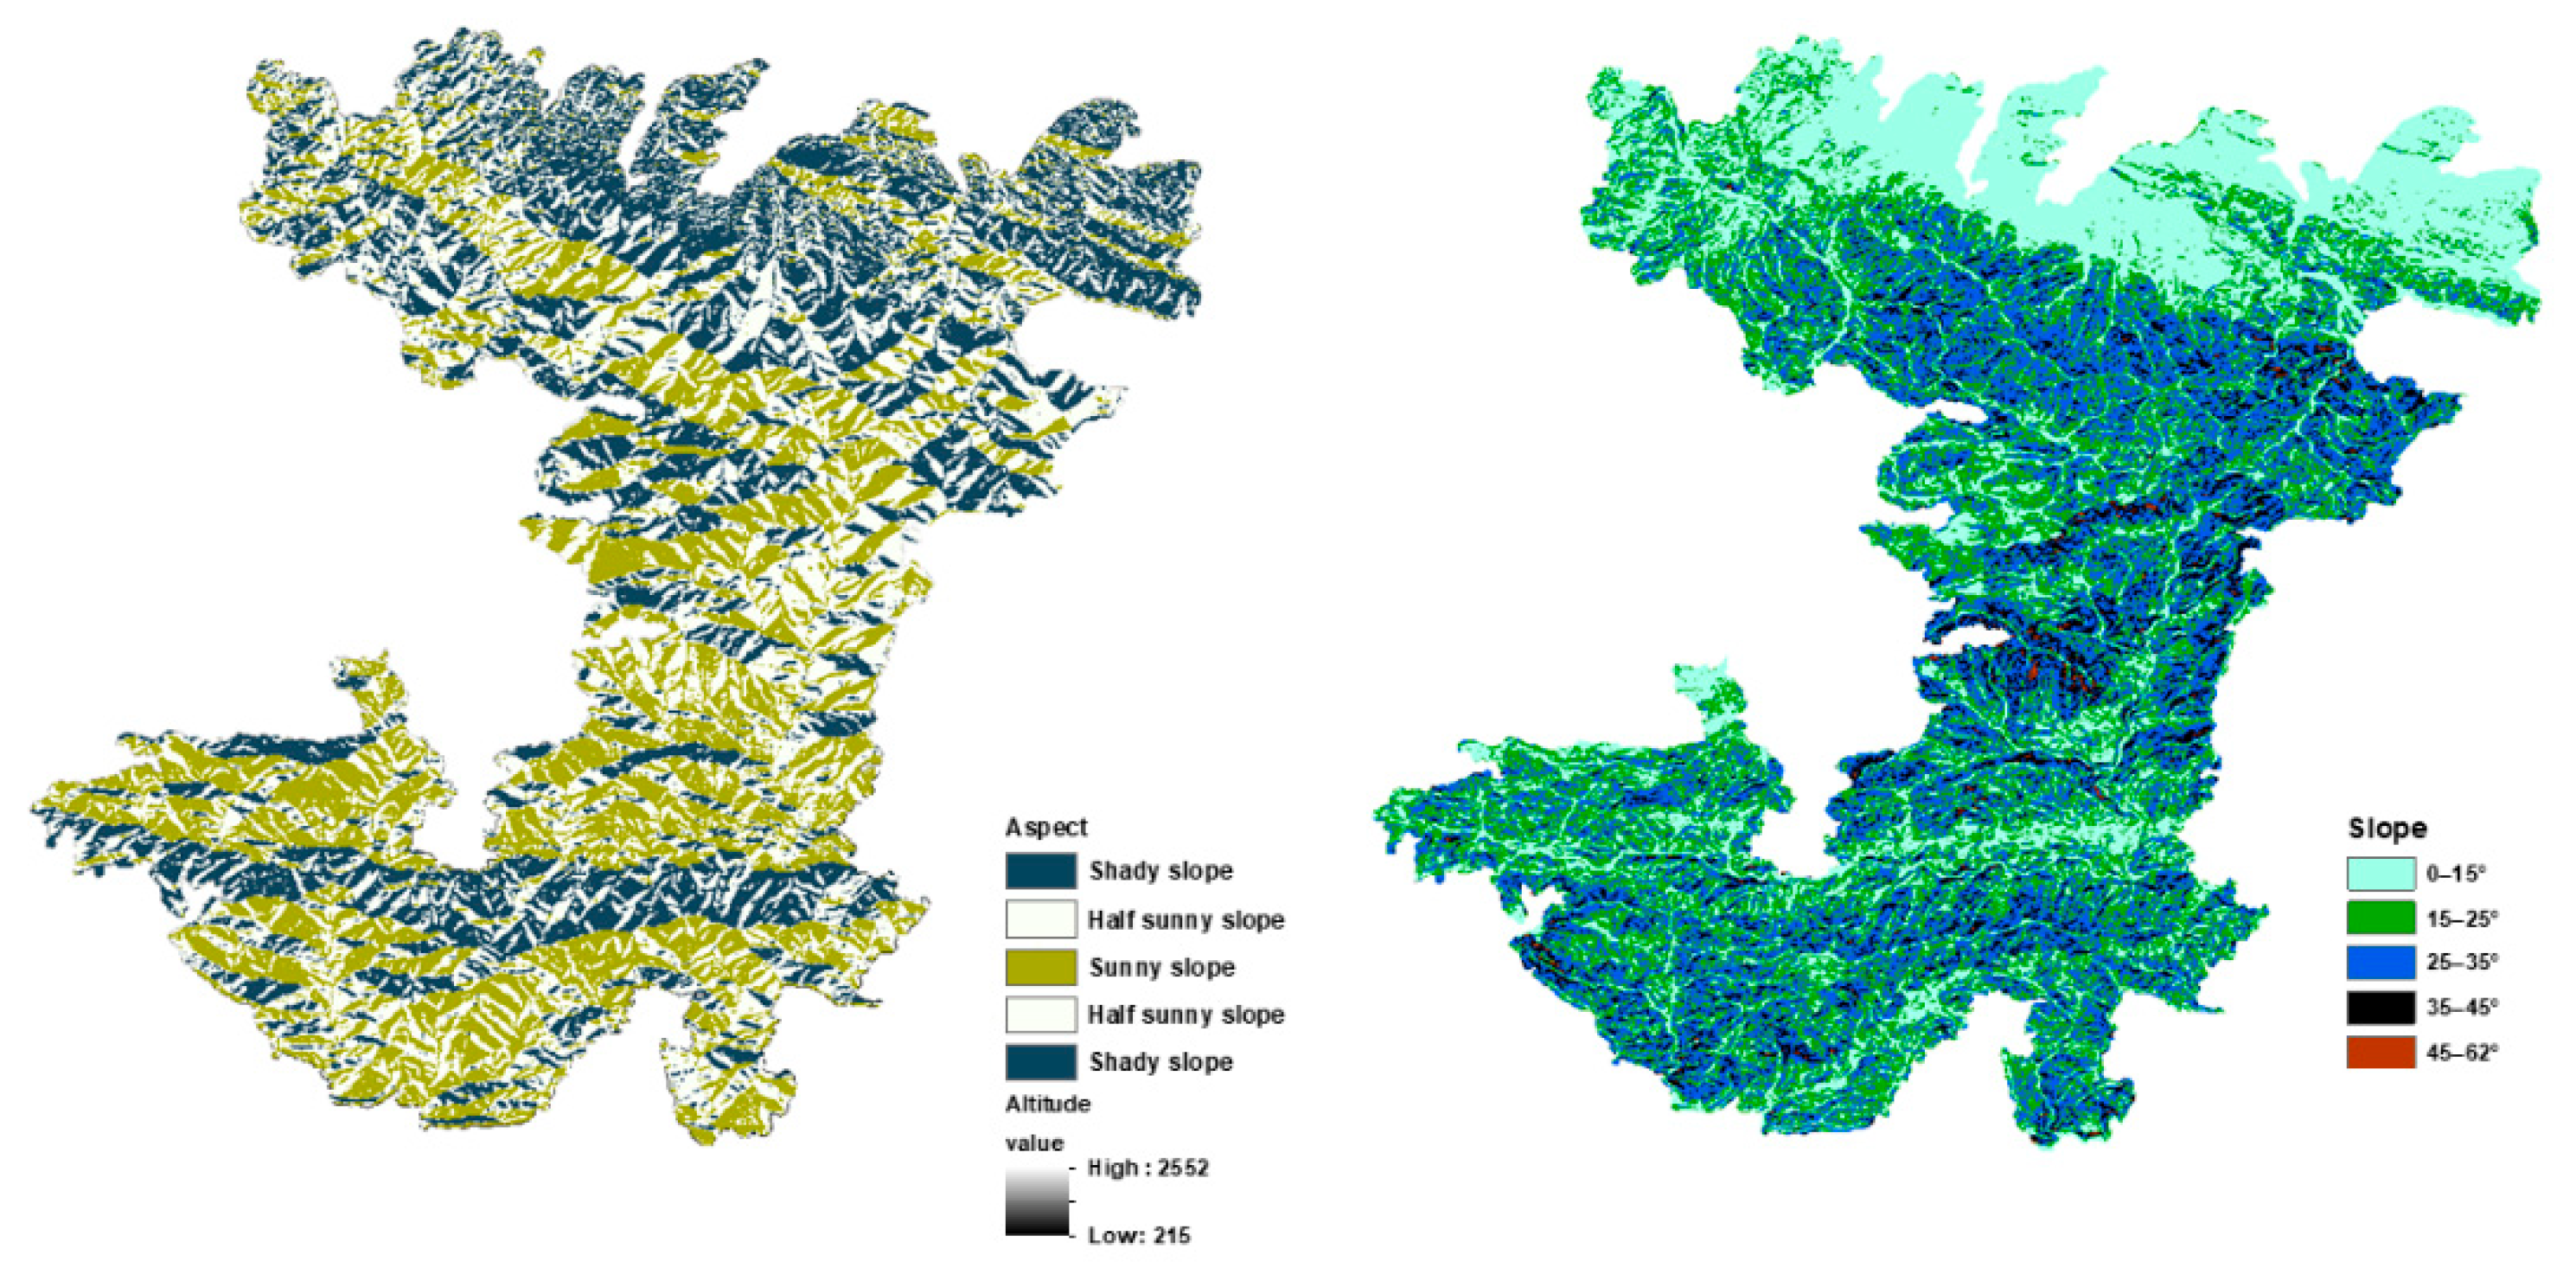
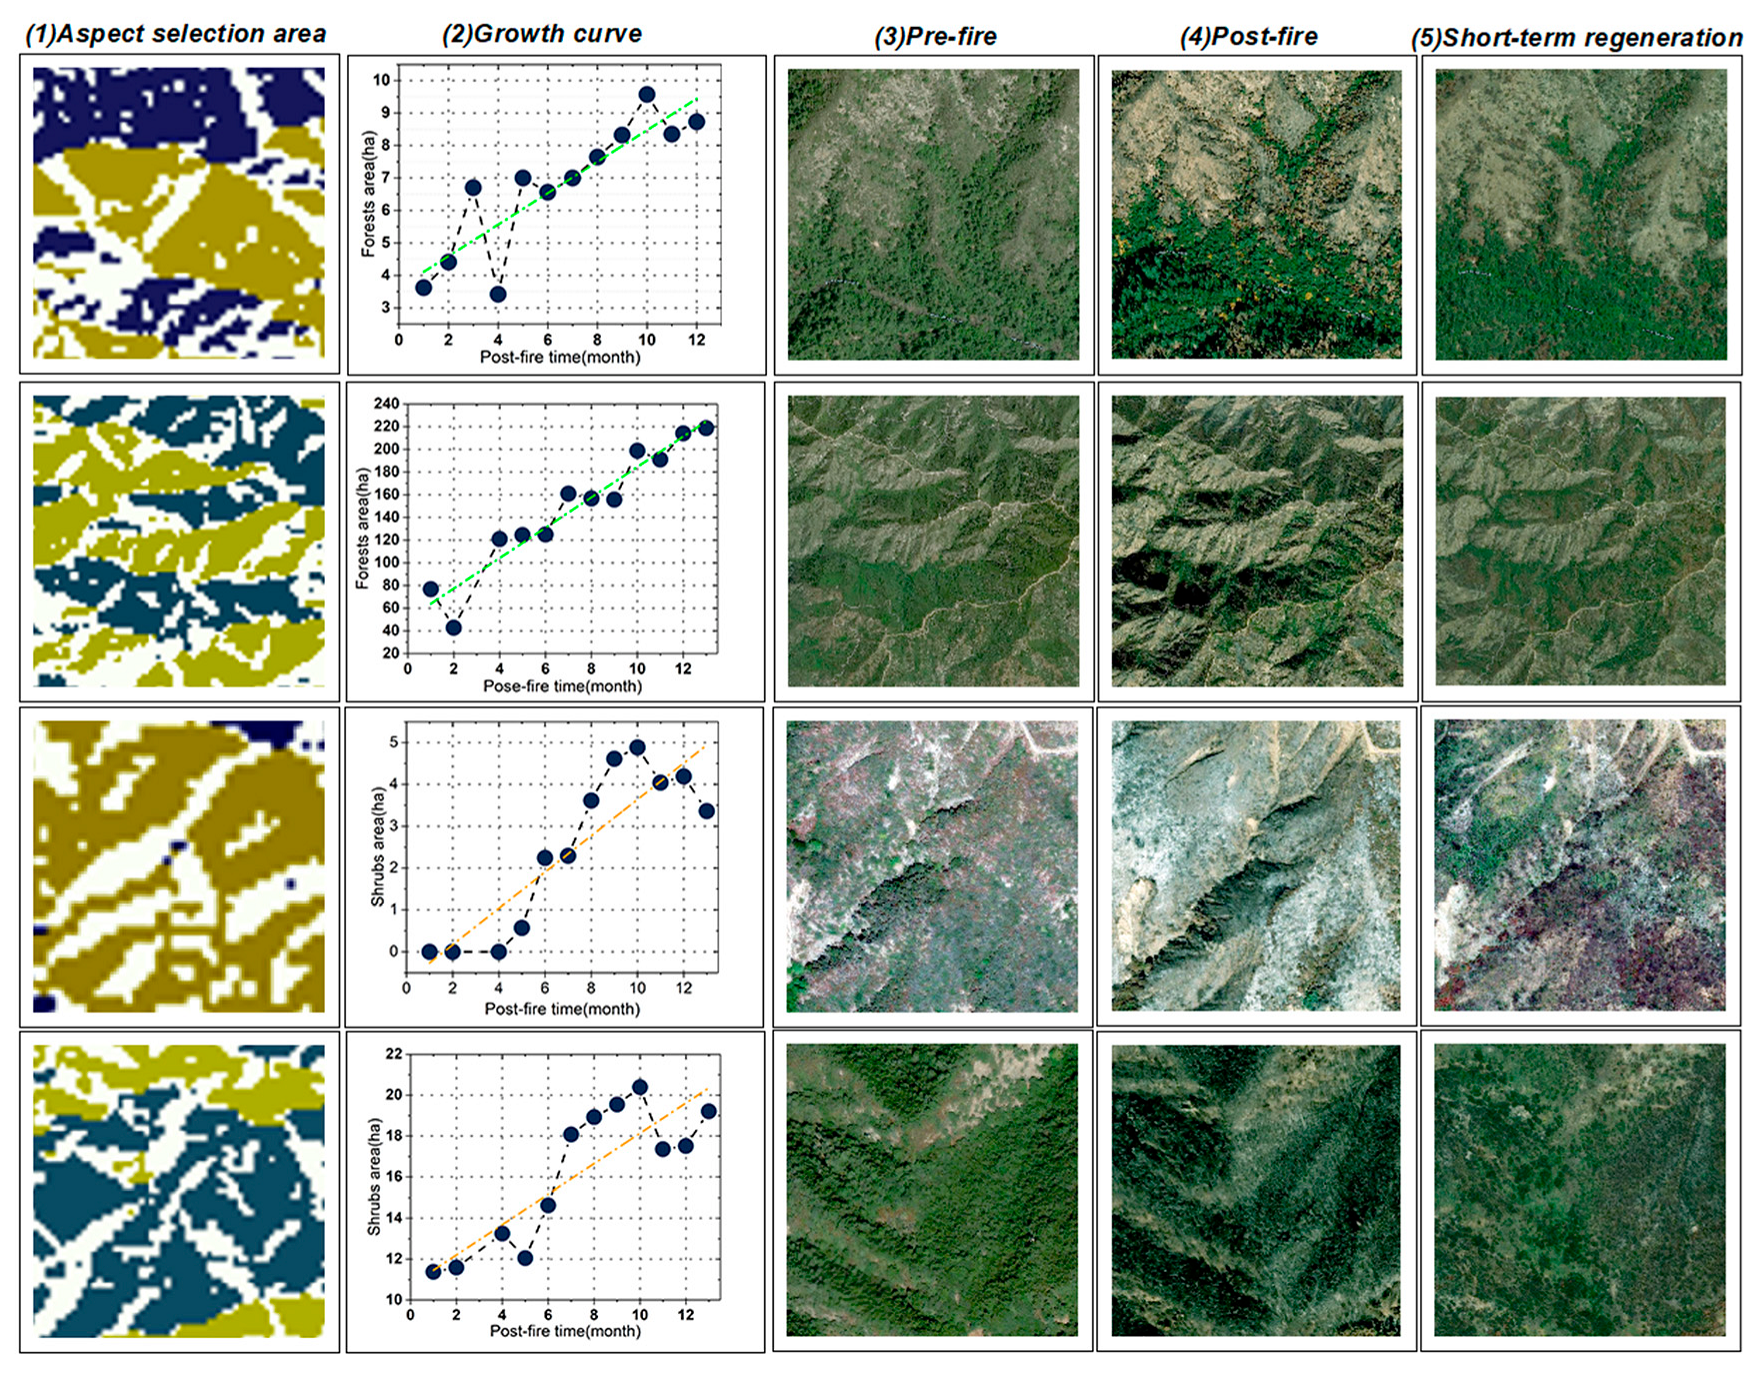
This section uses 30 m DEM data and July 2020 S2 image to draw a slope and aspect map (Figure 12). We combine the 0.5 m resolution historical images provided by ESRI in the three stages of the pre-fire (June 2020), post-fire (April 2021), and short-term regeneration (December 2021), create four masks for forests and shrubs on shady and sunny slopes, respectively, and nested the mask samples within the time-series images to verify the impact of slope and aspect on the regeneration of the forests and shrubs (Figure 13). The results show that the regeneration of the forest and shrub communities showed a positive response to the slope aspect. Among them, the growth of forest communities on sunny slopes fluctuates greatly and radically; while on shady slopes, it grows stably in a step-like manner. The shrub communities grow fast on shady slopes and grow stably on sunny slopes. This may be because light is one of the most important factors for forest regeneration, while shrubs require more humidity. Second, through the trapezoidal growth trend of the two types of vegetation in relatively unfavorable environments, it is found that forest and shrub vegetation have a certain degree of gradual adaptability to fire ecology, but the adaptability of shrubs is greater. In addition, most of the terrain in the study area is a fault mountain range, and the slope fluctuates greatly. Through observation of the time-series vegetation regeneration map, it is found that the optimal regeneration slope is 15–35°.
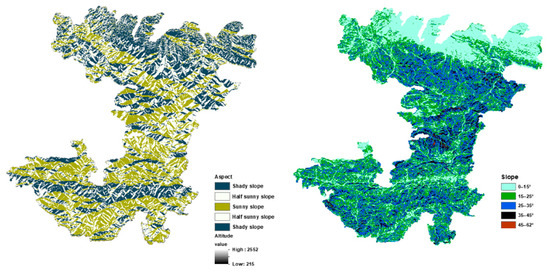
Figure 12.
Slope and aspect map of the study area.
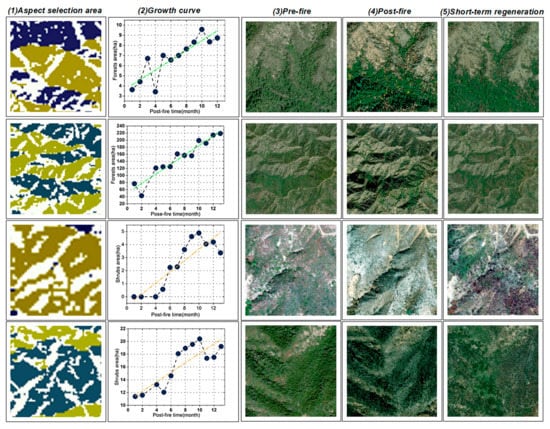
Figure 13.
Sunny and shady slope vegetation community regeneration map. The order is: forests—sunny slope; forests—shady slope; shrubs—sunny slope; and shrubs—shady slope.
4.2.2. Multiclass Factor Analysis of the Climate Factors
The regeneration of vegetation is actually related to multiple factors. The method of predicting jointly using an optimal combination of multiple climate factors is more realistic than using only one independent variable (Table 7). In addition, univariate analysis in Section 4.2.1 could not explain which climate factors played a more significant role in forests and shrubs regeneration. Therefore, this section adopts a multiple linear regression model to comprehensively analyze the three climate factors. The influence of climate factors on vegetation regeneration was judged by the significance level (p-value < 0.05). To this end, this paper selects the data into February 2021–October 2021 for verification. The regression model is defined as Equation (5):
where L is the regeneration area of vegetation; represents a constant coefficient; X denotes temperature; Y is rainfall; Z stands for daytime; and – are constant coefficients corresponding to the three factors.
The regression analysis results for the vegetation regeneration period (February 2021–October 2021) show that (Table 8) the regression model had significant statistical significance (forest: F-test= 16.6, p = 0.01 < 0.05, R2 = 0.96; shrub: F-test= 21.01, p = 0.007 < 0.05, R2 = 0.97). The results of the significance test showed that rainfall and daytime duration had significant effects on the regeneration of forest communities (p = 0.002); for shrub communities, only rainfall was significant (p = 0.005).

Table 8.
Vegetation regeneration period model results.
4.3. Quantify the Relationships between Burn Severity and Post-Fire Vegetation Regeneration Rate
Wildfire, as a significant environmental factor in forest ecosystems, is a key driver of the evolution of vegetation communities [78,79]. To quantify the relationship between the severity of the burn and vegetation community regeneration, we extracted five fire areas with different burn severities based on the dNBR index according to the dNBR threshold classification proposed by the European Forest Fire Information Service (EFFIS), including unburned/very low, low, moderate, high, and very high. These were nested in 13 time-series vegetation images to enable us to observe and quantify the regeneration area and the rate of growth of each vegetation under different burn severities and to compare the regeneration rate between the normal growth state (no severity) and the vegetation regeneration in low, moderate, high, and very high severity areas.
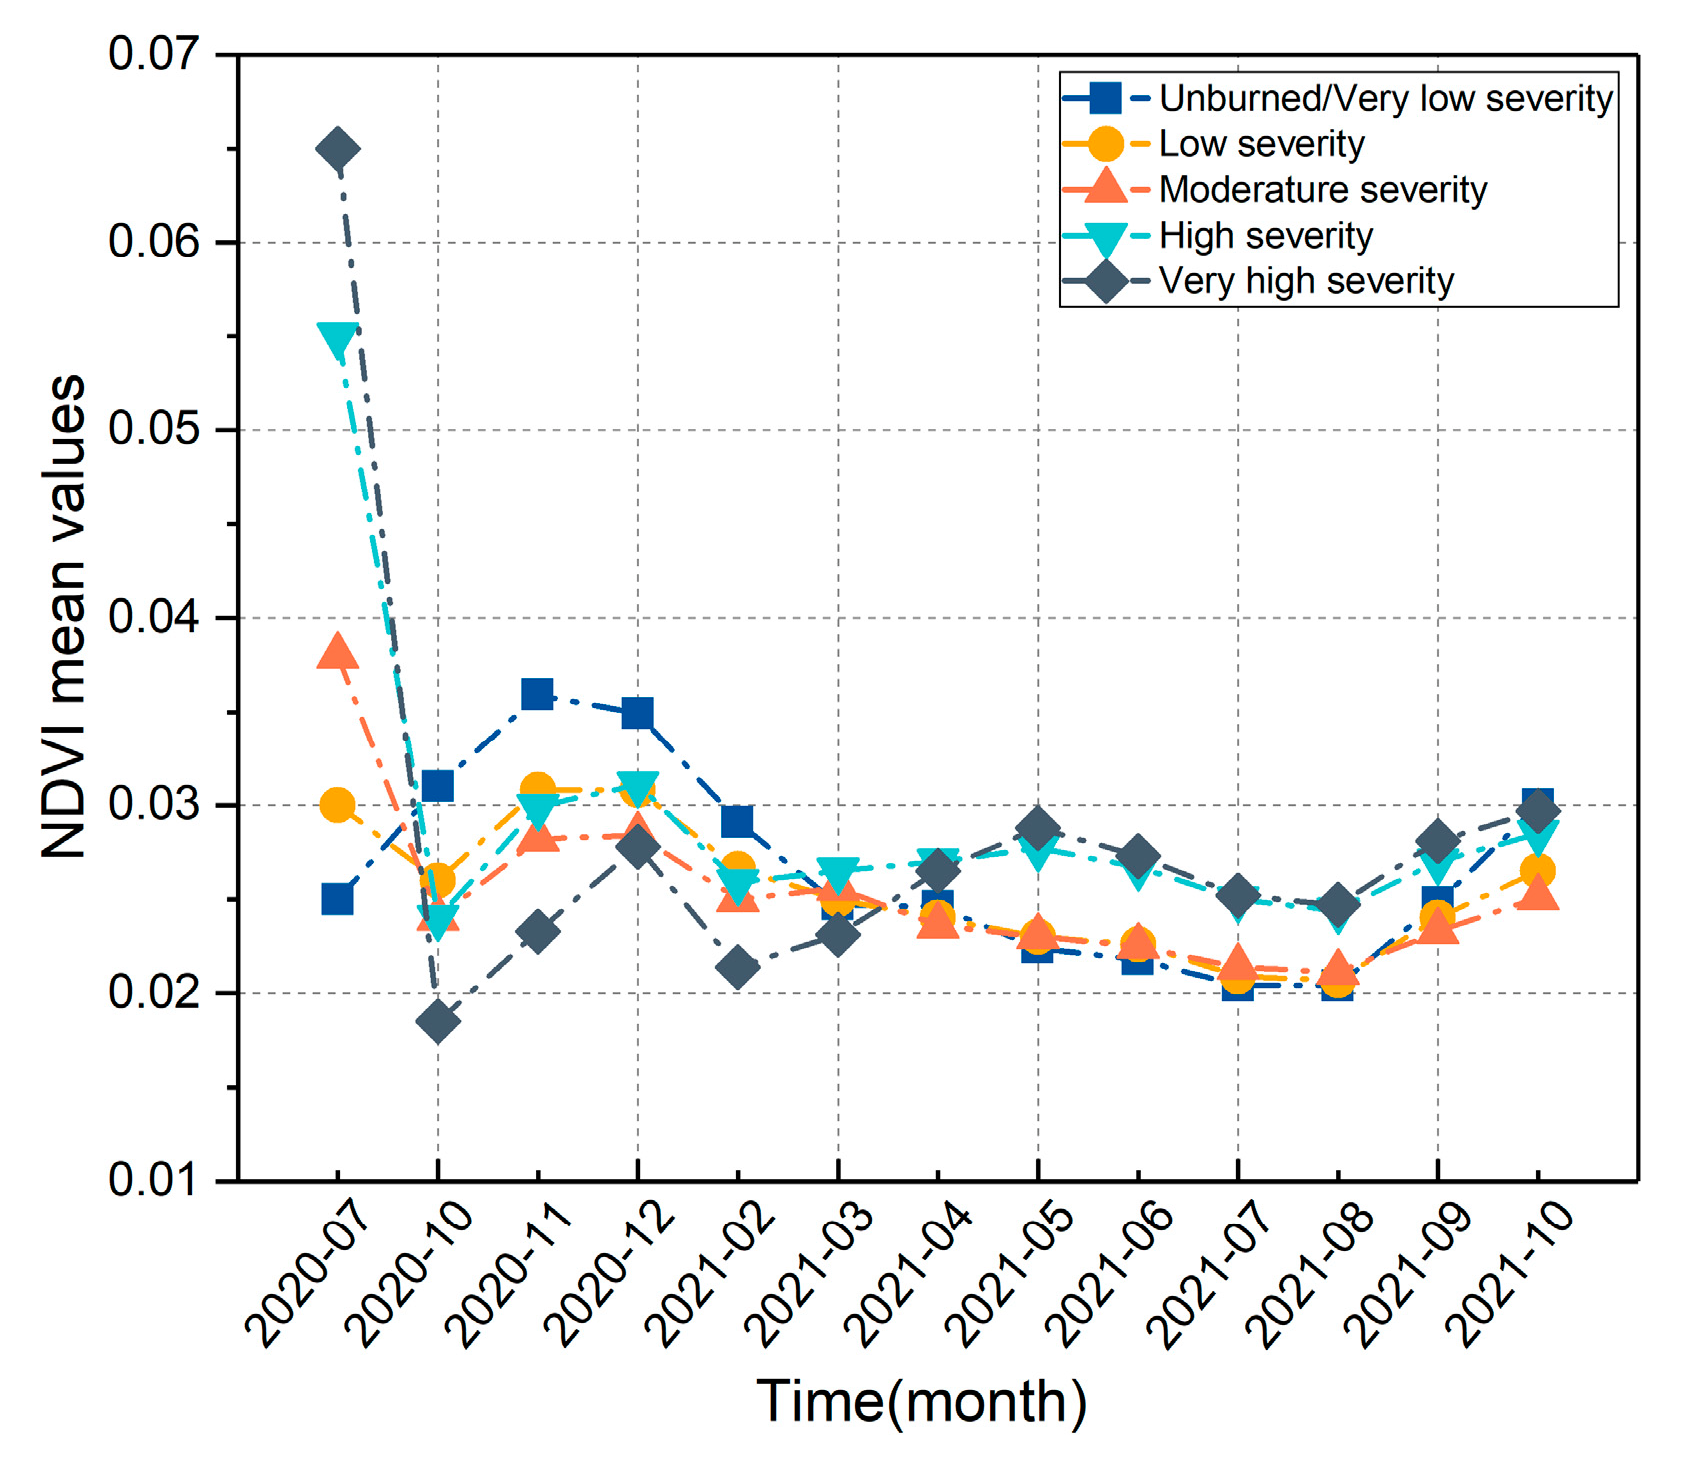
Since NDVI is positively correlated to vegetation cover [80], it effectively provides a good way for monitoring vegetation regeneration. We have monitored the fluctuation of time series NDVI under different burn severities (NDVI values are monthly averages). Figure 14 shows that the instantaneous drop of post-fire NDVI (October 2020) is significantly related to burn severities (the more serious the burn, the greater the drop). In addition, in the early stage of the fire (October 2020–February 2021), the NDVI value in the unburned/very low severity area was the highest, which is likely due to the contribution of the forest community; and in the late stage of the fire (April 2021–August 2021), the NDVI in the high and very high severity area were the highest, which may be due to the contribution of the shrub community. Finally, by measuring the growth rate of NDVI at different burn severities, we found that the growth rate ranked from high to low as: very high severity > high severity > moderate severity > low severity > unburned/very low severity.
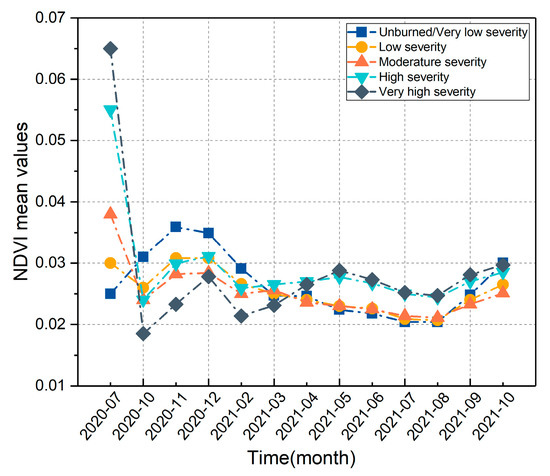
Figure 14.
NDVI under different burn severities.
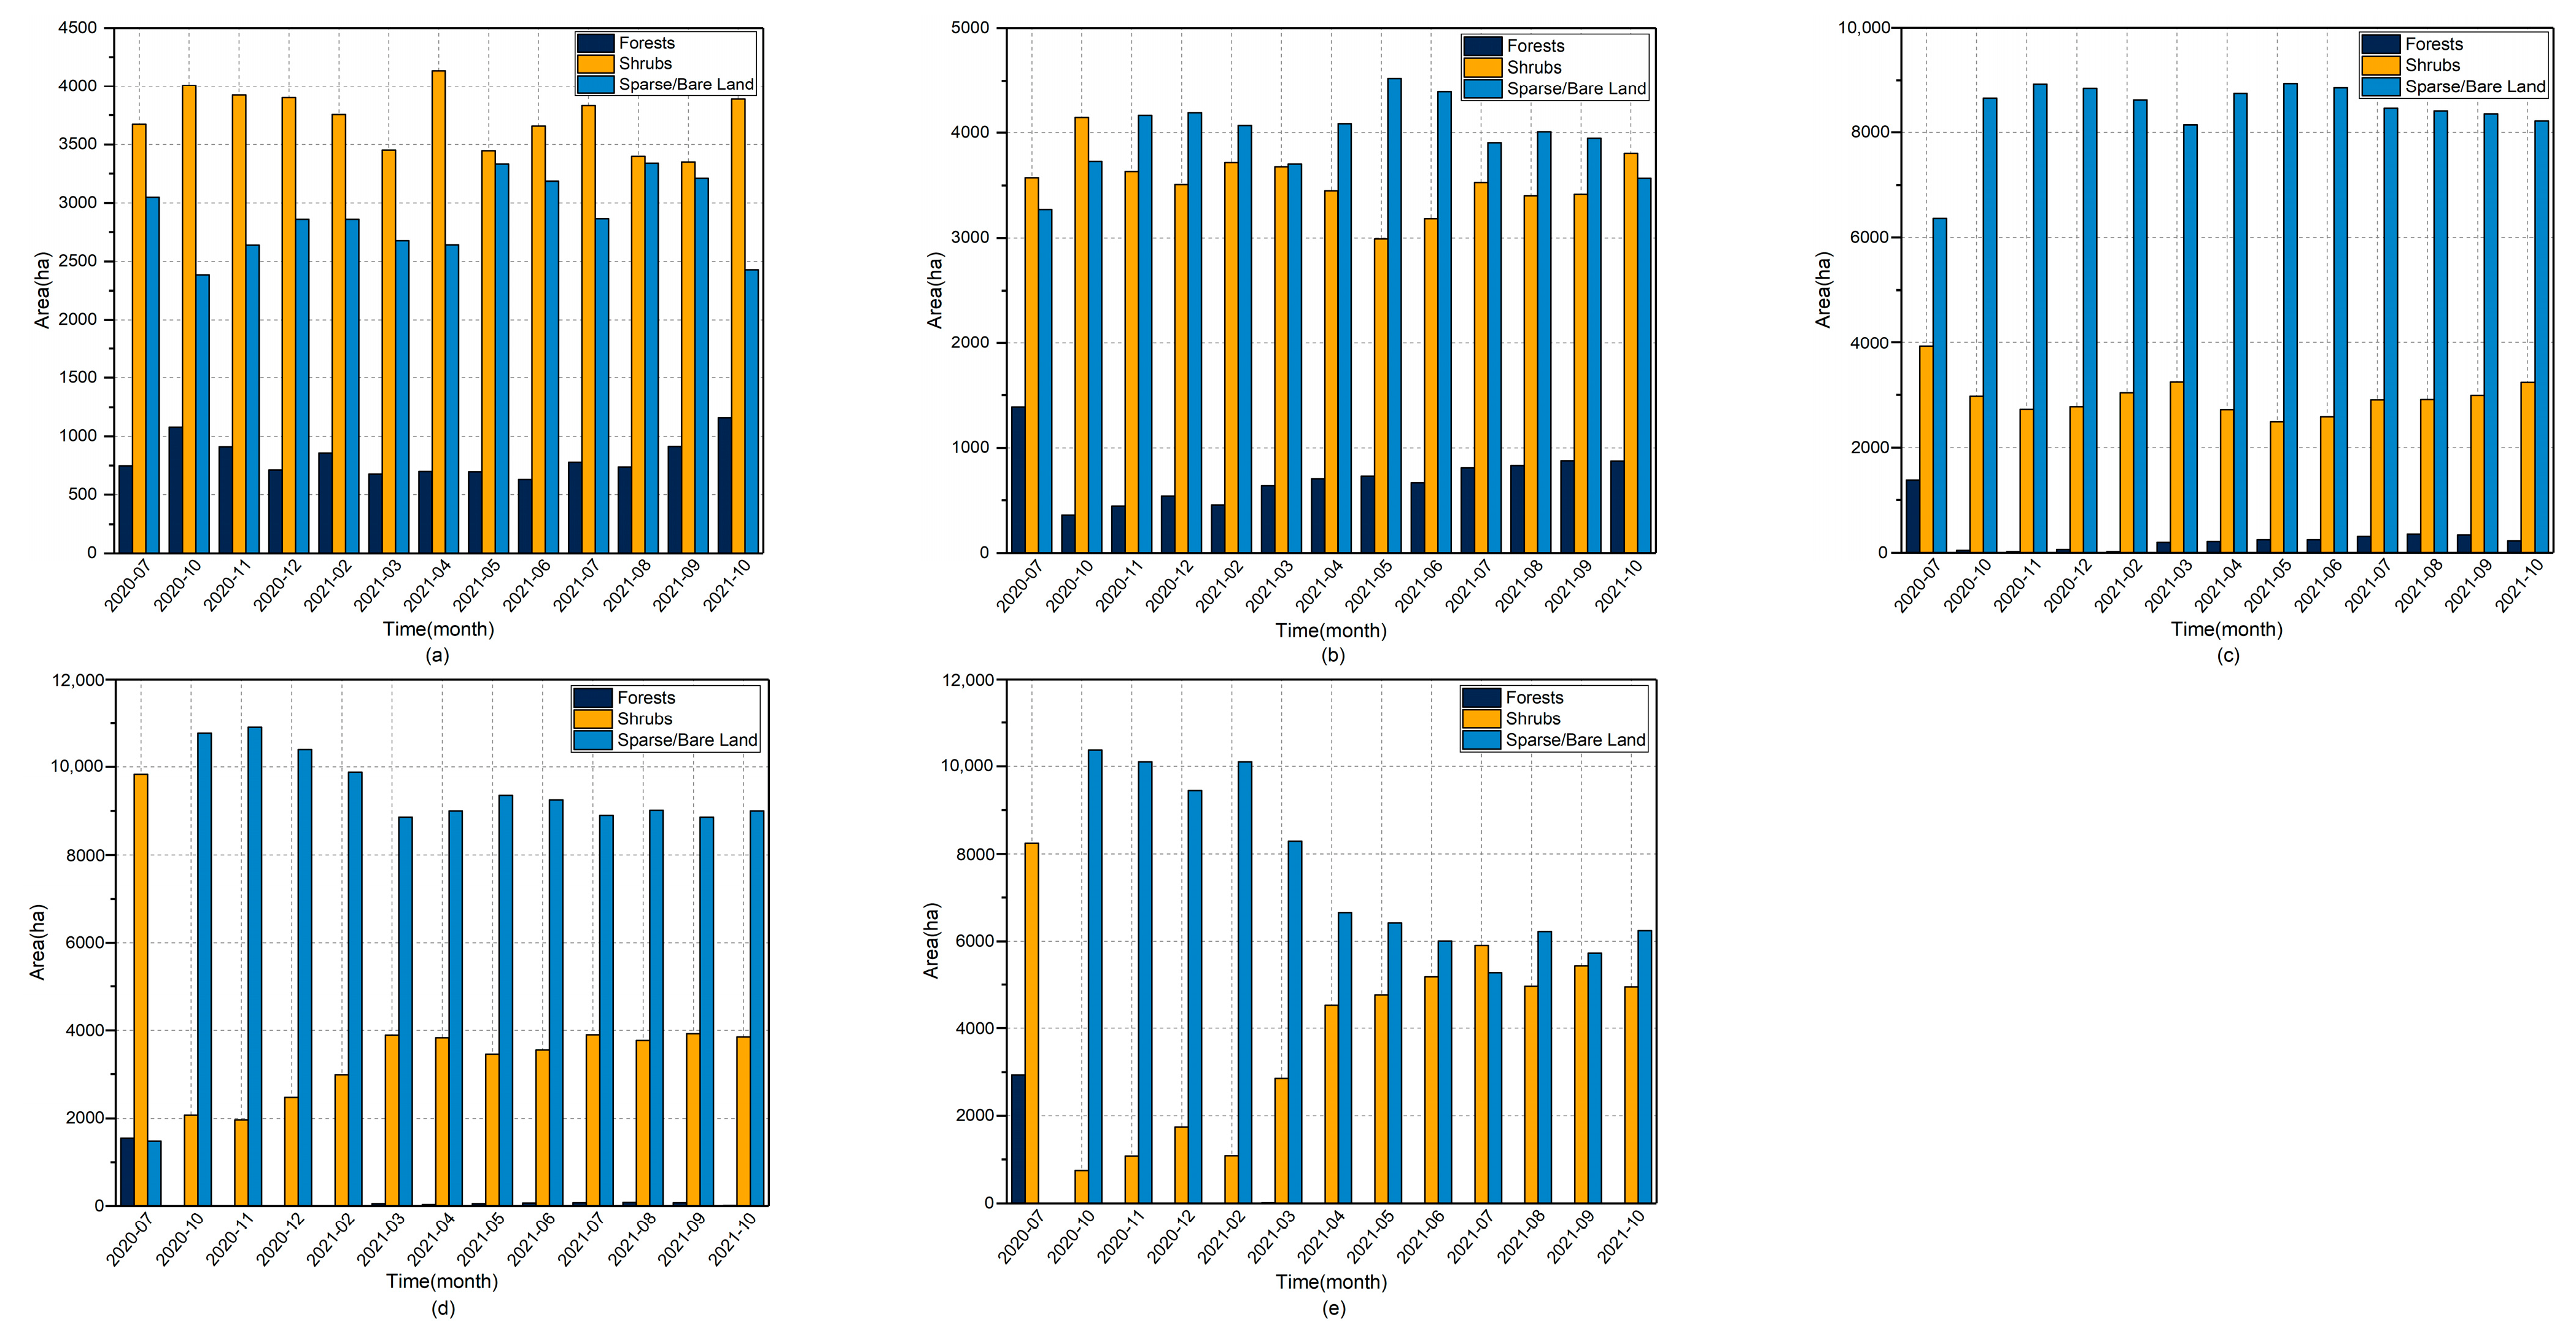
Figure 15 shows that shrub communities grew well in the unburned/very low and low burned areas, with an average growth rate of 16.64 hectares/month and 17.91 hectares/month, respectively. In the low severity area, the regeneration rate of forest communities increased to 42.79 hectares/month (approximately 6.37 times higher than in the unburned area), while the regeneration rate of shrub communities was not significant. The regeneration rate of shrub communities gradually increased from the high burning area to the very high burning area, with an average growth rate of 178.18 hectares/month and 419.01 hectares/month, respectively (approximately 10.71 and 25.18 times higher than in the unburned area). However, in these burning areas, forest communities had almost no obvious regeneration.
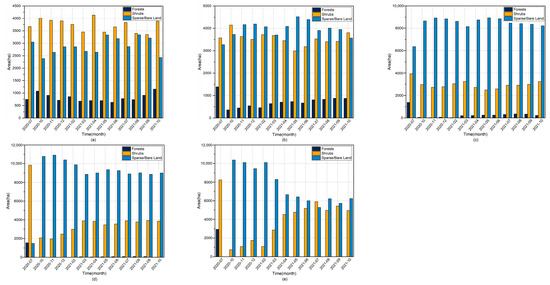
Figure 15.
Vegetation regeneration under different burn severities: (a) unburned/very low; (b) low; (c) moderate; (d) high; and (e) very high.
5. Discussion
Ascertaining the effects of burn severity and environmental factors on the early resto-ration of forest ecosystems is the first important step in ecosystem regeneration and species protection [81,82,83,84,85]. In this study, we used Sentinel-2(MSI) intensive time-series imagery to explore the regeneration changes in post-fire forest and shrub communities in the year on a wide spatial scale. The independent and combined effects of climate factors on vegetation regeneration is emphasized in our work.
Using the dNBR threshold as a criterion for the classification of the burn severity has a high accuracy. The differential normalized burning index (dNBR), which includes NIR and SWIR spectral bands, is commonly used for monitoring burn areas [86,87,88]. The European Forest Fire Information System (EFFIS) provides a threshold classification standard based on the dNBR index, which is very useful for determining burning area and degree [89,90]. In addition, previous studies have shown that dNBR is more accurate with higher resolution than other indices [91,92,93]. For example, Llorens et al. (2021) found that the burning estimation results of Sentinel-2 in the Spanish forest fire in 2017 were 10% higher than those of MODIS. In remote sensing image processing, the K-Means clustering algorithm can also attain good analytical results by controlling the threshold of dNBR through the cluster centers of different clusters [94,95]. Therefore, this study used Sentinel-2 images to compare the classification results based on the dNBR threshold index with the K-Means clustering algorithm. The results show that the overall accuracy based on the dNBR threshold was improved by approximately 4.67%. The K-Means clustering method overestimates the area of the undamaged region, which may be limited due to the spatial resolution of the image.
The NBR is the best index for vegetation classification in this study (OA: 92.3%–99.5%), but this does not deny the classification effect of other indexes [96,97,98]. In addition, previous research has shown that ground feature classification combined with spectral index, spatial features, and other indicators is significantly effective [99,100,101]. In this study, a new classification method was applied: (1) five vegetation indexes were pre-classified with the K-Means method. This step visually filtered some indexes that are difficult to cluster (such as the EVI index in this study); (2) the pre-classified image was superimposed with the spectral information of ground objects. By using the SVM classification algorithm, these mixed pixels were further filtered, and the classification accuracy was improved. According to the results, the classification accuracy based on the SVM is approximately 6.6% higher than that of K-Means, and the main confusion part is between shrub communities and sparse bare land.
The severity of burns and climate change affected the early forest regeneration process [102,103]. The remote sensing characterization of burn severity and climate factors shows that the first post-fire growing season may be a key element in vegetation regeneration. Temperature, rainfall, and daytime have significant effects on vegetation regeneration (R2 is 0.42–0.88) [104,105,106]. The results also show that there was a significant relationship between burn severity and forest regeneration rate in the whole study area [107,108,109]. Forest and shrub communities in the study area have high adaptability to post-fire ecology and the species competition started immediately [110,111,112]. For example, Figure 13 shows that tolerable low-severity burns can positively promote the regeneration of forest communities (the regeneration rate increases by 6.37 times). However, the high-severity burn causes almost no regeneration of forest communities, while the shrub communities show rapid growth (the rate increases by 19.37 times). This may be because forest communities can maintain growth dominance in low-severity areas. However, with the gradual increase in burning degrees, this advantage eventually weakens to the lowest in the high-severity area, resulting in the high-speed growth of shrub communities. The study area has a Mediterranean climate, which is mild and rainy in winter, and hot and dry in summer. Through multivariate regression analysis, it was found that the two vegetation communities had a significant need for rainfall in the regeneration period (February 2021 to October 2021). Rainfall was the only significant factor for shrub community growth, and both daytime and rainfall acted on the regeneration of forest communities. Furthermore, terrain and other factors also have an important impact on vegetation regeneration [113,114]. By randomly sampling on a spatial scale, we found that the best slope for vegetation regeneration was 15–35°. Slope direction has no obvious effect on forest communities, while shrub communities tend to grow on the shady slopes. This is probably because shady slopes are conducive to maintaining humidity for shrub communities.
There are some uncertainties in this study. First, we only used the S2 satellite, which is limited in terms of spatial resolution and spectral precision. In addition, the January 2021 image data were not included in this study due to quality issues, such as clouds and shadows. However, from another point of view, this limitation was also an advantage. Our method shows that vegetation regeneration research conducted over a wide range of space can still be completed using medium-resolution S2 images, despite the lack of high-resolution sensors [115,116]. The high timeliness return visit cycle of the S2 satellite also provided an early intensive time-series monitoring mode with strong timeliness in this study. Second, as the division map of burn severity was not officially released, the accuracy verification could only rely on the overall accuracy and the accuracy of the dNBR threshold classification (OA: 94.87%).
There are two important insights to be drawn from our research. First, time-series monitoring with strong timeliness in the short term can better capture the early dynamics and trends of vegetation regeneration [117,118] and is conducive to the development of long-term strategies for forest adaptive management and vegetation protection. Second, the combination of vegetation index, pre-classification by K-Means, and the SVM classification algorithm with spectral information can effectively improve the classification accuracy, providing a new concept for the accurate classification of medium-resolution sensors. This work can provide valuable analysis and verification of the early regeneration of post-fire forests and can be used for adaptive management and the oriented cultivation of native dominant species.
6. Conclusions
In this study, we used the NBR as a spectral indicator to monitor vegetation communities in a time series, and used the dNBR index and SVM classification methods to smoothly map the distribution of forest and shrub communities across five burn severities combined with spectral features. First, the classification based on the dNBR threshold can effectively express 94.87% of the burning area. Furthermore, the vegetation classification overall accuracy based on the SVM algorithm is 6.6% higher than that of K-Means. Together, these studies provide insights into the interaction mechanisms between climate factors, topographic factors, burn severity, and the regeneration of the two vegetation communities. The results show that this method can effectively reflect the regeneration of the two vegetation communities. In total, 367 days of post-fire vegetation regeneration, the cumulative area of bare soil decreased by approximately 6511.9 hectares (around 12% for forests and 88% for shrubs). For forests, according to the analysis and quantification results, it was found that due to the increase in temperature and daytime duration in the first half of the year, the regeneration rate of forests in spring and summer was approximately 40 hectares/month more than in autumn and winter. In addition, the regenerated forests were mainly concentrated in the low-severity area (about 88%), indicating that the regeneration of forest communities not only has strong seasonality but that it could also be promoted by tolerable fire stimulation. For shrubs, it was found that they can grow at a high rate of 298.6 hectares/month on average due to overcoming and alleviating external restrictions; that is, the competitive inhibition of forests to shrubs that occurred in the low-severity areas was overcome in the medium- and high-severity areas. Furthermore, among the climate factors, both daytime and rainfall had a significant impact on forests’ regeneration, while rainfall was the only factor that had an effect on shrubs’ regeneration. In addition, according to the slope aspect data, the shrub communities mainly grew on shady slopes, which greatly alleviated the issue of insufficient humidity caused by drought, indicating that shrubs maintain high adaptability to fire ecology. Taken together, our findings contribute to a better understanding of the mechanisms and methods between environmental factors and burn severity. In addition, they provide ideas for adaptive management in forests with different vegetation communities according to climate and seasonal changes and burn severity in order to protect these precious forest resources.
Author Contributions
Q.L.: Conceptualization, methodology, software, data curation, writing—original draft, writing—review and editing; B.F.: Methodology, writing—review and editing, supervision; Z.C.: Writing—review and editing, funding acquisition, supervision; L.C. (Li Chen): Writing—review and editing, supervision; L.L.: Supervision; W.P.: Supervision; Y.L.: Supervision; L.C. (Lin Chen): Supervision. All authors have read and agreed to the published version of the manuscript.
Funding
This work was supported by the National Natural Science Foundation of China (Grant number 21976043) and the Guilin University of Technology Foundation (Grant number GUTQDJJ20172017075).
Data Availability Statement
The data that support the findings of this study are openly available in (1) https://glovis.usgs.gov/, accessed on 10 December 2021; (2) https://weatherspark.com, accessed on 11 December 2021; (3) http://www2.jpl.nasa.gov/srtm/, accessed on 20 October 2021; (4) http://land.copernicus.eu, accessed on 11 December 2021.
Acknowledgments
The principal author appreciates the Sentinel-2 images of the European Space Agency and U.S. Geological Survey provided; Meteorological data of Weather spark; Historical images of Google Earth and ESRI. We appreciate anonymous reviewers for their constructive comments which help improve the quality of this manuscript.
Conflicts of Interest
The authors declare that they have no known competing financial interest or personal relationship that could have appeared to influence the work reported in this paper.
References
- Burke, M.; Driscoll, A.; Heft-Neal, S.; Wara, M. The changing risk and burden of wildfire in the United States. Proc. Natl. Acad. Sci. USA 2021, 118, e2011048118. [Google Scholar] [CrossRef] [PubMed]
- National Interagency Fire Center. Wildland Fire Statistics. Available online: https://www.nifc.gov/fireInfo/fireInfo_statistics.html (accessed on 25 June 2020).
- Vogler, K.C.; Ager, A.A.; Day, M.A.; Jennings, M.; Bailey, J.D. Prioritization of forest regeneration projects: Tradeoffs between wildfire protection, ecological regeneration and economic objectives. Forests 2015, 6, 4403–4420. [Google Scholar] [CrossRef] [Green Version]
- James, J.N.; Kates, N.; Kuhn, C.D.; Littlefielda, C.E.; Millera, C.W.; Bakkera, J.D.; Butmanab, D.E.; Haugo, R.D. The effects of forest regeneration on ecosystem carbon in western North America: A systematic review. For. Ecol. Manag. 2018, 429, 625–641. [Google Scholar] [CrossRef]
- Huffman, D.W.; Roccaforte, J.P.; Springer, J.D.; Crouse, J.E. Regeneration applications of resource objective wildfires in western US forests: A status of knowledge review. Fire Ecol. 2020, 16, 18. [Google Scholar] [CrossRef]
- Meng, R.; Dennison, P.E.; Huang, C.; Moritz, M.A. Effects of fire severity and post-fire climate on short-term vegetation regeneration of mixed-conifer and red fir forests in the Sierra Nevada Mountains of California. Remote Sens. Environ. 2015, 171, 311–325. [Google Scholar] [CrossRef]
- Coop, J.D.; Parks, S.A.; McClernan, S.R.; Holsinger, L.M. Influences of prior wildfires on vegetation response to subsequent fire in a reburned Southwestern landscape. Ecol. Appl. 2016, 26, 346–354. [Google Scholar] [CrossRef]
- Carlson, A.R.; Sibold, J.S.; Assal, T.J.; Negrón, J.F. Evidence of compounded disturbance effects on vegetation regeneration following high-severity wildfire and spruce beetle outbreak. PLoS ONE 2017, 12, e0181778. [Google Scholar] [CrossRef] [Green Version]
- Copeland, S.M.; Munson, S.M.; Bradford, J.B.; Butterfield, B.J. Influence of climate, post-treatment weather extremes, and soil factors on vegetation regeneration after regeneration treatments in the southwestern US. Appl. Veg. Sci. 2019, 22, 85–95. [Google Scholar] [CrossRef] [Green Version]
- GREEN Visualized: Historical Trends in Global Monthly Surface Temperatures (1851–2020). Available online: https://www.visualcapitalist.com/global-temperature-graph-1851-2020/ (accessed on 30 January 2021).
- World Meteorological Organization (WMO). The State of the Global Climate 2020. Available online: https://public.wmo.int/en/our-mandate/climate/wmo-statement-state-of-global-climate (accessed on 28 June 2021).
- Zhuang, Y.; Fu, R.; Santer, B.D.; Hall, A. Quantifying contributions of natural variability and anthropogenic forcings on increased fire weather risk over the western United States. Proc. Natl. Acad. Sci. USA 2021, 118, e2111875118. [Google Scholar] [CrossRef] [PubMed]
- Fire Statistics. CAL FIRE. Available online: https://www.fire.ca.gov/incidents/2020/ (accessed on 2 January 2021).
- Applestein, C.; Caughlin, T.T.; Germino, M.J. Weather affects post-fire recovery of sagebrush-steppe communities and model transferability among sites. Ecosphere 2021, 12, e03446. [Google Scholar] [CrossRef]
- Donato, D.C.; Fontaine, J.B.; Campbell, J.L.; Robinson, W.D.; Kauffman, J.B.; Law, B.E. Conifer regeneration in stand-replacement portions of a large mixed-severity wildfire in the Klamath–Siskiyou Mountains. Can. J. For. Res. 2009, 39, 823–838. [Google Scholar] [CrossRef] [Green Version]
- Lacouture, D.L.; Broadbent, E.N.; Crandall, R.M. Detecting vegetation regeneration after fire in a fire-frequented habitat using normalized difference vegetation index (NDVI). Forests 2020, 11, 749. [Google Scholar] [CrossRef]
- Rodman, K.C.; Veblen, T.T.; Battaglia, M.A.; Chambers, M.E.; Fornwalt, P.J.; Holden, Z.A.; Kolb, T.E.; Ouzts, J.R.; Rother, M.T. A changing climate is snuffing out post-fire regeneration in montane forests. Glob. Ecol. Biogeogr. 2020, 29, 2039–2051. [Google Scholar] [CrossRef]
- De Faria, B.L.; Marano, G.; Piponiot, C.; Silva, C.A.; Dantas, V.d.; Rattis, L.; Rech, A.R.; Collalti, A. Model-based estimation of Amazonian forests regeneration time after drought and fire events. Forests 2020, 12, 8. [Google Scholar] [CrossRef]
- Young DJ, N.; Meyer, M.; Estes, B.; Gross, S.; Wuenschel, A.; Restaino, C.; Safford, H.D. Forest regeneration following extreme drought in California, USA: Natural patterns and effects of pre-drought management. Ecol. Appl. 2020, 30, e02002. [Google Scholar] [CrossRef]
- Whitman, E.; Parisien, M.A.; Thompson, D.K.; Flannigan, M.D. Short-interval wildfire and drought overwhelm boreal forest resilience. Sci. Rep. 2019, 9, 18796. [Google Scholar] [CrossRef] [Green Version]
- Meng, R.; Wu, J.; Zhao, F.; Cook, B. Measuring short-term post-fire forest regeneration across a burn severity gradient in a mixed pine-oak forest using multi-sensor remote sensing techniques. Remote Sens. Environ. 2018, 210, 282–296. [Google Scholar] [CrossRef]
- Kato, A.; Thau, D.; Hudak, A.T.; Meigsd, G.W.; Moskal, L.M. Quantifying fire trends in boreal forests with Landsat time series and self-organized criticality. Remote Sens. Environ. 2020, 237, 111525. [Google Scholar] [CrossRef]
- Viana-Soto, A.; García, M.; Aguado, I.; Salas, A. Assessing post-fire forest structure regeneration by combining LiDAR data and Landsat time series in Mediterranean pine forests. Int. J. Appl. Earth Obs. Geoinf. 2022, 108, 102754. [Google Scholar]
- Reilly, M.J.; McCord, M.G.; Brandt, S.M.; Linowksi, K.P.; Butz, R.J.; Jules, E.S. Repeated, high-severity wildfire catalyzes invasion of non-native plant species in forests of the Klamath Mountains, northern California, USA. Biol. Invasions 2020, 22, 1821–1828. [Google Scholar] [CrossRef]
- Nodi, G.; Kertész, M.; Lengyel, A.; Pándi, I.; Somay, L.; Szitár, K.; Kröel-Dulay, G. The effects of woody plant encroachment and wildfire on plant species richness and composition: Temporal changes in a forest–steppe mosaic. Appl. Veg. Sci. 2021, 24, e12546. [Google Scholar]
- Allison, R.S.; Johnston, J.M.; Craig, G.; Jennings, S. Airborne optical and thermal remote sensing for wildfire detection and monitoring. Sensors 2016, 16, 1310. [Google Scholar] [CrossRef] [Green Version]
- Wu, Y.; Arapi, A.; Huang, J.; Gross, B.; Moshary, F. Intra-continental wildfire smoke transport and impact on local air quality observed by ground-based and satellite remote sensing in New York City. Atmos. Environ. 2018, 187, 266–281. [Google Scholar] [CrossRef]
- Samiappan, S.; Hathcock, L.; Turnage, G.; McCraine, C.; Pitchford, J.; Moorhead, R. Remote Sensing of Wildfire Using a Small Unmanned Aerial System: Post-Fire Mapping, Vegetation Recovery and Damage Analysis in Grand Bay, Mississippi/Alabama, USA. Drones 2019, 3, 43. [Google Scholar] [CrossRef] [Green Version]
- Waigl, C.F.; Prakash, A.; Stuefer, M.; Verbyla, D.; Dennison, P. Fire detection and temperature retrieval using EO-1 Hyperion data over selected Alaskan boreal forest fires. Int. J. Appl. Earth Obs. Geoinf. 2019, 81, 72–84. [Google Scholar] [CrossRef]
- Seydi, S.T.; Akhoondzadeh, M.; Amani, M.; Mahdavi, S. Wildfire damage assessment over Australia using sentinel-2 imagery and MODIS land cover product within the google earth engine cloud platform. Remote Sens. 2021, 13, 220. [Google Scholar] [CrossRef]
- Liu, M.; Fu, B.; Xie, S.; He, H.; Lan, F.; Li, Y.; Lou, P.; Fan, D. Comparison of multi-source satellite images for classifying marsh vegetation using DeepLabV3 Plus deep learning algorithm. Ecol. Indic. 2021, 125, 107562. [Google Scholar] [CrossRef]
- Yadav, V.P.; Prasad, R.; Bala, R.; Srivastava, P.K. Assessment of red-edge vegetation descriptors in a modified water cloud model for forward modelling using Sentinel-1A and Sentinel-2 satellite data. Int. J. Remote Sens. 2021, 42, 794–804. [Google Scholar] [CrossRef]
- Geng, R.; Jin, S.; Fu, B.; Wang, B. Object-based wetland classification using multi-feature combination of ultra-high spatial resolution multispectral images. Can. J. Remote Sens. 2020, 46, 784–802. [Google Scholar] [CrossRef]
- Grabska, E.; Hostert, P.; Pflugmacher, D.; Ostapowicz, K. Forest stand species mapping using the Sentinel-2 time series. Remote Sens. 2019, 11, 1197. [Google Scholar] [CrossRef] [Green Version]
- Vanderhoof, M.K.; Hawbaker, T.J.; Teske, C.; Ku, A.; Noble, J.; Picotte, J. Mapping wetland burned area from Sentinel-2 across the Southeastern United States and its contributions relative to Landsat-8 (2016–2019). Fire 2021, 4, 52. [Google Scholar] [CrossRef]
- Parks, S.A.; Miller, C.; Nelson, C.R.; Holden, Z.A. Previous fires moderate burn severity of subsequent wildland fires in two large western US wilderness areas. Ecosystems 2014, 17, 29–42. [Google Scholar] [CrossRef] [Green Version]
- Nasery, S.; Kalkan, K. Burn area detection and burn severity assessment using Sentinel 2 MSI data: The case of Karabağlar district, İzmir/Turkey. Turk. J. Geosci. 2020, 1, 72–77. [Google Scholar]
- Rocha, A.V.; Shaver, G.R. Burn severity influences postfire CO2 exchange in arctic tundra. Ecol. Appl. 2011, 21, 477–489. [Google Scholar] [CrossRef] [PubMed]
- Stow, D.; Petersen, A.; Rogan, J.; Franklin, J. Mapping burn severity of Mediterranean-type vegetation using satellite multispectral data. Gisci. Remote Sens. 2007, 44, 1–23. [Google Scholar] [CrossRef]
- Lee, J.M.; Lee, S.W.; Lim, J.H.; Woo, M.S. Effects of heterogeneity of pre-fire forests and vegetation burn severity on short-term post-fire vegetation density and regeneration in Samcheok, Korea. Landsc. Ecol. Eng. 2014, 10, 215–228. [Google Scholar] [CrossRef]
- Lu, B.; He, Y.; Tong, A. Evaluation of spectral indices for estimating burn severity in semiarid grasslands. Int. J. Wildland Fire 2015, 25, 147–157. [Google Scholar] [CrossRef]
- Bright, B.C.; Hudak, A.T.; Kennedy, R.E.; Braaten, J.D.; Khalyani, A.H. Examining post-fire vegetation regeneration with Landsat time series analysis in three western North American forest types. Fire Ecol. 2019, 15, 8. [Google Scholar] [CrossRef] [Green Version]
- Morresi, D.; Vitali, A.; Urbinati, C.; Garbarino, M. Forest spectral regeneration and regeneration dynamics in stand-replacing wildfires of central Apennines derived from Landsat time series. Remote Sens. 2019, 11, 308. [Google Scholar] [CrossRef] [Green Version]
- Bondur, V.G.; Tsidilina, M.N.; Cherepanova, E.V. Satellite monitoring of wildfire impacts on the conditions of various types of vegetation cover in the federal districts of the Russian Federation. Izv. Atmos. Ocean. Phys. 2019, 55, 1238–1253. [Google Scholar] [CrossRef]
- Semeraro, T.; Vacchiano, G.; Aretano, R.; Ascoli, D. Application of vegetation index time series to value fire effect on primary pro-duction in a Southern European rare wetland. Ecol. Eng. 2019, 134, 9–17. [Google Scholar] [CrossRef] [Green Version]
- Rapinel, S.; Mony, C.; Lecoq, L.; Clément, B.; Thomas, A.; Hubert-Moy, L. Evaluation of Sentinel-2 time-series for mapping floodplain grassland plant communities. Remote Sens. Environ. 2019, 223, 115–129. [Google Scholar] [CrossRef]
- Stendardi, L.; Karlsen, S.R.; Niedrist, G.; Gerdol, R.; Zebisch, M.; Rossi, M.; Notarnicola, C. Exploiting time series of Sentinel-1 and Sentinel-2 imagery to detect meadow phenology in mountain regions. Remote Sens. 2019, 11, 542. [Google Scholar] [CrossRef] [Green Version]
- Historic Fires Devastate the U.S. Pacific Coast. Available online: http://earthobservatory.nasa.gov/images/147277 (accessed on 21 October 2021).
- Aranha, J.; Enes, T.; Calvão, A.; Viana, H. Shrub biomass estimates in former burnt areas using sentinel 2 images processing and classification. Forests 2020, 11, 555. [Google Scholar] [CrossRef]
- Reese, H.; Olsson, H. C-correction of optical satellite data over alpine vegetation areas: A comparison of sampling strategies for determining the empirical c-parameter. Remote Sens. Environ. 2011, 115, 1387–1400. [Google Scholar] [CrossRef] [Green Version]
- Van Leeuwen, W.J.D.; Casady, G.M.; Neary, D.G.; Bautista, S.; Alloza, J.A.; Carmel, Y.; Wittenberg, L.; Malkinson, D.; Orr, B.J. Monitoring post-wildfire vegetation response with remotely sensed time-series data in Spain, USA and Israel. Int. J. Wildland Fire 2010, 19, 75–93. [Google Scholar] [CrossRef]
- Tucker, C.J. Red and photographic infrared linear combinations for monitoring vegetation. Remote Sens. Environ. 1979, 8, 127–150. [Google Scholar] [CrossRef] [Green Version]
- Testa, S.; Soudani, K.; Boschetti, L.; Mondinoa, E.B. MODIS-derived EVI, NDVI and WDRVI time series to estimate phenological metrics in French deciduous forests. Int. J. Appl. Earth Obs. Geoinf. 2018, 64, 132–144. [Google Scholar] [CrossRef]
- Huete, A.; Didan, K.; Miura, T.; Rodriguez, E.P.; Gao, X.; Ferreira, L.G. Overview of the radiometric and biophysical performance of the MODIS vegetation indices. Remote Sens. Environ. 2002, 83, 195–213. [Google Scholar] [CrossRef]
- Wiegand, C.L.; Richardson, A.J.; Escobar, D.E.; Gerbermann, A.H. Vegetation indices in crop assessments. Remote Sens. Environ. 1991, 35, 105–119. [Google Scholar] [CrossRef]
- Qi, J.; Chehbouni, A.; Huete, A.R.; Sorooshian, S. A modified soil adjusted vegetation index. Remote Sens. Environ. 1994, 48, 119–126. [Google Scholar] [CrossRef]
- Nasiri, V.; Darvishsefat, A.A.; Arefi, H.; Griess, V.C.; Sadeghi, S.M.M.; Borz, S.A. Modeling Forest Canopy Cover: A Synergistic Use of Sentinel-2, Aerial Photogrammetry Data, and Machine Learning. Remote Sens. 2022, 14, 1453. [Google Scholar] [CrossRef]
- Hansen, P.M.; Schjoerring, J.K. Reflectance measurement of canopy biomass and nitrogen status in wheat crops using normalized difference vegetation indices and partial least squares regression. Remote Sens. Environ. 2003, 86, 542–553. [Google Scholar] [CrossRef]
- Cocke, A.E.; Fulé, P.Z.; Crouse, J.E. Comparison of burn severity assessments using Differenced Normalized Burn Ratio and ground data. Int. J. Wildland Fire 2005, 14, 189–198. [Google Scholar] [CrossRef] [Green Version]
- García MJ, L.; Caselles, V. Mapping burns and natural reforestation using Thematic Mapper data. Geocarto Int. 1991, 6, 31–37. [Google Scholar] [CrossRef]
- Key, C.H.; Benson, N.C. Post-Fire Burn Assessment by Remote Sensing on National Park Service Lands; National Park Service: Washington, DC, USA, 2002. [Google Scholar]
- Hawryło, P.; Bednarz, B.; Wężyk, P.; Szostak, M. Estimating defoliation of Scots pine stands using machine learning methods and vegetation indices of Sentinel-2. Eur. J. Remote Sens. 2018, 51, 194–204. [Google Scholar] [CrossRef] [Green Version]
- Lasaponara, R.; Tucci, B.; Ghermandi, L. On the use of satellite Sentinel 2 data for automatic mapping of burnt areas and burn severity. Sustainability 2018, 10, 3889. [Google Scholar] [CrossRef] [Green Version]
- Sonobe, R.; Yamaya, Y.; Tani, H.; Wang, X.; Kobayashi, N.; Mochizuki, K. Crop classification from Sentinel-2-derived vegetation indices using ensemble learning. J. Appl. Remote Sens. 2018, 12, 026019. [Google Scholar] [CrossRef] [Green Version]
- Cohen, W.B.; Yang, Z.; Healey, S.P.; Kennedy, R.E.; Gorelick, N. A LandTrendr multispectral ensemble for forest disturbance detection. Remote Sens. Environ. 2018, 205, 131–140. [Google Scholar] [CrossRef]
- Kokaly, R.F.; Rockwell, B.W.; Haire, S.L.; King, T.V.V. Characterization of post-fire surface cover, soils, and burn severity at the Cerro Grande Fire, New Mexico, using hyperspectral and multispectral remote sensing. Remote Sens. Environ. 2007, 106, 305–325. [Google Scholar] [CrossRef]
- Cansler, C.A.; McKenzie, D. How robust are burn severity indices when applied in a new region? Evaluation of alternate field-based and remote-sensing methods. Remote Sens. 2012, 4, 456–483. [Google Scholar] [CrossRef] [Green Version]
- Veraverbeke, S.; Rogers, B.M.; Randerson, J.T. Daily burned area and carbon emissions from boreal fires in Alaska. Biogeo-Sciences 2015, 12, 3579–3601. [Google Scholar] [CrossRef] [Green Version]
- Nolan, R.H.; Collins, L.; Leigh, A.; Ooi, M.K.J.; Curran, T.J.; Fairman, T.A.; de Dios, V.R.; Bradstock, R. Limits to post-fire vegetation regeneration under climate change. Plant Cell Environ. 2021, 44, 3471–3489. [Google Scholar] [CrossRef] [PubMed]
- Boer, M.M.; Nolan, R.H.; Resco De Dios, V.; Clarke, H.; Price, O.F.; Bradstock, R.A. Changing weather extremes call for early warning of potential for catastrophic fire. Earth’s Future 2017, 5, 1196–1202. [Google Scholar] [CrossRef]
- Liang, S.; Yi, Q.; Liu, J. Vegetation dynamics and responses to recent climate change in Xinjiang using leaf area index as an in-dicator. Ecol. Indic. 2015, 58, 64–76. [Google Scholar]
- Bryn, A. Recent forest limit changes in south-east Norway: Effects of climate change or regrowth after abandoned utilisation? Nor. Geogr. Tidsskr.-Nor. J. Geogr. 2008, 62, 251–270. [Google Scholar] [CrossRef]
- Clemente, R.H.; Cerrillo RM, N.; Gitas, I.Z. Monitoring post-fire regeneration in Mediterranean ecosystems by employing multitemporal satellite imagery. Int. J. Wildland Fire 2009, 18, 648–658. [Google Scholar] [CrossRef]
- Yadav, A.; Singh, D.; Lingwan, M.; Yadukrishnan, P.; Masakapalli, S.K.; Datta, S. Light signaling and UV-B-mediated plant growth regulation. J. Integr. Plant Biol. 2020, 62, 1270–1292. [Google Scholar] [CrossRef]
- Walters, M.B.; Kruger, E.L.; Reich, P.B. Relative growth rate in relation to physiological and morphological traits for northern hardwood tree seedlings: Species, light environment and ontogenetic considerations. Oecologia 1993, 96, 219–231. [Google Scholar] [CrossRef]
- Lawrence, R.L.; Ripple, W.J. Comparisons among vegetation indices and band wise regression in a highly disturbed, hetero-geneous landscape: Mount St. Helens, Washington. Remote Sens. Environ. 1998, 64, 91–102. [Google Scholar] [CrossRef]
- Gurung, R.B.; Breidt, F.J.; Dutin, A.; Ogle, S.M. Predicting Enhanced Vegetation Index (EVI) curves for ecosystem modeling applications. Remote Sens. Environ. 2009, 113, 2186–2193. [Google Scholar] [CrossRef]
- Bond, W.J.; Keeley, J.E. Fire as a global ‘herbivore’: The ecology and evolution of flammable ecosystems. Trends Ecol. Evol. 2005, 20, 387–394. [Google Scholar] [CrossRef]
- Dai, Z.; Lv, X.; Ma, B.; Chen, N.; Chang, S.X.; Lin, J.; Wang, X.; Su, W.; Liu, H.; Huang, Y.; et al. Concurrent and rapid recovery of bacteria and protist communities in Canadian boreal forest eco-systems following wildfire. Soil Biol. Biochem. 2021, 163, 108452. [Google Scholar] [CrossRef]
- De Keersmaecker, W.; Lhermitte, S.; Tits, L.; Honnay, O.; Somers, B.; Coppin, P. Linking NDVI and climate-based ecosystem stability with land cover in Eu-rope. In Proceedings of the 2014 IEEE Geoscience and Remote Sensing Symposium, Quebec City, QC, Canada, 13–18 July 2014; pp. 3938–3940. [Google Scholar]
- Chu, T.; Guo, X.; Takeda, K. Effects of burn severity and environmental conditions on post-fire regeneration in Siberian larch forest. Forests 2017, 8, 76. [Google Scholar] [CrossRef]
- Harris, L.B.; Taylor, A.H. Rain-shadow forest margins resilient to low-severity fire and climate change but not high-severity fire. Ecosphere 2020, 11, e03258. [Google Scholar] [CrossRef]
- Weber, M.G.; Flannigan, M.D. Canadian boreal forest ecosystem structure and function in a changing climate: Impact on fire regimes. Environ. Rev. 1997, 5, 145–166. [Google Scholar] [CrossRef]
- Liu, Z. Effects of climate and fire on short-term vegetation regeneration in the boreal larch forests of Northeastern China. Sci. Rep. 2016, 6, 37572. [Google Scholar] [CrossRef] [Green Version]
- Stephens, S.L.; Agee, J.K.; Fule, P.Z.; Northw, M.P.; Rommet, H.; Swetnamand, W.; Turner, M.G. Managing forests and fire in changing climates. Science 2013, 342, 41–42. [Google Scholar] [CrossRef]
- Viana-Soto, A.; Aguado, I.; Salas, J.; García, M. Identifying post-fire regeneration trajectories and driving factors using landsat time series in fire-prone mediterranean pine forests. Remote Sens. 2020, 12, 1499. [Google Scholar] [CrossRef]
- Ryu, J.H.; Han, K.S.; Hong, S.; Park, N.W. Satellite-based evaluation of the post-fire regeneration process from the worst forest fire case in South Korea. Remote Sens. 2018, 10, 918. [Google Scholar] [CrossRef] [Green Version]
- Cai, L.; Wang, M. Is the RdNBR a better estimator of wildfire burn severity than the dNBR? A discussion and case study in southeast China. Geocarto Int. 2020, 37, 758–772. [Google Scholar] [CrossRef]
- Dindaroglu, T.; Babur, E.; Yakupoglu, T.; Rodrigo-Comino, J.; Cerdà, A. Evaluation of geomorphometric characteristics and soil properties after a wildfire using Sentinel-2 MSI imagery for future fire-safe forest. Fire Saf. J. 2021, 122, 103318. [Google Scholar] [CrossRef]
- Achour, H.; Toujani, A.; Trabelsi, H.; Jaouadi, W. Evaluation and comparison of Sentinel-2 MSI, Landsat 8 OLI, and EFFIS data for forest fires mapping. Illustrations from the summer 2017 fires in Tunisia. Geocarto Int. 2021. [Google Scholar] [CrossRef]
- Llorens, R.; Sobrino, J.A.; Fernández, C.; Fernández-Alonso, J.M.; Vega, J.A. A methodology to estimate forest fires burned areas and burn severity degrees using Sentinel-2 data. Application to the October 2017 fires in the Iberian Peninsula. Int. J. Appl. Earth Obs. Geoinf. ITC J. 2020, 95, 102243. [Google Scholar] [CrossRef]
- Fox, D.M.; Maselli, F.; Carrega, P. Using SPOT images and field sampling to map burn severity and vegetation factors affecting post forest fire erosion risk. Catena 2008, 75, 326–335. [Google Scholar] [CrossRef]
- Mallinis, G.; Mitsopoulos, I.; Chrysafi, I. Evaluating and comparing Sentinel 2A and Landsat-8 Operational Land Imager (OLI) spectral indices for estimating fire severity in a Mediterranean pine ecosystem of Greece. Gisci. Remote Sens. 2018, 55, 1–18. [Google Scholar] [CrossRef]
- Kumar, T.; Reddy, K. A Technique for Burning Area Identification Using IHS Transformation and Image Segmentation. Int. Arab. J. Inf. Technol. 2015, 12, 764–771. [Google Scholar]
- Kotliar, N.B.; Kennedy, P.L.; Ferree, K. Avifaunal responses to fire in southwestern montane forests along a burn severity gradient. Ecol. Appl. 2007, 17, 491–507. [Google Scholar] [CrossRef] [Green Version]
- De Fries, R.S.; Townshend, J.R.G. NDVI-derived land cover classifications at a global scale. Int. J. Remote Sens. 1994, 15, 3567–3586. [Google Scholar] [CrossRef]
- Bagan, H.; Wang, Q.; Watanabe, M.; Yang, Y.; Ma, J. Land cover classification from MODIS EVI times-series data using SOM neural network. Int. J. Remote Sens. 2005, 26, 4999–5012. [Google Scholar] [CrossRef]
- Van Delm, A.; Gulinck, H. Classification and quantification of green in the expanding urban and semi-urban complex: Application of detailed field data and IKONOS-imagery. Ecol. Indic. 2011, 11, 52–60. [Google Scholar] [CrossRef]
- Malak, D.A.; Pausas, J.G.; Pardo-Pascual, J.E.; Ruiz, L.A. Fire recurrence and the dynamics of the enhanced vegetation index in a Mediterranean ecosystem. Int. J. Appl. Geospat. Res. 2015, 6, 18–35. [Google Scholar] [CrossRef] [Green Version]
- Peña-Barragán, J.M.; Ngugi, M.K.; Plant, R.E.; Six, J. Object-based crop identification using multiple vegetation indices, textural features and crop phenology. Remote Sens. Environ. 2011, 115, 1301–1316. [Google Scholar] [CrossRef]
- Szantoi, Z.; Escobedo, F.J.; Abd-Elrahman, A.; Pearlstine, L.; Dewitt, B.; Smith, S. Classifying spatially heterogeneous wetland communities using machine learning algorithms and spectral and textural features. Environ. Monit. Assess. 2015, 187, 262. [Google Scholar] [CrossRef]
- Dale, V.H.; Joyce, L.A.; McNulty, S.; Neilsond, R.P. The interplay between climate change, forests, and disturbances. Sci. Total Environ. 2000, 262, 201–204. [Google Scholar] [CrossRef] [Green Version]
- González-De Vega, S.; De las Heras, J.; Moya, D. Resilience of Mediterranean terrestrial ecosystems and fire severity in semiarid areas: Responses of Aleppo pine forests in the short, mid and long term. Sci. Total Environ. 2016, 573, 1171–1177. [Google Scholar] [CrossRef]
- Keeley, J.E.; van Mantgem, P.; Falk, D.A. Fire, climate and changing forests. Nat. Plants 2019, 5, 774–775. [Google Scholar] [CrossRef]
- Anderson-Teixeira, K.J.; Miller, A.D.; Mohan, J.E.; Hudiburg, T.W.; Duval, B.D.; DeLucia, E.H. Altered dynamics of forest regeneration under a changing climate. Glob. Change Biol. 2013, 19, 2001–2021. [Google Scholar] [CrossRef]
- Sharma, S.; Rikhari, H.C. Forest fire in the central Himalaya: Climate and regeneration of trees. Int. J. Biometeorol. 1997, 40, 63–70. [Google Scholar] [CrossRef]
- Tepley, A.J.; Thompson, J.R.; Epstein, H.E.; Hudiburg, T.W.; Duval, B.D.; Delucia, E.H. Vulnerability to forest loss through altered postfire regeneration dynamics in a warming climate in the Klamath Mountains. Glob. Change Biol. 2017, 23, 4117–4132. [Google Scholar] [CrossRef]
- Francos, M.; Úbeda, X.; Tort, J.; Panareda, J.M. The role of forest fire severity on vegetation regeneration after 18 years. Implications for forest management of Quercus suber L. in Iberian Peninsula. Glob. Planet. Change 2016, 145, 11–16. [Google Scholar] [CrossRef]
- Kukavskaya, E.A.; Ivanova, G.A.; Conard, S.G.; McRae, D.J.; Ivanov, V.A. Biomass dynamics of central Siberian Scots pine forests following surface fires of varying severity. Int. J. Wildland Fire 2014, 23, 872–886. [Google Scholar] [CrossRef]
- Hislop, S.; Jones, S.; Soto-Berelov, M.; Skidmore, A. High fire disturbance in forests leads to longer regeneration, but varies by forest type. Remote Sens. Ecol. Conserv. 2019, 5, 376–388. [Google Scholar] [CrossRef]
- De las Heras, J.; Martínez-Sánchez, J.J.; González-Ochoa, A.I.; Ferrandis, P.; Herranz, J.M. Establishment of Pinus halepensis Mill. saplings following fire: Effects of competition with shrub species. Acta Oecologica 2002, 23, 91–97. [Google Scholar] [CrossRef]
- Keeley, J.E.; Pausas, J.G.; Rundel, P.W.; Bond, W.J.; Bradstock, R.A. Fire as an evolutionary pressure shaping plant traits. Trends Plant Sci. 2011, 16, 406–411. [Google Scholar] [CrossRef] [Green Version]
- Martín-Alcón, S.; Coll, L. Unraveling the relative importance of factors driving post-fire regeneration trajectories in non-serotinous Pinus nigra forests. For. Ecol. Manag. 2016, 361, 13–22. [Google Scholar] [CrossRef] [Green Version]
- Whitman, E.; Parisien, M.A.; Thompson, D.K.; Flannigan, M.D. Topoedaphic and forest controls on post-fire vegetation assemblies are modified by fire history and burn severity in the northwestern Canadian boreal forest. Forests 2018, 9, 151. [Google Scholar] [CrossRef] [Green Version]
- Navarro, G.; Caballero, I.; Silva, G.; Parra, P.; Vázquez, Á.; Caldeira, R. Evaluation of forest fire on Madeira Island using Sentinel-2A MSI imagery. Int. J. Appl. Earth Obs. Geoinf. 2017, 58, 97–106. [Google Scholar] [CrossRef] [Green Version]
- Filipponi, F. Exploitation of sentinel-2 time series to map burned areas at the national level: A case study on the 2017 Italy wildfires. Remote Sens. 2019, 11, 622. [Google Scholar] [CrossRef] [Green Version]
- Han, A.; Qing, S.; Bao, Y.; Na, L.; Bao, Y.; Liu, X.; Zhang, J.; Wang, C. Short-term effects of fire severity on vegetation based on sentinel-2 satellite data. Sustainability 2021, 13, 432. [Google Scholar] [CrossRef]
- Frazier, R.J.; Coops, N.C.; Wulder, M.A.; Hermosilla, T.; White, J.C. Analyzing spatial and temporal variability in short-term rates of post-fire vegetation return from Landsat time series. Remote Sens. Environ. 2018, 205, 32–45. [Google Scholar] [CrossRef]
Publisher’s Note: MDPI stays neutral with regard to jurisdictional claims in published maps and institutional affiliations. |
© 2022 by the authors. Licensee MDPI, Basel, Switzerland. This article is an open access article distributed under the terms and conditions of the Creative Commons Attribution (CC BY) license (https://creativecommons.org/licenses/by/4.0/).

