Article

Exploring the Optimal Feature Combination of Tree Species Classification by Fusing Multi-Feature and Multi-Temporal Sentinel-2 Data in Changbai Mountain

College of Geo-Exploration Science and Technology, Jilin University, Changchun 130026, China
*
Author to whom correspondence should be addressed.
Forests 2022, 13(7), 1058; https://doi.org/10.3390/f13071058
Submission received: 31 May 2022 / Revised: 30 June 2022 / Accepted: 4 July 2022 / Published: 5 July 2022
(This article belongs to the Section Forest Inventory, Modeling and Remote Sensing)

Abstract

:
Tree species classification is crucial for forest resource investigation and management. Remote sensing images can provide monitoring information on the spatial distribution of tree species and multi-feature fusion can improve the classification accuracy of tree species. However, different features will play their own unique role. Therefore, considering various related factors about the growth of tree species such as spectrum information, texture structure, vegetation phenology, and topography environment, we fused multi-feature and multi-temporal Sentinel-2 data, which combines spectral features with three other types of features. We combined different feature-combinations with the random forest method to classify Changbai Mountain tree species. Results indicate that topographic features participate in tree species classification with higher accuracy and more efficiency than phenological features and texture features, and the elevation factor possesses the highest importance through the Mean Decrease in Gini (MDG) method. Finally, we estimated the area of the target tree species and analyzed the spatial distribution characteristics by overlay analysis of the Classification 3 result and topographic features (elevation, slope, and aspect). Our findings emphasize that topographic factors have a great influence on the distribution of forest resources and provide the basis for forest resource investigation.

1. Introduction

Obtaining reliable information on the tree species number and spatial distribution is an important part of the investigation and management of forest resources [1]. The development of remote sensing technology provides favorable conditions for quickly acquiring abundant vegetation species information [2,3]. Tree species monitoring based on remote sensing technology has gradually replaced traditional human ground surveys, and many types of images have been applied to tree species classification [4,5,6,7]. Sentinel-2 images have the characteristics of a high resolution of 10 m, three red-side bands, and a wide range of coverage. It can provide valuable information for tree species identification and a new perspective on tree species classification [1,6,8].
The combination of remote sensing data and machine learning language has become a hot research direction for tree species classification. Random Forest (RF) is an integrated machine learning algorithm that contains multiple decision trees. It can show advantages in complex feature spaces and different statistical distributions of data [9]. Therefore, the combination of the random forest model and multi-temporal Sentinel-2 images enables the classification of tree species, and has proven to be a practical technique [10,11,12].
The growth and senescence of leaves will change biophysical and structural properties. However, multi-temporal remote sensing data can reflect the changes of leaves by monitoring the phenological information of tree species in different seasons [13]. Therefore, some studies have proved the great potential of multi-temporal Sentinel-2 data in tree species classification and proposed that red-edge, near-infrared, and shortwave infrared (SWIR) bands are beneficial to distinguishing the two species groups of conifers and broad-leaved trees [14,15]. However, the accuracy of distinguishing more detailed tree species needs to be further improved. The difference in phenology between spring and autumn can effectively improve the classification results of tree species [16,17]. For tree species with different crown shapes, texture features can play a prominent role [18]. Furthermore, topographic features have great potential to distinguish tree species with different spatial distributions, which is conducive to the identification of tree species [19].
The multi-feature fusion method can avoid spectral confusion and enrich the information content of remote sensing data [20]. Indeed, for tree species with little difference in spectral characteristics, spectral-based methods cannot obtain ideal classification results. Although some studies have tried to use remote sensing technology to improve the accuracy of tree species classification, in-depth analysis of the dominant factors affecting tree species classification is still rare [21,22,23].
Therefore, the difference from the previous research was that this study comprehensively considered the spectrum information, texture structure, vegetation phenology, and topographic environment of tree species. We utilized a multi-feature random forest model for tree species classification to compare different feature-combinations and explore the optimal feature factors based on multi-temporal Sentinel-2 images and topography data. Furthermore, we showed the tree species distribution map and estimated the area of tree species by associating the classification results with topographic spatial data. Finally, the spatial distribution characteristics of tree species were statistically analyzed from three aspects, namely elevation, slope and aspect. This study is conducive to analyzing the main factors affecting tree species identification and the spatial characteristics of tree species distribution.

2. Materials and Methods

2.1. Study Area

Changbai Mountain Protection Development Zone is located in the southeast of Jilin Province (127°20′–128°25′ E, 41°40′–42°25′ N) (Figure 1). The overall study area is approximately 32,400 ha, the altitude difference is nearly 2000 m, and the average altitude is 1183 m. The Changbai Mountain Protection Development Zone belongs to a temperate continental mountain climate affected by monsoons, with the annual average temperature between 3 °C and 7 °C and the annual precipitation between 700 mm and 1400 mm.
The abundant plant resources in the study area belong to the Changbai Mountain flora. The dominant tree species include larch (Larix gmelinii Henry.), Korean pine (Pinus koraiensis Sieb. et Zucc.), spruce (Picea asperata Mast.), fir (Abies faxoniana Rehd.), white birch (Betula platyphylla Suk.), Mongolian oak (Quercus mongolica Fisch. ex Ledeb.), aspen (Populus tremula), etc. Among the dominant species, Korean pine is an evergreen tree. The coniferous and broad-leaved mixed forest dominated by Korean pine is the most representative forest type in Northeast China. Spruce and fir are both evergreen trees. Larch trees are widely distributed deciduous trees. Poplar birch forests are also deciduous trees, including Mongolian oak, aspen, white birch, etc. In addition, the surrounding area of Tianchi Lake in Changbai Mountain contains some shrub grassland. Therefore, this study divided the classification target tree species into Korean pine broad-leaved mixed forest (KPBMF), larch forest (LF), oak poplar birch forest (OPBF), spruce-fir forest (SFF), and shrub grassland (SG). The building area and the water body were unified into other categories.

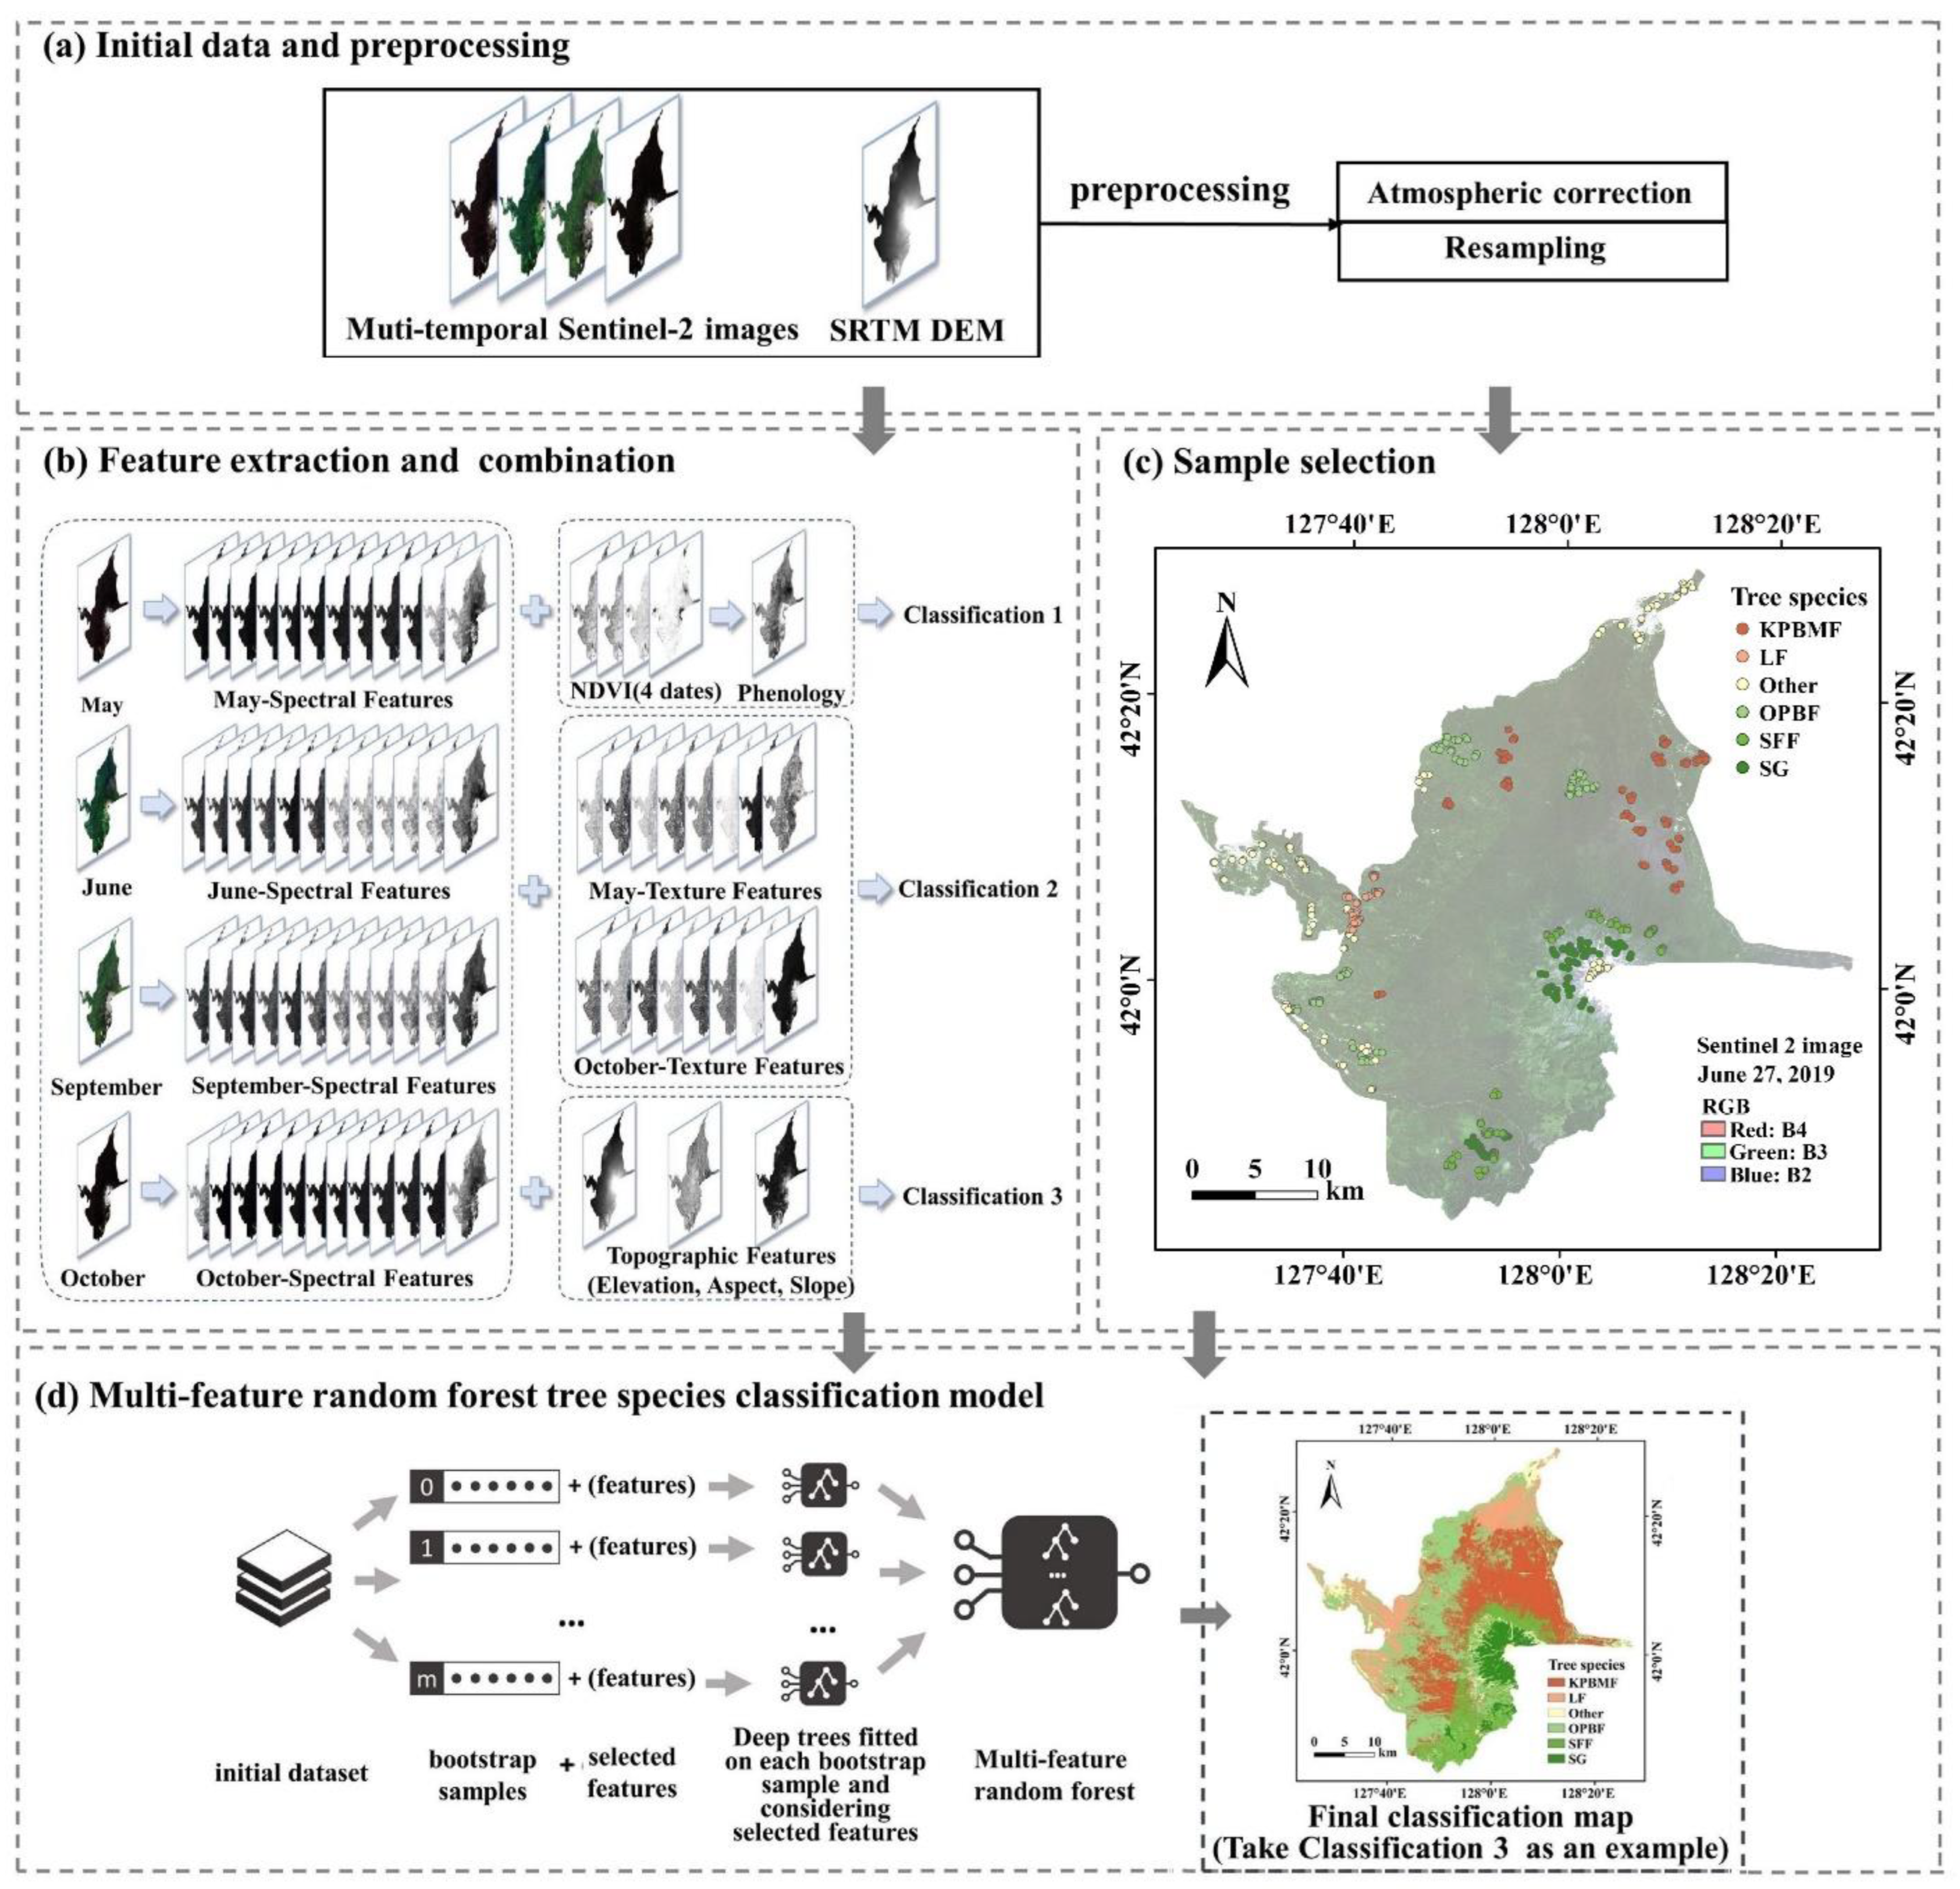
2.2. Data and Pre-Processing

In this study, the Sentinel-2 data were selected from the official website of the United States Geological Survey (USGS) (http://earthexplorer.usgs.gov/, accessed on 8 March 2021). Due to the different phenological features of various tree species, different phenological stages were selected for remote sensing images. The image times were 20 October 2018, 3 May 2019, 27 June 2019, and 25 September 2019. The study area needed three images to cover it completely. The images in the study area were cloudless and of good quality.
Sentinel-2 provided 13 spectral bands with different spatial resolutions. Except for the SWIR-Cirrus band (B10), the other 12 bands were used as the spectral features in this study. The original data was the Level-1C (L1C) data of Sentinel-2. Atmospheric, topographic, and cirrus cloud correction of L1C data were performed to generate Level-2A data using Sen2Cor, an open-source atmospheric correction tool provided by ESA [24]. We resampled the bands with resolutions of 10 m, 20 m and 60 m to 10 m. Then the resampled images were clipped and mosaicked into an image covering the study area (Figure 1).
Topography data were obtained from the Shuttle Radar Topography Mission (SRTM) 1-arc second digital elevation model (DEM) data from the USGS website. The DEM data with a spatial resolution of about 30 m was resampled to 10 m by using the bilinear interpolation method. The image was clipped according to the scope of the study area. Slope and aspect were calculated and generated to obtain topographical information for tree species growth.

2.3. Methodology

This study used pre-processed Sentinel-2 images and topographic data to extract various feature information, including spectral features, phenological features, texture features, and topographic features. The selection of samples was based on remote sensing images and the vegetation type distribution map of the Changbai Mountain. On the basis of spectral features, the multi-feature random forest tree species classification model was constructed through different feature-combinations. The accuracy of the classification results was evaluated based on the confusion matrix. The flowchart of the tree species classification method in this study is shown in Figure 2.

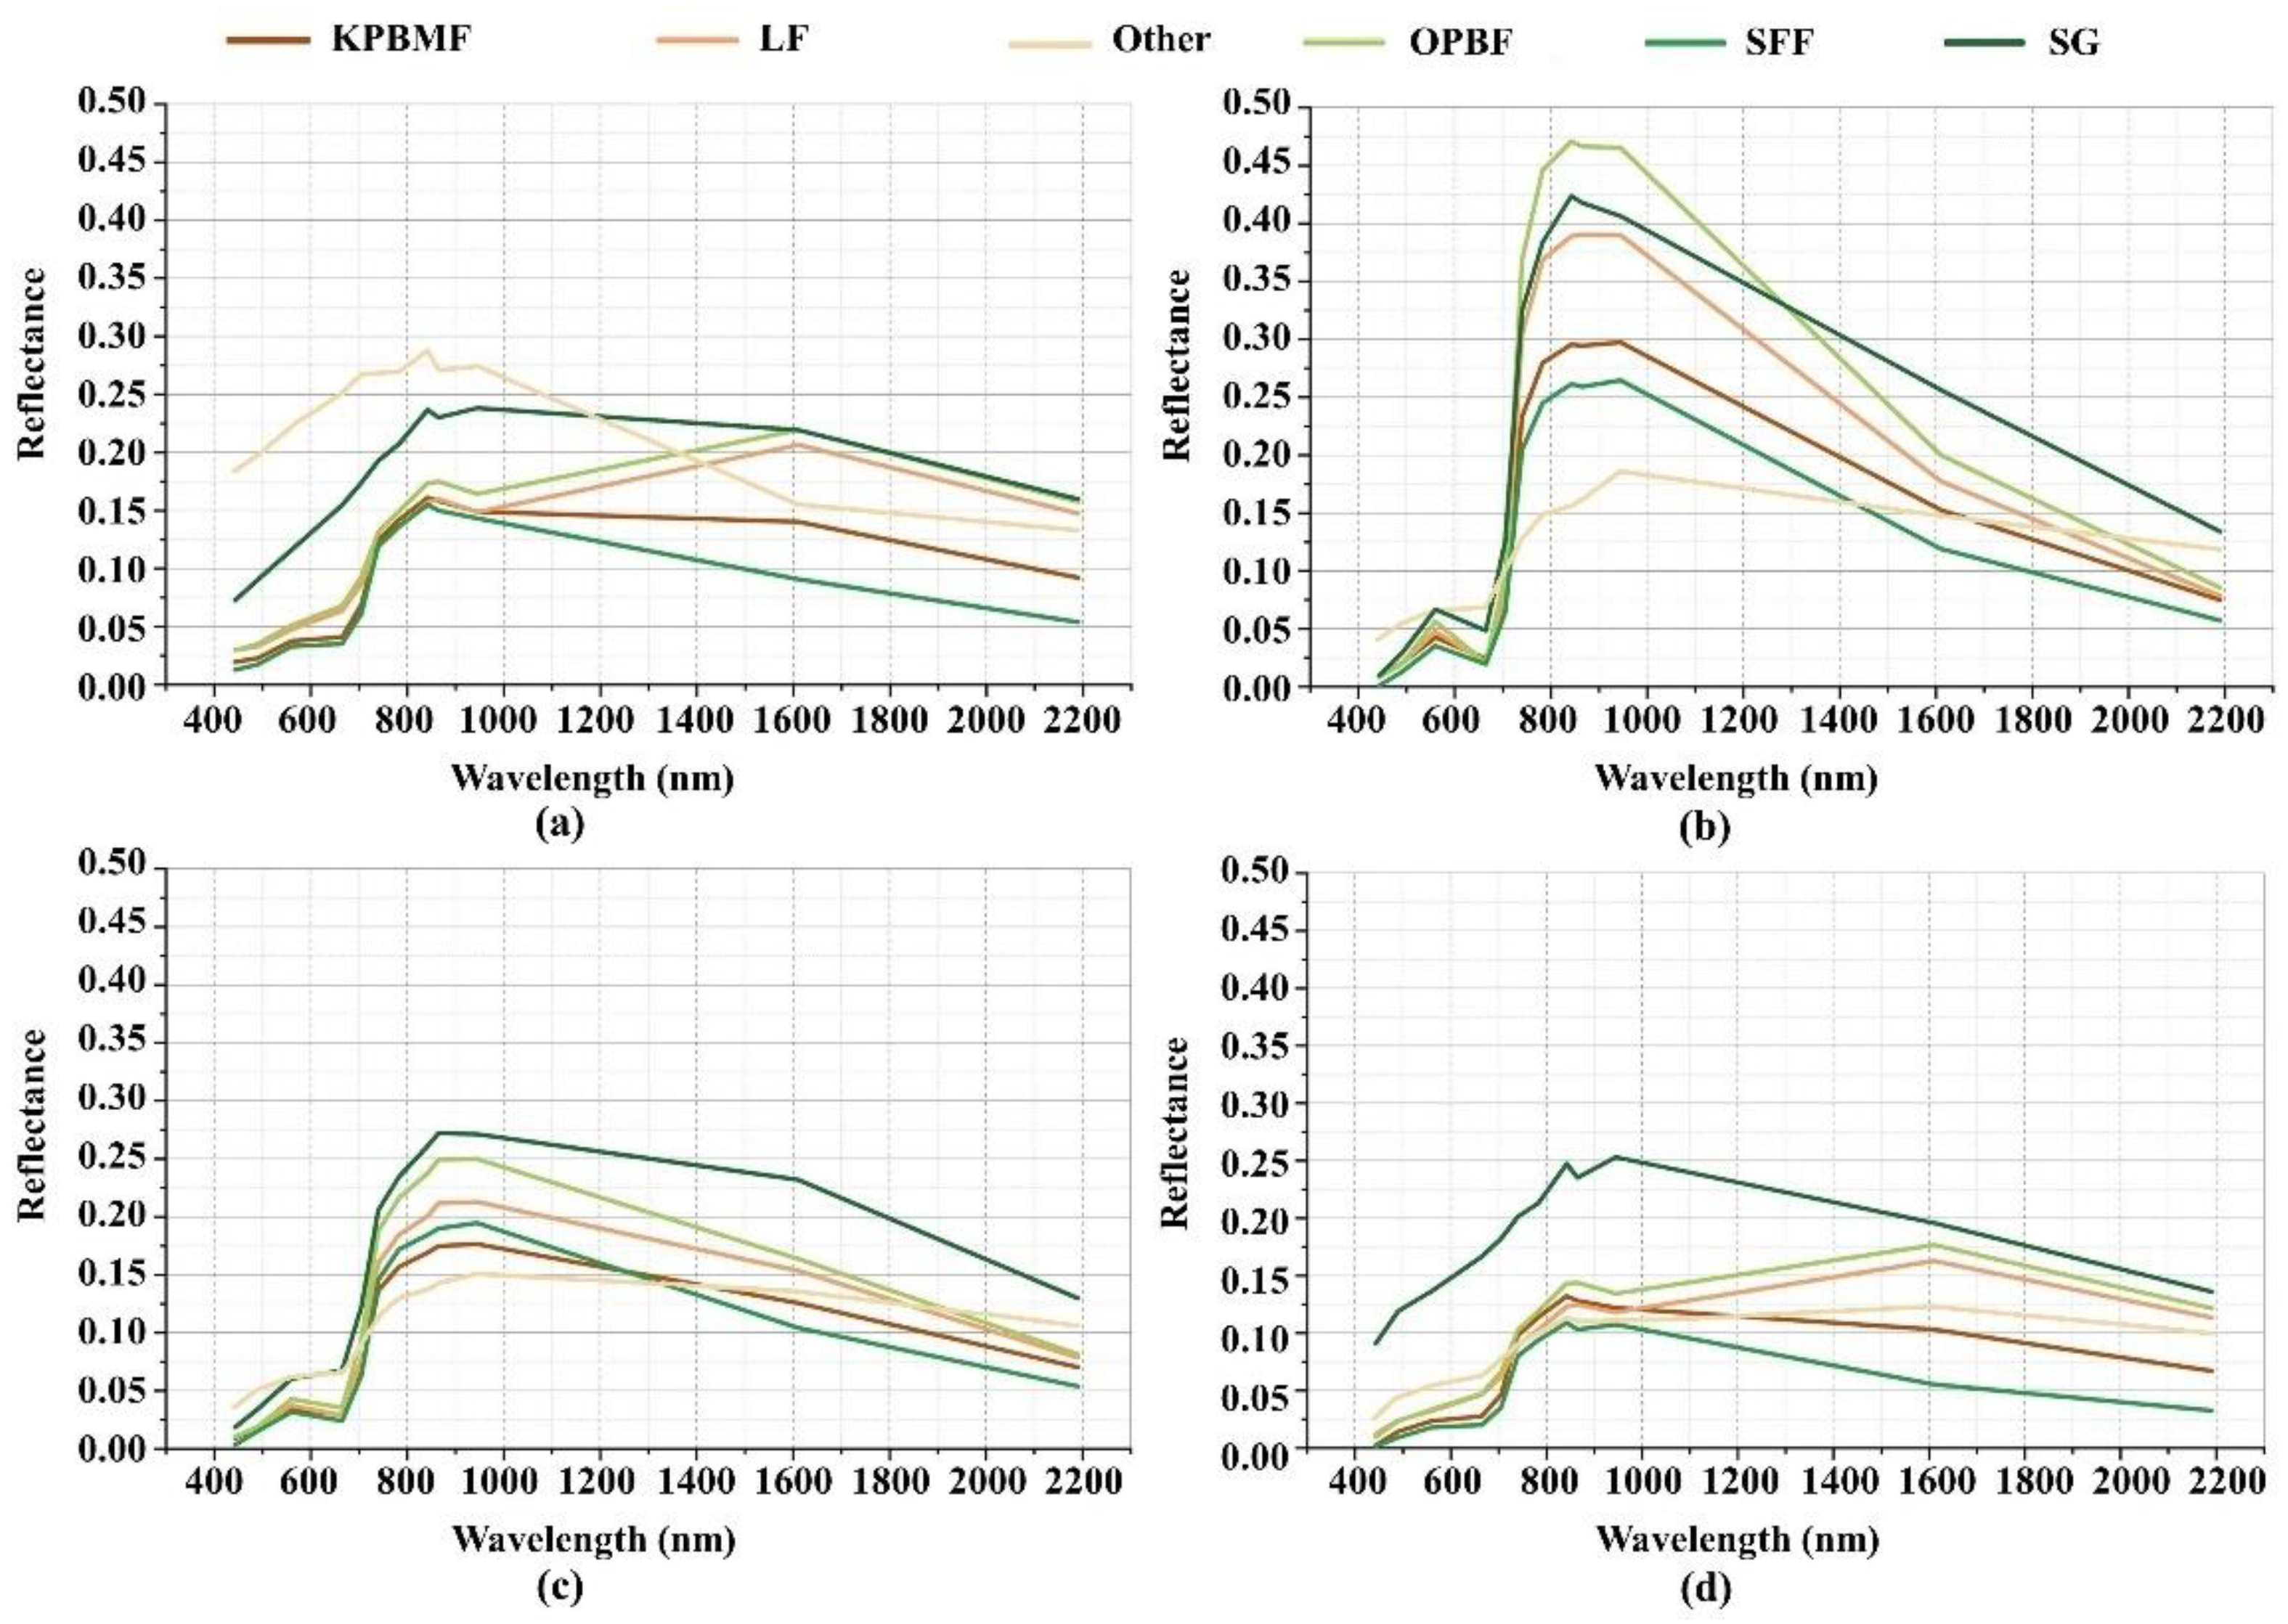
2.3.1. Separability of Spectral Features

The average spectral reflectance demonstrates that the target tree species cannot be distinctly distinguished in the visible light range (Figure 3). The degree of separation of the tree species is not obvious in May, September, and October. However, tree species have significantly different responses in the red edge band and near-infrared band in June. The degree of tree species separation is highest during the wavelength from 800 nm to 1000 nm. The spectral reflectance of OPBF in the four periods is higher than that of the KPBMF, LF, and SFF.
The Jeffries–Matusita (JM) distance is generally implemented to quantify the degree of separation [18]. Therefore, the JM distance was used to evaluate the spectral separability between tree species in our study, and its value ranged from 0 (i.e., identical distributions) to 2 (i.e., complete dissimilarity). The results showed that the distance values were all qualified (>1.9) and the target tree species could be separated.

2.3.2. Extraction of Phenological Features

Phenological changes of different tree species vary greatly, which can be monitored through multi-temporal images [25,26]. It is also an important basis for the classification of evergreen and deciduous trees [27]. The changes of trees in summer and winter reflect the characteristics of vegetation phenology and more effectively characterize the spectral differences between tree species. In June, remote sensing images show different colors of evergreen and deciduous trees during the wooded period. In October, evergreen trees change little, while deciduous trees will have significant changes. Therefore, NDVI in June and October was used to extract phenological features.
This study calculated the NDVI time series for four periods based on the red band (B4) and near-infrared band (B8) of Sentinel-2 images. The formula was as follows:
NDVI = B 8 B 4 B 8 + B 4
phenology = N D V I J N D V I O
where NDVIJ and NDVIO refer to the NDVI value in June and October, respectively.

2.3.3. Extraction of Texture Features

In this study, we used the gray-level co-occurrence matrix (GLCM) to extract texture features, because it has high reliability [18,28]. As one of the most famous texture analysis algorithms, the GLCM extracts texture by calculating the gray frequency of a pixel pair with a fixed relative position [29]. The result of the principal component analysis (PCA) transformation is a group of projected components based on their variance. We performed the PCA transformation on the image data and used the first principal component to extract texture features because performing the PCA transformation on hyperspectral imagery with numerous bands will result in few features, where the first component contains the highest variation and information content [30]. When extracting texture, considering previous research and the variance, the size of the moving window was determined to be 3 × 3 [23,29,31]. Leaf growth and senescence will change the texture and structural characteristics of the tree canopy. Therefore, the texture features in May and October were extracted. Texture features were calculated using GLCM according to the following equations:
Contrast = i = 0 q u a n t k j = 0 q u a n t k ( i j ) 2 h c ( i j )
Dissimilarity = i = 0 q u a n t k j = 0 q u a n t k h c ( i ,   j ) | i j |
Homogeneity = i = 0 q u a n t k j = 0 q u a n t k 1 1 + ( i j ) 2 h c ( i ,   j )
Angular   Second   Moment = i = 0 q u a n t k j = 0 q u a n t k h c ( i j ) 2
Entropy = i = 0 q u a n t k j = 0 q u a n t k h c ( i ,   j ) l o g [ h c ( i ,   j ) ]
Variance = i = 0 q u a n t k j = 0 q u a n t k ( i µ ) 2 h c ( i j )
Correlation = i = 0 q u a n t k j = 0 q u a n t k ( i µ ) ( j µ ) h c ( i ,   j ) 2 σ
Mean = i = 0 q u a n t k j = 0 q u a n t k i h c ( i ,   j )
where quantk is the quantization level of band k, µ represents mean, σ represents variance and hc(i, j) is the relational matrix between gray levels.

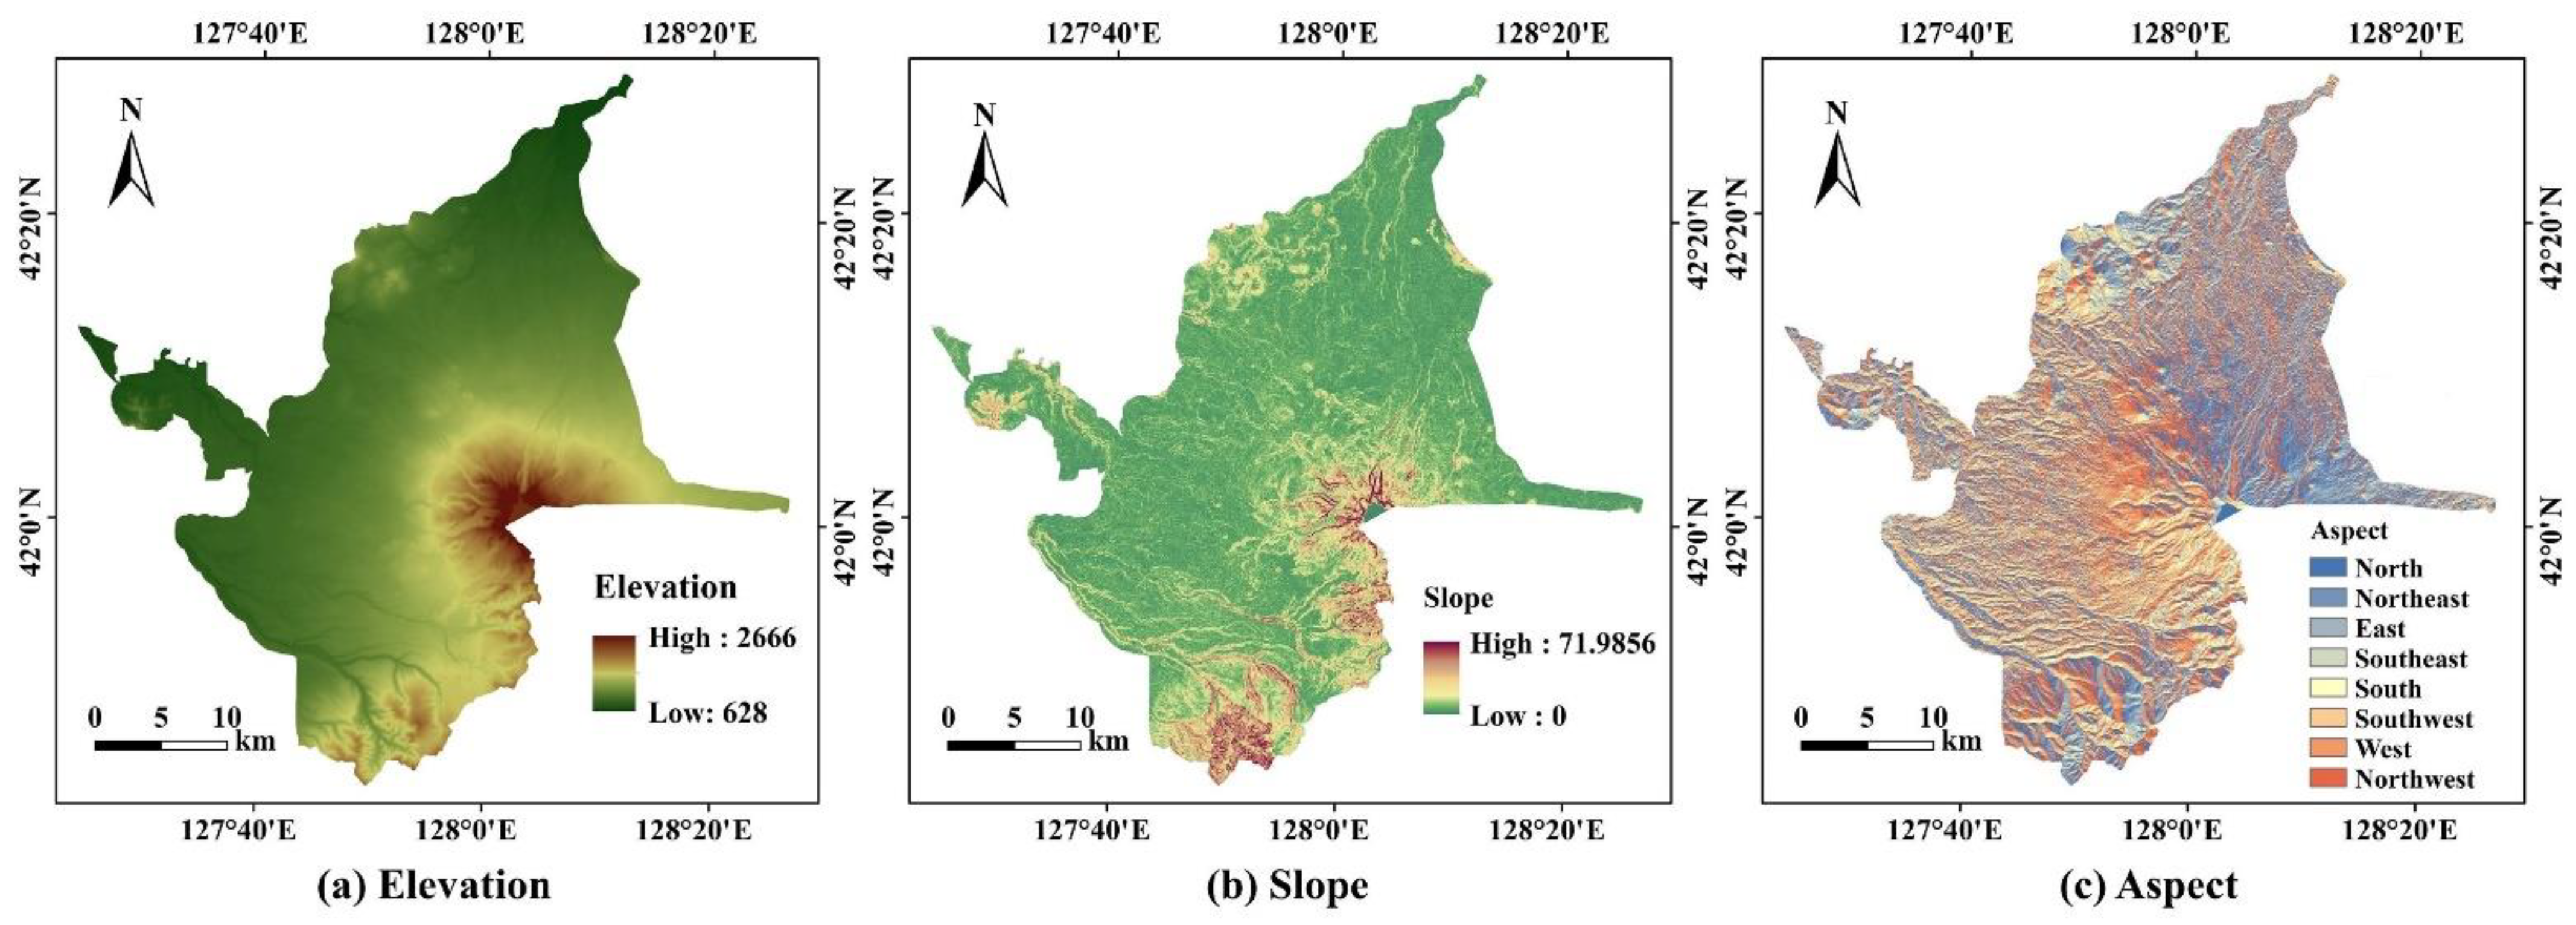
2.3.4. Extraction of Topographic Features

The growth environment and vegetation of trees will be strongly affected by altitude [32]. The distribution of tree species will also vary depending on topographic features (elevation, slope, and aspect). Therefore, topographic features can play an important role in distinguishing tree species with different spatial distributions and effectively participate in the classification of tree species [19,33,34].
The SRTM DEM data was the primary data source for extracting topographic variables related to the growth environment of trees. The slope and aspect of the study area were calculated from DEM data (Figure 4). The results show that the elevation range of the study area is between 628 m and 2666 m, the slope range is between 0° and 72°, and the slope direction includes eight directions.
Furthermore, we used the overlay statistical analysis method to explore the distribution area and spatial distribution characteristics (including elevation, slope and aspect distribution) of target tree species by combining the most accurate classification results with topographic data.

2.3.5. Random Forest

Random forest is a non-parametric classification method used in machine learning. It uses the Bagging method to generate an independent set of identically distributed training samples for each decision tree. The final classification result depends on the votes of all decision trees [35]. The importance of random forest features can be evaluated by using Mean Decrease in Gini (MDG).
The feasibility and applicability of the random forest model for tree species classification have been proven [10,11]. We adjusted the number of trees to 200. The extracted spectral features, NDVI time series and phenological features, texture features, and topographic features were used as input variables in the classification process. A random forest tree species classification model was constructed according to the combination of four different features.
In this study, a sample dataset was selected for training and validation based on remote sensing images and the vegetation type distribution map with a scale of 1:1,650,000. The overall sample size of this study was 538. Training samples and validation samples accounted for approximately 70% and 30%, respectively. In the process of selecting training data and verification data, a random selection method was adopted to ensure that the training data and verification data obey the same distribution conditions.
The average MDG was used as an evaluation index to measure the importance of features, and the importance score was normalized. The confusion matrix was used to evaluate the classification results. The four verification indicators were determined, including overall accuracy (OA), Kappa coefficient (KC), production accuracy (PA), and user accuracy (UA).

3. Results

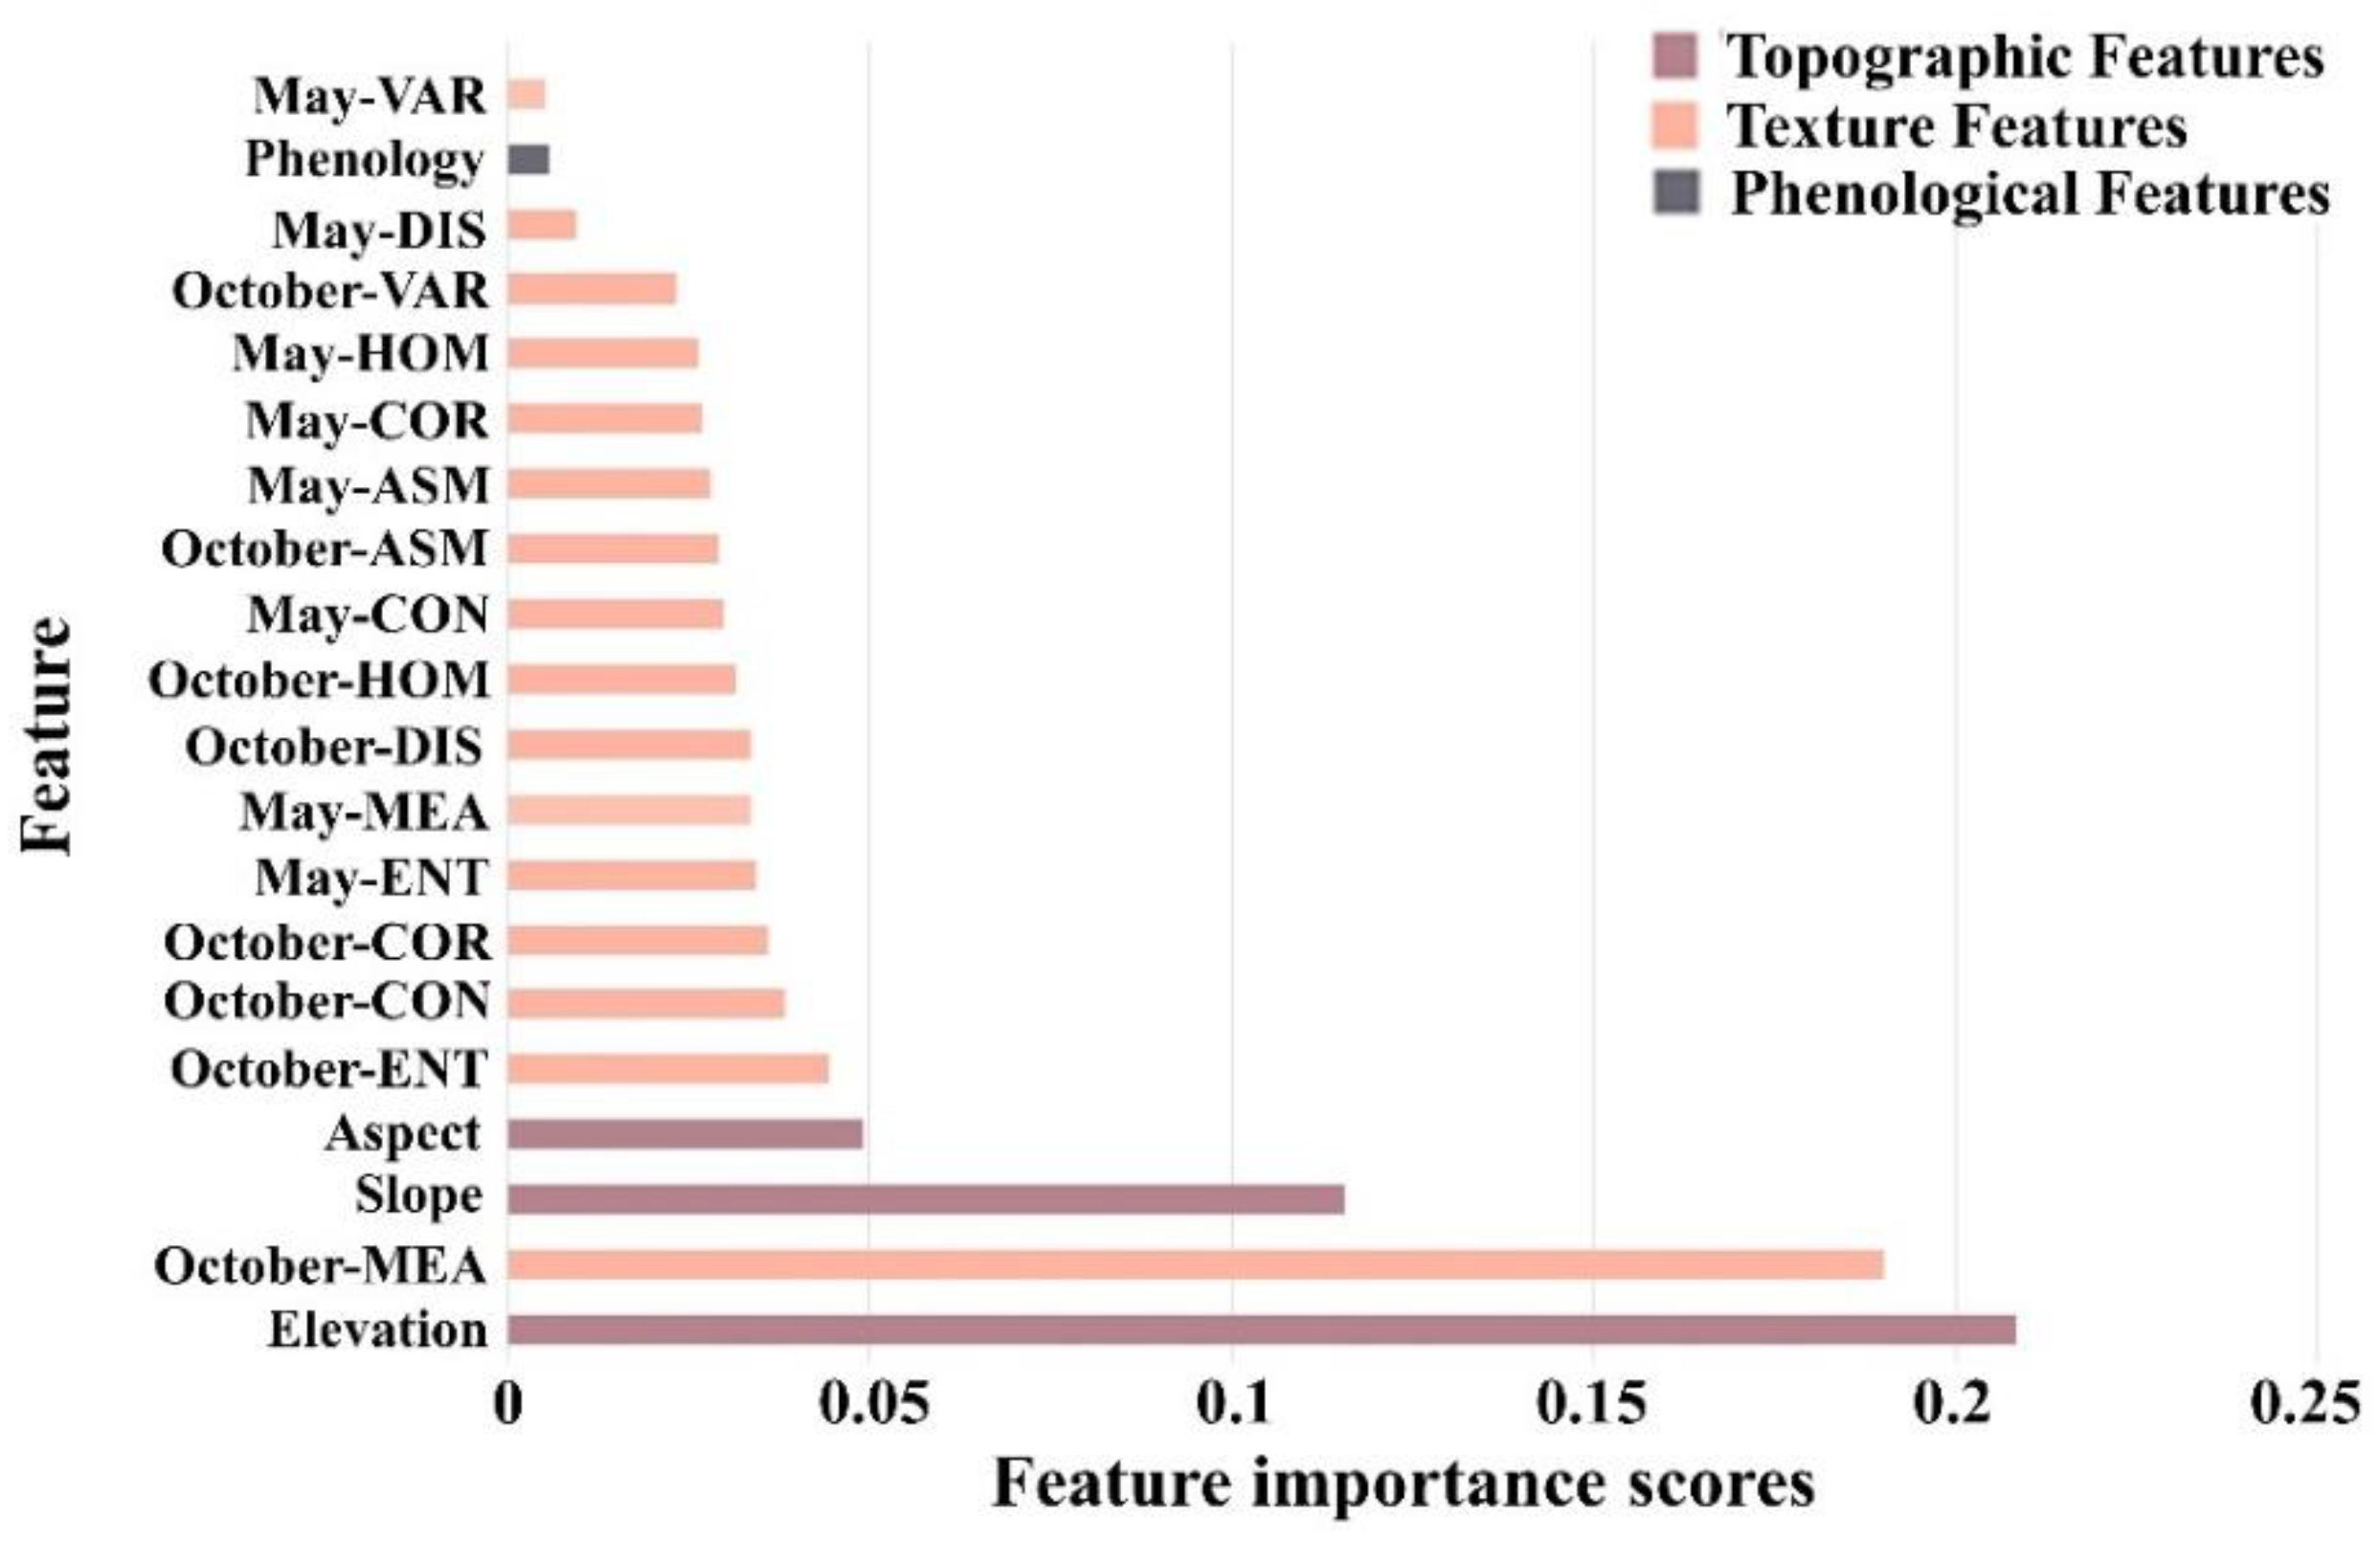
3.1. Feature Importance

The MDG values in the random forest feature importance assessment were normalized to rank the importance of all features used in the study. We list the top 20 features of importance in Figure 5. By comparing the importance scores of the features, we found that the importance of topographic features is relatively high, and the importance of elevation is the highest. The most significant texture feature factor is the mean texture feature of the October image, but the importance scores of other texture features are all less than 0.05. The classification contribution of slope and aspect is higher than other texture features. In October, the canopy texture of different tree species has relatively significant differences. However, the importance of phenological features is not distinct in this study.

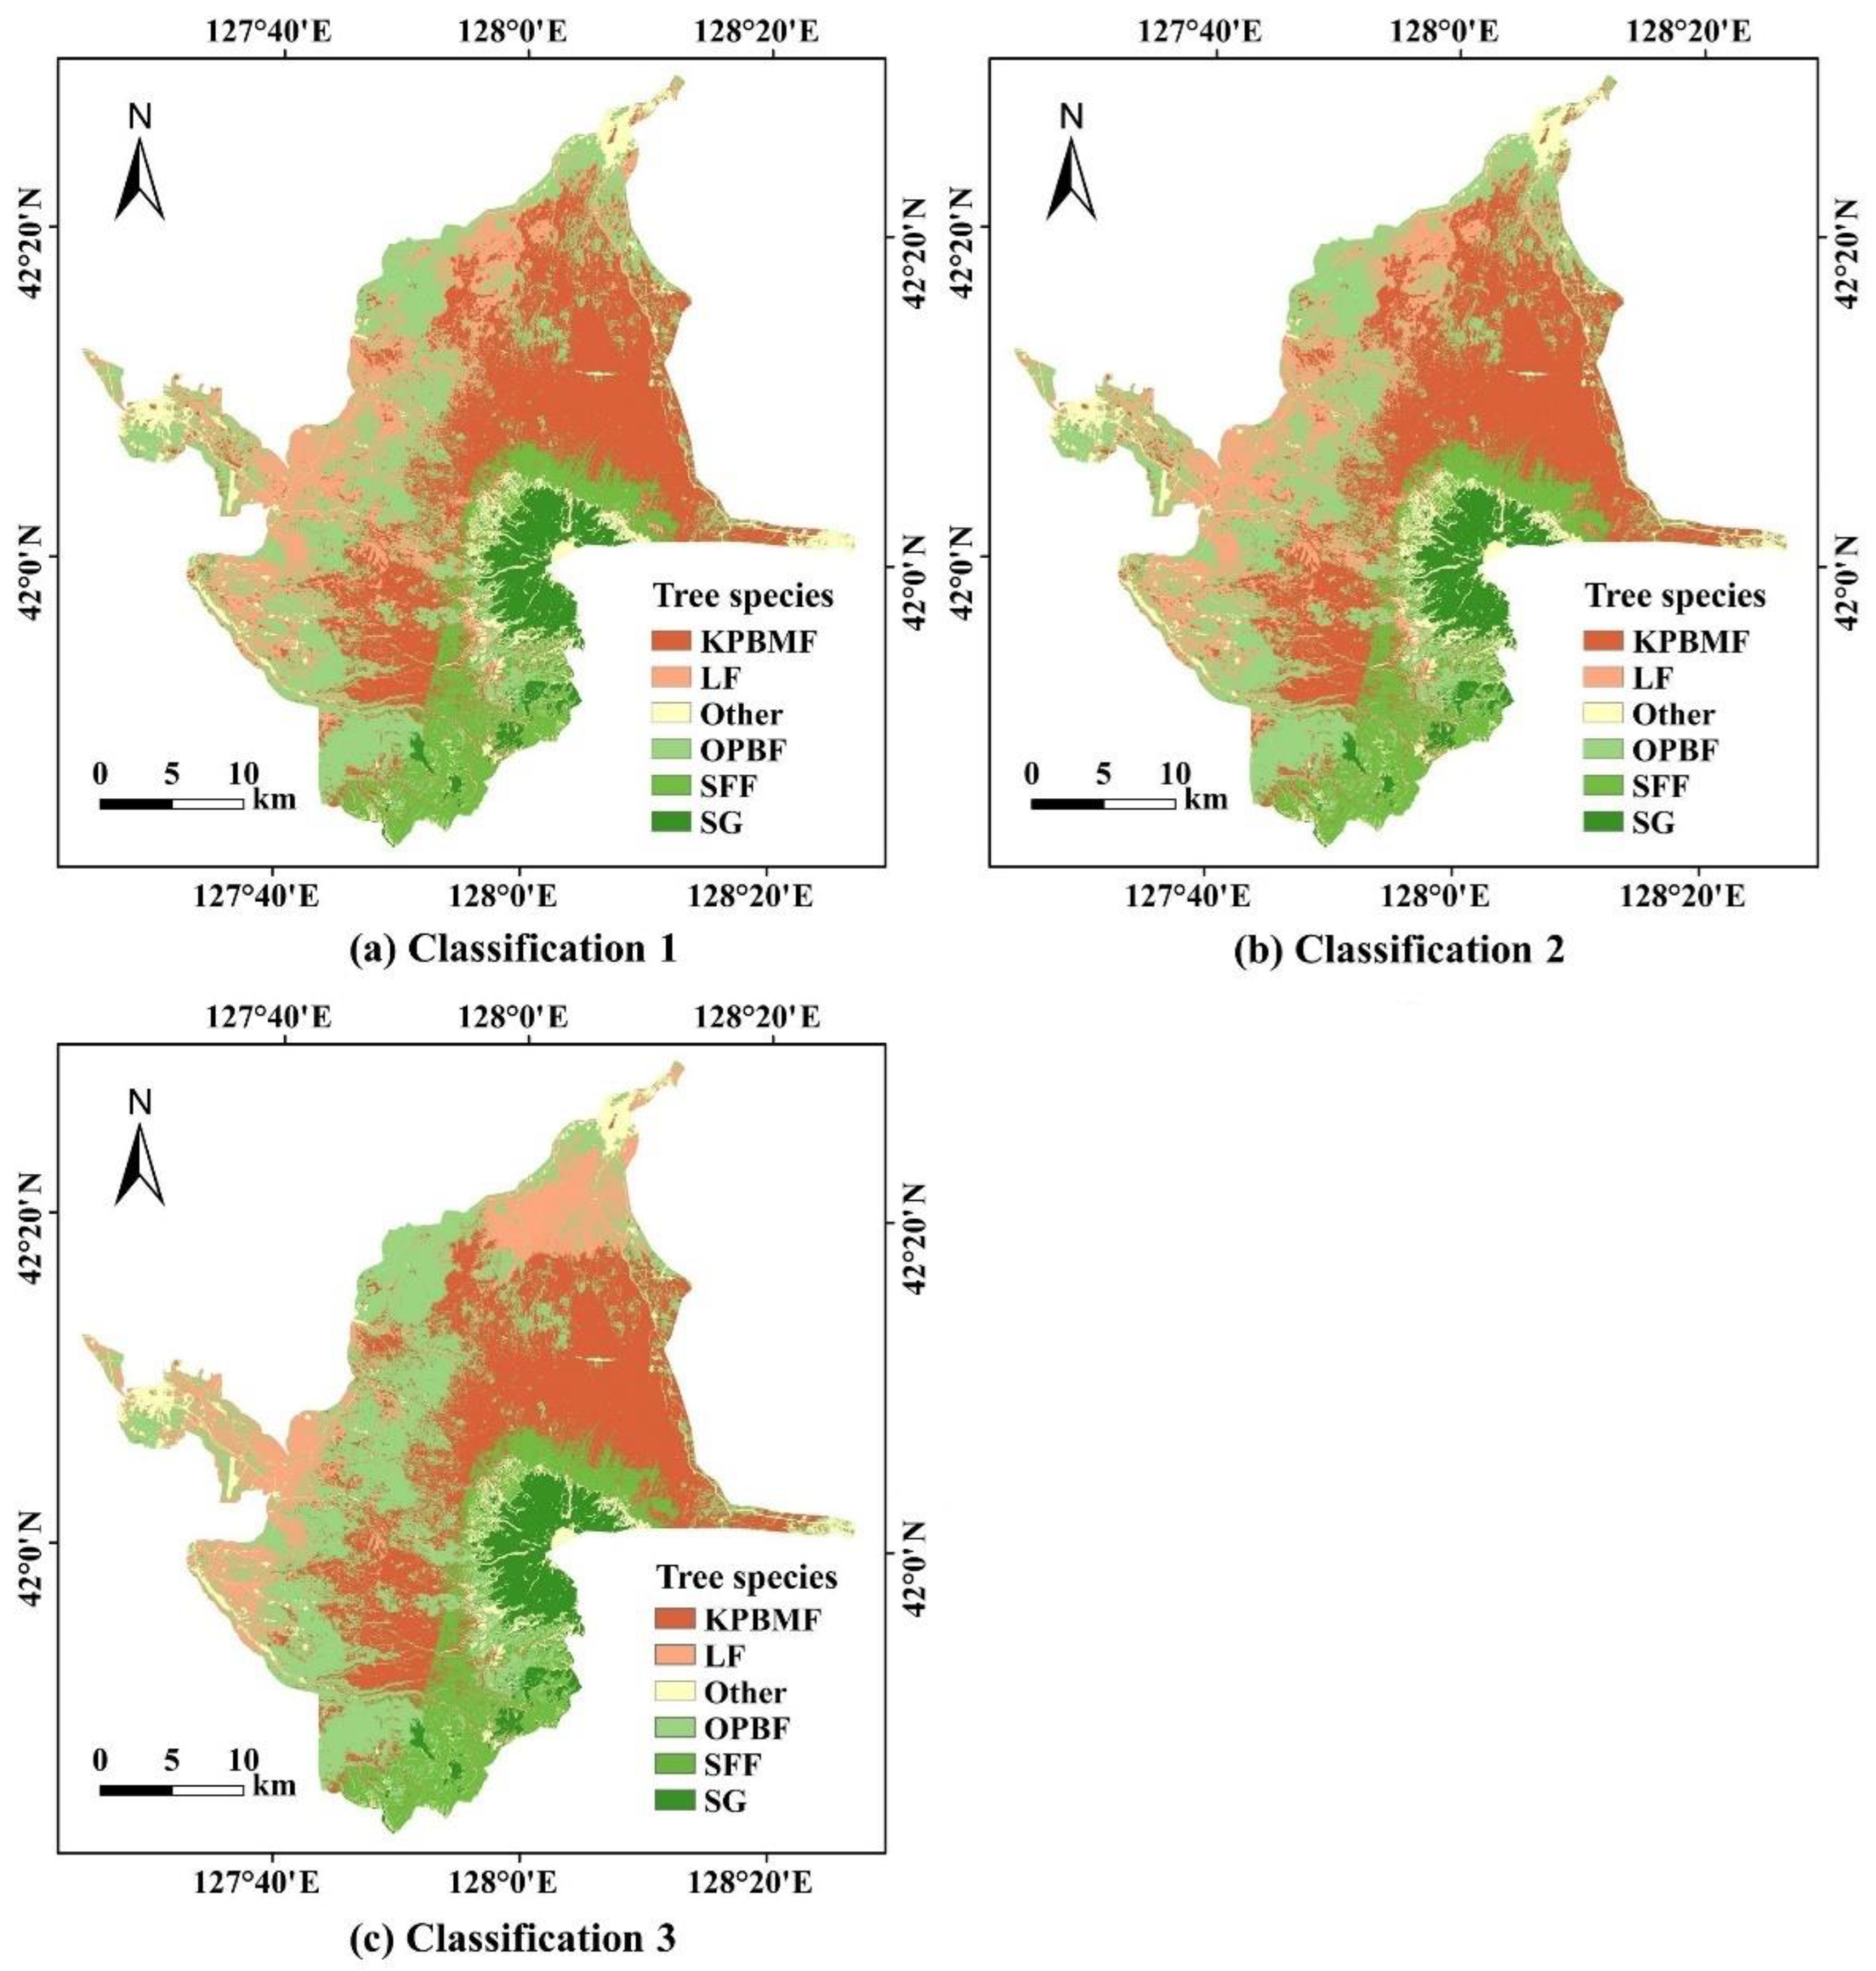
3.2. Tree Species Classification

The classification results of tree species based on different combinations of features are shown in Table 1. The accuracy of Classification 1 is the result of classification combined with spectral features and phenological features. The OA is 94.55%, and the KC is 0.9331. The accuracy of Classification 2 is the result of classification combined with spectral features and texture features. The OA is 94.93%, and the KC is 0.9378. There is no significant difference in the OA and KC between Classification 1 and Classification 2. The accuracy of Classification 3 is the result of classification combined with spectral features and topographic features. The OA is 99.79%, and the KC is 0.9974. Compared with the combination of phenological and texture features, the OA and KC of tree species classification by topographic feature-combination improved. Therefore, topographic features involved in classification have the least number of features and the highest accuracy. Furthermore, the accuracy results demonstrate that SFF and SG can be distinguished more easily than other tree species.
The tree species classification result map shows that the tree species distributions of Classification 1 and Classification 2 are roughly similar (Figure 6). However, the map of Classification 3 is more realistic. The main difference between higher accuracy and lower accuracy lies in the distinction of KPBMF, LF, and OPBF in the north of Changbai Mountain Protection Development Zone. In general, the tree species classification map shows that the northeast of Changbai Mountain is dominated by Korean pine broad-leaved mixed forest. Larch forests are mainly distributed in the west near built-up areas. There are patches of shrub grassland in the middle. Spruce-fir forests surround shrub grassland and the southern part of Changbai Mountain. Furthermore, the most widely distributed is oak poplar birch forest, and the least is shrub grassland. The distribution of oak poplar birch forests is relatively scattered, while the distribution of shrub grassland is concentrated.

3.3. Area Statistical Results of Tree Species

The statistical results of the distribution area show that the Changbai Mountain Protection Development Zone covers an area of about 32,360.57 ha, including about 27,704.88 ha of forest resources (Table 2). The largest area is OPBF (12,469.36 ha), accounting for 38.53%, followed by KPBMF (8054.74 ha), accounting for 24.89%. The tree species with the smallest distribution area is SFF (2422.56 ha), accounting for 7.49%. The distribution area of LF is relatively inconspicuous among them. The area distribution of these tree species may be closely related to the replacement of primary forests and secondary forests.

3.4. Topographic Statistical Results of Tree Species

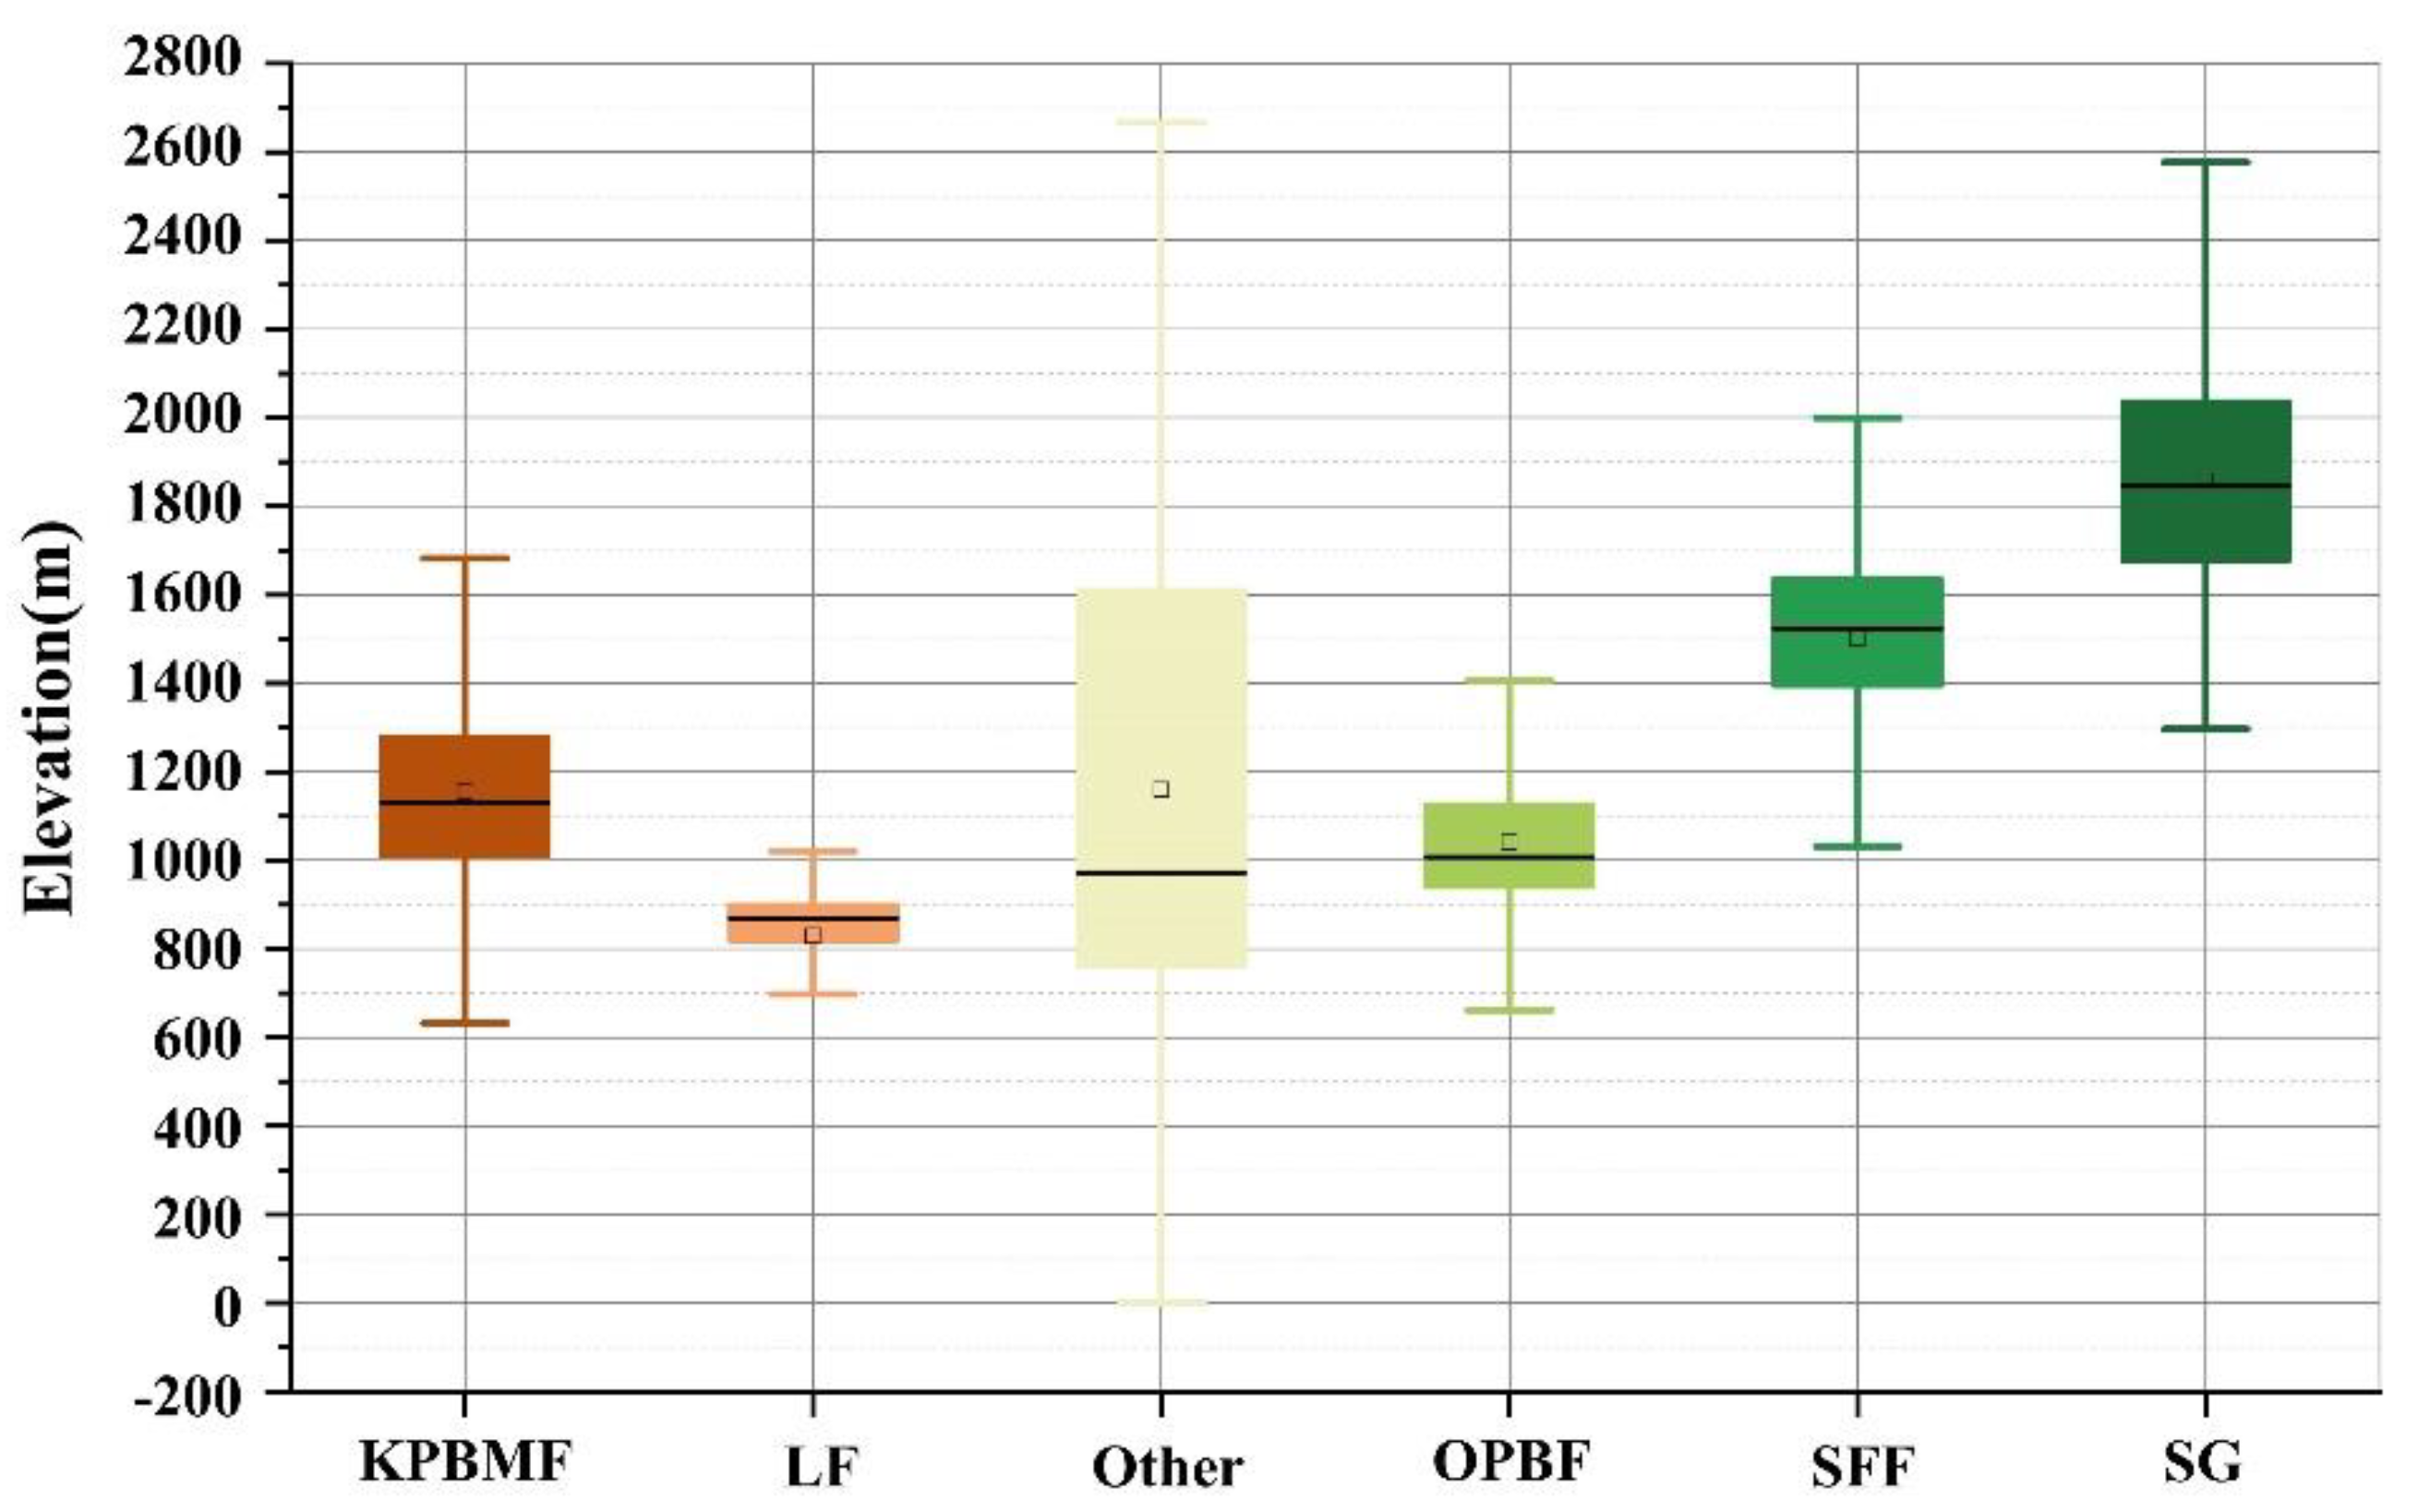
3.4.1. Elevation Factor
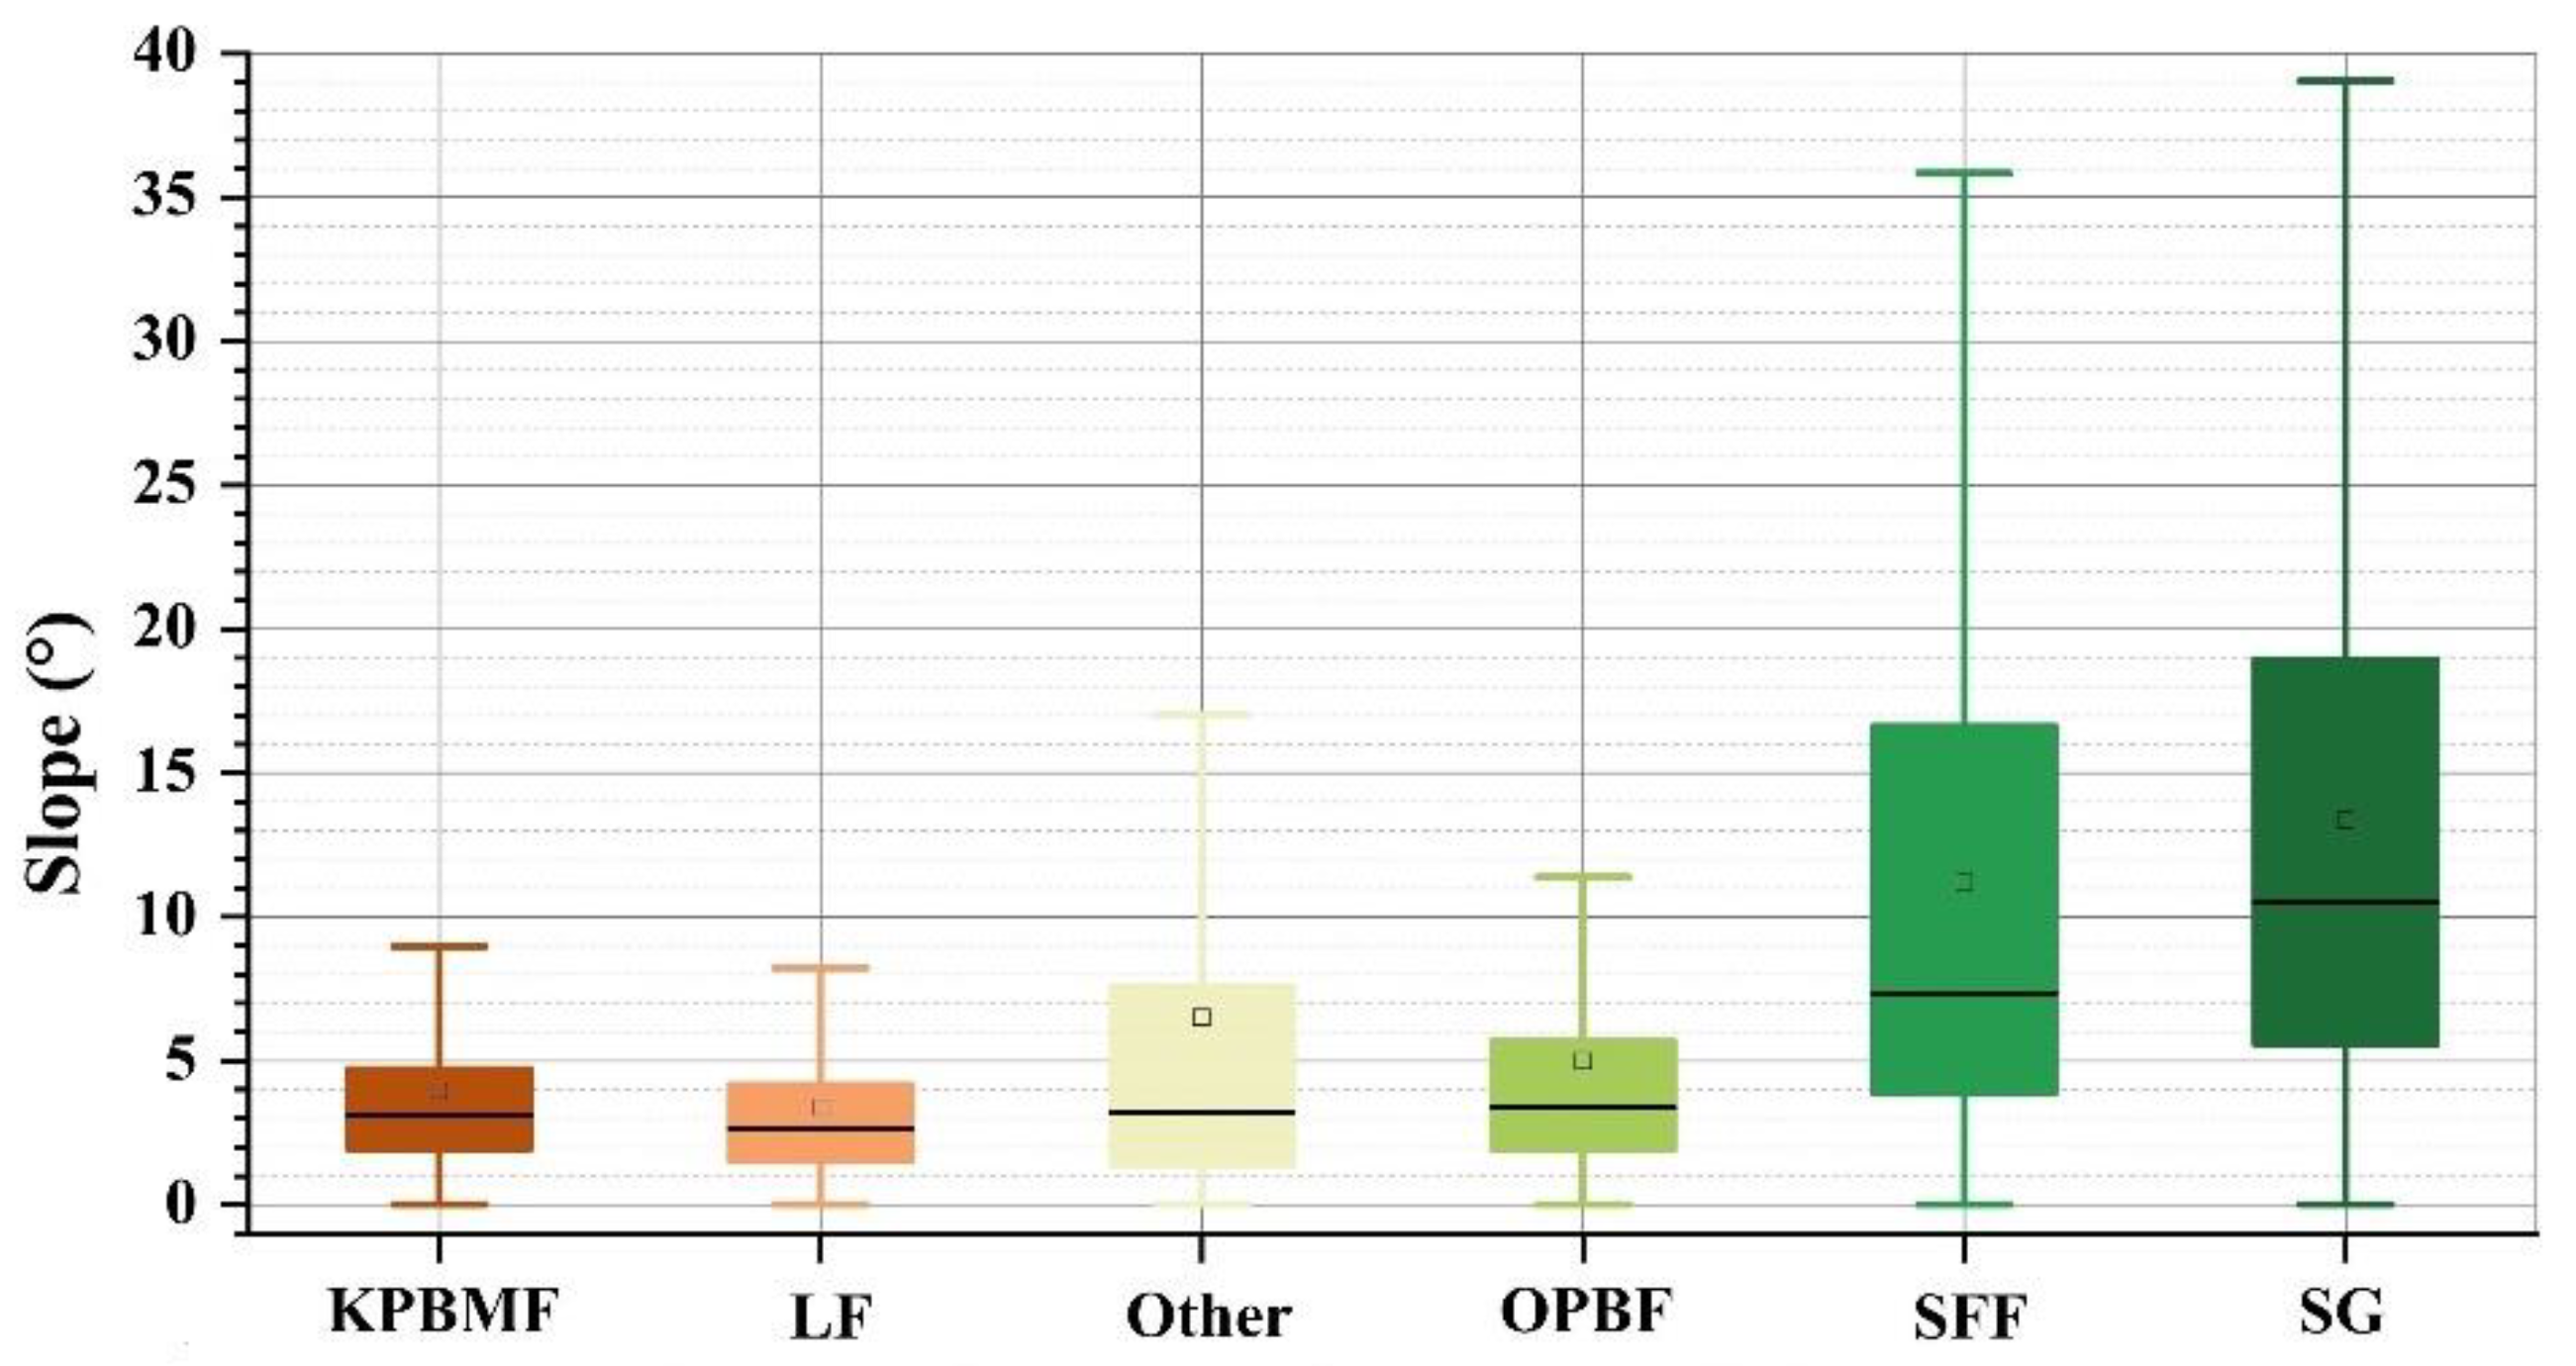
The box−and−whisker plot of tree species elevation distribution shows that by comparison there are differences in the elevation distribution of each type of tree species (Figure 7). The results reflect the fact that the KPBMF distribution range is between 1000 m and 1300 m, and the average elevation is 1158 m (Figure 7, Table 3). LF is between 800 m and 900 m and has the smallest elevation range, with an average elevation of 852 m. It is mostly distributed in low-lying swamp areas along the river. OPBF is between 940 m and 1140 m, with an average elevation of 1061 m. SFF is between 1390 m and 1650 m, with an average elevation of 1527 m. SG is between 1680 m and 2050 m and has the highest elevation range, with an average elevation of 1885 m. Through the analysis, it can be summarized that the distribution of tree species in Changbai Mountain Protection Development Zone has an obvious vertical forest distribution zone.

3.4.2. Slope Factor

The box−and−whisker plot of tree species slope distribution shows that, by comparison, there are few differences in the slope distribution of KPBMF, LF and OPBF (Figure 8). The results show that the Korean pine broad-leaved mixed forest distribution range is between 1.8° and 4.9°, and the average slope is 3.8° (Figure 8, Table 4). The larch forest is between 1.3° and 4.3°, with an average slope of 3.5°. Oak poplar birch forests are between 1.8° and 5.8°, with an average slope of 5.4°. However, the spruce-fir forest is between 3.8° and 16.8°, with an average slope of 11.8°. The shrub grassland is between 5.4° and 19.0°, with an average slope of 12.8°. To further analyze the relationship between the distribution of tree species and slope, the slope is divided into four classes, namely flat slope (0°–5°), gentle slope (6°–15°), abrupt slope (16°–25°), and other slopes (≥26°). The results demonstrate that the relationship between the distribution of forest tree species and slope in Changbai Mountain Protection Development Zone is relatively obvious. Shrub grassland has the widest range of slopes, mostly on gentle slopes and a little on abrupt slopes. Most of the other tree species are distributed on flat and gentle slopes.

3.4.3. Aspect Factor

The radar chart of tree species aspect distribution shows that KPBMF and LF are mainly distributed on the northern slope, followed by the northwestern slope (Figure 9). It is clear that KPBMF and LF are relatively less distributed on the southern slope and southeastern slope. SFF is mainly distributed on the northern slope and northwestern slope, while OPBF and SG are mainly distributed on the western slope. Overall, most tree species are distributed on the northern slope, northwestern slope and western slope, and rarely on the southern slope and southeastern slope.

4. Discussion

Previous studies [7,10,14] used multi-temporal remote sensing images, feature combination, and the random forest algorithm, respectively, to classify tree species. However, few studies have combined these approaches. Furthermore, the phenological information, texture characteristics and topographic environment of the tree species that we comprehensively considered were scarce before. Therefore, we constructed a multi-feature random forest tree species classification model by different feature-combinations to analyze the optimal feature factors of tree species classification. Our results showed that the classification model was conducive to distinguishing tree species and it could obtain high accuracy (Table 1).
Separating tree species will be aided by the difference in reflectance [36]. The JM distance and spectral reflectance determine the separability of tree species for subsequent classification. In the combination of features based on spectral features, the participation of phenological features and texture features can effectively separate tree species, but the two different features have different emphases. Phenological features highlight the growth status and spectral differences in multi-season tree species [27]. In the Changbai Mountain Protection Development Zone, Korean pine, spruce, and fir are all evergreen trees. The larch, oak, poplar, and birch forests are deciduous trees. Compared with evergreen trees, the leaf growth and color changes of deciduous trees in different seasons will be relatively significant. In contrast, texture features highlight the crown texture shape of the tree species [29]. According to previous surveys, the crown of the Korean pine is generally an umbrella-shaped star, and the branches extend in all directions [23]. Larch tree show tower or umbrella type crowns. The spruce canopy is broadly conical. The fir has a conical or spire-shaped crown with dense foliage [37]. The classification in which topographic features are involved has relatively high accuracy with the least number of features. Feature importance analysis in this study demonstrates that topographic features are of the highest importance (Figure 5). Compared with phenological features and texture features, topographic features play essential roles in the classification of random forest tree species based on the fusion of different features, among which the elevation factor is the optimal feature factor. This confirms that topographic factors greatly influence species composition and tree growth [33].
Through topographic statistical analysis of tree species distribution, we found that a vertical distribution zone suitable for the growth of different tree species is formed from bottom to top: LF, OPBF, KPBMF, SFF, and SG. The main reason is that as the altitude increases, the rainfall increases and the temperature decreases, forming an environment suitable for the growth of different tree species from bottom to top [38]. However, temperature is the limiting factor in high latitude areas, and precipitation is the limiting factor in low latitude areas [39]. The altitude in which the tree species are located in the Changbai Mountain Protection Development Zone has distinct vertical characteristics, a finding that is consistent with previous studies [40]. In addition, the relationship between the distribution of tree species and the slope is relatively significant, and most of the tree species are distributed on flat and gentle slopes. The soil moisture and nutrient conditions are better in flat and gentle slope areas, which are suitable for growing all kinds of trees and grass [41]. The aspect mainly affects vegetation growth by affecting solar radiation and light conditions, especially in mountainous areas with complex terrain. The radiation balance is an important factor affecting the growth and development of vegetation [42]. Most tree species are primarily distributed on the northern slope, northwestern slope and western slope of Changbai Mountain, because environmental conditions such as sunlight, rainfall, and temperature are more suitable for the survival of tree species such as Korean pine, larch, spruce, and fir [38]. Therefore, the northern aspect of Changbai Mountain is a crucial area for tree species research [38,43].
Our classification map (Figure 6) shows that the most widely distributed is oak poplar birch forest, and the least is shrub grassland. This is related to the wide distribution of intolerant tree species contained in oak poplar birch forests. The oak poplar birch forest is mainly a secondary forest. Because of the replacement of tree species after the serious destruction of the primary forest, the shade-tolerant conifer and broadleaf species in the primary forest were replaced by poplar, birch, Mongolian oak and other intolerant tree species. The Mongolian oak forest is the most widely distributed and the largest forest vegetation community in the secondary forest. Poplar birch forests are forest vegetation types composed of aspens, white birch, and some willow (Salix rorida Laksch.) and alder (Alnus sibirica). Therefore, the oak poplar birch forest contains many intolerant tree species, which are widely distributed [44]. The shrub grassland is concentrated in high mountains and cold areas, and the area is not as large as the tree species in relatively low altitude areas.

5. Conclusions

Considering various factors related to tree growth, such as spectral information, texture structure, vegetation phenology and topographic environment, we highlighted the importance of feature selection. By comparison, we found that the accuracy of topographic features is higher than that of phenological features and texture features in the classification of Changbai Mountain tree species by different feature-combinations and random forest method. According to the random forest importance ranking, the elevation factor had the highest importance. The spatial distribution analysis of tree species explains the importance of topographic features because tree species in Changbai Mountain have obvious vertical characteristics. According to the growth habits of different tree species, the spatial distribution of tree species will be different. However, in terms of slope and aspect, most tree species are distributed on flat and gentle slopes, and the main tree species are primarily distributed on the western slope, northern slope, and northwestern slope in Changbai Mountain. Our next goal is to conduct a more detailed identification and spatial heterogeneity study of tree species from population to single category in different study areas. However, the rapid development of forest resource monitoring technology places higher requirements on spatial resolution and forest parameters. The classification of tree species will develop towards real-time, three-dimensional monitoring, and refinement.

Author Contributions

Conceptualization, M.W. and M.L.; methodology, M.L.; software, M.L.; validation, M.W., F.W. and X.J.; formal analysis, M.L.; investigation, M.L.; data curation, M.L.; writing—original draft preparation, M.L. and M.W.; writing—review and editing, X.J.; visualization, M.W.; project administration, M.W.; funding acquisition, M.W. and F.W. All authors have read and agreed to the published version of the manuscript.

Funding

This research was funded by National Natural Science Foundation of China, grant numbers 42171407, 42077242; Natural Science Foundation of Jilin province, grant number 20210101098JC; Open Fund of Key Laboratory of Urban Land Resources Monitoring and Simulation, Ministry of Natural Resources, grant number KF-2020-05-024 and National Key R&D Program of China, grant number 2021YFD1500100.

Institutional Review Board Statement

Not applicable.

Informed Consent Statement

Not applicable.

Data Availability Statement

Not applicable.

Conflicts of Interest

The authors declare no conflict of interest.

References

  1. Ottosen, T.B.; Petch, G.; Hanson, M.; Skjoth, C.A. Tree cover mapping based on Sentinel-2 images demonstrate high thematic accuracy in Europe. Int. J. Appl. Earth Obs. Geoinf. 2020, 84, 101947. [Google Scholar] [CrossRef] [PubMed]
  2. Sprott, A.H.; Piwowar, J.M. How to recognize different types of trees from quite a long way away: Combining UAV and spaceborne imagery for stand-level tree species identification. J. Unmanned Veh. Syst. 2021, 9, 166–181. [Google Scholar] [CrossRef]
  3. Wang, M.C.; Zhang, X.Y.; Niu, X.F.; Wang, F.Y.; Zhang, X.Q. Scene Classification of High-Resolution Remotely Sensed Image Based on ResNet. J. Geovis. Spat. Anal. 2019, 3, 16. [Google Scholar] [CrossRef]
  4. Cho, M.A.; Mathieu, R.; Asner, G.P.; Naidoo, L.; van Aardt, J.; Ramoelo, A.; Debba, P.; Wessels, K.; Main, R.; Smit, I.P.J.; et al. Mapping tree species composition in South African savannas using an integrated airborne spectral and LiDAR system. Remote Sens. Environ. 2012, 125, 214–226. [Google Scholar] [CrossRef]
  5. Turner, W.; Spector, S.; Gardiner, N.; Fladeland, M.; Sterling, E.; Steininger, M. Remote sensing for biodiversity science and conservation. Trends Ecol. Evol. 2003, 18, 306–314. [Google Scholar] [CrossRef]
  6. Axelsson, A.; Lindberg, E.; Reese, H.; Olsson, H. Tree species classification using Sentinel-2 imagery and Bayesian inference. Int. J. Appl. Earth Obs. Geoinf. 2021, 100, 102318. [Google Scholar] [CrossRef]
  7. Xi, Y.; Ren, C.; Wang, Z.; Wei, S.; Bai, J.; Zhang, B.; Xiang, H.; Chen, L. Mapping tree species composition using OHS-1 hyperspectral data and deep learning algorithms in Changbai mountains, Northeast China. Forests 2019, 10, 818. [Google Scholar] [CrossRef] [Green Version]
  8. Breidenbach, J.; Waser, L.T.; Debella-Gilo, M.; Schumacher, J.; Rahlf, J.; Hauglin, M.; Puliti, S.; Astrup, R. National mapping and estimation of forest area by dominant tree species using Sentinel-2 data. Can. J. For. Res. 2021, 51, 365–379. [Google Scholar] [CrossRef]
  9. Rodriguez-Galiano, V.F.; Ghimire, B.; Rogan, J.; Chica-Olmo, M.; Rigol-Sanchez, J.P. An assessment of the effectiveness of a random forest classifier for land-cover classification. Isprs J. Photogramm. Remote Sens. 2012, 67, 93–104. [Google Scholar] [CrossRef]
  10. Grabska, E.; Hostert, P.; Pflugmacher, D.; Ostapowicz, K. Forest Stand Species Mapping Using the Sentinel-2 Time Series. Remote Sens. 2019, 11, 1197. [Google Scholar] [CrossRef] [Green Version]
  11. Plakman, V.; Janssen, T.; Brouwer, N.; Veraverbeke, S. Mapping Species at an Individual-Tree Scale in a Temperate Forest, Using Sentinel-2 Images, Airborne Laser Scanning Data, and Random Forest Classification. Remote Sens. 2020, 12, 3710. [Google Scholar] [CrossRef]
  12. Wessel, M.; Brandmeier, M.; Tiede, D. Evaluation of Different Machine Learning Algorithms for Scalable Classification of Tree Types and Tree Species Based on Sentinel-2 Data. Remote Sens. 2018, 10, 1419. [Google Scholar] [CrossRef] [Green Version]
  13. Boyd, D.S.; Danson, F.M. Satellite remote sensing of forest resources: Three decades of research development. Prog. Phys. Geogr. 2005, 29, 1–26. [Google Scholar] [CrossRef]
  14. Immitzer, M.; Neuwirth, M.; Bock, S.; Brenner, H.; Vuolo, F.; Atzberger, C. Optimal Input Features for Tree Species Classification in Central Europe Based on Multi-Temporal Sentinel-2 Data. Remote Sens. 2019, 11, 2599. [Google Scholar] [CrossRef] [Green Version]
  15. Immitzer, M.; Vuolo, F.; Atzberger, C. First Experience with Sentinel-2 Data for Crop and Tree Species Classifications in Central Europe. Remote Sens. 2016, 8, 166. [Google Scholar] [CrossRef]
  16. Persson, M.; Lindberg, E.; Reese, H. Tree Species Classification with Multi-Temporal Sentinel-2 Data. Remote Sens. 2018, 10, 1794. [Google Scholar] [CrossRef] [Green Version]
  17. Kollert, A.; Bremer, M.; Low, M.; Rutzinger, M. Exploring the potential of land surface phenology and seasonal cloud free composites of one year of Sentinel-2 imagery for tree species mapping in a mountainous region. Int. J. Appl. Earth Obs. Geoinf. 2021, 94, 102208. [Google Scholar] [CrossRef]
  18. Lim, J.; Kim, K.M.; Jin, R. Tree Species Classification Using Hyperion and Sentinel-2 Data with Machine Learning in South Korea and China. Isprs Int. J. Geo-Inf. 2019, 8, 150. [Google Scholar] [CrossRef] [Green Version]
  19. Xie, Z.L.; Chen, Y.L.; Lu, D.S.; Li, G.Y.; Chen, E.X. Classification of Land Cover, Forest, and Tree Species Classes with ZiYuan-3 Multispectral and Stereo Data. Remote Sens. 2019, 11, 164. [Google Scholar] [CrossRef] [Green Version]
  20. Hua, L.Z.; Zhang, X.X.; Chen, X.; Yin, K.; Tang, L.N. A Feature-Based Approach of Decision Tree Classification to Map Time Series Urban Land Use and Land Cover with Landsat 5 TM and Landsat 8 OLI in a Coastal City, China. Isprs Int. J. Geo-Inf. 2017, 6, 331. [Google Scholar] [CrossRef] [Green Version]
  21. Dian, Y.Y.; Li, Z.Y.; Pang, Y. Spectral and Texture Features Combined for Forest Tree species Classification with Airborne Hyperspectral Imagery. J. Indian Soc. Remote Sens. 2015, 43, 101–107. [Google Scholar] [CrossRef]
  22. Forkuor, G.; Dimobe, K.; Serme, I.; Tondoh, J.E. Landsat-8 vs. Sentinel-2: Examining the added value of sentinel-2’s red-edge bands to land-use and land-cover mapping in Burkina Faso. GIScience Remote Sens. 2018, 55, 331–354. [Google Scholar] [CrossRef]
  23. Lim, J.; Kim, K.M.; Kim, E.H.; Jin, R. Machine Learning for Tree Species Classification Using Sentinel-2 Spectral Information, Crown Texture, and Environmental Variables. Remote Sens. 2020, 12, 2049. [Google Scholar] [CrossRef]
  24. Main-Knorn, M.; Pflug, B.; Louis, J.; Debaecker, V.; Muller-Wilm, U.; Gascon, F. Sen2Cor for Sentinel-2. Proc. Spie. 2017, 10427, 1042704. [Google Scholar]
  25. Chuine, I.; Beaubien, E.G. Phenology is a major determinant of tree species range. Ecol. Lett. 2001, 4, 500–510. [Google Scholar] [CrossRef] [Green Version]
  26. Zhu, X.L.; Liu, D.S. Accurate mapping of forest types using dense seasonal Landsat time-series. Isprs J. Photogramm. Remote Sens. 2014, 96, 1–11. [Google Scholar] [CrossRef]
  27. Xu, Z.Y.; Zhou, Y.; Wang, S.X.; Wang, L.T.; Li, F.; Wang, S.C.; Wang, Z.Q. A Novel Intelligent Classification Method for Urban Green Space Based on High-Resolution Remote Sensing Images. Remote Sens. 2020, 12, 3845. [Google Scholar] [CrossRef]
  28. Maillard, P. Comparing texture analysis methods through classification. Photogramm. Eng. Remote Sens. 2003, 69, 357–367. [Google Scholar] [CrossRef] [Green Version]
  29. Guo, X.J.; Zhang, C.C.; Luo, W.R.; Yang, J.; Yang, M. Urban Impervious Surface Extraction Based on Multi-Features and Random Forest. IEEE Access 2020, 8, 226609–226623. [Google Scholar] [CrossRef]
  30. Dabiri, Z.; Lang, S. Comparison of independent component analysis, principal component analysis, and minimum noise fraction transformation for tree species classification using APEX hyperspectral imagery. ISPRS Int. J. Geo-Inf. 2018, 7, 488. [Google Scholar] [CrossRef] [Green Version]
  31. Haralick, R.M. Statistical and structural approaches to texture. Proc. IEEE 1979, 67, 786–804. [Google Scholar] [CrossRef]
  32. Sesnie, S.E.; Gessler, P.E.; Finegan, B.; Thessler, S. Integrating Landsat TM and SRTM-DEM derived variables with decision trees for habitat classification and change detection in complex neotropical environments. Remote Sens. Environ. 2008, 112, 2145–2159. [Google Scholar] [CrossRef]
  33. Lu, D.; Weng, Q. A survey of image classification methods and techniques for improving classification performance. Int. J. Remote Sens. 2007, 28, 823–870. [Google Scholar] [CrossRef]
  34. Joy, S.M.; Reich, R.M.; Reynolds, R.T. A non-parametric, supervised classification of vegetation types on the Kaibab National Forest using decision trees. Int. J. Remote Sens. 2003, 24, 1835–1852. [Google Scholar] [CrossRef]
  35. Breiman, L. Random forests. Mach. Learn. 2001, 45, 5–32. [Google Scholar] [CrossRef] [Green Version]
  36. Fassnacht, F.E.; Latifi, H.; Sterenczak, K.; Modzelewska, A.; Lefsky, M.; Waser, L.T.; Straub, C.; Ghosh, A. Review of studies on tree species classification from remotely sensed data. Remote Sens. Environ. 2016, 186, 64–87. [Google Scholar] [CrossRef]
  37. Hu, X.S.; Zhong, G.G.; Qian, C.S.; Chen, H.Y.; Qin, R.C.; LIn, R.; Yu, D.J.; Wu, Z.Y. Flora Reipublicae Popularis Sinicae; Editorial Board of Flora Reipublicae Popularis Sinicae, Science Press: Beijing, China, 1978; Volume 7, p. 542. [Google Scholar]
  38. Kuang, X.; Xing, D.L.; Zhang, Z.C.; Song, H.J.; Wang, Y.Y.; Fang, S.; Yuan, Z.Q.; Ye, J.; Lin, F.; Wang, X.G.; et al. Species composition and community structure of a spruce-fir forest and a larch forest on the northern slope of Changbai Mountains, Northeast China. Ying Yong Sheng Tai Xue Bao J. Appl. Ecol. 2014, 25, 2149–2157. [Google Scholar]
  39. Zhuang, L.W.; Axmacher, J.C.; Sang, W.G. Different radial growth responses to climate warming by two dominant tree species at their upper altitudinal limit on Changbai Mountain. J. For. Res. 2017, 28, 795–804. [Google Scholar] [CrossRef]
  40. Jiang, Y.F.; Yin, X.Q.; Wang, F.B. Composition and Spatial Distribution of Soil Mesofauna Along an Elevation Gradient on the North Slope of the Changbai Mountains, China. Pedosphere 2015, 25, 811–824. [Google Scholar] [CrossRef]
  41. Zang, S.Y.; Gao, Y.K.; Zu, Y.G. Approach on Spatial Relationship between Forest Resources and Forest Site. J. Northeast. For. Univ. 2000, 28, 120–121. [Google Scholar]
  42. Wang, S.L.; Wang, X.Y.; Gai, X.R.; Zhou, L.; Zhou, W.M.; Han, Y.G.; Yu, D.P. Topography-dependent climatic sensitivities in spruce tree growth in the Changbai Mountain, Northeast China. Trees 2021, 35, 961–971. [Google Scholar] [CrossRef]
  43. Jin, Y.H.; Zhang, Y.J.; Xu, J.W.; Tao, Y.; He, H.S.; Guo, M.; Wang, A.L.; Liu, Y.X.; Niu, L.P. Comparative Assessment of Tundra Vegetation Changes Between North and Southwest Slopes of Changbai Mountains, China, in Response to Global Warming. Chin. Geogr. Sci. 2018, 28, 665–679. [Google Scholar] [CrossRef] [Green Version]
  44. Hou, X.Y.; Han, J.X. Regeneration and restoration of Korean pine broadleaf mixed forest in windfall area in Changbai mountain. Sci. Silvae Sin. 1996, 32, 419–425. [Google Scholar]
Figure 1. Location of the study site. The RGB composition of Sentinel-2 from 27 June 2019 (B4, B3 and B2).
Forests 13 01058 g001
Figure 2. Flowchart of method in this study.
Forests 13 01058 g002
Figure 3. The mean spectral reflectance for each tree species illustrated for each image date: (a) 3 May 2019, (b) 27 June 2019, (c) 25 September 2019, and (d) 20 October 2018. The increased reflectance of shrub grassland stands on 20 October 2018 can be attributed to the presence of a small amount of snow.
Forests 13 01058 g003
Figure 4. Topographic features.
Forests 13 01058 g004
Figure 5. Random forest feature importance for tree species classification.
Forests 13 01058 g005
Figure 6. Tree species classification map.
Forests 13 01058 g006
Figure 7. Box−and−whisker plot of Tree Species Elevation Distribution.
Forests 13 01058 g007
Figure 8. Box−and−whisker plot of Tree Species Slope Distribution.
Forests 13 01058 g008
Figure 9. Radar Chart of Tree Species Aspect Distribution.
Forests 13 01058 g009
Table 1. Accuracy of tree species classification.
ClassificationTree ClassKPBMFLFOtherOPBFSFFSG
Classification 1PA (%)97.4496.5593.9792.6990.5597.58
UA (%)92.1387.5596.6493.77100.00100.00
OA (%)94.55
KC0.9331
Classification 2PA (%)99.9691.4999.2498.18100.0099.90
UA (%)95.0498.5599.9399.58100.00100.00
OA (%)94.93
KC0.9378
Classification 3PA (%)100.00100.0099.9099.01100.00100.00
UA (%)99.1399.75100.00100.00100.00100.00
OA (%)99.79
KC0.9974
Table 2. The area statistics of tree species in Changbai Mountain Protection Development Zone.
KPBMFLFOtherOPBFSFFSGTotal
Area (ha)8054.744758.223769.5012,469.362422.56886.1932,360.57
Proportion (%)24.8914.7011.6538.537.492.74100
Table 3. Average elevation of tree species in Changbai Mountain Protection Development Zone.
KPBMFLFOtherOPBFSFFSG
Elevation (m)11588521231106115271885
Table 4. Average slope of tree species in Changbai Mountain Protection Development Zone.
KPBMFLFOtherOPBFSFFSG
Slope (°)3.83.57.35.411.812.8
Publisher’s Note: MDPI stays neutral with regard to jurisdictional claims in published maps and institutional affiliations.

