Article

The Soil Aggregates and Associated Organic Carbon across the Greater Khingan Mountains: Spatial Patterns and Impacting Factors

1
Forestry College, Inner Mongolia Agricultural University, Hohhot 010019, China
2
Forest Ecosystem National Observation and Research Station of Greater Khingan Mountains in Inner Mongolia, Genhe 022350, China
3
College of Economics and Management, Hebei North University, Zhangjiakou 075000, China
*
Author to whom correspondence should be addressed.
Forests 2022, 13(8), 1267; https://doi.org/10.3390/f13081267
Submission received: 21 June 2022 / Revised: 5 August 2022 / Accepted: 8 August 2022 / Published: 10 August 2022
(This article belongs to the Section Forest Soil)

Abstract

:
(1) Background: The preservation of soil organic carbon (SOC) by soil aggregates (SA) is a key mechanism for the stability of the soil carbon (C) pool. (2) Methods: Soil samples were collected at a 0–20 cm depth from 75 sites across the forest regions of the Greater Khingan Mountains, China, and were fractionated as SA of 0.25–2 mm, 0.053–0.25 mm, and <0.053 mm by a wet-sieving method. The spatial patterns of SA and associated organic C (OC) were investigated, as well as their associations with environmental factors. (3) Results: The predominant SA was the SA fraction (SAF) of 0.25–2 mm. The spatial pattern of SA, with moderate spatial autocorrelation, was found to be associated with aggregate size. SOC was mainly accumulated in the 0.25–2 mm SAF, accounting for 50.39% of the total content of aggregate SOC; the total SOC content in all SAF showed strong spatial autocorrelations without significant differences. No significant correlations were found between temperature and SA variables. Precipitation presented significantly positive and negative correlations with the SAF of <0.053 mm and 0.053–0.25 mm, respectively. SOC was favorably associated with macroaggregate, geometric mean diameter (GMD), and mean weight diameter (MWD); however, the correlation between SOC and aggregate SOC lessened as particle size decreased. The aggregate SOC contents were significantly linked with NH4+-N, AK, and TP, while 0.25–2 mm SA content was negatively related with pH. (4) Conclusions: Precipitation was helpful for the development of clay aggregates (<0.053 mm), i.e., increasing rainfall-induced aggregate disruption. SOC encourages small SA cementing to large SA, which improves SA stability. OC associated with the SAF of 0.25–2 mm and 0.053–0.25 mm was positively correlated with soil nutrients such as nitrogen, phosphorus, and potassium, suggesting that the formation of aggregates was conducive to the preservation of soil nutrients.

1. Introduction

Forest soils account for the largest carbon (C) pool in the terrestrial ecosystem [1]. Its weak variation will cause an increase or decrease in atmospheric CO2 concentration, which is vital in regulating the dynamic change in global C [2,3,4]. As a result of climate change, the elevation of soil organic C (SOC) sequestration has gained more and more attention because it is considered an effective approach for reducing CO2 concentrations in the atmosphere [5,6]. Mineral particles and soil organic matter (SOM) condense and cement to form aggregates, which are soil structural units [7]. The SOC protected in aggregates is closely associated with the soil C pool [8]. It is reported that different soil aggregate fractions (SAFs) are presumed to be key for nutrient provision, preservation [9,10], and inherently C storage [6,11]. For instance, organic C (OC) is stored more efficiently in large soil aggregates (SA) [12]. The OC stability in SA depends on the particle size due to the diverse protective mechanisms of SA against OC. Accordingly, the C pattern in SA is a key to understanding the dynamics of SOM, as well as the role of OC in SA stability [13].
In recent years, the characteristics of SA and associated OC in various forest types [7,14,15] and land use types [16,17,18] have been widely studied. Land use types may reorganize and redistribute nutrients in SA through influencing soil structure and microbial activities, plant litter species, amount, and residue [19]. The effects of different forest types on SA are mainly reflected in the fraction with large grain sizes [20]. Additionally, soil features, environmental conditions, and human actions can also influence the SA formation [21]. Long-term nitrogen (N), phosphorus (P), and potassium (K) fertilization are reported to enhance soil stability and aggregation, as well as the stock and mineralization of aggregate-associated OC [22]. On the other hand, SA contains abundant C, N, P, and K [23], whose availability is associated with the size of SA [24]. The nutrients, especially C and N, can shape the bacterial community structure under the SA level [23,25]. The pivotal role of SA nutrient heterogeneity (C, N, P, and K) regulates the soil microbial community and biodiversity [26], and further impacts microbial functional processes [23]. The aforementioned studies on SA were mostly performed in small-scale areas, while the importance and effect of SA at the ecosystem scale is almost unknown. Generally, a significant spatial heterogeneity of SAF is always observed at various scales [27]. Macro-scale research is needed to reveal the spatial patterns and internal driving mechanisms of SA, which will help us to understand the formations and stability mechanisms of SA in depth [28]. In addition, forest scientific management also requires a comprehensive understanding of the environmental factors influencing SA spatial variation.
The Greater Khingan Mountains are the largest original forest area in China. They are a key base of forestry and C storage, as well as a national natural ecological security barrier in northern China. The Natural Forest Protection project was launched from 1999 to protect and restore the forest ecosystem in the Greater Khingan Mountains, where studies have been carried out on SA related to forest vegetation types [29], land use types [30], restoration approaches [31], and fire density [32]. However, these works focus on local areas of small scale. Accordingly, it is hypothesized that there should be differences in SA spatial patterns at a whole forest region scale; the heterogeneity would be associated with the soil physicochemical properties (pH, particle size, and stability), nutrient content (C, N, P, and K), and environmental conditions such as temperature and precipitation. Our objectives were to (1) investigate the spatial variations in SAF and associated OC content at a whole forest region scale, and (2) explore the associations of SA and aggregate SOC with environmental factors. This work is helpful for forest scientific management and the elevation of forest ecosystem services.

2. Materials and Methods
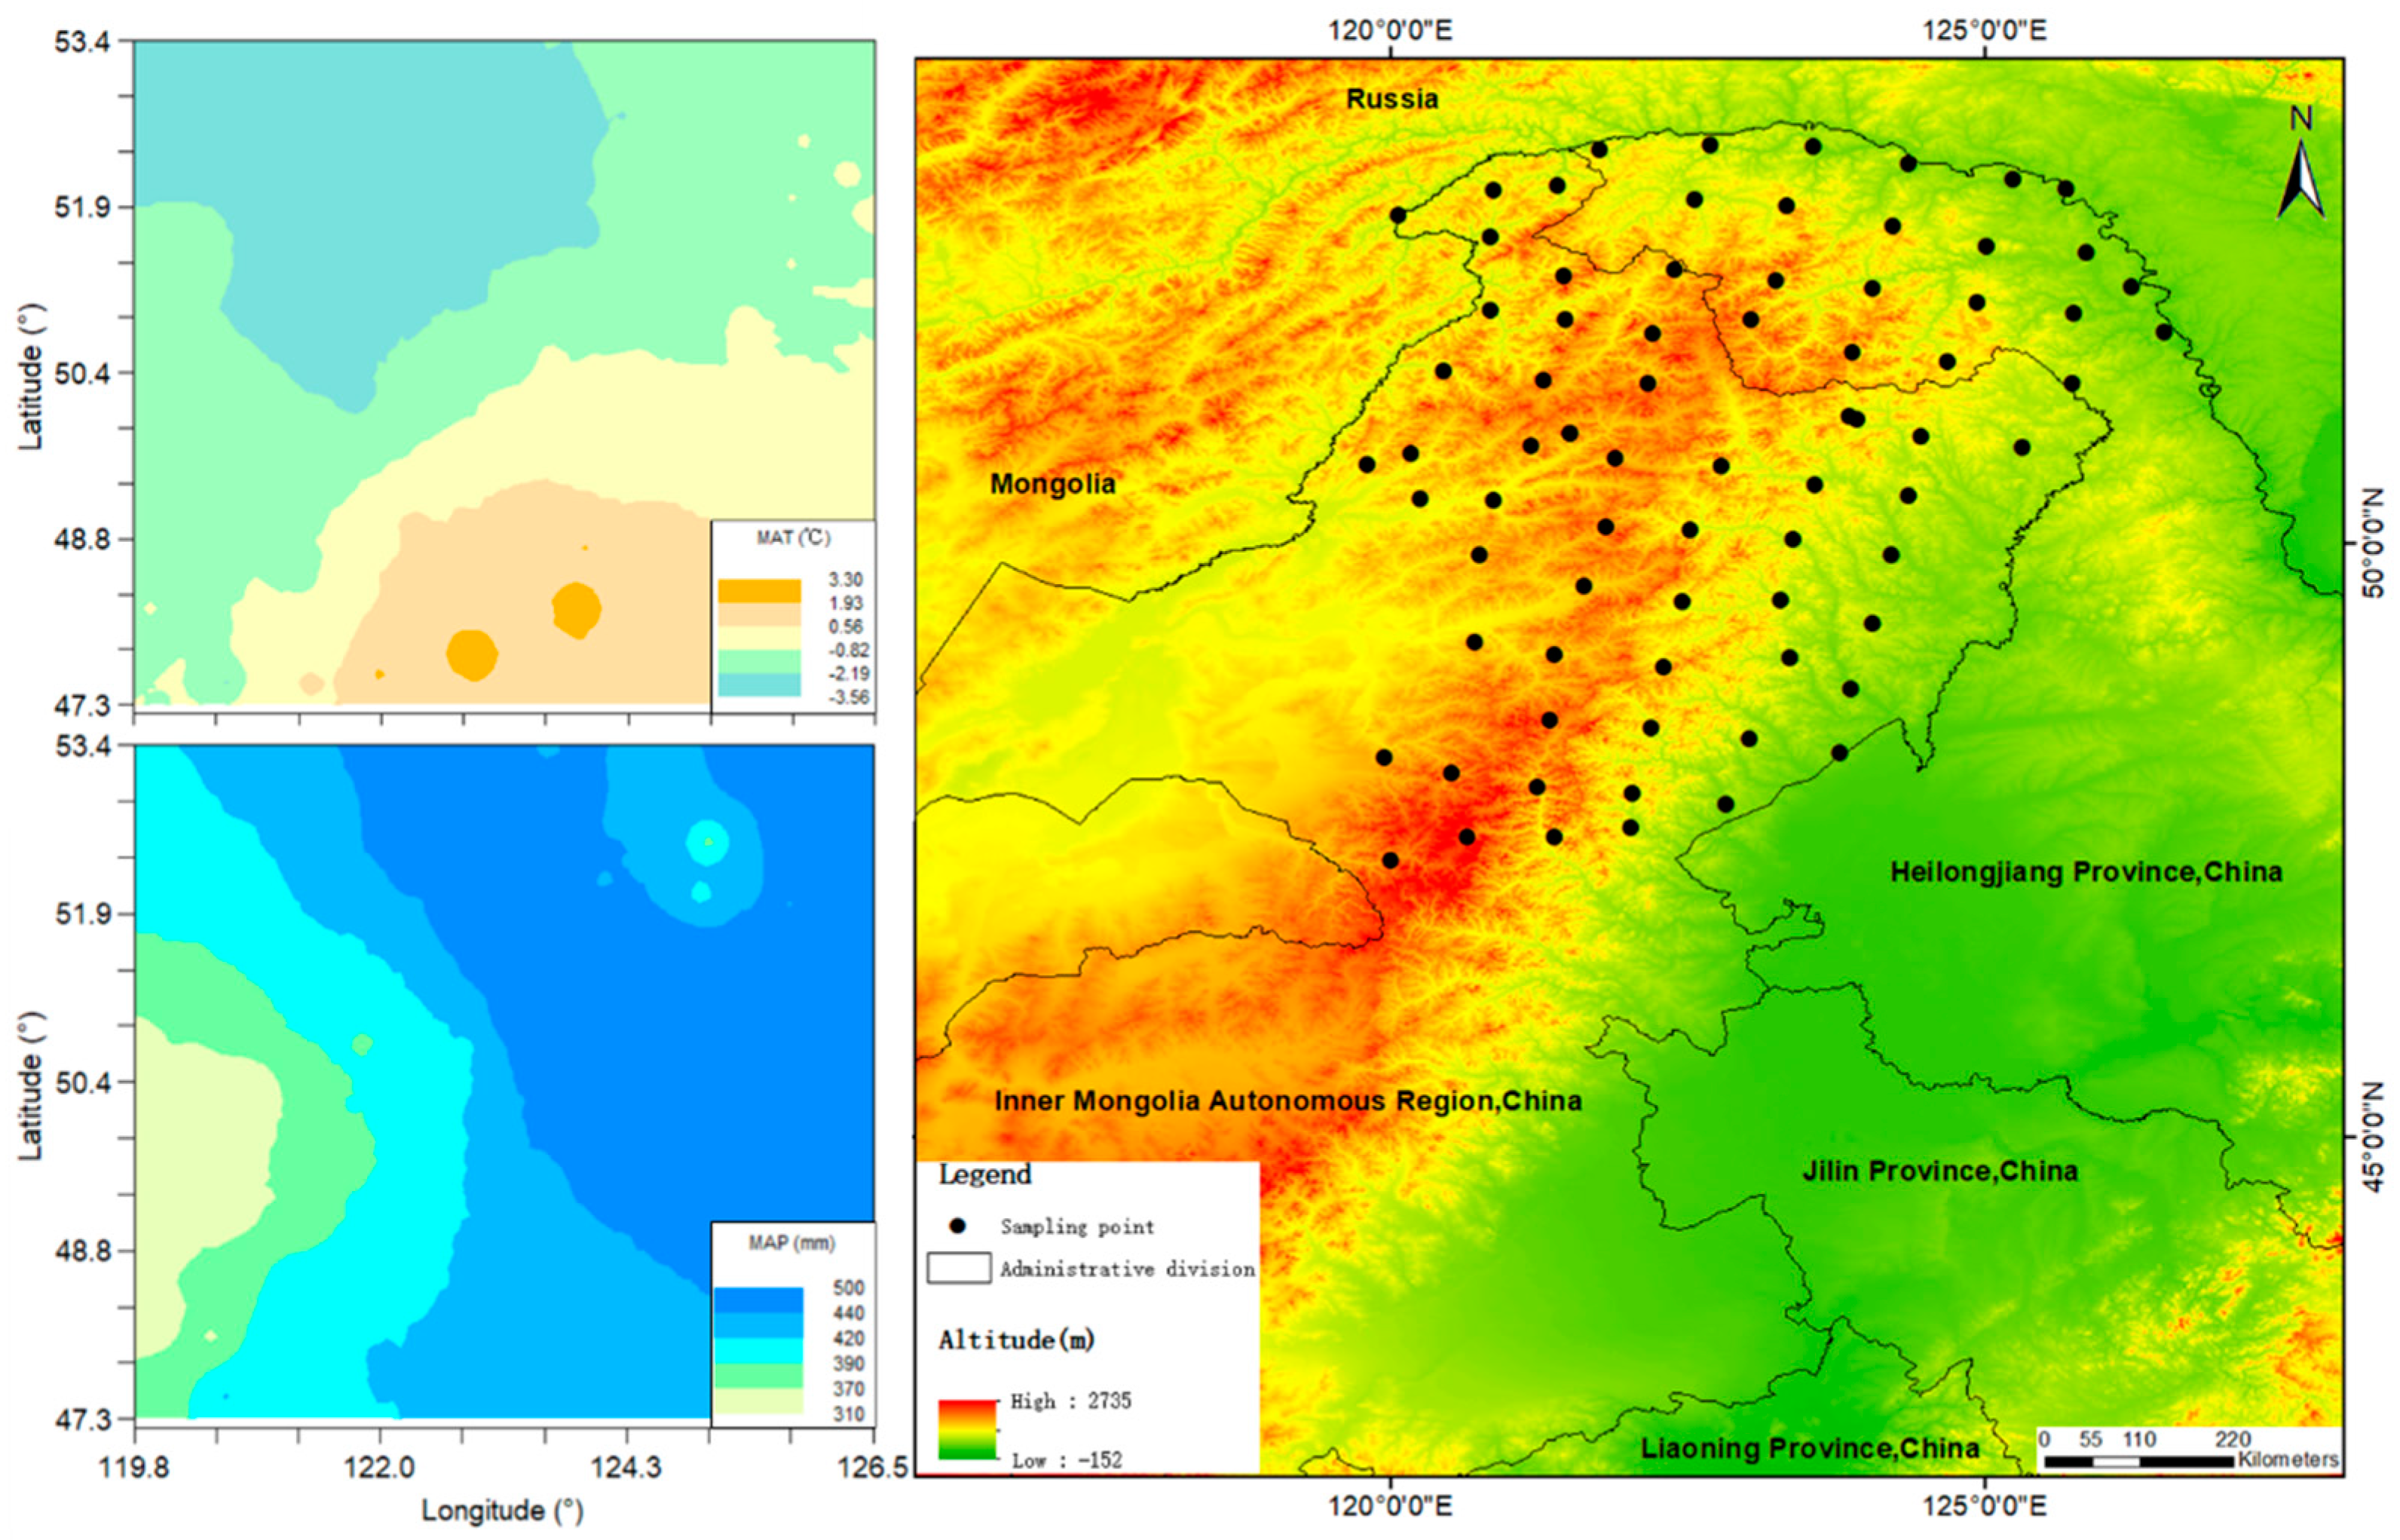
2.1. Study Area

The research was carried out in the Greater Khingan Mountains forest region in northeast China (43° N~53°30′ N, 117°20′ E~126° E). It spans 1400 km in length, 200 km in width, and 1100–1400 m in altitude. The Greater Khingan Mountains are higher in the west and lower in the east, with a northeast-southwest facing. They are characterized by steep and shallow mountain terrain. The weather is cold in the winter and warm in the summer, with significant temperature variation between day and night. The annual average temperature is −2.8 °C, the frost-free period is 90–110 d, and the annual precipitation is 500 mm. This mountain region has a continental monsoon climate of the cold temperate zone. Larix gmelinii, Populus davidiana, Betula platyphylla, Quercus mongolica, Pinus sylvestris, and other tree species are common. Brown coniferous forest, dark brown, gray-black, swamp, and meadow soils are the most typical soil types.

2.2. Site Setting and Soil Sampling

In July 2017, 75 sample sites were set in the Greater Khingan Mountains (Figure 1). Three soil samples (0–20 cm) were obtained from each site after the surface litter was removed for lab examination.

2.3. Laboratory Analysis

The soil samples were brought to the lab, where they were cleansed of plant residues and pebbles before being naturally dried to measure soil indices. Available phosphorus (AP), rapidly available potassium (AK), and ammonium nitrogen (NH4+-N) were measured using a universal extract-colorimetric method (NY/T 1849–2010). Total phosphorus (TP) was measured using perchloric acid digestion-Mo-Sb anti spectrophotometric method [33], and pH was measured using a pH meter with a soil/water mass ratio of 1:5 (w/v).
According to Six et al. [34] and Elliott [35], undisturbed soil samples were gently passed through a 2 mm sieve, air-dried, and a 100 g subsample was separated using a wet-sieving method. Each soil sample was isolated into three fractions: 0.25–2 mm, 0.053–0.25 mm, and <0.053 mm SA. To obtain proportions relative to bulk soil, all three fractions were oven-dried at 60 °C and weighed. A TOC elemental analyzer was used to determine the content of OC in SAF (SHIMADZU TOC-V CPH, Kyoto, Japan).

2.4. Data Calculation and Statistical Analysis

The temperature and precipitation data of each sample sites were collected from the ClimateAP model’s website (http://climateap.net/, accessed on 15 January 2020). The mean annual air temperature (MAT) and mean annual precipitation (MAP) were the mean values from 2001 to 2010.
To quantify the stability of SA, the geometric mean diameter (GMD), mean weight diameter (MWD), and fractal dimension (D) were chosen [36,37] and calculated by the following formulas:
GMD = e x p ( i = 1 n W i ln X i ¯ ) ,
MWD = i = 1 n W i X i ¯ ,
W ( r < x i ¯ ) W 0 = X i ¯ X m a x 3 D ,
where X i ¯ represents the mean diameter (mm) of the ith SA (it is 1.125, 0.1515, and 0.0265 mm, respectively, here), Wi represents the weight (%) of the ith SA, W ( r < x i ¯ ) represents the SA weight (g) smaller than the ith SA, Xmax represents the average diameter of the maximum particle size (mm), and W0 represents the total weight (g) of the soil sample.
The spatial features of SAF and associated OC in the Greater Khingan Mountains were investigated using the Kriging method, which was on the basis of semivariogram fitting parameters and theoretical models. The semivariogram is a technique for identifying the spatial autocorrelation of samples and is often called a spatial variogram. The distance between each point helps determine the semivariance value between them (Formula (4)). The semivariance graphic can be constructed using the sample interval h (X-axis) and the semivariogram γ (h) (Y-axis).
γ ( h ) = 1 / 2 N ( h ) × i = 1 N ( h ) [ Z ( x i ) Z ( x i + h ) ] 2 ,
where Z (xi + h) and Z (xi) represent observed Z (x) at the positions of xi + H and xi, respectively; N (h) represents sample size with interval h. Range, sill, and nugget are key parameters in the semivariogram, which are represented by A, C0 + C, and C0, respectively, and can determine the spatial variations and spatial correlations of regionalized variables [38].
The significance of variations in SAF and associated OC levels was tested using ANOVA. The redundancy analysis (RDA) and Pearson correlation analysis were employed to investigate the correlations between SA and other indicators. Figures were drawn in GS+ 9.0 (Plainwell, MI, USA), Canoco 4.5 (Biometris-Plant Research International, Wageningen, The Netherlands), and Origin Pro2019 (Originlab Corp., Northampton, MA, USA).

3. Results

3.1. Descriptive Statistics of SAF and Aggregate SOC

The 0.25–2 mm SAF accounted for the highest proportion of 46.14% in soils from the Greater Khingan Mountains, followed by the <0.053 mm (27.72%) and the 0.053–0.25 mm SAF (26.14%) (Figure 2). The variance coefficient of all SAF ranged from 27.20% to 37.70%. In the studied area, the average GMD, MWD, and D were 0.25 mm, 0.57 mm and 2.65, respectively (Figure 3). For aggregate SOC contents, the 0.25–2 mm SAF was the main component in soils from the Greater Khingan Mountains (19.84 g kg−1, 50.39%), while the 0.053–0.25 mm SAF was the lowest (7.29 g kg−1, 18.33%) (Figure 4).
Figure 5 shows the relationships between SAF and their stability. There were significant negative correlations between the SAF of 0.25–2 mm and the other SAF (p < 0.01). MWD and GMD were significantly positively correlated with the SAF of 0.25–2 mm (p < 0.01), while negatively correlated with the SAF of <0.053 mm (p < 0.01). MWD, GMD, and D presented a significant (p < 0.05) negative correlation with the SAF of 0.053–0.25 mm, while D was significantly positively correlated with the SAF of <0.053 mm (p < 0.01). MWD showed a significant positive and negative correlation with GMD (p < 0.01) and D (p < 0.01), respectively.

3.2. Spatial Variations in SAF and Aggregate SOC

In geostatistics, the sample data must fit into a normal distribution. All SAF presented a normal distribution by the K-S test, while the aggregate SOC of 0.25–2 mm and 0.053–0.25 mm had to undergo square root and logarithmic transformations to meet the requirements of normal distribution.
Several models were employed to fit the spatial variability of SAF and aggregate SOC (Table 1 and Figure 6). The results showed that the exponential model was the best model for the SAF of 0.25–2 mm and <0.053 mm, whereas the spherical model was the best for 0.053–0.25 mm SA. The Gaussian model was suited for aggregate SOC of 0.25–2 mm and 0.053–0.25 mm, whereas the exponential model was the best for aggregate SOC of <0.053 mm. The nugget sill ratio was 41.0–50.0% in all SAF, indicating moderate spatial dependency [38], whereas all aggregate SOC showed a strong spatial dependency, with the nugget sill ratio ranging from 0.04% to 3.95%.
In the Greater Khingan Mountains, the <0.053 mm and 0.25–2 mm SAFs presented increasing trends from south to north, whereas the 0.053–0.25 mm SAF decreased, with a zonality trend for <0.25 mm SAF that was more apparent. There were no significant spatial patterns of aggregate SOC observed for all fractions, which were distributed in patches (Figure 7).

3.3. Influencing Factor Analysis of SAF and Aggregate SOC

RDA analysis was employed to investigate the effects of environmental factors on SAF and associated OC. As shown in Figure 8, there was no significant relationship between MAT and SA features (MWD and GMD). The SAF of 0.25–2 mm was negatively correlated with soil pH (p < 0.01) and positively correlated with SOC (p < 0.05); the fraction of 0.053–0.25 mm in the soil was only negatively correlated with MAP (p < 0.01); the fraction of <0.053 mm in the soil were positively correlated with pH and MAP (p < 0.01), but negatively correlated with SOC (p < 0.01). SOC presented a significantly negative correlation with D (p < 0.01), as well as a positive correlation with GMD (p < 0.01) and MWD (p < 0.05). Each stability index had a different relationship with others. pH had a negative influence on GMD and MWD (p < 0.01), while MAP had a significant benefit for D (p < 0.01).
All fractions of aggregate SOC presented positive correlations with SOC (p < 0.01), and the relevance degree dropped as particle size decreased, in which the closest relationship was found between the SAF of 0.25–2 mm and SOC (r = 0.93). Aggregate SOC showed a significant positive correlation with TP (p < 0.05); the aggregate SOC of the <0.053 mm and 0.25–2 mm fractions presented significant positive correlations with NH4+-N (p < 0.01); a significant positive correlation was observed between the aggregate SOC of >0.053 mm fraction and AK (p < 0.01). The aggregate SOC of the 0.053–0.25 mm fraction was significantly negatively correlated with MAP (p < 0.05).

4. Discussion

4.1. Statistical Characteristics of SAF and Associated OC

The SAF contents ranked as (0.25–2 mm) > (<0.053 mm) > (0.053–0.25 mm) across the Greater Khingan Mountains, similarly as reported in previous works [39,40]. Soil quality and structure were directly associated with the SA composition [41]. The SAF of >0.25 mm was the predominant component of SA structure, whose higher content suggested a more stable soil structure [42], while the contents and patterns of soil microaggregates (<0.25 mm) may present more important effects on soil physical qualities because they are responsible for a considerable portion of SA. It is reported that fungal hyphae and roots are the predominant cementing agents in macroaggregates, whereas humic substances are the key cementing agent for microaggregates [43]. Thus, the plant roots were closely related to the dominance of macroaggregates in forest soil since plant roots are conducive to the formation and stability of SA by releasing secretions to package and link soil particles [44].
The stability of SA is an essential parameter of soil structure, linking to soil environmental quality and erosion resistance [45]. The contribution of SA to the physical protection of OC is also important and may be assessed by GMD, MWD, and D. The larger values of GMD and MWD and the smaller values of D mean the greater the SA aggregation, the lower the SA dispersibility and erodibility, suggesting a more stable soil structure. The soils in the study region are unstable according to Bissonnais’s classification standards [46], which indicated that SA can generally break down into fine particles and microaggregates [27] during rainfall and runoff processes.
The fraction of macroaggregates played a key role in soil fertility, as the material condition in the Greater Khingan Mountains due to OC was mainly concentrated in the SAF of 0.25–2 mm (50.39%). This is in line with the results of Zhao et al. [39], Mikha and Rice [47], and Wang et al. [48], suggesting the importance of macroaggregates in storing OC. Woodland may encourage the development of macroaggregates from microaggregates, as well as silt and clay particles, while also causing more SOC to accumulate in large SA. Accordingly, the large SA (macroaggregates) become the predominant C storage component. However, following the intra-aggregate particulate organic matter decomposition in large SA, large SA convert to microaggregates [8,21]. As a result, the C content in microaggregates is lower than that in macroaggregates.

4.2. Spatial Variability of SAF and Associated OC

The results demonstrated that the content of SA in the Greater Khingan Mountains presented a normal distribution statistically with some spatial differences. The moderate spatial autocorrelations presented on the SAF contents indicated the joint influences of random (i.e., human activities) and structural elements (i.e., soil, vegetation and climate), in which the particle size increased with the influence of random factors. The northern part of the Greater Khingan Mountains is the largest virgin forest without human intervention. Hence, the soil was left in its natural form with a thick litter layer due to the vigorous vegetative growth, which significantly reduced the erosion of surface soil by rainfall, including the SAF of >0.25 mm. Comparatively more human activities were observed in the southern part of the Greater Khingan Mountains. The frequent human disturbances should induce the disintegration of macroaggregates with low stability, increasing the proportion of silt-clay fractions and microaggregates in bulk soils. The structural factors presented a significant effect according to the spatial autocorrelation of aggregate SOC contents.

4.3. Relations of SAF, Associated OC, and Environmental Factors

Certain associations were found between the characteristic values of SA. The SAF of >0.25 mm was found to be substantially correlated with GMD and MWD. The associations of stability indicators with the SAF contents of <0.25 mm were opposite for macroaggregates, indicating that the increasing contents of large SA could improve the stability of SA. The contents of SA associated OC presented significant positive correlations with each other (p < 0.01). Six et al. [34] proposed that macroaggregates can combine a high quantity of OC and encourage the development of microaggregates through the interaction of SOM and the soil environmental factors, resulting in the retention of OC in microaggregates for a long time.
Soil texture, metal cations and oxides, and SOC are the key impacting factors of SA [49]. Soil biological factors such as roots, bacteria, animals and their metabolites also have a substantial impact on the development and evolution of SA with diverse particle sizes [50]. SA can help to stabilize and protect SOC in its natural habitat. SA and SOC are inextricably linked because the cementation ingredient for SA is part of SOC. Accordingly, SOC presented significant negative and positive correlations with the SAF of < 0.053 mm and 0.25–2 mm, respectively. It was found that SOM helped to bond fine SA to form the larger one, indicating higher SOC in large SA than that in small SA. SOC was found to be substantially positively correlated with GMD and MWD, as well as significantly negatively correlated with D. Additionally, the higher the SOC content, the larger the MWD and GMD of SA, the smaller the D, and the better the soil structure and stability. Our results indicated that SOC improved the stability of SA, which was consistent with the results of Wang et al. [48] and Zhao et al. [39] in various forests. In the Greater Khingan Mountains, SOM, as the predominant cementing material, can improve the binding force between SA and regulate the SA development. Fine SA becomes larger SA by SOM cementation during the decomposition and transformation of litter into OC. The values of MWD increase when large SA accumulates, indicating the soil structure eventually becomes more stable [17]. As a result, the forest ecological functions can be improved by elevating the content of SOC and improving the stability of SA during the forest management process. pH was significantly negatively correlated with the SAF of 0.25–2 mm, GMD, and MWD, which indicated that acid soil was more favorable to large SA development and soil structure stability [39].
SA is perceived as an indicator of soil stability and erodibility [51,52,53,54]. Generally, water acts as a binding agent in the development of SA [55] and can promote soil microbial biomass [56]. Under the impact of cumulative rainfall, the explosion of dry aggregates after moistening and mechanical disturbance, among other factors, causes aggregates to lose stability and break into lighter and smaller fractions [57,58]. Affected by the direction of the Great Khingan mountains, the precipitation in the study area shows a stepwise decreasing trend from east to west (Figure 1). Thus, the substantial positive correlation between precipitation and the <0.053 mm SAF (p < 0.01) observed in this work suggested that water was helpful for the development of clay aggregates, i.e., increasing rainfall-induced aggregate disruption [59,60,61]. The significant impact of precipitation on soil microaggregates was also found in other investigations [62,63]. Further, the destruction of soil aggregates releases the cementing OC that was previously encapsulated within the aggregates [51,64], coupling with the release of the accumulated nutrients (N, P, K) in SA. As a result, the microbial decomposition of new organic debris can also be enhanced by precipitation, resulting in the synthesis of polysaccharides that aid microaggregate formation [63], which provides conditions for the formation of larger SA.
Soil humus is important for the preservation of SOM as well as the principal cementing agent of SA. It has a significant impact on soil fertility and structural features, particularly in terms of improving SA stability [65]. SOC is a crucial component in the production and stability of SA, as well as one of the most important methods for fixing OC that occurs during the cementation and agglomeration of SAF [66]. Thus, the close relationship between aggregate SOC and SOC indicates that SOC is significantly dependent on the distribution of OC in different SAF. Microaggregates, according to Stewart et al. [67], presented a significant linear correlation with SOC. The TP, NH4+-N, AK, and other nutrient indexes all showed beneficial effects on aggregate SOC, suggesting the positive effect of soil nutrients on aggregate SOC to some extent [22]. The influence of soil nutrients on soil macroaggregate formation and soil structure stability is mainly associated with the accumulation of SOC. The increases in nitrogen, phosphorus, and potassium in soils can promote plant growth, thereby increasing litter return, root exudates, and microbial activity, which is conducive to the accumulation of polysaccharides, an important component of SOM [68,69].

5. Conclusions

The spatial patterns of SAF and associated OC contents were investigated in 0–20 cm soils collected from 75 sites across the Greater Khingan Mountains forest region. The SA were dominated by macroaggregates of 0.25–2 mm (46.14%). All SAF presented a moderate spatial autocorrelation and were influenced by random (i.e., human activities) and structural factors (i.e., soil, vegetation, and climate). With the rise in particle size, the influence of random factors was enhanced. From north to south, the SAF contents of <0.053 mm and 0.25–2 mm declined gradually, while the SAF content of 0.053–0.25 mm increased. SOC was mainly accumulated in the SAF of 0.25–2 mm, accounting for 50.39% of the total content of aggregate SOC, in which the SAF of 0.25–2 mm showed a strong spatial autocorrelation, indicating it is primarily influenced by structural factors.
SA stability was influenced by climate conditions and soil physicochemical characteristics. The development of <0.053 mm microaggregates was associated with precipitation, while SOC was significantly positively correlated with 0.25–2 mm SA, GMD, and MWD. SA stability was closely associated with SOM due to its cementation of small SA into large SA. The substantial positive association between SOC and aggregate SOC lessened as particle size decreased. OC associated with the SAF of 0.25–2 mm and 0.053–0.25 mm was positively correlated with NH4+-N, AK and TP, indicating that the formation of aggregates was conducive to the preservation of soil nutrients.

Author Contributions

Conceptualization, Methodology, B.W. and Q.Z.; sample-plot survey, B.W., M.M. and Q.Z.; data analysis, B.W., Z.G. and M.M.; manuscript writing and editing, B.W., Q.Z., Z.G. and M.M.; funding acquisition, B.W. and Q.Z. All authors have read and agreed to the published version of the manuscript.

Funding

The work was supported by the Science and Technology Plan Project of Inner Mongolia, China (Forest Ecosystem National Observation and Research Station of Greater Khingan Mountains in Inner Mongolia), the National Natural Science Foundation of China (grant number 32060262), and the Natural Science Foundation of Inner Mongolia, China (grant number 2018MS03049).

Institutional Review Board Statement

Not applicable.

Informed Consent Statement

Not applicable.

Data Availability Statement

Not applicable.

Conflicts of Interest

The authors declare no conflict of interest.

References

  1. Liu, Y.; Piao, S.; Gasser, T.; Ciais, P.; Yang, H.; Wang, H.; Keenan, T.F.; Huang, M.; Wan, S.; Song, J.; et al. Field-experiment constraints on the enhancement of the terrestrial carbon sink by CO2 fertilization. Nat. Geosci. 2019, 12, 809–814. [Google Scholar] [CrossRef] [Green Version]
  2. Patoine, G.; Eisenhauer, N.; Cesarz, S.; Phillips, H.R.P.; Xu, X.; Zhang, L.; Guerra, C.A. Drivers and trends of global soil microbial carbon over two decades. Nat. Commun. 2022, 13, 4195. [Google Scholar] [CrossRef] [PubMed]
  3. Georgiou, K.; Jackson, R.B.; Vindušková, O.; Abramoff, R.Z.; Ahlström, A.; Feng, W.; Harden, J.W.; Pellegrini, A.F.A.; Polley, H.W.; Soong, J.L.; et al. Global stocks and capacity of mineral-associated soil organic carbon. Nat. Commun. 2022, 13, 3797. [Google Scholar] [CrossRef] [PubMed]
  4. Schlesinger, W. Evidence from chronosequence studies for a low carbon-storage potential of soils. Nature 1990, 348, 232–234. [Google Scholar] [CrossRef]
  5. Terrer, C.; Phillips, R.P.; Hungate, B.A.; Rosende, J.; Pett-Ridge, J.; Craig, M.E.; van Groenigen, K.J.; Keenan, T.F.; Sulman, B.N.; Stocker, B.D.; et al. A trade-off between plant and soil carbon storage under elevated CO2. Nature 2021, 591, 599–603. [Google Scholar] [CrossRef]
  6. Zhang, P.; Wang, Y.; Xu, L.; Sun, H.; Li, R.; Zhou, J. Factors controlling the spatial variability of soil aggregates and associated organic carbon across a semi-humid watershed. Sci. Total Environ. 2022, 809, 151155. [Google Scholar] [CrossRef]
  7. Yu, H.; Gong, R.; Zhou, Y.; Cha, T.; Nie, L.; Lv, Z. Characteristic of soil aggregate stability and soil organic carbon under four typical artificial plantations in Beijing Badaling Mountain area. J. Soil Water Conserv. 2015, 29, 162–166. [Google Scholar]
  8. Six, J.; Bossuyt, H.; Degryze, S.; Denef, K. A history of research on the link between (micro)aggregates, soil biota, and soil organic matter dynamics. Soil Till. Res. 2004, 79, 7–31. [Google Scholar] [CrossRef]
  9. Kleber, M.; Eusterhues, K.; Keiluweit, M.; Mikutta, C.; Mikutta, R.; Nico, P.S. Mineral–Organic Associations: Formation, Properties, and Relevance in Soil Environments. Adv. Agron. 2015, 130, 1–140. [Google Scholar]
  10. Liu, Z.; Yu, W.; Zhou, H.; Xu, Y. Effects of long-term fertilization on aggregate size distribution and nutrient content. Soils 2011, 43, 720–728. [Google Scholar]
  11. Guhra, T.; Stolze, K.; Kai, U.T. Pathways of biogenically excreted organic matter into soil aggregates. Soil Biol. Biochem. 2021, 164, 108483. [Google Scholar] [CrossRef]
  12. Wang, Y.; Liu, J.; Wang, Q. The Effects of freeze-thaw processes on soil aggregates and organic carbon. Ecol. Environ. Sci. 2013, 22, 1269–1274. [Google Scholar]
  13. Christensen, B.T. Physical fractionation of soil and organic matter in primary particle size and density separates. Adv. Soil 1992, 20, 2–90. [Google Scholar]
  14. Liu, Y.; Cha, T.; Wang, Y.; Wang, G. Soil aggregate stability and soil organic carbon characteristics in Quercus variabilis and Pinus tabulaeformis plantations in Beijing area. Clin. J. Appl. Ecol. 2013, 24, 607–613. [Google Scholar]
  15. Zheng, X.; Zhang, X.; Han, S. Changes of soil aggregate size composition and organic carbon content at different succession stages of broadleaved Korean pine forest in Changbai Mountain, China. Clin. J. Appl. Ecol. 2019, 30, 134–143. [Google Scholar]
  16. Dong, L. Characteristics of soil water stable aggregates under different land-use types. Sci. Silvae Sin. 2011, 47, 95–100. [Google Scholar]
  17. Zheng, Z.; He, S.; Wang, Y.; Li, T.; Zhang, X.; Xu, Y. Distribution feature of soil nutrients in aggregate under different land use. J. Soil Water Conserv. 2010, 24, 170–174. [Google Scholar]
  18. Mao, Y.; Yang, Y.; Xing, S.; Chen, G.; Cui, J. Effects of land use on soil organic carbon in water-stable aggregates. J. Soil Water Conserv. 2008, 22, 132–137. [Google Scholar]
  19. Wang, H.; Li, X.; Shi, X.; Yu, D. Distribution of soil nutrient under different land use and relationship between soil nutrient and soil granule composition. J. Soil Water Conserv. 2003, 17, 44–46. [Google Scholar]
  20. Sun, Y.; Tian, Y.; Zhang, J. Soil aggregates stability and organic carbon distribution of four plantations in sandy land of Henan southeastern area. For. Inv. Plan 2019, 44, 42–48. [Google Scholar]
  21. Jastrow, J.D. Soil aggregate formation and the accrual of particulate and mineral-associated organic matter. Soil Biol. Biochem. 1996, 28, 665–676. [Google Scholar] [CrossRef]
  22. Adnan, M.; Xu, M.; Atizaz, S.; Muhammad, M.A.; Sun, N.; Wang, B.; Cai, Z.; Qudsia, S.; Muhammad, N.; Khalid, M.; et al. Soil aggregation and soil aggregate stability regulate organic carbon and nitrogen storage in a red soil of southern China. J. Environ. Manag. 2020, 270, 110894. [Google Scholar]
  23. Han, S.; Delgado-Baquerizo, M.; Luo, X.; Liu, Y.; Van Nostrand, J.D.; Chen, W.; Zhou, J.; Huang, Q. Soil aggregate size-dependent relationships between microbial functional diversity and multifunctionality. Soil Biol. Biochem. 2021, 154, 108143. [Google Scholar] [CrossRef]
  24. Cornforth, I. The effect of the size of soil aggregates on nutrient supply. J. Agric. Sci. 1968, 70, 83–85. [Google Scholar] [CrossRef]
  25. Liao, H.; Zhang, Y.; Zuo, Q.; Du, B.; Chen, W.; Wei, D.; Huang, Q. Contrasting responses of bacterial and fungal communities to aggregate-size fractions and long-term fertilizations in soils of northeastern China. Sci. Total Environ. 2018, 635, 784–792. [Google Scholar] [CrossRef]
  26. Han, S.; Luo, X.; Tan, S.; Wang, J.; Chen, W.; Huang, Q. Soil aggregates impact nitrifying microorganisms in a vertisol under diverse fertilization regimes. Eur. J. Soil Sci. 2020, 71, 536–547. [Google Scholar] [CrossRef]
  27. Zhang, P.; Wang, Y.; Xu, L.; Li, R.; Sun, H.; Zhou, J. Factors controlling spatial variation in soil aggregate stability in a semi-humid watershed. Soil Till. Res. 2021, 214, 105187. [Google Scholar] [CrossRef]
  28. Ye, L.; Tan, W.; Fang, L.; Zhao, W. Research advances in spatial variability of soil aggregate by using geostatistics. Sci. Soil Water Conserv. 2019, 17, 146–153. [Google Scholar]
  29. Zhu, J.; Man, X.; Wang, F. Composition and stability of soil aggregates in four forest vegetation types in cold temperate zone. Chin. J. Soil Sci. 2020, 51, 606–613. [Google Scholar]
  30. Ding, J.; Yu, S.; Shi, C.; Wang, H. Effects of land use types on soil physicochemical properties and aggregates stability in cold region wetland. Chin. J. Ecol. 2021, 40, 3543–3551. [Google Scholar]
  31. Li, H.; Xin, Y.; Zhao, Y. Characteristics of microbial biomass carbon in soil aggregates of burned area under different restorations. J. Soil Water Conserv. 2016, 30, 342–347. [Google Scholar]
  32. Ren, Q.; Xin, Y.; Zhao, Y. Impact of severe burning on organic carbon and black carbon in soil aggregates in natural Larix gmelinii forest of Great Xing‘an Mountains. J. Beijing Univ. 2016, 38, 29–36. [Google Scholar]
  33. Kuo, S. Phosphorus. In Methods of Soil Analysis. Part 3 Chemical Methods; Sparks, D.L., Page, A.L., Helmke, P.A., Loeppert, R.H., Eds.; Soil Science Society of America, Inc.: Madison, WI, USA, 1996; pp. 869–920. [Google Scholar]
  34. Six, J.; Elliott, E.T.; Paustian, K. Soil macroaggregate turnover and microaggregate formation: A mechanism for C sequestration under no-tillage agriculture. Soil Biol. Biochem. 2000, 32, 2099–2103. [Google Scholar] [CrossRef]
  35. Elliott, E.T. Aggregate Structure and Carbon, Nitrogen, and Phosphorus in Native and Cultivated Soils. Soil Sci. Soc. Am. J. 1986, 50, 627–633. [Google Scholar] [CrossRef]
  36. Xu, H.; Wu, Y.; Qiao, L.; Li, Y.; Xue, S.; Qu, S. Soil aggregate and stability in the ecological restoration process under different vegetation zones and Loess Plateau. China Environ. Sci 2018, 38, 2223–2232. [Google Scholar]
  37. Wang, F.H.; Lü, S.; Huang, R.; Gao, M.; Wang, Z.F.; Xu, C. Distribution of organic carbon in soil aggregates from four kinds of forest vegetation on Jinyun Mountain. Environ. Sci. 2019, 40, 1504–1511. [Google Scholar]
  38. Wang, B.; An, H.; Lv, C. Spatial variations of dissolved oxygen in Hulun Lake using geostatistics and GIS technology. Arid. Land Geogr. 2013, 36, 1103–1110. [Google Scholar]
  39. Zhao, Y.; Meng, M.; Zhang, J.; Ma, J.; Liu, S. Study on the composition and stability of soil aggregates of the main forest stands in Fengyang Mountain, Zhejiang Province. J. For. Nanjing Univ. 2018, 42, 88–94. [Google Scholar]
  40. Cheng, M.; Zhu, Q.; Liu, L.; An, S. Effects of vegetation on soil aggregate stability and organic carbon sequestration in Ningxia Loess Hilly Region of northwest China. Acta Ecol. Sin. 2013, 33, 2835–2844. [Google Scholar] [CrossRef] [Green Version]
  41. Barthes, B.; Roose, E. Aggregate stability as an indicator of soil susceptibility to runoff and erosion; validation at several levels. Catena 2002, 47, 133–149. [Google Scholar] [CrossRef] [Green Version]
  42. Ren, Z.; Luo, Y.; Wei, C. Progress in the study on field soil aggregate. J. Anhui Agric. Sci. 2011, 39, 1101–1105. [Google Scholar]
  43. Tisdall, J.M.; Oades, J.M. Organic matter and water-stable aggregates in soils. Eur. J. Soil Sci. 1982, 33, 141–163. [Google Scholar] [CrossRef]
  44. Yuan, Y.; Li, N.; Zou, W.; You, M.; Han, X.; Ma, D. Distribution characteristics of organic carbon in aggregates of soils of three ecosystems in typical Mollisols of Northeast China. Acta Ecol. Sin. 2018, 38, 6025–6032. [Google Scholar]
  45. Liu, W.; Wu, J.; Fu, M.; Liang, Y.; Zhao, X. Effect of different cultivation years on composition and stability of soil aggregate fractions in orchard. J. Soil Water Conserv. 2014, 28, 129–135. [Google Scholar]
  46. Bissonnais, Y.L. Aggregate stability and assessment of soil crustability and erodibility: I. Theory and methodology. Eur. J. Soil Sci. 1996, 47, 425–437. [Google Scholar] [CrossRef]
  47. Mikha, M.M.; Rice, C.W. Tillage and manure effects on soil and aggregate-associated carbon and nitrogen. Soil Sci. Soc. Am. J. 2004, 68, 809–816. [Google Scholar] [CrossRef]
  48. Wang, X.; Zhou, C.; Feng, W.; Chen, J.; Jiang, X. Changes of soil aggregates and its organic carbon in Chinese Fir plantations with different forest ages. J. Soil Water Conserv. 2019, 33, 126–131. [Google Scholar]
  49. Li, J.; Zhong, X.; Zhao, Q. Influence factors of soil aggregate stability under disturbing of cultivation and fertilization. Ecol. Env. Sci. 2009, 18, 2354–2359. [Google Scholar]
  50. Yuan, Y.; Han, X.; Li, L.; Ding, X. Effects of soluble root exudates on microbial activity and aggregate stability of black soils. J. Soil Water Conserv. 2011, 25, 96–99. [Google Scholar]
  51. Jiang, Y.; Zheng, F.; Wen, L.; Shen, H. Effects of sheet and rill erosion on soil aggregates and organic carbon losses for a Mollisol hillslope under rainfall simulation. J. Soils Sediments 2019, 19, 467–477. [Google Scholar] [CrossRef]
  52. Six, J.; Paustian, K.; Elliott, E.T.; Combrink, C. Soil structure and organic matter: I. Distribution of aggregate-size classes and aggregate-associated carbon. Soil Sci. Soc. Am. J. 2000, 64, 681–689. [Google Scholar] [CrossRef]
  53. Morgan, R.P.C. Soil Erosion and Conservation, 3rd ed.; Blackwell Publishing: Oxford, UK, 2005; p. 304. [Google Scholar]
  54. Zhang, J.; Quine, T.A.; Ni, S.; Ge, F. Stocks and dynamics of SOC in relation to soil redistribution by water and tillage erosion. Glob. Change Biol. 2006, 12, 1834–1841. [Google Scholar] [CrossRef]
  55. Sarah, P. Soil aggregation response to long- and short-term differences in rainfall amount under arid and Mediterranean climate conditions. Geomorphology 2005, 70, 1–11. [Google Scholar] [CrossRef]
  56. Bougma, A.B.; Ouattara, K.; Compaore, H.; Nacro, H.B.; Melenya, C.; Mesele, S.A.; Logah, V.; Azeez, J.O.; Veenendaal, E.; Lloyd, J. Soil aggregate stability of forest islands and adjacent ecosystems in West Africa. J. Agr. Stud. 2021, 9, 283. [Google Scholar] [CrossRef]
  57. Le Bissonnais, Y.; Arrouays, D. Aggregate stability and assessment of soil crustability and erodibility: II. Application to humic loamy soils with various organic carbon contents. Eur. J. Soil Sci. 1997, 48, 39–48. [Google Scholar] [CrossRef]
  58. Lal, R. Soil erosion and the global carbon budget. Environ. Int. 2003, 29, 437–450. [Google Scholar] [CrossRef]
  59. Zheng, J.; Zhao, J.; Shi, Z.; Wang, L. Soil aggregates are key factors that regulate erosion-related carbon loss in citrus orchards of southern China: Bare land vs. grass-covered land. Agric. Ecosyst. Environ. 2021, 309, 107254. [Google Scholar] [CrossRef]
  60. Shi, P.; Arter, C.; Liu, X.; Keller, M.; Schulin, R. Soil aggregate stability and size-selective sediment transport with surface runoff as affected by organic residue amendment. Sci. Total Environ. 2017, 607–608, 95–102. [Google Scholar] [CrossRef]
  61. Obalum, S.E.; Uteau-Puschmann, D.; Peth, S. Reduced tillage and compost effects on soil aggregate stability of a silt-loam Luvisol using different aggregate stability tests. Soil Till. Res. 2019, 189, 217–228. [Google Scholar] [CrossRef]
  62. Chote, J.L. Importance of microorganisms in soil aggregation. In Soil Biology; Buscot, F., Varma, A., Eds.; Springer: Berlin/Heidelberg, Germany, 2005; Volume 3, pp. 107–119. [Google Scholar]
  63. Anokye, J.; Logah, V.; Opuku, A. Soil carbon stock and emission: Estimates from three land-use systems in Ghana. Ecol. Process 2021, 10, 1–13. [Google Scholar] [CrossRef]
  64. Polyakov, V.O.; Lal, R. Soil erosion and carbon dynamics under simulated rainfall. Soil Sci. 2004, 169, 590–599. [Google Scholar] [CrossRef]
  65. Gou, T.; Liu, H.; Shuai, W.; Jiang, X.; Li, J. Characteristics of soil aggregate at different altitude gradients in high-frigid mountain of west Sichuan region. Res. Soil Water Conserv. 2020, 27, 47–53. [Google Scholar]
  66. Dou, S.; Li, K.; Guan, S. A review on organic matter in soil aggregates. Acta Pedol. Sin. 2011, 48, 412–418. [Google Scholar]
  67. Stewart, C.E.; Plante, A.F.; Paustian, K.; Conant, R.T.; Six, J. Soil carbon saturation: Linking concept and measurable carbon pools. Soil Sci. Soc. Am. J. 2008, 72, 379–392. [Google Scholar] [CrossRef]
  68. Xue, Y.; Xue, W.; Zhang, S.; Yang, X. Effects of long-term fertilization regimes on changes of aggregate cementing agent of Lou Soil. Plant Nutr. Fertil. Sci. 2015, 21, 1622–1632. [Google Scholar]
  69. Qi, J. Contents of soil organic carbon and its relations with physicochemical properties of secondary natural oak forests in eastern mountain area of Liaoning Province. J. Soil Water Conserv. 2017, 31, 135–140. [Google Scholar]
Figure 1. Soil sampling site locations in the Greater Khingan Mountains.
Forests 13 01267 g001
Figure 2. Soil aggregate compositions.
Forests 13 01267 g002
Figure 3. Stability characteristics of soil aggregates.
Forests 13 01267 g003
Figure 4. Contents and proportions of aggregate SOC.
Forests 13 01267 g004
Figure 5. Correlations among soil aggregate features (MWD: mean weight diameter; GMD: geometric mean diameter; D: fractal dimension) and the mass of size fractions (0.25–2 mm, 0.053–0.25 mm, <0.053 mm).
Forests 13 01267 g005
Figure 6. Semivariograms of soil aggregates and aggregate SOC ((ac) are for soil aggregates and (df) are for aggregate SOC).
Forests 13 01267 g006
Figure 7. Spatial distributions of soil aggregates and aggregate SOC ((ac) are for soil aggregates and (df) are for aggregate SOC).
Forests 13 01267 g007
Figure 8. Correlations between soil aggregates, aggregate SOC and climatic indexes, soil physicochemical indexes ((a) is for soil aggregates and (b) is for aggregate SOC).
Forests 13 01267 g008
Table 1. Optimal models for SAF and aggregate SOC.
IndexTheoretical ModelNugget
C0
Sill
C + C0
Nugget Sill Ratio
C0/(C + C0)
Range
A (°)
R2
Soil aggregates0.25–2 mmExponential81.3162.750.0%1.090.638
0.053–0.25 mmSpherical48.296.549.9%3.060.822
<0.053 mmExponential54.7133.3541.0%7.500.652
Aggregate SOC0.25–2 mmGaussian0.0012.5400.04%0.520.692
0.053–0.25 mmGaussian0.00200.58600.34%0.520.210
<0.053 mmExponential0.810020.5003.95%0.410.448
Publisher’s Note: MDPI stays neutral with regard to jurisdictional claims in published maps and institutional affiliations.

