Article

Increases in the Methane Uptake of Upland Forest Soil in China Could Significantly Contribute to Climate Change Mitigation

Key Laboratory of Ecosystem Network Observation and Modeling, Institute of Geographic Sciences and Natural Resources Research, Chinese Academy of Sciences, Beijing 100101, China
Forests 2022, 13(8), 1270; https://doi.org/10.3390/f13081270
Submission received: 25 June 2022 / Revised: 8 August 2022 / Accepted: 10 August 2022 / Published: 11 August 2022
(This article belongs to the Section Forest Soil)

Abstract

:
Upland forest soil is an important CH4 sink that plays a key role in climate change mitigation. China features large areas of various types of forest, but spatiotemporal variation in CH4 flux has not yet been clarified. Here, we analyzed variation in CH4 flux and the effects of environmental variables on the CH4 flux of forest in China using in situ observational data. Upland forest soil absorbed CH4 at a rate of 0.24 ± 0.02 g m−2 yr−1. The CH4 uptake rate (0.46 ± 0.10 g m−2 yr−1) of warm temperate deciduous broad-leaved forest was the highest. Soil alkali-hydrolyzable nitrogen was the only factor significantly correlated with CH4 uptake variation among vegetation zones. A break point in CH4 uptake over the study period (from 1997 to 2020) was detected in 2015. CH4 uptake slightly decreased until 2015 and increased after 2015. The mean CH4 uptake of the period after 2015 (0.44 ± 0.07 g m−2 yr−1) was significantly higher than that before 2015 (0.20 ± 0.02 g m−2 yr−1). Atmospheric nitrogen deposition was negatively related to interannual CH4 uptake. Our findings suggest that the CH4 uptake of upland forest soil will continue to increase over the next few decades as China accelerates efforts to achieve its carbon neutrality goal, and this would result in continuous decreases in nitrogen deposition through various pathways.

1. Introduction

Methane (CH4) is the second most important anthropogenic greenhouse gas in the atmosphere following carbon dioxide, and it has contributed 0.5 °C of warming from 2010 to 2019. By comparison, the temperature rise caused by CO2 emissions over the same period was 0.73 °C [1]. Some of the highest levels of anthropogenic CH4 emissions are in eastern Asia; consequently, CH4 emission-induced temperature increases in eastern Asia are several times higher than those reported in other regions [2].
Forest soil is the largest CH4 sink among terrestrial ecosystems; on a global scale, forest soil absorbed 9.16 ± 3.84 Tg CH4 per year from 1981 to 2010 [3,4], which is approximately 1/3 of the CH4 emissions associated with rice cultivation [5]. Soil CH4 uptake is an economically efficient, long-lasting, and multifunctional approach for climate change mitigation [6]. Therefore, accurate estimates of CH4 uptake by forest soil are important for regulating the global CH4 budget and providing key information for policymakers responsible for developing climate mitigation policies. However, estimates of CH4 uptake reported in various studies are inconsistent, and the cause of these inconsistencies remains unclear [3,7,8]. A lack of knowledge of fundamental concepts likely explains the large discrepancies among models in their representation of CH4 processes as well as their environmental controls [9].
There is a high degree of variation in temperature, precipitation, topography, and forest type in China [10]. However, to the best of our knowledge, only two regional studies have examined forest CH4 uptake in China to date [11,12]. In the first study, CH4 uptake by forest in China was estimated using observational data from 26 sites [11]. In the second study, CH4 uptake rates of different ecoregions and the effects of litter removal and nitrogen (N) addition were analyzed [12]. Long-term variation in CH4 uptake by forests in China has not yet been analyzed.
Here, we characterized (1) variation in the CH4 uptake of forest soil in areas differing in vegetation (forest types) in China, (2) long-term trends in CH4 uptake, and (3) relationships between environmental variables and CH4 uptake using in situ observational data. Our findings shed new light on the relative importance of forest CH4 uptake in climate change mitigation.

2. Materials and Methods

2.1. CH4 Flux Data

We compiled studies from the China National Knowledge Infrastructure (CNKI) and Web of Science database using the following criteria: (1) measurements of forest soil CH4 flux were conducted in situ; (2) the chamber method, including self-made chambers and commercial products, was used to take CH4 flux measurements; (3) no manipulations were conducted during data collection (e.g., fertilization, water reduction, and litter removal); and (4) the sampling period was at least 4 months. Data in figures were extracted using GetData Graph Digitizer software (Version 2.25, GetData Software, Kogarah, Australia). We acquired chamber-observed in situ CH4 flux data for 4 sites from the ChinaFLUX platform (http://159.226.111.42/pingtai/LoginRe/dataservice2.jsp, accessed on 28 October 2016). Annual CH4 flux data from previous studies and ChinaFLUX were derived by averaging all observations in a year. We extracted the annual CH4 flux of forest in China from five published reviews and meta-analyses [3,12,13,14,15]. Duplicate records among different sources were omitted based on the location and reported sampling time.
A total of 277 annual CH4 estimates were obtained (Figure 1a), including 138 records from observational studies, 27 records from the ChinaFLUX platform, and 112 records from published review papers. These records were taken from a wide range of forest types and environments (Figure 1). According to China’s vegetation zones [16], the dataset covers all forest zones and a grassland zone in which forest growth is sparse (Figure 1a).

2.2. Environmental Data

To analyze the effects of environmental variables on spatiotemporal variation in CH4 flux, precipitation, temperature, N deposition, and soil parameter data were collected. Annual mean temperature (MAT, °C), annual precipitation (MAP, mm), and soil water content (SWC, mm) were obtained from global climate archives (0.5-degree, monthly) provided by the NOAA/OAR/ESRL PSL, Boulder, CO, USA [17,18,19]. Soil parameters were obtained from a China soil dataset (30 arc-seconds) [20], including soil organic matter (SOM, g/100 g), total N (TN, g/100 g), alkali-hydrolysable N (AN, mg/kg), total phosphorus (TP, g/100 g), available phosphorus (AP, mg/kg), total potassium (TK, g/100 g), available potassium (AK, mg/kg), pH, bulk density (BD, g/cm3), porosity (POR, cm3/100 cm3), and rock fragments (GRAV, g/100 g). Soil conditions were assumed to be constant across the study period (1997–2020). Atmospheric N deposition was obtained from a China inorganic N wet deposition dataset (1 km) [21], including ammonium N (abbreviated as NH4, kg N ha−1 yr−1), nitrate N (abbreviated as NO3, kg N ha−1 yr−1), and dissolved inorganic N (DIN, sum of ammonium N and nitrate N, kg N ha−1 yr−1). The N deposition data were from 1996 to 2015 over 5-year intervals. Therefore, N deposition data and flux data were organized by period and N deposition data after 2015 were treated as unavailable.

2.3. Statistical Analysis

Wilcoxon–Mann–Whitney tests were used to analyze differences among different zones and periods using the “coin” package [22]. Long-term flux variation was analyzed using locally weighted regression (loess). Piecewise regression was carried out to determine the break point using the “segmented” package [23,24]. The random forest algorithm was used to compare the relative importance of different environmental factors affecting spatiotemporal variation in CH4 uptake [25]. This analysis was carried out using the packages “randomForest” and “rfUtilities” [26,27]. Correlations between environmental factors and fluxes were conducted using Spearman correlation analysis and partial correlation analysis with the “ppcor” package [28]. A probability value (p value) less than 0.05 was considered statistically significant.
All statistical analyses and plotting were conducted in R [29] with the aforementioned packages and the “ggplot2” [30], “ggpubr” [31], ”grid” [29], ”Cairo” [32], ”dplyr” [33], ”maptools” [34], ”sp” [35], and ”rgdal” [36] packages.

3. Results

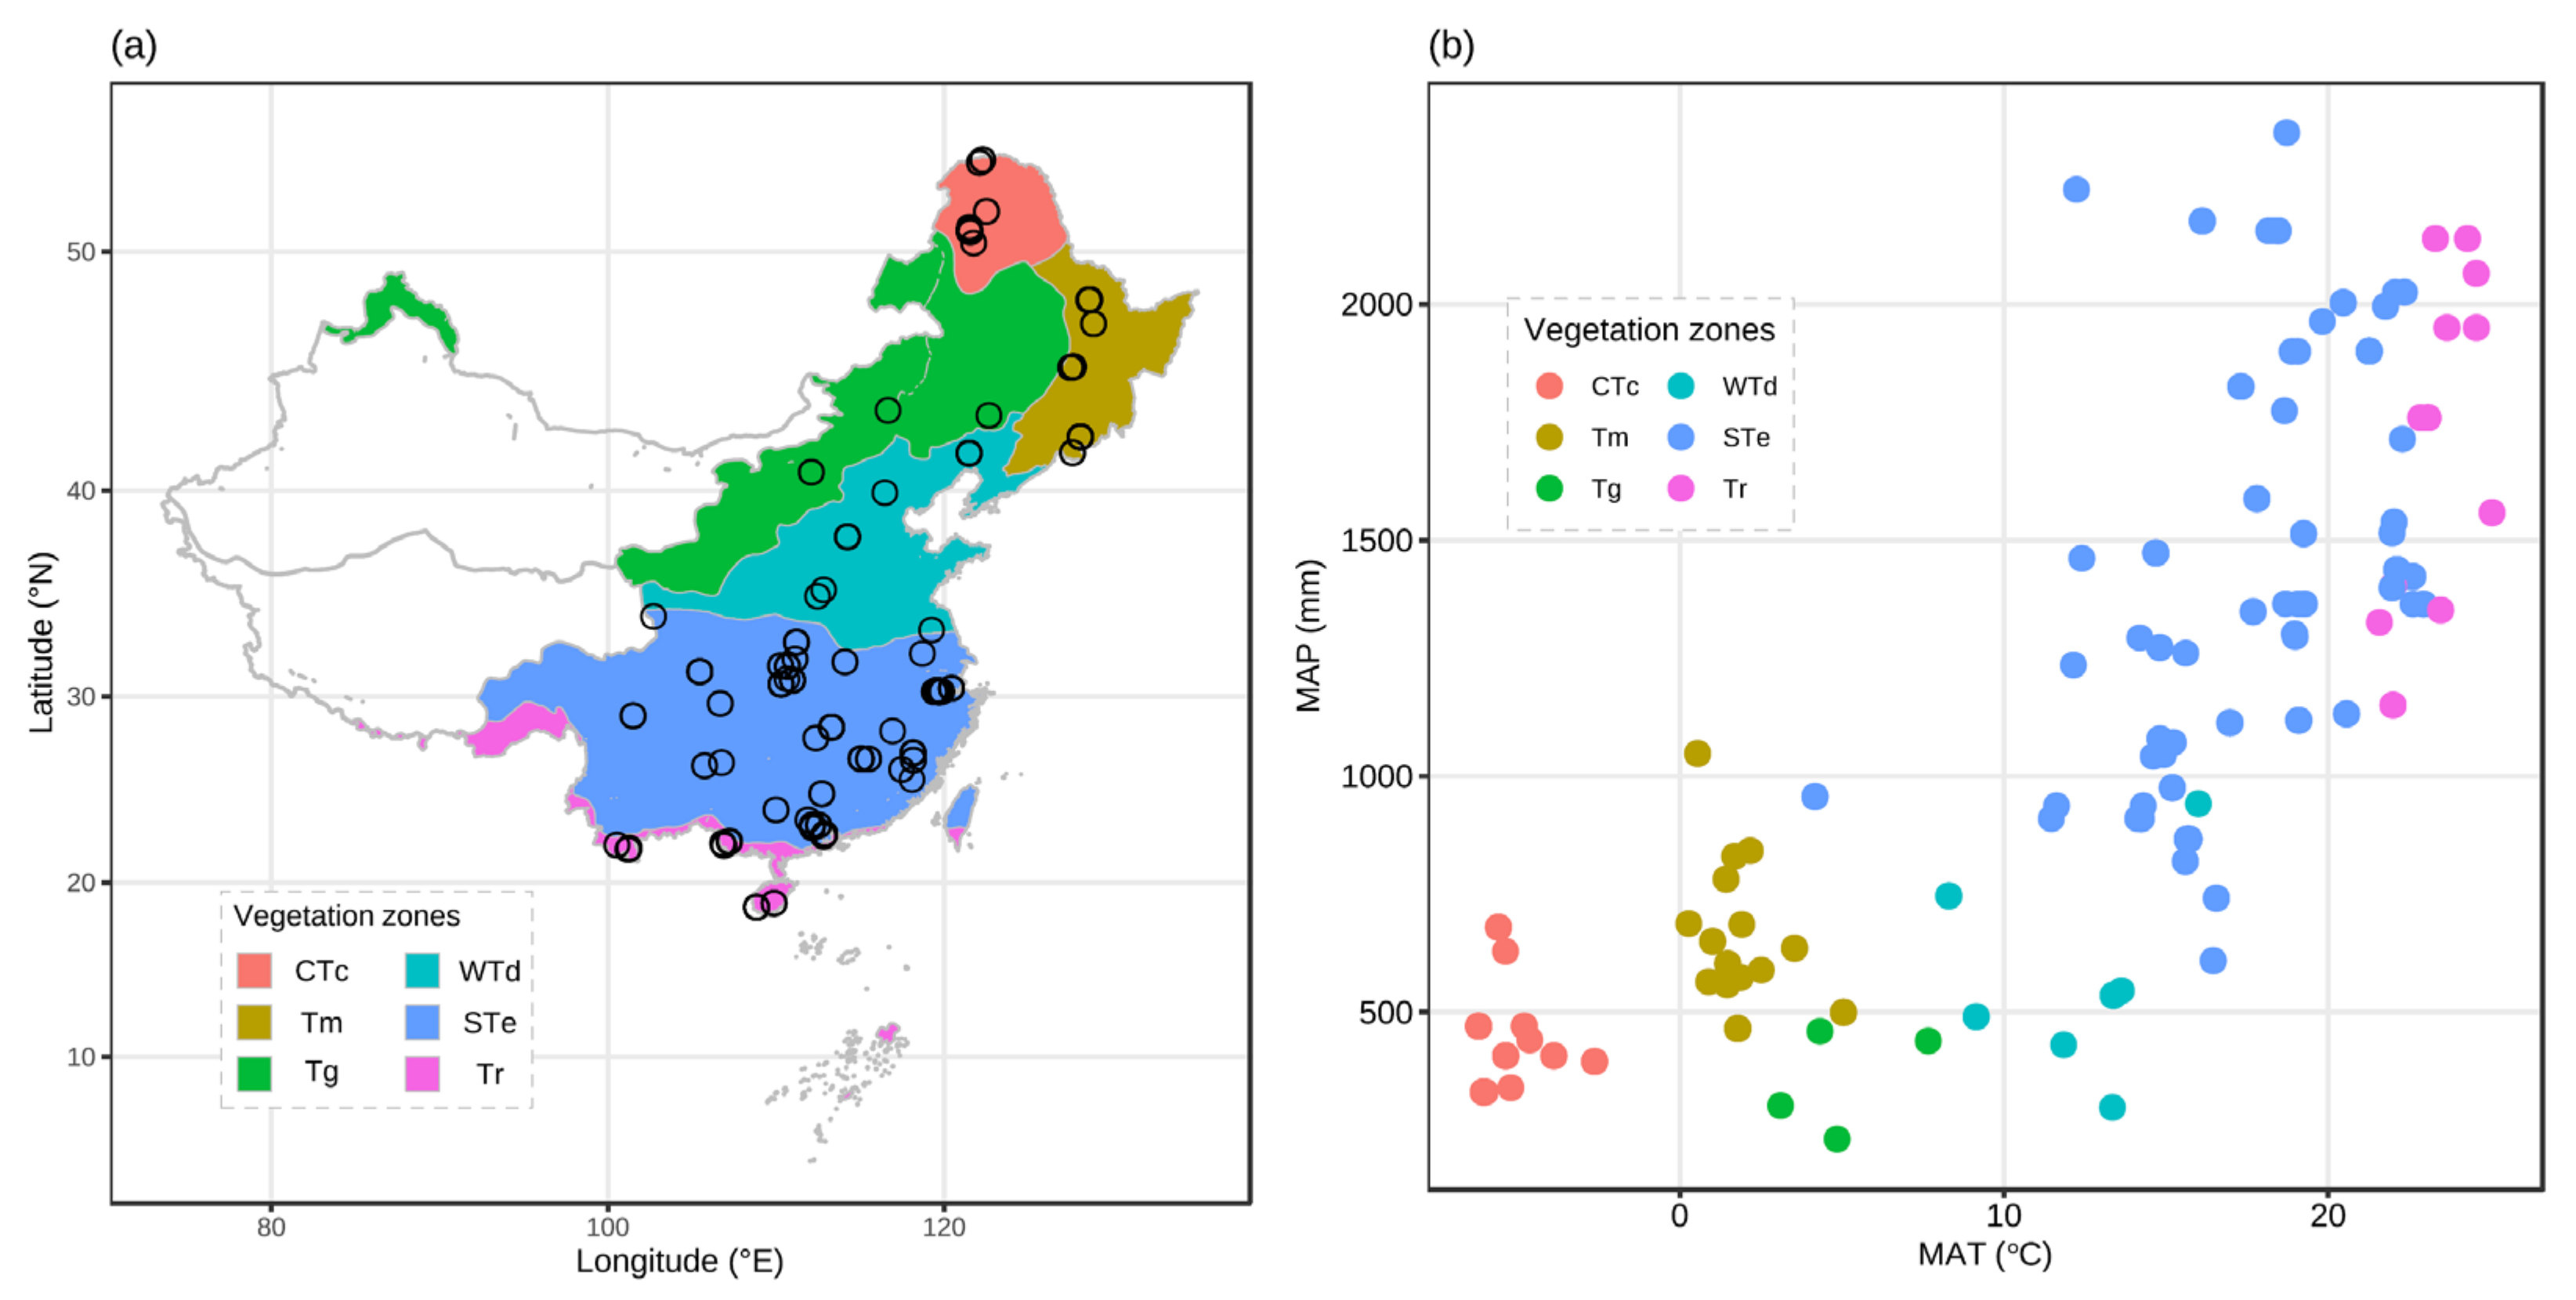
3.1. Spatial Variation in Forest Soil CH4 Flux

Upland forest soil in China was a CH4 sink with an average flux of 0.24 ± 0.02 g m−2 yr1 (mean ± SE, positive values indicate CH4 uptake. Negative values indicate CH4 loss from soil to air), and values ranged from −0.83 g m−2 yr−1 to 1.79 g m−2 yr−1. In contrast, wetland forest was a strong CH4 source of 14.4 ± 12.81 g m−2 yr−1 (ranging from −142.18 g m−2 yr−1 to 0.25 g m−2 yr−1), which was 60 times that of upland forest flux.
Spatial variation in the CH4 flux of upland forest soil was observed among the different zones (Figure 2). The highest CH4 uptake rate was observed in WTd, which was approximately two times that of the CTc, Tm, and STe zones and 1.6 and 1.8 times that of the Tg and Tr zones, respectively. The CH4 flux of WTd was significantly higher than that of the rest of the zones (p < 0.05). CH4 flux was highest between 35 and 40° N, which is the latitudinal range with the largest area of WTd. Variation in CH4 flux with longitude was small; the CH4 flux of all zones was similar to the mean flux.

3.2. Long-Term Changes in Upland Forest Soil CH4 Uptake

The CH4 uptake rate of upland forest soil in China varied during the 24-year study period; specifically, it decreased slightly in the first 20 years and then increased substantially (Figure 3a). Piecewise analysis showed that the break point was 2015 when data from 2007 were excluded from the analysis (2007 was the only year in which the average CH4 uptake rate of upland forest was negative; when data from 2007 were included, 2007 was the break point. Even though upland soils were a CH4 sink according to most observations, upland forest soil can produce CH4 in the anaerobic center of soil aggregates or saturated zones coinciding with the water table surface [37]. Consequently, upland forest soil is a CH4 source at the site scale in approximately 10% of all records [8]. The negative CH4 uptake rate of 2007 might be caused by the small sample size, as only two samples were collected). The mean CH4 uptake of the period after 2015 was significantly higher than that before 2015 (p < 0.05), which was 0.44 ± 0.07 g m−2 yr−1 and 0.20 ± 0.02 g m−2 yr−1, respectively (Figure 3b).
Long-term changes were similar in CTc, Tm, Tg, and STe, although the break point varied (Figure 3c). To minimize the effect of spatial variation, we analyzed long-term variation in a typical temperate forest site in Changbai Mountain, which was the site from which data were collected over the longest period. Similar patterns of variation were observed, and an increase in CH4 uptake was observed after approximately 2010 (Figure 3d).

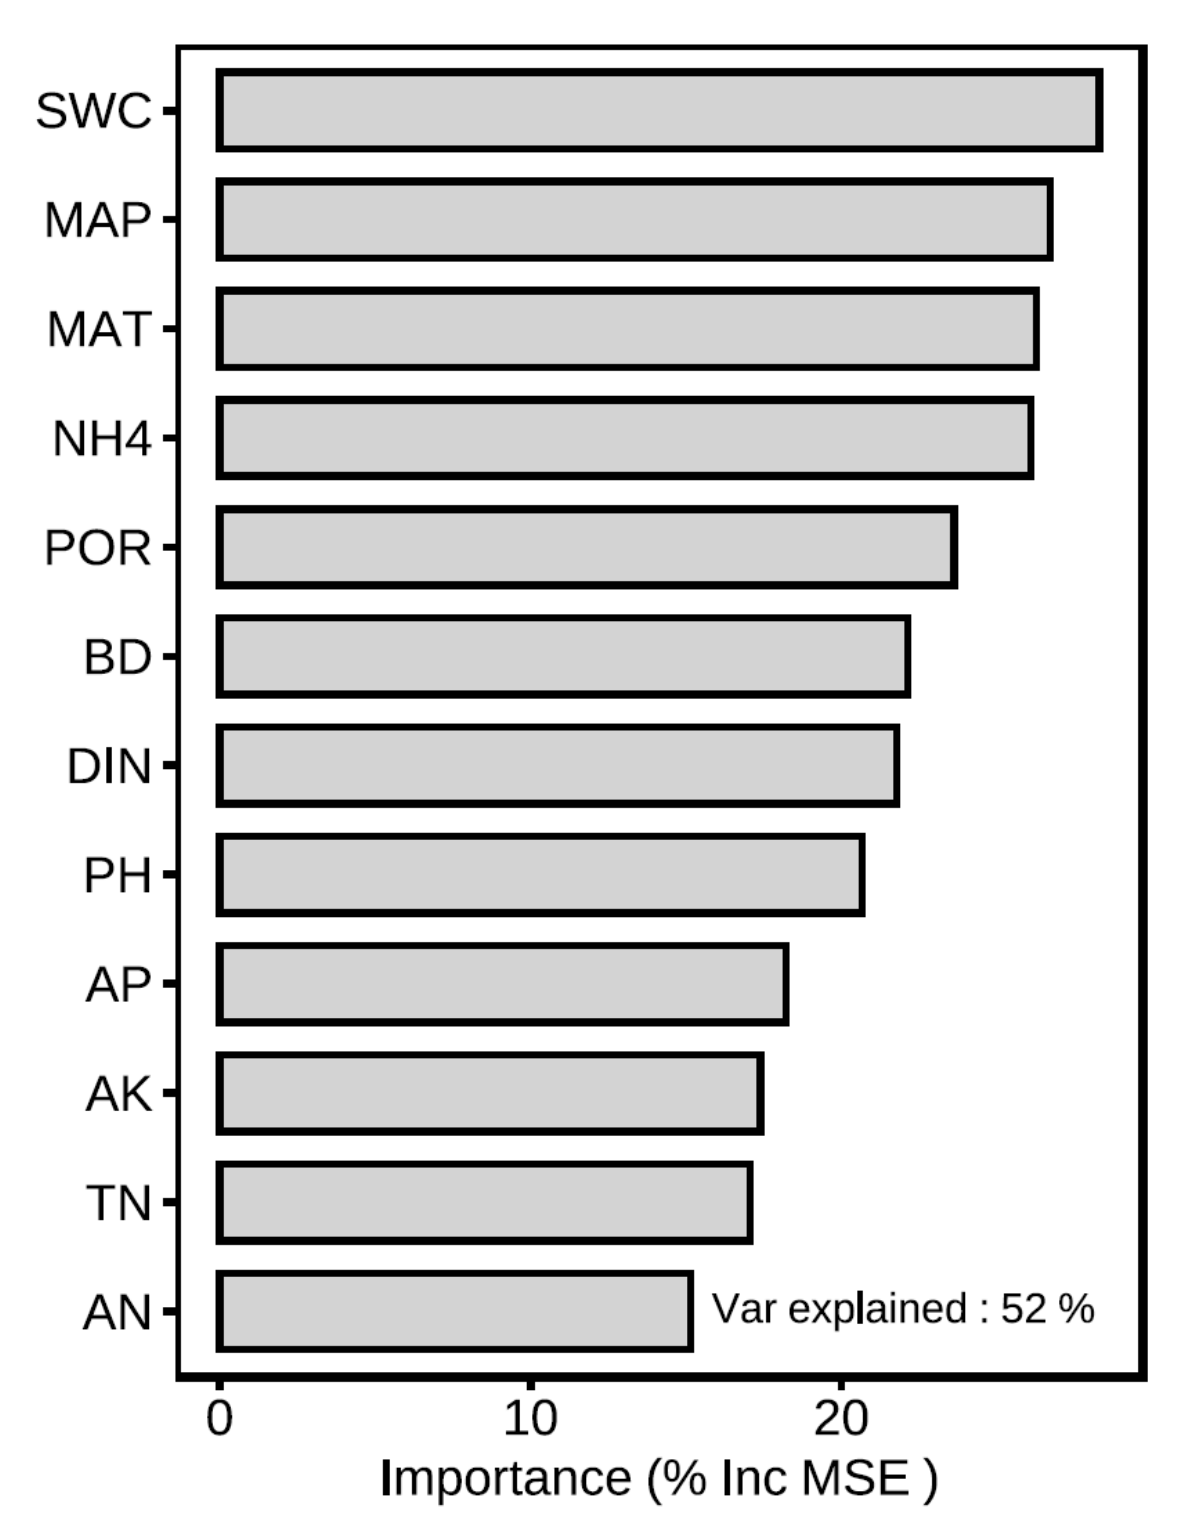
3.3. Relationships between Environmental Factors and CH4 Flux

Among the 17 environmental factors, 12 of them (SWC, MAP, MAT, NH4, POR, BD, DIN, PH, AP, AK, TN, and AN) were retained in the best random forest model, which indicates that they play an important role in explaining spatiotemporal variation in CH4 flux. Approximately 52% of CH4 variation can be predicted using these 12 factors (Figure 4). Among these factors, water condition was the most important parameter, followed by temperature, N deposition, and soil aeration conditions (Figure 4). SOM, TP, and TK were excluded from the best model. NO3 was removed from the selection of predictors because of its collinearity with DIN.
AN was the only factor that was significantly correlated with CH4 uptake variation across the six vegetation zones (Table 1). CH4 uptake monotonically increased as AN decreased (Table 2). Negative linear correlations were observed between N deposition (DIN and NO3, Figure 5) and CH4 uptake. Given that CH4 loss is maintained by CH4 production, which is different from CH4 oxidation, the only negative CH4 uptake value in 2007 (see Figure 3a for details) was omitted in the correlation analysis. When this negative value was included in the correlation analysis, no significant correlations were observed between environmental variables (SWC, MAP, MAT, DIN, NH4, and NO3) and CH4 flux. Partial correlation analysis at the interannual scale showed that after excluding the effect of N deposition (DIN and NO3), the correlations between MAP/MAT/SWC and CH4 uptake were still insignificant (p > 0.05).

4. Discussion

4.1. Upland Forest Soil in China Is an Important CH4 Sink

Forest soil is widely recognized as an important CH4 sink. The mean CH4 uptake of forest soil in China based on in situ observational data was 0.24 ± 0.02 g m−2 yr−1, which is lower than that reported by a previous study (0.43 g m−2 yr−1) [12] but similar to that reported by a recent study [8]. The mean uptake rate in our study was in the range of global mean CH4 uptake values reported by different studies (i.e., from 0.19 to 0.61 g m−2 yr−1) [3,8,12,14,15]. Forest is the largest terrestrial carbon sink. The net ecosystem productivity (NEP) of Asian forest is 645.3 g CO2 m−2 yr−1 [39]. Given that the global warming potential of CH4 is 81 times that of CO2 over a 20-year period (GWP20) [1], CH4 uptake could enhance the climate change mitigation effect of upland forest by approximately 3%. This percentage in low or high latitudinal areas could be several times higher, such as 8% from 10° N to 20° N and 10% from 50° N to 60° N (calculated based on data from our study and data from Yu et al. (2014)).
The CH4 uptake rate of WTd was significantly higher than that of the other five vegetation zones (Figure 2). Soil AN was the only environmental parameter significantly correlated with CH4 uptake (Table 1). The average soil AN of WTd was the lowest among the different vegetation zones (Table 2). Soil AN is composed of inorganic N (mainly consisting of NH4+ and NO3) and easily hydrolyzed organic nitrogen (including amino acids, amides, and easily hydrolyzed proteins). Negative relationships between the soil N content and CH4 uptake have been widely reported [40,41]. Soil N inhibits CH4 uptake through mechanisms such as competition of NH4+ with CH4 monooxygenase because of their similar molecular structure, the toxic effects of NO3 on methanotrophic bacteria, and the enrichment of AN, which increases litter accumulation on the soil surface and indirectly inhibits soil CH4 uptake by reducing the diffusion of CH4 and O2 at the air–soil interface [42,43,44,45,46].
Water conditions and temperature might also contribute to explaining variation in the CH4 uptake rate among regions. The precipitation of WTd was relatively moderate (average of 571.5 mm per year at all sites located in the area, Table 2) compared with that of STe and Tr (averages of 1398.3 mm and 1711.5 mm, respectively) and Tg (average of 358.3 mm). In general, variation in CH4 uptake tends to first increase and then decrease as the soil water content increases [47]. Precipitation addition has been shown to decrease CH4 uptake in a temperate forest that receives ambient rainfall of 1400 mm per year [48]; precipitation addition has also been shown to increase CH4 uptake in a temperate desert steppe that receives 150 mm of rainfall per year [49]. High precipitation may result in decreases in net CH4 uptake by inhibiting CH4 oxidation or accelerating CH4 production, which prolongs soil anaerobic conditions [50]. Inadequate precipitation can also weaken CH4 uptake because methanotroph activity decreases under drought stress, although methanotrophs prefer aerobic soil conditions [51]. The annual precipitation of CTc and Tm is similar to that of WTd, but the CH4 uptake of CTc and Tm is lower than that of WTd. Continuous permafrost, island permafrost, and seasonal frozen soil are present in CTc and Tm [52]. The frozen soil can form a barrier that prevents rainwater from leaking, which can cause more water to accumulate in the near surface soil and reduce CH4 uptake. In addition, the lower CH4 uptake rate might be partly explained by the lower annual mean temperature of CTc and Tm compared with WTd (−5.2 °C, 2.2 °C, and 11.7 °C, respectively, Table 2). In short, the higher CH4 uptake of WTd might be explained by the low soil N and moderate water conditions, but more direct evidence is needed to confirm this conclusion.
The CH4 emission rate of wetland forests is high. The average emission velocity was 14.40 ± 12.81 g m−2 yr−1, and the highest value in our dataset was 142.18 g m−2 yr−1. This is comparable to other types of wetlands, such as mangroves, swamps, and water bodies [53,54,55,56]. Nevertheless, our findings were inconsistent with the results of a study of global forest CH4 flux that found that the CH4 flux of upland forest and wetland forest is similar [8]. Additional studies at the site and regional scale are needed to improve the robustness of CH4 flux estimates of wetland forest as well as resolve discrepancies among studies. The CH4 emissions of wetland forest are 60 times the CH4 uptake of upland forest. Mean CH4 emissions are nearly two times the NEP when GWP20 is considered. Freshwater swamp forest accounts for 1.4% of the total forest area of the globe [57], which suggests that wetland forest might offset 84% of the CH4 uptake by upland forest, albeit much uncertainty in the exact figures remains. Regional CH4 emissions of inland wetland forest are seldom mentioned in previous studies of CH4 emissions of forests and wetlands [3,58,59]. The high level of CH4 emissions estimated suggests that there might be considerable bias in estimates of ecosystem greenhouse gas budgets, which might be derived from a lack of knowledge of inland wetland forest CH4 emissions.

4.2. CH4 Uptake of Upland Forest Soil Is Increasing

To explore interannual variation in CH4 uptake and the response of CH4 uptake to global change, long-term variation in CH4 uptake and typical global change parameters, i.e., precipitation, temperature, and atmospheric N deposition, was investigated. Over the past two decades, the CH4 uptake of upland forest soil in China decreased until 2015 (Figure 3). This finding is consistent with the results of a previous study indicating that the global CH4 uptake by forest soil decreased from 1988 to 2015 [13]. However, CH4 uptake increased dramatically after 2015, and it was significantly higher than before 2015 (Figure 3).
Patterns of DIN and NO3 were opposite those of CH4 uptake, and significant negative correlations were observed at the interannual scale (Figure 5). In light of the correlation between regional soil AN and CH4 uptake, the negative correlations between N input and CH4 uptake indicate that N plays an important role in regulating CH4 flux. Since the 1990s, China has taken several actions to improve air quality, such as “Reducing the use of N fertilizer and improving N use efficiency”, “Air Pollution Prevention and Control Action Plan”, and “Action plan for zero growth in fertilizer use by 2020”. These measures have induced substantial declines in N deposition since 2000 [38,60]. Nitrogen addition experiments have been conducted to clarify the effect of N on terrestrial CH4 flux [61,62,63]. Although the amount of N deposition was generally moderate compared with the amount input in the N addition experiments, our results confirmed the effects of N deposition on the CH4 uptake of forest soil across interannual scales. Our findings indicate that the CH4 fixation of upland forest soil will play an increasingly larger role in climate change mitigation in the coming decades as new and long-lasting measures were initiated in 2020 to achieve China’s goals of having emissions peak before 2030 and reaching carbon neutrality by 2060. Improvements in energy efficiency and pollution reduction are the most important pathways for meeting these targets [64].
Briefly, the interannual pattern of MAP, SWC, and MAT was the same as that of CH4 uptake (Figure 5), which might partly explain interannual variation in CH4 uptake. Soil water conditions are one of the most important variables affecting CH4 flux through its effects on CH4 consumption and production [8,14]. Temperature also has a major effect on microbial activity [65]. However, Spearman correlation analysis and partial correlation analysis (excluding the effect of N deposition) of the two decades of data revealed insignificant relationships between water conditions/temperature and CH4 uptake. The weak correlations observed in the present study might be caused by interactions with other environmental factors, especially biotic factors that were not analyzed in the present study owing to the difficulty of obtaining data across a large region (e.g., community composition of methanotrophs, amount of competitive microbes, interactions with plant metabolic processes, etc. [8,66]), variation in the response of CH4 uptake to water conditions and temperature across years triggered by shifts in dominant environmental limitations and adaptation to long-term environment change [67,68,69], or bias caused by variation in the number of samples among years. Air temperature and precipitation in China have been increasing from 1961 to 2020 and are expected to continue to increase in the near future [70]. Our findings also suggest that the CH4 uptake of forest soil in China might continue to increase in the following years, but there remains a great deal of uncertainty regarding future patterns.

5. Conclusions

Upland forest soil in China is an important CH4 sink. Soil N conditions and atmospheric N deposition significantly inhibit CH4 uptake. For the first time, we found that long-term variation patterns of N deposition were opposite those of CH4 uptake on regional scale of China. Given that China aims to achieve carbon neutrality in the coming decades, declines in N deposition might increase the CH4 uptake of upland forest soil. Precipitation and temperature are important factors affecting the soil CH4 sink, but long-term response patterns of CH4 uptake to precipitation and temperature were not clear. To support decision-making on climate change mitigation, more studies are needed to explore the responses of soil CH4 uptake to climate change, anthropogenic activities, and their interactions.

Funding

This research was funded by the Natural Science Foundation of China (Grant No. 31800406), Chinese Academy of Sciences Priority Research Program (Grant No. XDA19020302), Basic Research Project of Field Station of Chinese Academy of Sciences (Grant No. KFJ-SW-YW043), and Young Talents Project of Institute of Geographic Sciences and Natural Resources Research (Grant No. 2021RC004).

Acknowledgments

We thank Congcong Liu, Cuicui Jiao, Guangyan Song, Guili Zhu, Haili Yu, Hang Zhao, Jiahui Zhang, Jianxing Zhu, Jingjing Chang, Lang Han, Li Xu, Pu Yan, Qiongyu Zhang, Weikang Zhang, Ying Li, Yingqiu Cao, Yuan Liu and Yuqian Tang for help with extracting data from literature. We sincerely appreciate all anonymous reviewers who provide valuable suggestions on this paper.

Conflicts of Interest

The authors declare no conflict of interest.

References

  1. IPCC. Summary for Policymakers. In Climate Change 2021: The Physical Science Basis, Contribution of Working Group I to the Sixth Assessment Report of the Intergovernmental Panel on Climate Change; Masson-Delmotte, V., Zhai, P., Pirani, A., Connors, S.L., Péan, C., Berger, S., Caud, N., Chen, Y., Goldfarb, L., Gomis, M.I., et al., Eds.; Cambridge University Press: Cambridge, UK, 2021. [Google Scholar]
  2. Szopa, S.; Naik, V.; Adhikary, B.; Artaxo, P.; Berntsen, T.; Collins, W.D.; Fuzzi, S.; Gallardo, L.; Kiendler-Scharr, A.; Klimont, Z.; et al. Short-Lived Climate Forcers. In Climate Change 2021: The Physical Science Basis. Contribution of Working Group I to the Sixth Assessment Report of the Intergovernmental Panel on Climate Change; Masson-Delmotte, V., Zhai, P., Pirani, A., Connors, S.L., Péan, C., Berger, S., Caud, N., Chen, Y., Goldfarb, L., Gomis, M.I., et al., Eds.; Cambridge University Press: Cambridge, UK; New York, NY, USA, 2021; pp. 817–922. [Google Scholar]
  3. Yu, L.; Huang, Y.; Zhang, W.; Li, T.; Sun, W. Methane uptake in global forest and grassland soils from 1981 to 2010. Sci. Total Environ. 2017, 607–608, 1163–1172. [Google Scholar] [CrossRef] [PubMed]
  4. Tian, H.; Chen, G.; Lu, C.; Xu, X.; Ren, W.; Zhang, B.; Banger, K.; Tao, B.; Pan, S.; Liu, M.; et al. Global methane and nitrous oxide emissions from terrestrial ecosystems due to multiple environmental changes. Ecosyst. Health Sustain. 2015, 1, 1–20. [Google Scholar] [CrossRef] [Green Version]
  5. Saunois, M.; Stavert, A.R.; Poulter, B.; Bousquet, P.; Canadell, J.G.; Jackson, R.B.; Raymond, P.A.; Dlugokencky, E.J.; Houweling, S.; Patra, P.K.; et al. The Global Methane Budget 2000–2017. Earth Syst. Sci. Data 2020, 12, 1561–1623. [Google Scholar] [CrossRef]
  6. Qin, Z.C.; Deng, X.; Griscom, B.; Huang, Y.; Li, T.T.; Smith, P.; Yuan, W.P.; Zhang, W. Natural Climate Solutions for China: The Last Mile to Carbon Neutrality. Adv. Atmos. Sci. 2021, 38, 889–895. [Google Scholar] [CrossRef]
  7. Liu, L.; Estiarte, M.; Peñuelas, J. Soil moisture as the key factor of atmospheric CH4 uptake in forest soils under environmental change. Geoderma 2019, 355, 113920. [Google Scholar] [CrossRef]
  8. Feng, H.; Guo, J.; Han, M.; Wang, W.; Peng, C.; Jin, J.; Song, X.; Yu, S. A review of the mechanisms and controlling factors of methane dynamics in forest ecosystems. For. Ecol. Manag. 2020, 455, 117702. [Google Scholar] [CrossRef]
  9. Xu, X.; Yuan, F.; Hanson, P.J.; Wullschleger, S.D.; Thornton, P.E.; Riley, W.J.; Song, X.; Graham, D.E.; Song, C.; Tian, H. Reviews and syntheses: Four decades of modeling methane cycling in terrestrial ecosystems. Biogeosciences 2016, 13, 3735–3755. [Google Scholar] [CrossRef] [Green Version]
  10. Xu, J.; Xie, S.; Han, A.; Rao, R.; Huang, G.; Chen, X.; Hu, J.; Liu, Q.; Yang, X.; Zhang, L. Forest Resources in China—The 9th National Forest Inventory; National Forestry and Grassland Administration: Beijing, China, 2019. [Google Scholar]
  11. Cai, Z. Greenhouse gas budget for terrestrial ecosystems in China. Sci. China Earth Sci. 2012, 55, 173–182. [Google Scholar] [CrossRef]
  12. Wang, Y.; Chen, H.; Zhu, Q.; Peng, C.; Wu, N.; Yang, G.; Zhu, D.; Tian, J.; Tian, L.; Kang, X.; et al. Soil methane uptake by grasslands and forests in China. Soil Biol. Biochem. 2014, 74, 70–81. [Google Scholar] [CrossRef]
  13. Ni, X.; Groffman, P.M. Declines in methane uptake in forest soils. Proc. Natl. Acad. Sci. USA 2018, 115, 8587–8590. [Google Scholar] [CrossRef] [Green Version]
  14. Gatica, G.; Fernández, M.E.; Juliarena, M.P.; Gyenge, J. Environmental and anthropogenic drivers of soil methane fluxes in forests: Global patterns and among-biomes differences. Glob. Change Biol. 2020, 26, 6604–6615. [Google Scholar] [CrossRef] [PubMed]
  15. Wu, J.; Cheng, X.; Xing, W.; Liu, G. Soil-atmosphere exchange of CH4 in response to nitrogen addition in diverse upland and wetland ecosystems: A meta-analysis. Soil Biol. Biochem. 2022, 164, 108467. [Google Scholar] [CrossRef]
  16. China Vegetation Editorial Committee. Vegetation Zoning Data of China. 1980. Available online: https://www.resdc.cn/data.aspx?DATAID=133 (accessed on 5 May 2022).
  17. Xie, P.; Arkin, P.A. Global Precipitation: A 17-Year Monthly Analysis Based on Gauge Observations, Satellite Estimates, and Numerical Model Outputs. Bull. Am. Meteorol. Soc. 1997, 78, 2539–2558. [Google Scholar] [CrossRef]
  18. Fan, Y.; van den Dool, H. A global monthly land surface air temperature analysis for 1948–present. J. Geophys. Res. Atmos. 2008, 113, D01103. [Google Scholar] [CrossRef]
  19. Van den Dool, H.; Huang, J.; Fan, Y. Performance and analysis of the constructed analogue method applied to U.S. soil moisture over 1981–2001. J. Geophys. Res. Atmos. 2003, 108, 8617. [Google Scholar] [CrossRef]
  20. Wei, S.; Yongjiu, D.; Baoyuan, L.; Axing, Z.; Qingyun, D.; Lizong, W.; Duoying, J.; Ye, A.; Yuan, H.; Zhang, Q.; et al. A China data set of soil properties for land surface modeling. J. Adv. Model. Earth Syst. 2013, 5, 212–224. [Google Scholar] [CrossRef]
  21. Jia, Y.; Wang, Q.; Zhu, J.; Chen, Z.; He, N.; Yu, G. A spatial and temporal dataset of atmospheric inorganic nitrogen wet deposition in China (1996–2015). China Sci. Data 2019, 4, 76–83. [Google Scholar] [CrossRef]
  22. Hothorn, T.; Hornik, K.; van de Wiel, M.; Zeileis, A. A Lego system for conditional inference. Am. Stat. 2006, 60, 257–263. [Google Scholar] [CrossRef] [Green Version]
  23. Muggeo, V.M.R. Segmented: An R Package to Fit Regression Models with Broken-Line Relationships. R News 2008, 8, 20–25. [Google Scholar]
  24. Muggeo, V.M.R. Interval estimation for the breakpoint in segmented regression: A smoothed score-based approach. Aust. N. Z. J. Stat. 2017, 59, 311–322. [Google Scholar] [CrossRef]
  25. Murphy, M.A.; Evans, J.S.; Storfer, A. Quantifying Bufo boreas connectivity in Yellowstone National Park with landscape genetics. Ecology 2010, 91, 252–261. [Google Scholar] [CrossRef] [PubMed] [Green Version]
  26. Liaw, A.; Wiener, M. Classification and Regression by randomForest. R News 2002, 2, 18–22. [Google Scholar]
  27. Evans, J.S.; Murphy, M.A. rfUtilities: R Package Version 2.1-3. 2018. Available online: https://cran.r-project.org/package=rfUtilities (accessed on 2 April 2022).
  28. Kim, S. ppcor: Partial and Semi-Partial (Part) Correlation. R Package Version 1.1. 2015. Available online: https://CRAN.R-project.org/package=ppcor (accessed on 28 July 2022).
  29. R Core Team. R: A Language and Environment for Statistical Computing; R Foundation for Statistical Computing: Vienna, Austria, 2022; Available online: https://www.R-project.org/ (accessed on 2 April 2022).
  30. Wickham, H. Ggplot2: Elegant Graphics for Data Analysis; Springer: New York, NY, USA, 2016. [Google Scholar]
  31. Kassambara, A. Ggpubr: ‘ggplot2’ Based Publication Ready Plots. R Package Version 0.1.6. 2017. Available online: https://CRAN.R-project.org/package=ggpubr (accessed on 2 April 2022).
  32. Urbanek, S.; Horner, J. Cairo: R Graphics Device Using Cairo Graphics Library for Creating High-Quality Bitmap (PNG, JPEG, TIFF), Vector (PDF, SVG, PostScript) and Display (X11 and Win32) Output. R Package Version 1.5-15. 2022. Available online: https://www.rforge.net/Cairo/ (accessed on 2 April 2022).
  33. Wickham, H.; Francois, R.; Henry, L.; Müller, K. dplyr: A Grammar of Data Manipulation. R Package Version 0.7.5. 2018. Available online: https://CRAN.R-project.org/package=dplyr (accessed on 2 April 2022).
  34. Bivand, R.; Lewin-Koh, N. maptools: Tools for Handling Spatial Objects. R Package Version 1.1-4. 2022. Available online: https://CRAN.R-project.org/package=maptools (accessed on 2 April 2022).
  35. Pebesma, E.J.; Bivand, R.S. Classes and methods for spatial data in R. R News 2005, 5, 9–13. [Google Scholar]
  36. Bivand, R.; Keitt, T.; Rowlingson, B. rgdal: Bindings for the ‘Geospatial’ Data Abstraction Library. R Package Version 1.5-31. 2022. Available online: https://CRAN.R-project.org/package=rgdal (accessed on 2 April 2022).
  37. Megonigal, J.P.; Guenther, A.B. Methane emissions from upland forest soils and vegetation. Tree Physiol. 2008, 28, 491–498. [Google Scholar] [CrossRef] [PubMed] [Green Version]
  38. Wen, Z.; Xu, W.; Li, Q.; Han, M.; Tang, A.; Zhang, Y.; Luo, X.; Shen, J.; Wang, W.; Li, K.; et al. Changes of nitrogen deposition in China from 1980 to 2018. Environ. Int. 2020, 144, 106022. [Google Scholar] [CrossRef] [PubMed]
  39. Yu, G.; Chen, Z.; Piao, S.; Peng, C.; Ciais, P.; Wang, Q.; Li, X.; Zhu, X. High carbon dioxide uptake by subtropical forest ecosystems in the East Asian monsoon region. Proc. Natl. Acad. Sci. USA 2014, 111, 4910–4915. [Google Scholar] [CrossRef] [PubMed] [Green Version]
  40. Zhang, L.; Yuan, F.; Bai, J.; Duan, H.; Gu, X.; Hou, L.; Huang, Y.; Yang, M.; He, J.-S.; Zhang, Z.; et al. Phosphorus alleviation of nitrogen-suppressed methane sink in global grasslands. Ecol. Lett. 2020, 23, 821–830. [Google Scholar] [CrossRef]
  41. Yang, X.; Wang, C.; Xu, K. Response of soil CH4 fluxes to stimulated nitrogen deposition in a temperate deciduous forest in northern China: A 5-year nitrogen addition experiment. Eur. J. Soil Biol. 2017, 82, 43–49. [Google Scholar] [CrossRef]
  42. Carlsen, H.N.; Joergensen, L.; Degn, H. Inhibition by ammonia of methane utilization in Methylococcus capsulatus (Bath). Appl. Microbiol. Biotechnol. 1991, 35, 124–127. [Google Scholar] [CrossRef]
  43. Nyerges, G.; Stein, L.Y. Ammonia cometabolism and product inhibition vary considerably among species of methanotrophic bacteria. FEMS Microbiol. Lett. 2009, 297, 131–136. [Google Scholar] [CrossRef] [Green Version]
  44. Hu, S.; Zeng, R.J.; Keller, J.; Lant, P.A.; Yuan, Z. Effect of nitrate and nitrite on the selection of microorganisms in the denitrifying anaerobic methane oxidation process. Environ. Microbiol. Rep. 2011, 3, 315–319. [Google Scholar] [CrossRef] [PubMed]
  45. Fan, J.; Luo, R.; McConkey, B.G.; Ziadi, N. Effects of nitrogen deposition and litter layer management on soil CO2, N2O, and CH4 emissions in a subtropical pine forestland. Sci. Rep. 2020, 10, 8959. [Google Scholar] [CrossRef] [PubMed]
  46. Walkiewicz, A.; Rafalska, A.; Bulak, P.; Bieganowski, A.; Osborne, B. How Can Litter Modify the Fluxes of CO2 and CH4 from Forest Soils? A Mini-Review. Forests 2021, 12, 1276. [Google Scholar]
  47. Dijkstra, F.A.; Morgan, J.A.; von Fischer, J.C.; Follett, R.F. Elevated CO2 and warming effects on CH4 uptake in a semiarid grassland below optimum soil moisture. J. Geophys. Res. Biogeosci. 2011, 116, G01007. [Google Scholar] [CrossRef]
  48. Khokhar, N.H.; Park, J.-W. Precipitation Decreases Methane Uptake in a Temperate Deciduous Forest. J. Soil Groundw. Environ. 2019, 24, 24–34. [Google Scholar]
  49. Yue, P.; Zuo, X.; Li, K.; Li, X.; Wang, S.; Misselbrook, T. Precipitation changes regulate the annual methane uptake in a temperate desert steppe. Sci. Total Environ. 2022, 804, 150172. [Google Scholar] [CrossRef] [PubMed]
  50. Oertel, C.; Matschullat, J.; Zurba, K.; Zimmermann, F.; Erasmi, S. Greenhouse gas emissions from soils—A review. Geochemistry 2016, 76, 327–352. [Google Scholar] [CrossRef] [Green Version]
  51. Von Fischer, J.C.; Butters, G.; Duchateau, P.C.; Thelwell, R.J.; Siller, R. In situ measures of methanotroph activity in upland soils: A reaction-diffusion model and field observation of water stress. J. Geophys. Res. Biogeosci. 2009, 114, G01015. [Google Scholar] [CrossRef] [Green Version]
  52. Ran, Y.; Li, X.; Cheng, G.; Zhang, T.; Wu, Q.; Jin, H.; Jin, R. Distribution of Permafrost in China: An Overview of Existing Permafrost Maps. Permafr. Periglac. Process. 2012, 23, 322–333. [Google Scholar] [CrossRef]
  53. Hu, J.; Guan, W.; Chen, H. Methane Emissions from Surface of Mangrove River on Hainan Island, China. Atmosphere 2021, 12, 1126. [Google Scholar] [CrossRef]
  54. Song, C.; Yan, B.; Wang, Y.; Wang, Y.; Lou, Y.; Zhao, Z. Fluxes of carbon dioxide and methane from swamp and impact factors in Sanjiang Plain, China. Chin. Sci. Bull. 2003, 48, 2749–2753. [Google Scholar] [CrossRef]
  55. Yang, M.; Geng, X.; Grace, J.; Lu, C.; Zhu, Y.; Zhou, Y.; Lei, G. Spatial and Seasonal CH4 Flux in the Littoral Zone of Miyun Reservoir near Beijing: The Effects of Water Level and Its Fluctuation. PLoS ONE 2014, 9, e94275. [Google Scholar] [CrossRef]
  56. Tang, W.; Xu, Y.J.; Ma, Y.; Maher, D.T.; Li, S. Hot spot of CH4 production and diffusive flux in rivers with high urbanization. Water Res. 2021, 204, 117624. [Google Scholar] [CrossRef]
  57. Schmitt, C.B.; Burgess, N.D.; Coad, L.; Belokurov, A.; Besançon, C.; Boisrobert, L.; Campbell, A.; Fish, L.; Gliddon, D.; Humphries, K.; et al. Global analysis of the protection status of the world’s forests. Biol. Conserv. 2009, 142, 2122–2130. [Google Scholar] [CrossRef]
  58. Rosentreter, J.A.; Borges, A.V.; Deemer, B.R.; Holgerson, M.A.; Liu, S.; Song, C.; Melack, J.; Raymond, P.A.; Duarte, C.M.; Allen, G.H.; et al. Half of global methane emissions come from highly variable aquatic ecosystem sources. Nat. Geosci. 2021, 14, 225–230. [Google Scholar] [CrossRef]
  59. Wang, L.; Li, C.; Dong, J.; Quan, Q.; Liu, J. Magnitudes and environmental drivers of greenhouse gas emissions from natural wetlands in China based on unbiased data. Environ. Sci. Pollut. Res. 2021, 28, 44973–44986. [Google Scholar] [CrossRef] [PubMed]
  60. Yu, G.; Jia, Y.; He, N.; Zhu, J.; Chen, Z.; Wang, Q.; Piao, S.; Liu, X.; He, H.; Guo, X.; et al. Stabilization of atmospheric nitrogen deposition in China over the past decade. Nat. Geosci. 2019, 12, 424–429. [Google Scholar] [CrossRef]
  61. Li, Q.; Peng, C.; Zhang, J.; Li, Y.; Song, X. Nitrogen addition decreases methane uptake caused by methanotroph and methanogen imbalances in a Moso bamboo forest. Sci. Rep. 2021, 11, 5578. [Google Scholar] [CrossRef]
  62. Wang, Y.; Cheng, S.; Fang, H.; Yu, G.; Xu, M.; Dang, X.; Li, L.; Wang, L. Simulated nitrogen deposition reduces CH4 uptake and increases N2O emission from a subtropical plantation forest soil in southern China. PLoS ONE 2014, 9, e93571. [Google Scholar] [CrossRef] [PubMed]
  63. Steudler, P.; Bowden, R.; Melillo, J.; Aber, J. Influence of nitrogen fertilization on methane uptake in temperate forest soils. Nature 1989, 341, 314–316. [Google Scholar] [CrossRef]
  64. Xinhua News Agency. Outline of the 14th Five-Year Plan (2021–2025) for National Economic and Social Development and Vision 2035 of the People’s Republic of China. 2021. Available online: http://www.gov.cn/xinwen/2021-03/13/content_5592681.htm (accessed on 2 June 2022).
  65. Conrad, R. Microbial Ecology of Methanogens and Methanotrophs. In Advances in Agronomy; Donald, L.S., Ed.; Academic Press: Cambridge, MA, USA, 2007; Volume 96, pp. 1–63. [Google Scholar]
  66. Serrano-Silva, N.; Sarria-Guzman, Y.; Dendooven, L.; Luna-Guido, M. Methanogenesis and Methanotrophy in Soil: A Review. Pedosphere 2014, 24, 291–307. [Google Scholar] [CrossRef]
  67. Hempel, S.; Saha, C.K.; Fiedler, M.; Berg, W.; Hansen, C.; Amon, B.; Amon, T. Non-linear temperature dependency of ammonia and methane emissions from a naturally ventilated dairy barn. Biosyst. Eng. 2016, 145, 10–21. [Google Scholar] [CrossRef] [Green Version]
  68. Van den Pol-van Dasselaar, A.; van Beusichem, M.L.; Oenema, O. Effects of soil moisture content and temperature on methane uptake by grasslands on sandy soils. Plant Soil 2004, 204, 213–222. [Google Scholar] [CrossRef]
  69. Castaldi, S.; Bertolini, T.; Nicolini, G.; Valentini, R. Soil Is a Net Source of Methane in Tropical African Forests. Forests 2020, 11, 1157. [Google Scholar] [CrossRef]
  70. China Meteorological Administration. Blue Book on Climate Change in China 2021; Science Press: Beijing, China, 2021. [Google Scholar]
Figure 1. Distribution of sampling points. (a) Geo-location of the sampling points; (b) Distribution of sampling points along mean annual temperature (MAT) and mean annual precipitation (MAP) gradients. CTc denotes cold temperate coniferous forest area, Tm denotes temperate coniferous and deciduous broad-leaved mixed forest area, Tg denotes temperate grassland area, WTd denotes warm temperate deciduous broad-leaved forest area, STd denotes subtropical evergreen broad-leaved forest area, and Tr denotes tropical monsoon rainforest and monsoon rainforest area. The areas without colors (a) are areas covered by grassland, meadow, and desert.
Forests 13 01270 g001
Figure 2. Spatial CH4 flux (mean ± SE) variation of forest soil across China. (a) CH4 flux of upland forest and wetland forest; (b) CH4 flux of upland forest in different vegetation zones; (c) CH4 flux of upland forest in different latitudinal zones; (d) CH4 flux of upland forest in different longitudinal zones. The numbers above or on bars are the sample size. The dashed black line is the mean CH4 flux of all upland forest sites. Positive values indicate CH4 uptake and negative values indicate CH4 loss from soil to air. See Figure 1 for the meanings of the abbreviations CTc, Tm, Tg, WTd, STd, and Tr. In (c,d), boxplots show 25th (Q1) and 75th (Q3) percentiles, and the horizontal lines within the boxes are the median. The whiskers are Q1 − 1.5 × IQR (interquartile range) and Q3 + 1.5 × IQR. Dotes are outlier values.
Forests 13 01270 g002
Figure 3. Long-term variation in the CH4 uptake (mean ± SE) of upland forest soil. (a) CH4 uptake variation from 1997 to 2020; (b) CH4 uptake of different periods; (c) long-term CH4 uptake variation of different vegetation zones; (d) long-term CH4 uptake variation of typical temperate forest in Changbai Mountain. The curves in (a,c,d) are loess regression lines with 95% confidence intervals. Dashed lines in (b) are the average CH4 uptake before and after 2015. Numbers on bars in (b) are sample size. The sample size for each year (a) in chronological order was 1, 3, 6, 10, 9, 16, 2, 15, 14, 14, 37, 33, 31, 9, 11, 8, 5, 8, 9, and 1. See Figure 1 for the meanings of the abbreviations CTc, Tm, Tg, WTd, STd, and Tr.
Forests 13 01270 g003
Figure 4. Importance of environmental factors in affecting upland forest soil CH4 uptake in China. The % Inc MSE indicates the percentage increase in the mean square error when factor values were replaced by random numbers. Var explained is a measure of how much variance in CH4 uptake is explained by the out-of-bag predictions using all 12 factors (i.e., 52% in this study). See Section 2.2 for the meanings of abbreviations.
Forests 13 01270 g004
Figure 5. Interannual environmental variation and relationships among CH4 uptake and environmental factors at the interannual scale. (af) Interannual variation of environmental factors; (gl) Relationships among CH4 uptake and environmental factors at the interannual scale. The curves in (af) are loess regression lines with 95% confidence intervals. Regional N deposition data were not available after 2015. The national average N deposition of China from 2011 to 2018 [38] is shown in small plots on the right of (df) to provide information on the change of N deposition after 2015. These data are not included in correlation analysis. R and p in (gl) denote correlation coefficients and p-values, respectively. Linear regression lines with 95% confidence intervals are shown. CH4 uptake and environmental parameters were averaged by years. One negative flux value was omitted from the analysis, and no significant correlations were observed between CH4 flux and the six factors when this negative value was included. See Section 2.2 for the meanings of abbreviations.
Forests 13 01270 g005
Table 1. Spearman correlations between zonal average CH4 uptake and environmental factors.
Environmental FactorsCorrelation Coefficientsp-Value
MAP−0.140.80
MAT0.370.50
SWC−0.260.66
TN−0.490.36
AN−0.94 *0.02
AP−0.540.30
AK−0.370.50
PH0.600.24
BD0.010.92
POR−0.310.56
DIN0.260.66
NH40.260.66
NO30.140.80
* indicates significant correlations at p < 0.05. See Section 2.2 for the meanings of abbreviations.
Table 2. Environmental data and flux of different vegetation zones.
ParametersAll DataVegetation Zones
MaxMinMean ± SECTc
(Mean ± SE)
Tm
(Mean ± SE)
Tg
(Mean ± SE)
WTd
(Mean ± SE)
STe
(Mean ± SE)
Tr
(Mean ± SE)
MAP (mm)2363.4 231.5 1095.4 ± 35.4427.8 ± 15.3668.3 ± 24.4358.3 ± 54.9571.5 ± 38.31398.3 ± 36.91711.5 ± 61.0
MAT (°C)25.1 −6.2 11.8 ± 0.6−5.2 ± 0.22.2 ± 0.25.0 ± 1.011.7 ± 0.617.7 ± 0.323.4 ± 0.2
SWC (mm)599.9 124.3 404.1 ± 6.5270.0 ± 5.0376.9 ± 11.4185.9 ± 23.4283.2 ± 6.7477 ± 5.2435.7 ± 11
SOM (g/100 g)22.7 0.7 4.4 ± 0.37.9 ± 0.45.0 ± 0.21.4 ± 0.42.7 ± 0.52.6 ± 0.12.0 ± 0.1
TN (g/100 g)0.7 0.0 0.2 ± 00.4 ± 0.00.2 ± 0.00.1 ± 0.00.1 ± 0.00.1 ± 0.00.1 ± 0.0
AN (mg/kg)340.3 32.6 156.4 ± 5.6279.4 ± 11.4241.5 ± 9.284.1 ± 19.277.2 ± 6.4109 ± 2.385.3 ± 4.4
TP (g/100 g)0.2 0.0 0.1 ± 00.10 ± 0.000.08 ± 0.000.06 ± 0.010.06 ± 0.000.05 ± 0.000.04 ± 0.00
AP (mg/kg)11.7 1.8 5.6 ± 0.29.9 ± 0.47.8 ± 0.23.1 ± 0.84.9 ± 0.13.9 ± 0.13.2 ± 0.4
TK (g/100 g)3.2 0.6 1.7 ± 02.2 ± 0.01.9 ± 0.01.9 ± 0.12.0 ± 0.01.5 ± 0.01.0 ± 0.0
AK (mg/kg)196.2 33.2 104 ± 3182.3 ± 4.6127.8 ± 3.5125.5 ± 21.494.5 ± 6.380.7 ± 2.357.4 ± 7.3
pH8.3 4.2 5.8 ± 0.15.6 ± 0.16.0 ± 0.18.3 ± 0.07.2 ± 0.35.7 ± 0.15.2 ± 0.0
BD (g/cm3)1.4 0.8 1.3 ± 01.3 ± 0.01.2 ± 0.01.3 ± 0.11.4 ± 0.01.3 ± 0.01.3 ± 0.0
POR (cm3/100 cm3)58.0 43.3 51.9 ± 0.251.8 ± 0.254.4 ± 0.352.6 ± 2.347.9 ± 0.652.1 ± 0.249.8 ± 0.3
GRAV (g/100 g)25.6 0.8 10.6 ± 0.412.9 ± 0.720.6 ± 0.84.5 ± 0.911.3 ± 1.68.3 ± 0.59.4 ± 0.3
DIN (kg N ha−1 yr−1)27.2 3.0 15.8 ± 0.56.6 ± 0.410.9 ± 0.213.4 ± 0.220.6 ± 0.920.3 ± 0.410.2 ± 0.8
NH4 (kg N ha−1 yr−1)18.9 1.1 9.4 ± 0.33.7 ± 0.45.8 ± 0.49.7 ± 0.412.1 ± 0.912.2 ± 0.35.9 ± 0.4
NO3 (kg N ha−1 yr−1)15.3 1.5 6.4 ± 0.22.9 ± 0.15 ± 0.23.7 ± 0.28.6 ± 0.28.1 ± 0.24.3 ± 0.4
CH4 uptake (g m−2 yr−1)1.79−0.830.24 ± 0.020.22 ± 0.050.23 ± 0.060.29 ± 0.050.46 ± 0.100.22 ± 0.030.26 ± 0.02
Environmental parameters are average values of the CH4 flux sampling points, not the average of entire vegetation zones. See Section 2.2 and Figure 1 for the meanings of abbreviations.
Publisher’s Note: MDPI stays neutral with regard to jurisdictional claims in published maps and institutional affiliations.

