Article

Enhancing Height Predictions of Brazilian Pine for Mixed, Uneven-Aged Forests Using Artificial Neural Networks

by
Emanuel Arnoni Costa
1,2,
André Felipe Hess
2,
César Augusto Guimarães Finger
1,
Cristine Tagliapietra Schons
1,
Danieli Regina Klein
2,
Lorena Oliveira Barbosa
3,
Geedre Adriano Borsoi
2,
Veraldo Liesenberg
2 and
Polyanna da Conceição Bispo
4,*
1
Graduate Program in Forest Engineering, Federal University of Santa Maria, Santa Maria 97105-900, Brazil
2
Department of Forest Engineering, Santa Catarina State University (UDESC), Lages 88520-000, Brazil
3
Graduate Program in Forest Engineering, Federal University of Lavras (UFLA), Lavras 37200-900, Brazil
4
Department of Geography, School of Environment, Education and Development, University of Manchester, Oxford Road, Manchester M13 9PL, UK
*
Author to whom correspondence should be addressed.
Forests 2022, 13(8), 1284; https://doi.org/10.3390/f13081284
Submission received: 1 July 2022 / Revised: 10 August 2022 / Accepted: 11 August 2022 / Published: 13 August 2022
(This article belongs to the Section Forest Inventory, Modeling and Remote Sensing)

Abstract

:
Artificial intelligence (AI) seeks to simulate the human ability to reason, make decisions, and solve problems. Several AI methodologies have been introduced in forestry to reduce costs and increase accuracy in estimates. We evaluate the performance of Artificial Neural Networks (ANN) in estimating the heights of Araucaria angustifolia (Bertol.) Kuntze (Brazilian pine) trees. The trees are growing in Uneven-aged Mixed Forests (UMF) in southern Brazil and are under different levels of competition. The dataset was divided into training and validation sets. Multi-layer Perceptron (MLP) networks were trained under different Data Normalization (DN) procedures, Neurons in the Hidden Layer (NHL), and Activation Functions (AF). The continuous input variables were diameter at breast height (DBH) and height at the base of the crown (HCB). As a categorical input variable, we consider the sociological position of the trees (dominant–SP1 = 1; codominant–SP2 = 2; and dominated–SP3 = 3), and the continuous output variable was the height (h). In the hidden layer, the number of neurons varied from 3 to 9. Results show that there is no influence of DN in the ANN accuracy. However, the increase in NHL above a certain level caused the model’s over-fitting. In this regard, around 6 neurons stood out, combined with logistic sigmoid AF in the intermediate layer and identity AF in the output layer. Considering the best selected network, the following values of statistical criteria were obtained for the training dataset (R2 = 0.84; RMSE = 1.36 m, and MAPE = 6.29) and for the validation dataset (R2 = 0.80; RMSE = 1.49 m, and MAPE = 6.53). The possibility of using categorical and numerical variables in the same modeling has been motivating the use of AI techniques in different forestry applications. The ANN presented generalization and consistency regarding biological realism. Therefore, we recommend caution when determining DN, amount of NHL, and using AF during modeling. We argue that such techniques show great potential for forest management procedures and are suggested in other similar environments.

1. Introduction

The Mixed Ombrophilous Forest (MOF) is characterized by the presence of Araucaria angustifolia (Bertol.) Kuntze. It is also the most abundant tree species in this particular ecosystem [1]. Furthermore, it constitutes the upper canopy strata with a dominant character in this vegetation type [2]. However, intensive and often indiscriminate harvesting from past decades culminated in a significant reduction of the original area of this forest. As a result, the MOF is considered one of the most threatened phytophysiognomy in Brazil [3], with only about 3% of its original forest formation [4].
In an attempt to conserve the araucaria species, forest management and sustainable wood use of this species are currently under several legal restrictions. The current scenario shows remnants of trees under high competition level, with stagnated growth, low natural regeneration rate, higher mortality, and a reduction in species diversity [5,6,7,8]. Therefore, incentives to promote the silviculture of the most relevant timber species of MOF and management practices are needed for the continuous development of araucaria in this forest formation [9,10]. Such initiatives may support future forest interventions rationally and sustainably. Furthermore, the timber resources of this specific species are comparable to other exotic species planted in the country’s southern region, such as loblolly pine and eucalyptus [9], and the species even shows great potential to be used for recovering degraded areas [10].
To provide valuable information for managing forests and species, accurate and timely information on current and future forest attributes is needed. In this sense, tree height is one of the most important variables for the quantitative assessment of forest stocks [11] and is commonly used in several silvicultural interventions and management procedures [12,13]. However, despite their importance, tree height measurements are not always available nor feasible, especially in tropical rain forests environments. Therefore, accurate allometric equations are required to infer height from easily measurable variables such as the trunk diameter at the breast height (DBH). Furthermore, such aspects are worth studying because the available H-D allometric equations show significant variations among forest types and environments [14].
First outlined by Otto [15], the term ”allometry” is the study of the relationship of body size to shape, physiology, and behavior in biology associated with differential growth rates of the parts of a living organism’s body. Tree allometry is represented by allometric equations in the form of regression models and reflects the empirical relationship between measurements of parameters that are easily obtained with those that are difficult to obtain [16]. In the literature, two- and three-parameter H-D functions exist [17]. However, simple models are particularly useful in even-aged stands with a small number of species in homogenous stands and specific site conditions. However, mixed forests require more complex modeling approaches that rely on DBH combined with additional stands and tree characteristics, such as the height at the base of the crown (HCB) and sociological position. Therefore, several studies have been evolving in applying statistical techniques for modeling attributes in forest science. Among them, we can mention, for example, the approach of Mixed Models (MM) and Artificial Neural Networks (ANN). With MM, it is possible to increase the accuracy of the estimates due to the possibility of modeling the structure of the error variance and covariance matrix. In addition, some studies use MM to express hypsometric relationships [18,19,20,21,22,23].
ANN is one of the most common modeling techniques with a highly interconnected structure like a human brain system that emulates the operations and connectivity of biological neurons [24,25]. There are complex relationships between tree dendrometrical dimensions to biomass in the natural forest ecosystems. Since the nature of such relationships in the natural ecosystems is unknowable, the ANN models are expected to be more accurate than traditional regression models [26]. Additionally, using ANN allows us to synthesize information in a single network, being advantageous when working with a large amount of data from different locations, genotypes, climatic conditions, site index, and silvicultural interventions, among other characteristics of the site that influence the tree’s growth. With ANN, continuous and categorical variables can be used simultaneously in a single trained network, reaching accurate estimates.
The use of ANN as an estimate method considering biological relationships has shown to be promising in the modeling of tree volume [27,28], diameter distribution [29], stem shape [30], and productivity [31], with emphasis on species such as eucalyptus and teak in the context of Brazil. Additionally, some studies have demonstrated the applicability of ANN in modeling tree height in even-aged forests [30] and uneven-aged forests [32,33]. Other ANN investigations have also been applied in MOF to estimate bark thickness [34] and tree increment [35] of Araucaria angustifolia. However, further investigations are still needed to reinforce some of these findings and expand the AI applicability, especially regarding tree height estimates and encompassing these estimates from data acquired over different study areas.
The application of models that describe the ability of tree height growth reduces the cost and time of measurement in the field during forest inventories. Normally, the height of a group of trees inside the sample plot is measured. Thereafter, this variable is estimated for the other remaining trees that were not measured due to cost and time factors. For these reasons, developing suitable height models may be considered one of the most important elements in forest design and monitoring [36]. Furthermore, the height allows us to evaluate the regeneration of the species, the productive capacity, and the forest dynamics.
Sophisticated statistical techniques allow obtaining, in some cases, greater precision and accuracy of the estimates, implying better prognoses of forest resources. The ANNs have greater generalizability, less susceptibility to noise and outliers, and the ability to model non-linear relations unknown to the modeler, among other features [37], compared to the regression models. However, determining the optimal architecture of ANNs plays a decisive role in increasing the accuracy of the prediction of the networks. The choice of activation functions (AF) influences the complexity and performance of ANN related to the application being ascertained. Özkan and Erbek [38], for an image classification problem, found better performance for tangent hyperbolic AF than Logistic Sigmoid AF, attributing this to faster convergence of the learning algorithms associated with this function. For Carrijo et al. [39], combining the tangent function in the hidden layer and the sigmoidal function in the output layer presents the best results in a study on predicting energy potential in Brazilian savanna woodland area.
Data normalization (DN) is also an essential preprocessing step in using ANN. It is a scaling technique that standardizes the values of all variables from dynamic range to a specific range, and it has been stated that the application of relevant normalization techniques can enhance the neural network training, minimizing the bias in the ANN at the same time it speeds up the process involving the learning of the features covered in the same scale [40,41].
The general objective of this research is to evaluate the performance of ANN to estimate the height of Araucaria angustifolia (Bertol.) Kuntze trees. Specifically, we aim to: i. evaluate the influence of different DN techniques on network training and verify the influence on increasing NHL; ii. test different AF and to select the best ANN to estimate the height of araucaria; and iii. compare the ANN estimate with current developed MM methods for the selected tree species.

2. Materials and Methods

2.1. Study Areas

The study was conducted in areas with a natural predominance of Araucaria angustifolia (Bertol.) Kuntze in MOF (See Figures S1 and S2 in Supplementary Material), located in the municipalities of Lages (LGS) and São José do Cerrito (SJC), from the state of Santa Catarina (SC), and São Francisco de Paula (SFP) in the state of Rio Grande do Sul (RS). All three study areas are located in the southern region of Brazil (Figure 1).
The climate of these locations, according to the Köppen classification, is humid subtropical, with no dry season, and with temperate summers (Cfb) (Table 1) [42].

2.2. Data

The trees were measured by using the intentional sampling in the natural forest, also known as a non-probabilistic sampling method, which, when used with common sense by the researcher, allows us to obtain a representative sample with a wide variation of the studied phenomenon, saving time and financial resources [43]. In this sense, the sampling contemplated the diameter amplitude of the species in the evaluated sites. A more detailed procedure of the proposed method was based on previous studies carried out by Costa et al. [34], Costa et al. [44], Hess et al. [45], and Barbosa et al. [46]. In other words, it follows the pattern of diameter distribution between the classes.
Each tree’s diameter at breast height (DBH) was measured with a diametric tape and the height (h) with the Vertex IV hypsometer. In addition, the height at the base of the crown (HCB) variable was additionally measured. This variable is much easier to identify and quantify in field surveys of the species compared to the total height. This is due to the A. angustifolia’s characteristic of occupying the upper stratum of the canopy, making it difficult to see the uppermost portion of its crown, mainly when the forest contains a high density of trees, which is the case of most MOF in southern Brazil. On the other hand, the lower branches (base of the crown) are easily visualized, allowing us to obtain the HBC with greater precision and accuracy, with the benefit of this variable presenting a high correlation with the total height. Complementarily, the sociological position of trees in the forest was classified as: dominant (SP1): trees located in the upper stratum with high exposure of the crown to light; codominant (SP2): trees located in the intermediate stratum with an average exposure of the crown to light; and dominated (SP3): trees located in the lower stratum with low exposure of the crown to light [47].
The data were divided randomly into two sets: (i) 75% used for training set [number of trees: LGS = 409; SJC = 84; SFP = 110]; and (ii) 25% used for the test/validation set [number of trees: LGS = 136; SJC = 28; SFP = 37]. A summary of the descriptive statistical dendrometric variables in training and validation datasets is shown in Table 2. A similar concept and strategy of splitting the dataset into training and validation datasets using ANN were also applied by Barbosa et al. [35], Bourque et al. [48], and Salehnasab et al. [49].

2.3. Modeling Using Artificial Neural Networks (ANNs)

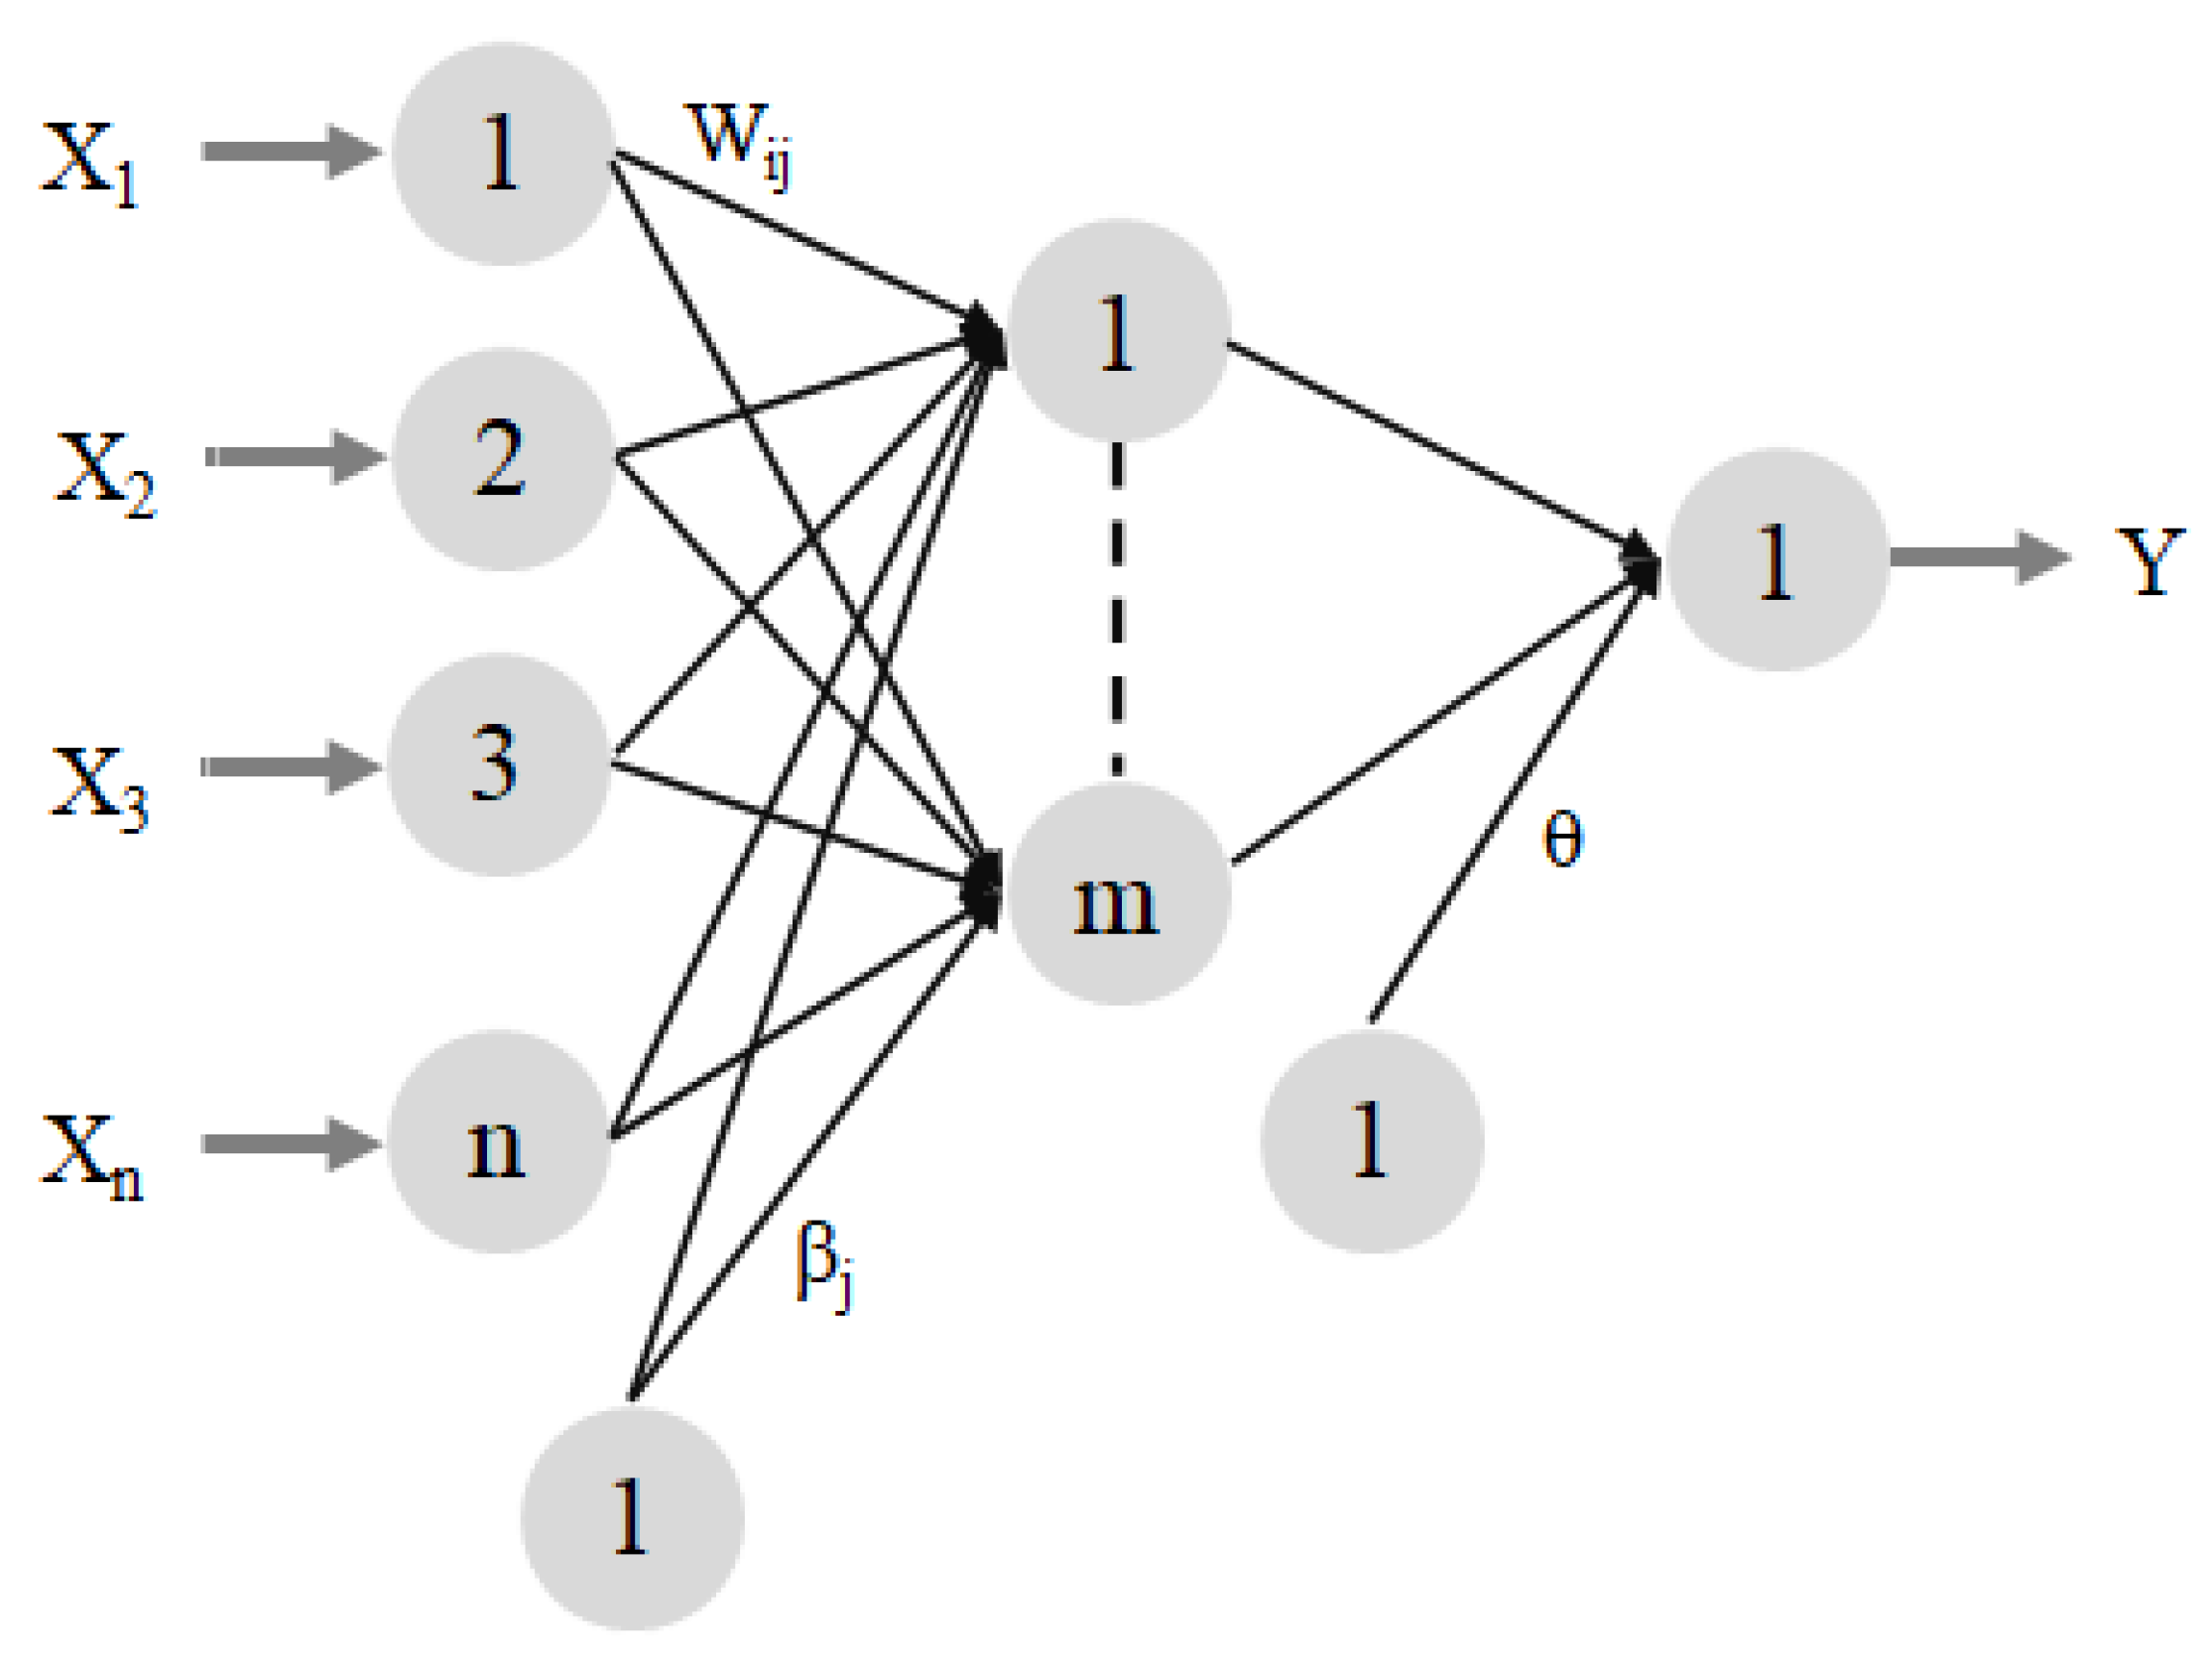
ANNs, simulating the functioning of the human brain, are of great importance in classification, prediction, optimization, and pattern recognition. Interestingly, determining the optimal architecture of ANNs plays a decisive role in increasing the prediction accuracy [50,51,52]. Therefore, Multi-layer Perceptron (MLP), the most widely used ANN type for prediction (Figure 2) with only one hidden layer (m), was used to train the data [53], starting from the Data Normalization (DN), according to Equation (1):
  X e q u a l   =       ( X i X m i n i m u m ) . ( U L I L ) ( X m a x i m u m X m i n i m u m ) + I L    
where: Xi is the value to be equalized, X m i n i m u m is the lowest value of the dataset, X m a x i m u m is the highest dataset value, UL is the upper limit and IL is the inferior limit.
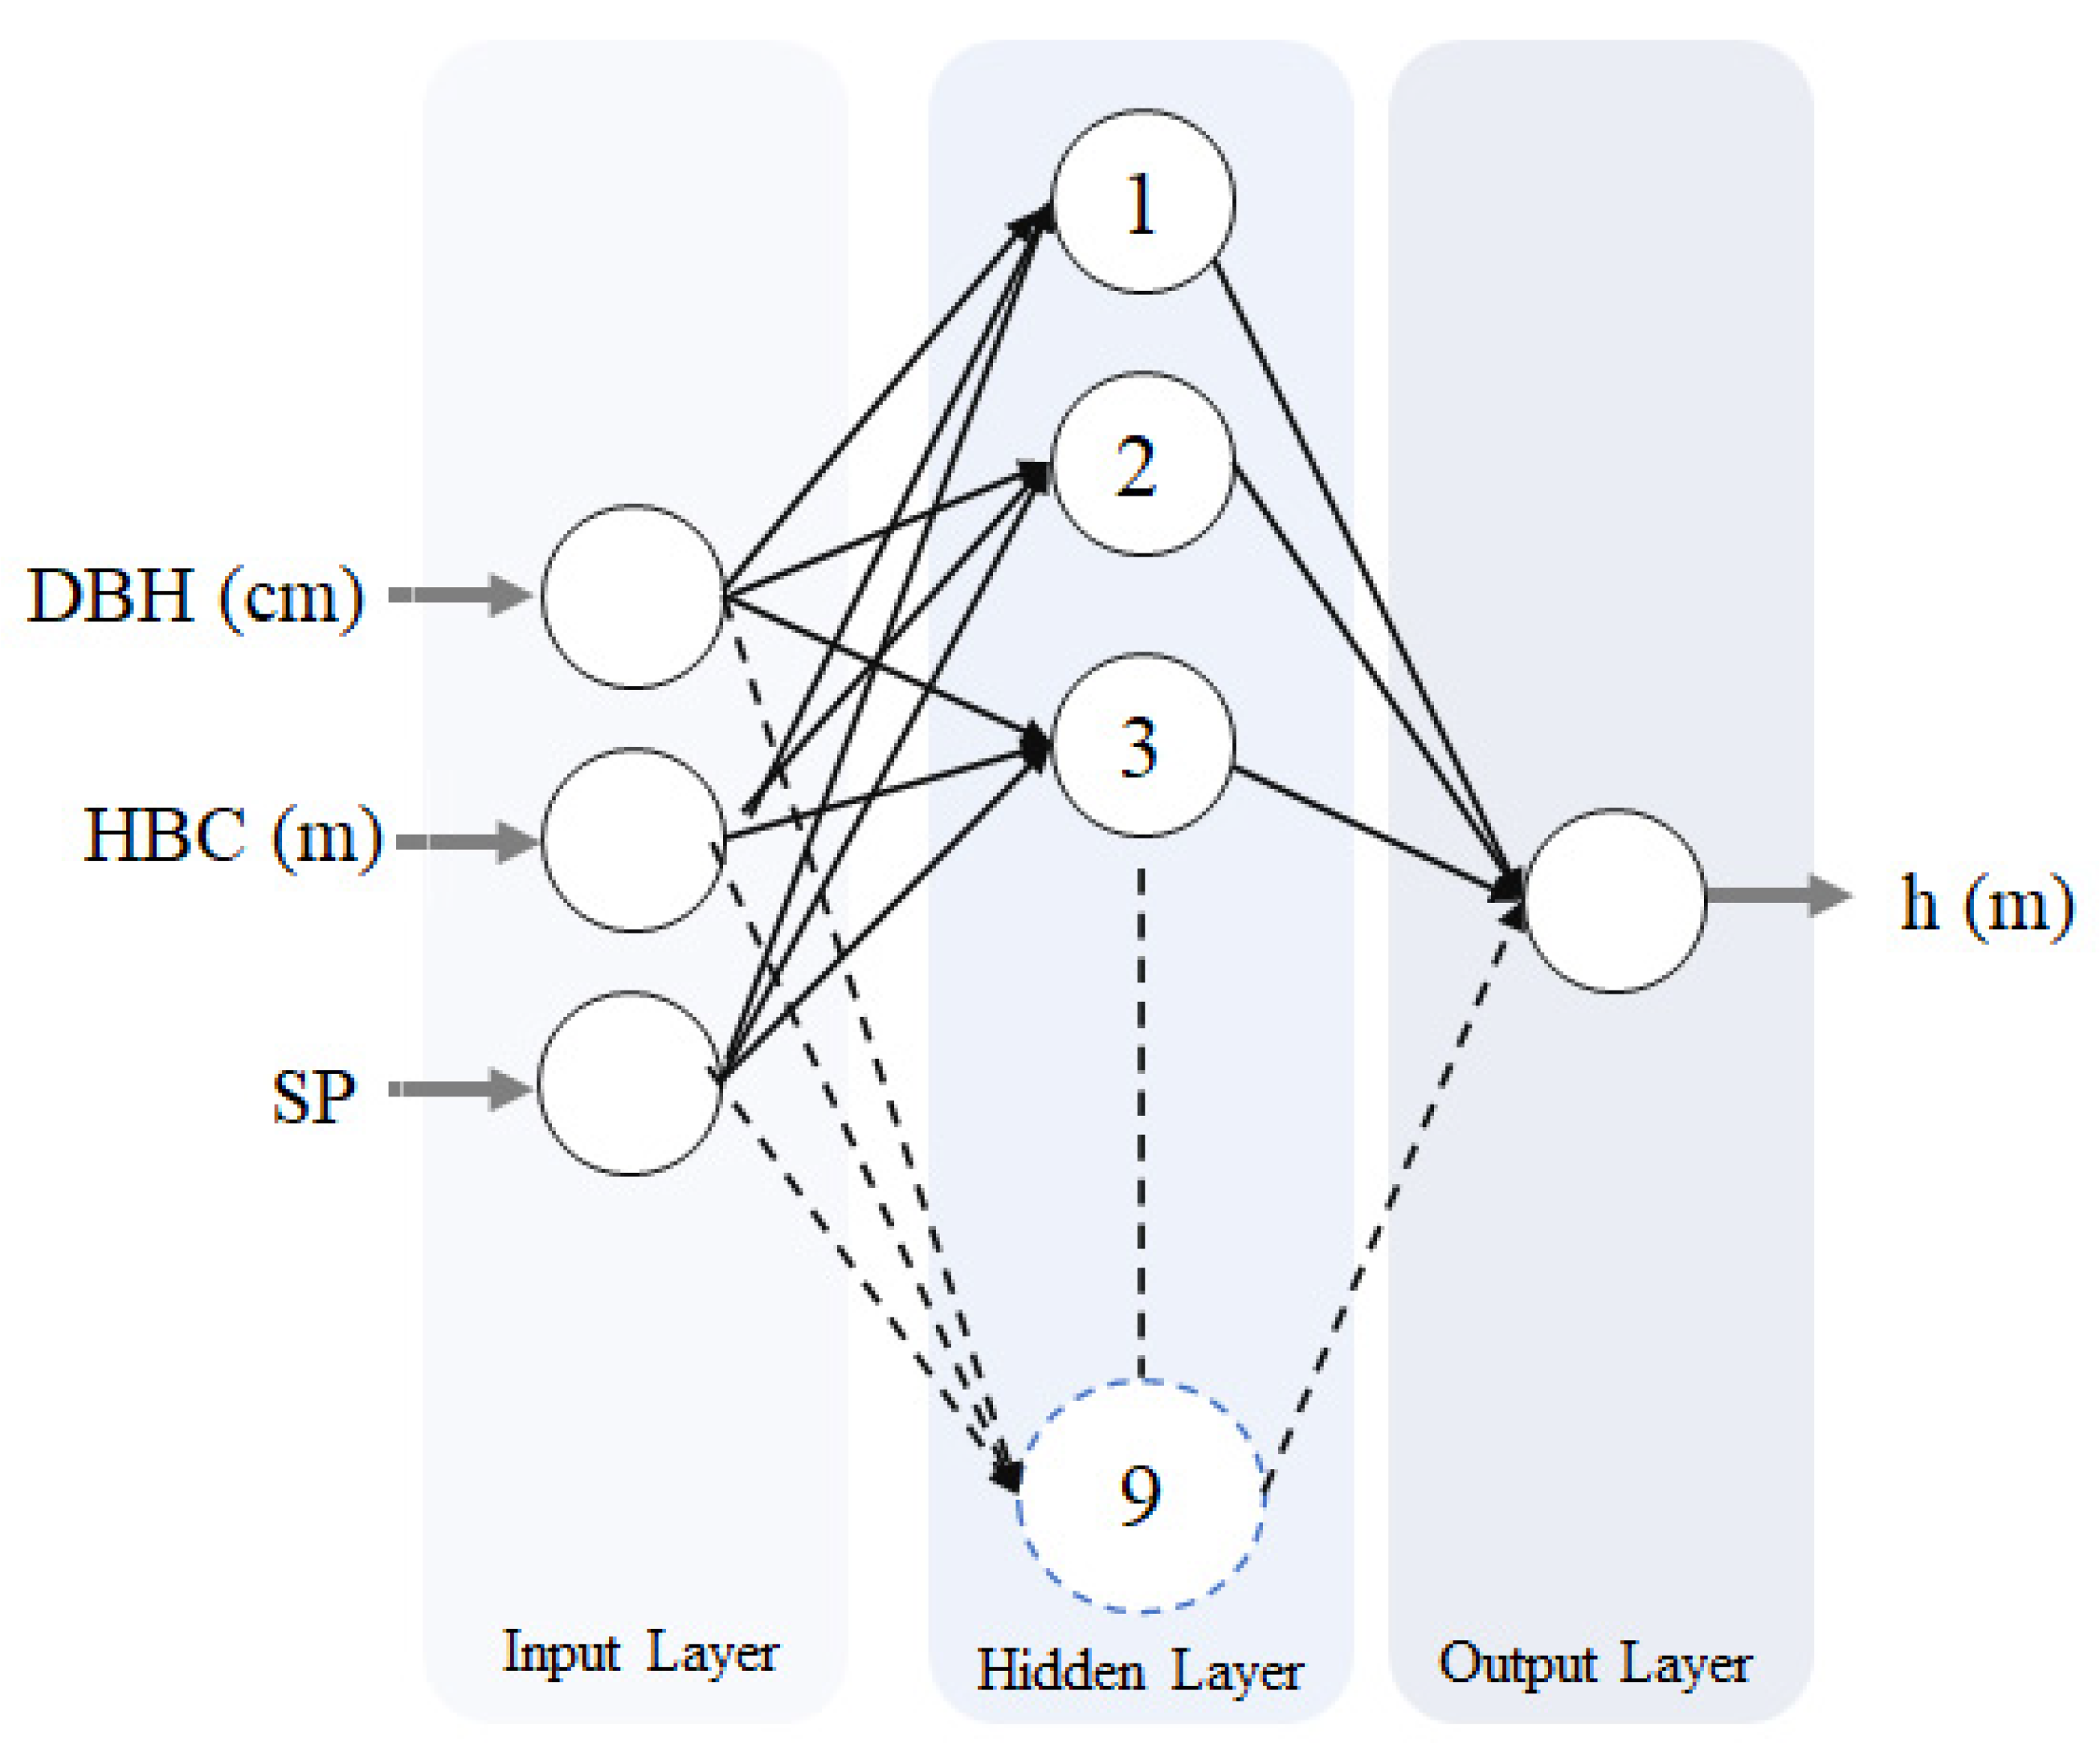
This equalization was used to prevent variables of greater magnitude from having a greater influence on the result [53]. The networks presented the following architectures: 3-m-1, with “m” being the number of Neurons in the Hidden Layer (NHL). The continuous input variables used were: diameter at breast height (DBH) and height at the base of the crown (HCB), and the categorical input variable was the sociological position of the trees (SP1 = 1; SP2 = 2; and SP3 = 3). The continuous output variable was the height (h) of the A. angustifolia. In the hidden layer (m), the number of neurons varied from 3 to 9 (Figure 3).
Considering that the activation functions of neurons can highly influence the behavior of the ANN, i.e., how they are interconnected and the weights of those interconnections [38], identifying a proper activation function could provide a better ability to map data in dimensions, increasing the expression ability of a neural network model [54]. While linear functions are particularly used in input and output layers, non-linear activation functions can be used for hidden and output layers. This non-linear character is very important for discriminating the feature space’s complex relationships [38]. In this sense, a large number of possible activation functions have been described in the literature [54,55,56]. In the present study, we selected the most common non-linear activation functions logistic sigmoid [values in the range from 0 to 1] and hyperbolic tangent [values in the range from −1 to 1] to be tested in the hidden layer [25,38,57], and the identity activation function was applied in the output layer [25,57].
In training, the ideal number of neurons was set at the Fletcher-Gloss method [58], given by Equation (2):
  ( 2   .   n + n 2 )   n 1 ( 2   .   n + 1 )    
where n is the number of network inputs, n 1 is the number of neurons in the hidden layer and n 2 is the number of neurons in the output layer.
The ANN prediction is possible through the mathematical expression described for the output of the MLP described in Figure 3, as follows by Equation (3):
  Y = g ( θ + j = 1 m v j [ i = 1 n f ( w ij X i + β j ) ] )  
where: Y = estimation of the value of the dependent variable; Xi = input value of the i-th independent variable; wij = connection weight between the i-th input neuron and the j-th neuron of the hidden layer; βj = bias value of the j-th neuron of the hidden layer; vj = connection weight between the j-th neuron of the hidden layer and the output neuron; θ = bias value of the output neuron; f(.) = hidden layer activation function; and g(.) = output activation function.
ANN was trained according to the DN evaluated, AF types, and NHL variation. The maximum amount of NHL defined by the method in Equation (2) sought to avoid memorizing the input data (over-fitting) or extracting insufficient information in training (under-fitting). For the training of the ANNs, the neuralnet library was used [59] and is available in R version 3.4.4. The hyperparameters were selected by default.

2.4. Statistical Criteria

The goodness-of-fit criteria used to assess the ANN performance was based on the determination coefficient (R2; Equation (4)), the root-mean-square error (RMSE; Equation (5)), and the mean absolute error (MAE; Equation (6)), the three most common statistics for model assessment. The mean absolute percentage error (MAPE; Equation (7)) was also assessed to express relative errors in addition to the t-test between observed and estimated data. Graphical analysis of residues provided a better assessment of their distribution. All statistical analyses were performed using R:
  R 2 = 1 i = 1 n ( Y i Y ^ i ) 2 i = 1 n ( Y i Y ¯ ) 2  
R M S E = i = 1 n ( Y i Y ^ i ) 2 n  
  M A E =   1 n   i = 1 n | Y i Y ^ i |
    M A P E = 1 n   ( i = 1 n [ | Y i Y ^ i Y i | ] ) × 100
where: Y i is the observed value; Y ^ i is the estimated value; Y is the mean of the observed values; and n , the number of observations.

2.5. Comparison with Other Approaches

In order to test the performance superiority of ANNs in relation to other traditional estimation methods, the generated ANN, based on the validation dataset, had its precision and accuracy in terms of total height compared with different approaches proposed by Ökzan and Erbek [38], which are: Non-linear Regression (NL); Linear Regression with Dummy Variables (LDV); and Principal Component Analysis with Mixed Non-linear Regression (PC-MNLR).

3. Results

Considering the variations in data normalization (DN), activation functions (AF), and number of Neurons in the Hidden Layer (NHL), the goodness-of-fit of the best networks trained for each structure are shown in Table 3. All investigated architectures presented a statistic R2 equal or superior to 0.83 for the training set, demonstrating the accuracy of height adjustment of A. angustifolia from ANN, given the context of a native uneven-aged mixed forest. These results also show the contribution of the input variables HCB and SP and the variable DBH in describing the species’ height variations, especially considering the heterogeneous nature of the trees in these types of forests in terms of dimensions and ages. The analysis of the validation set confirms these statements, also presenting accurate values in terms of predictive capacity. According to the t-test, none of the estimates for the tested ANN structures differed statistically from the observed values (p > 0.05), demonstrating the possibility of being applied for the predictions of A. angustifolia height.
Considering the variations in NHL, we observed that around 6 neurons stood out as the most suitable ANN architecture, considering the results of precision measures in both training and validation datasets (Table 3).
Adding more neurons in the hidden layer leads to an additional increase of R2 and error reduction may occur for the training dataset. It is observed that for the validation dataset, the performance starts to decrease considerably. This indicates the possibility of over-fitting the model by memorizing properties of the training set that do not serve them well on the validation set, which leads to a reduction of the generalization ability among similar input-output patterns [37,57]. This effect of the NLH was observed regardless of the AF used and the type of DN.
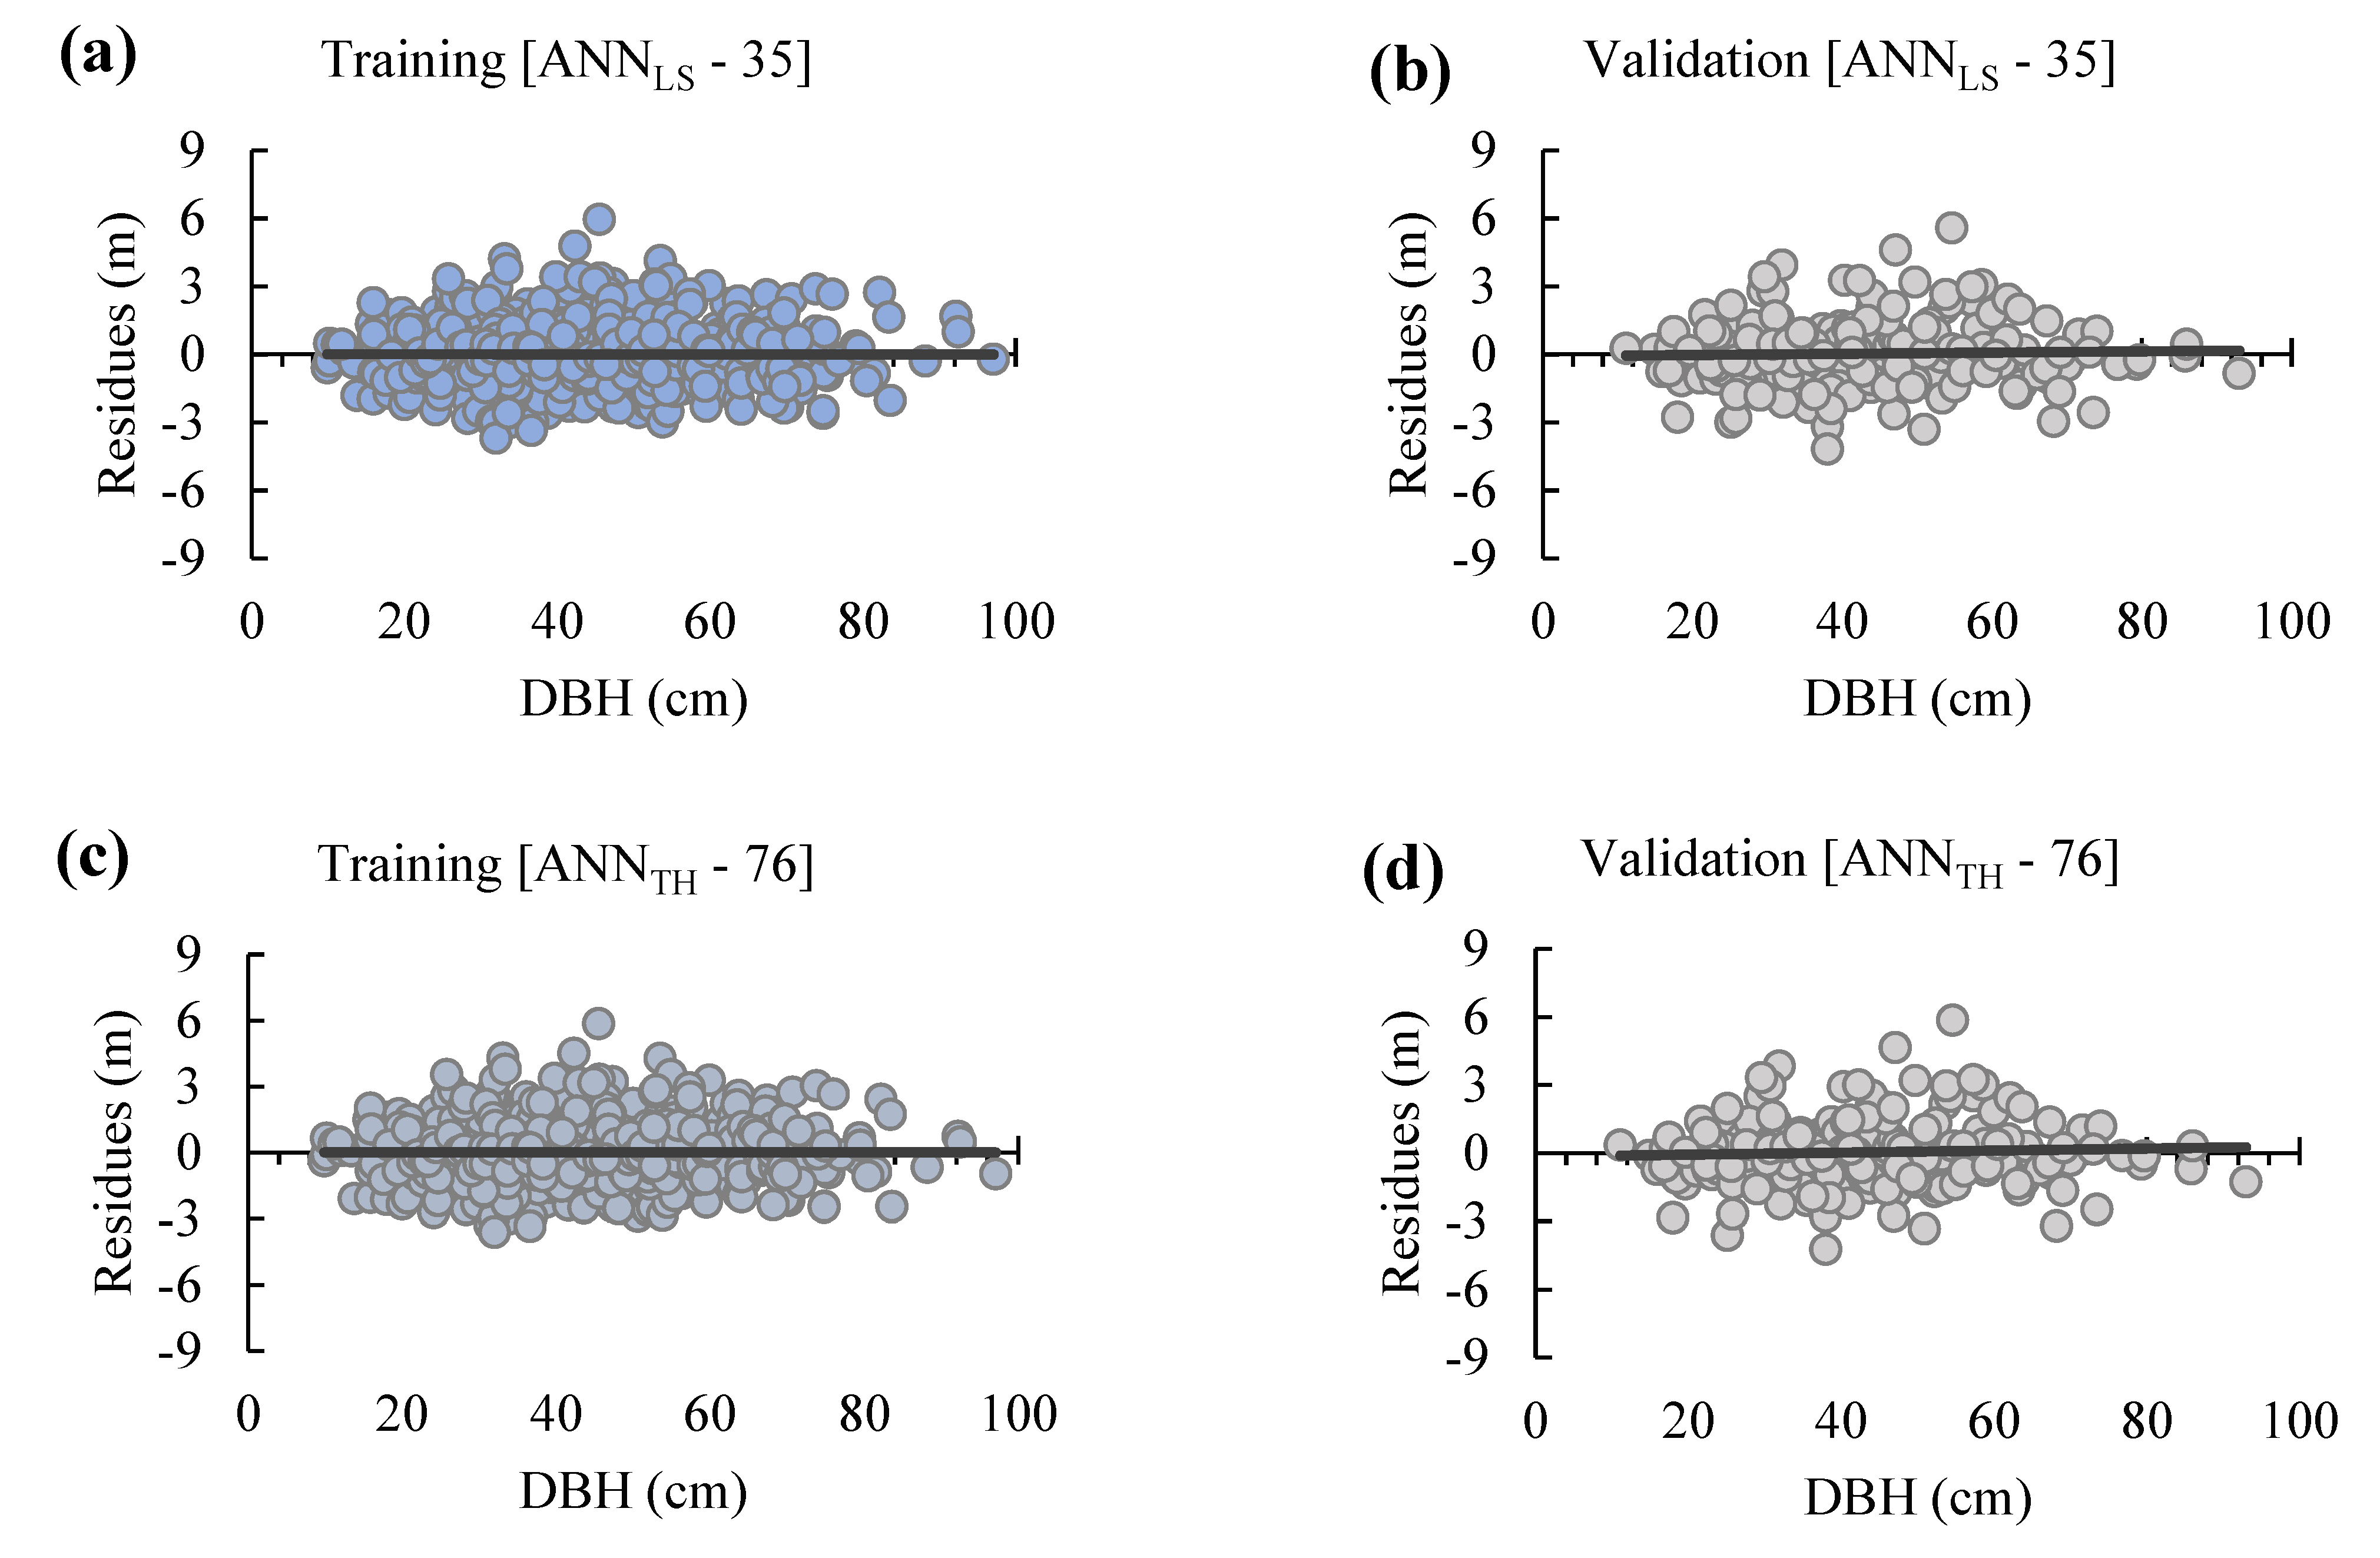
The graphical residual distribution of the best-trained networks considering the number of 6 neurons in the hidden layer is presented in Figure 4 and is based on both the Logistic Sigmoid (LS) through DN [0, 1] and the Tangent Hyperbolic (TH) AF through DN [−1, 1] (ANNLS-35 and ANNTH-76). A good residual dispersion is evidenced, by proportionality, among over-estimated and under-estimated values across all diametric classes. Furthermore, based on the dataset evaluated in our study, AF variations (LS and TH) showed quite a similar accuracy and residues distribution.
Considering the similar behavior of the LS and TH activation functions (Figure 4), and that there were no significant differences between the observed and estimated values for any of these variations (Table 3, t-test), the application of the AF is recommended. Therefore, the LS function was selected since it has more recurrent use [60,61]. Thus, the parameters of ANNLS–35, represented by the synaptic weights and biases values, are presented in Table 4. The synaptic weights represent, in synthesis, the network memory from experience acquired through the presentations of the patterns [62]. Each symbology of Table 4 is described in Equation (3), in association with the output of the MLP.
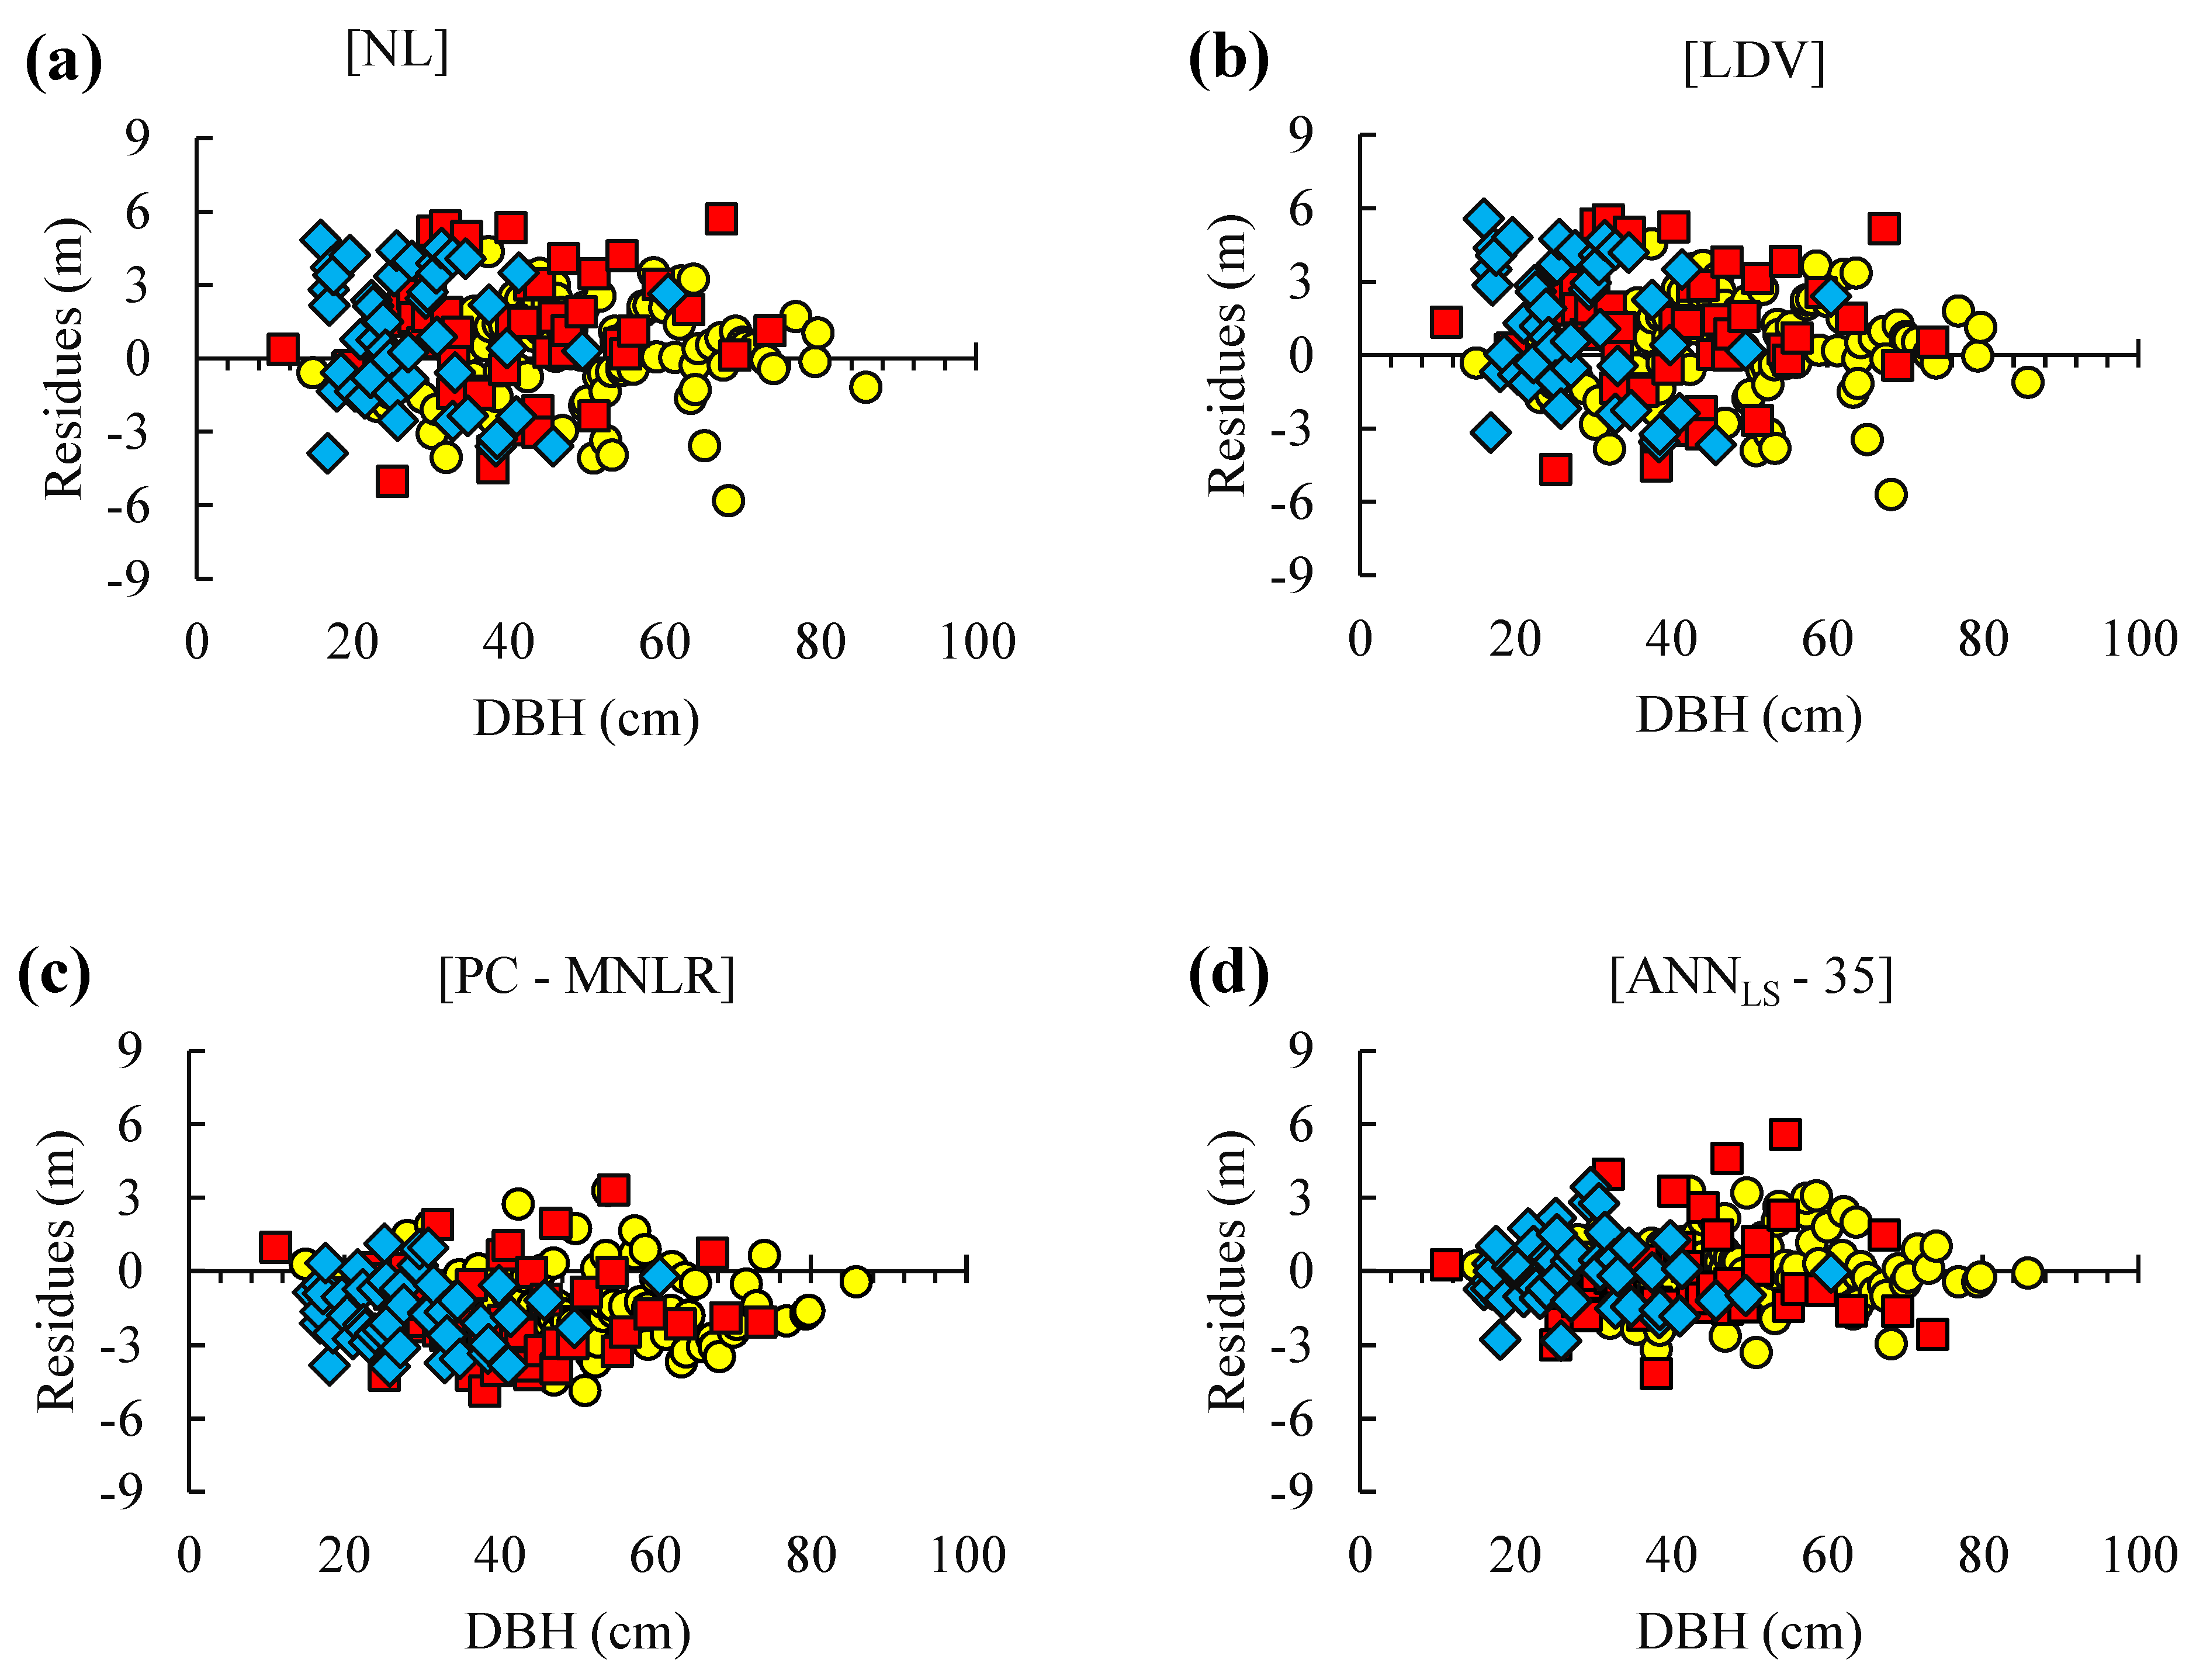
In Table 5, based on the validation set, the ANN generated in the present can be compared with different approaches proposed by Costa et al. [63], which are: Non-linear Regression (NL); Linear Regression with Dummy Variables (LDV); and Principal Component Analysis with Mixed Non-linear Regression (PC-MNLR). In summary, lower values indicate better estimates when analyzing the RMSE, MAE, and MAPE results. As a result, the ANN is shown to be highly superior when compared to all other methods. Comparing the residues of ANNLS-35 with NL-SP1, SP2, and SP3, and independent regressions for each social position, we notice that there is an apparent and significant reduction in the dispersion of residues in dominant–SP1 (yellow color), codominant–SP2 (red color), and dominated–SP3 (blue color). Furthermore, the mean absolute percentage error (MAPE) presented a reduction of up to around 8.4% that can be obtained through the application of ANN in relation to the traditional approach (NL-SP3), and up to 4%–5% in relation to LDV and MM.
In practice, this represents the differences between these methods of around 0.46–1.25 m for height estimates (RMSE), expressing, therefore, a very considerable discrepancy in the quantification of the tree’s species, which demonstrates the undeniable potential of ANN techniques if we consider all of the optimal criteria in its structuring. Furthermore, the graphic distribution of residues reinforces this observation, demonstrating a more uniform residual distribution for ANN when compared to other methods (Figure 5).

4. Discussion

In this study, using the ANN technique, different combinations of DN, AF, and NHL were evaluated in relation to their effectiveness in estimating the height of A. angustifolia trees. Unfortunately, measuring the total height in uneven-aged mixed forests is known to be difficult, mainly due to the challenge of locating the trees inside closed canopies due to visual obstructions, which can lead to high measurement errors [11,32,64]. Therefore, finding alternative ways of estimating this variable is of great significance.
In this sense, in comparison to the total height, the HCB is a more accessible variable since it represents the lower portion of the canopy and, thus, is less likely to be obstructed or misinterpreted. The diameter, a variable highly related to the total height, offers significant assistance for estimating heights in heterogeneous forests, as proven by the accurate results of our study. Additionally, the possibility of including quantitative variables (DBH and HCB) and categorical variables (SP) in the same modeling was made possible due to the use of ANN in this study. The effect of the sociological position variable on the height description curve of the species A. angustifolia was previously proven by studies conducted in southern Brazil [21,47]. In summary, this variable does not require great sampling effort and brings important contributions to the model.
Another advantage of applying ANN is the ability to model complex and non-linear interactive relationships between predictor and response variables without statistical assumptions and predetermined mathematical equations [65]. In the case of Multi-layer Perceptron ANN, the model consists of neurons that contain input, output, and hidden layers that act in concert to converge on a minimum-error solution [33]. Therefore, there are countless possibilities for structuring ANN, which influence the final results regarding the accuracy of the estimates.
The amount of NHL, for example, is considered a sensitive structural parameter in ANNs, as too few neurons can lead to an under-fitting of the target data and too many can lead to an over-fitting [66]. Moreover, over-fitted models tend to memorize all of the data, including unavoidable noise on the training set, instead of learning the discipline hidden behind the data [67]. That is why identifying the correct amount of NHL is important, allowing the generation of models that include important singular information on the pattern of the relationship that is being sought to the model, while maintaining its generalization capacity, that is, the capacity to produce adequate outputs for inputs that were not present during training (learning).
For the dataset evaluated in this study, the ideal number of neurons was around 6, from which the goodness-of-fit criteria of the validation set started to decline, representing a case of over-fitting. These results reinforce the need for the correct structuring of an MLP ANN considering the particularities of the investigation, especially in relation to the complexity of the relationship being represented and the model input variables.
The models’ intercept values are negative, which is not common in traditional height models. Skudnik et al. [16] highlight that an important difference between the traditional H-D curves and ANN are the intercept values, which are strictly 0 for all traditional H-D curves, while for ANN, the y- and x-intercepts can be positive or negative. The main reason for this is the absence of tree height measurements for trees below the DBH measurement threshold. Therefore, ANN lacks the proper intercept assumption and should not be used to model tree heights with diameters below the DBH measurement threshold [32,33,34,35].
In our study, both the TH and the LS-assessed AF present a similar behavior, in the training and validation of the height data of A. angustifolia trees, with satisfactory accuracy, being suitable to represent the modeled biological relationship. Furthermore, despite the importance reported by other authors in relation to the NP process, during the preprocessing step [34,35] in our study, no significant differences were observed between the performance of the intervals [0, 1] and [−1, 1]. However, these differences are expected to become more apparent in more complex datasets, especially when working with a greater number of variables of different natures.
Over the years, neural networks have often been accused of being a “black box” which hides the relationship between inputs and outputs in the neurons’ weight of its hidden layers [68,69]. This context reinforces the importance of assigning meanings to synaptic weights and biases of the ANN as shown in Table 4, analogous to the parameters of a model, for a clear understanding of the problem in question and the possibility of applying the ANN generated in later estimates of the interest variable. Complementary studies are suggested to explore the range and importance of these values in the future.
Compared with other widely used methodologies in forestry, ANN proved superior in the height estimates of A. angustifolia, with errors reaching much lower thresholds, representing a gain in accuracy on a representative scale. Moreover, traditional regression models present many limitations, including being independent of the range of statistical assumptions, such as a normal distribution of data and independence of variables, among others [33]. ANNs also have advantages compared to mixed models since they do not require calibration of random effects when associated at the plot and/or tree level. The superiority of ANN observed in this study is consistent with those reported in the literature for estimating the tree bole volume [24,70,71], bark thickness modeling [72], predicting relationships between diameter at breast height and stump diameter [73], applied growth modeling [74,75], and, specifically, for height estimates [30,47,76,77].
Overall, the ANN generated in this study presents biological coherence and might help reduce prediction bias once the optimal criteria for structuring the network are considered. Furthermore, this contribution predicts a variable as important as height and collaborates in the context of araucaria forest management. Therefore, it could also engage in public areas in the northern part of the country within the Amazon biome, where sustainable forest management practices are conducted.

5. Conclusion

The DN, the amount of NHL, and the type of AF influence the ANN training process in terms of estimation and accuracy of heights. Therefore, these steps must be investigated during the modeling process.
The araucaria heights estimated by ANN showed accuracy in comparison with other methods. ANN has advantages as it does not depend on the assumption about the relationships between the variables used and allows the use of categorical and numerical variables in the same modeling. The over-mixed model also has advantages as it does not require the calibration of random effects when it is associated at the plot and/or tree level.
The ANN generated in our study presents great generalization capacity and consistency regarding biological realism, and its application is readily possible based on the network parameters (synaptic weights and biases).

Supplementary Materials

The following supporting information can be downloaded at: https://www.mdpi.com/article/10.3390/f13081284/s1, Figure S1: Perspective of a single tree of Araucaria angustifolia (Bertol.) Kuntze in São Francisco de Paula, Rio Grande do Sul. Figure S2: Landscape perspective of the study area showing a group of trees of Araucaria angustifolia (Bertol.) Kuntze in Mixed Ombrophilous Forest (MOF) in São Francisco de Paula, Rio Grande do Sul.

Author Contributions

Conceptualization, methodology, and formal analysis, E.A.C., A.F.H., C.A.G.F. and V.L.; software and validation, E.A.C., A.F.H., C.A.G.F. and C.T.S.; investigation, E.A.C., A.F.H. and C.A.G.F.; resources and data curation, E.A.C., A.F.H., C.A.G.F. and V.L.; writing—original draft preparation, E.A.C.; writing—review and editing, E.A.C., A.F.H., C.T.S., V.L., L.O.B. and P.d.C.B.; visualization, E.A.C., A.F.H., C.A.G.F., C.T.S., D.R.K., L.O.B., G.A.B., V.L. and P.d.C.B.; supervision, A.F.H., C.A.G.F. and V.L.; project administration, E.A.C.; funding acquisition, A.F.H., P.d.C.B. and V.L. All authors have read and agreed to the published version of the manuscript.

Funding

This work was supported by the Graduate Program in Forest Engineering of the Santa Catarina State University (UDESC), the Santa Catarina Research Foundation (FAPESC; 2017TR1762, 2017TR639, 2019TR816, 2019TR828), the Brazilian National Council for Scientific and Technological Development (CNPq; 313887/2018-7, 317538/2021-7), and the Coordination for the Improvement of Higher Education Personnel (CAPES; Finance Code 001).

Institutional Review Board Statement

Not applicable.

Informed Consent Statement

Not applicable.

Data Availability Statement

The dataset used in this research can be made available upon request to the authors.

Acknowledgments

We want to thank the owners of the rural properties assessed in this research and the managers in the national forest of São Francisco de Paula for allowing us to realize this research and for their availability and generosity.

Conflicts of Interest

The authors declare no conflict of interest.

References

  1. Reitz, R.; Klein, R.M. Flora Ilustrada Catarinense: Araucariáceas; Herbário Barbosa Rodrigues: Itajaí, Brazil, 1966. [Google Scholar]
  2. Higuchi, P.; Carolina, A.; Silva, D.A.; Sousa Ferreira, T.; Trierveiler, S.; Souza, D.E.; Pereira Gomes, J.; Montibeller, K.; Fiorentin, K.; Santos, D.O. Floristic Composition and Phytogeography of the Tree Component of Araucaria Forest Fragments in Southern Brazil. Braz. J. Bot. 2012, 35, 145–157. [Google Scholar] [CrossRef]
  3. Santana, L.D.; Ribeiro, J.H.C.; Ivanauskas, N.M.; Carvalho, F.A. Estrutura, Diversidade E Heterogeneidade De Uma Floresta Ombrófila Mista Altomontana Em Seu Extremo Norte De Distribuição (Minas Gerais). Ciência Florest. 2018, 28, 567–579. [Google Scholar] [CrossRef]
  4. Bauermann, S.G.; Behling, H. (Eds.) Dinâmica Paleovegetacional Da Floresta Com Araucária a Partir Do Final Do Pleistoceno: O Que Mostra a Palinologia. In Floresta Com Araucária: Ecologia, Conservação E Desenvolvimento Sustentável; Holos Editora: Ribeirão Preto, Brazil, 2009; pp. 35–38. [Google Scholar]
  5. Hess, A.F.F.; Loiola, T.; de Souza, I.A.; Minatti, M.; Ricken, P.; Borsoi, G.A. Forest management for the conservation of Araucaria angustifolia in Southern Brazil. FLORESTA 2018, 48, 373. [Google Scholar] [CrossRef]
  6. Costa, E.A.; Finger, C.A.G. Efeito Da Competição Nas Relações Dimensionais de Araucária. Floresta E Ambiente 2016, 24, e20150145. [Google Scholar] [CrossRef]
  7. Orellana, E.; Vanclay, J.K. Competition and Dominance between Angiosperms and Araucaria angustifolia (Bert.) O. Kuntze in the Atlantic Forest in Southern Brazil. For. Ecol. Manag. 2018, 425, 119–125. [Google Scholar] [CrossRef]
  8. Souza, I.D.A.; Hess, A.F.; Costa, E.A.; da Silveira, A.C.; Baldissera Schorr, L.P.; Atanazio, K.A. Development of Models to Aid Decision-Making in The Management of Araucaria angustifolia (Bertol.) Kuntze. FLORESTA 2020, 50, 1854. [Google Scholar] [CrossRef]
  9. Vivian, M.A.; Grosskopf, É.J.; Nunes, G.C.; Itako, A.T.; Modes, K.S. Qualidade e Eficiência de Produtos Naturais No Tratamento Preservativo Das Madeiras de Araucaria angustifolia, Eucalyptus Viminalis e Pinus Taeda. Rev. De Ciências Agroveterinárias 2020, 19, 35–47. [Google Scholar] [CrossRef]
  10. Martins, D.A.P.; Erdmann, J.M.; Lemos, A.M.; Walter, F.F.; Lanzarini, A.C.; Kanieski, M.R. Espécies Potenciais Para Recuperação de Áreas Degradadas a Partir de Levantamento Florístico Realizado No Planalto Catarinense. Rev. De Ciências Agroveterinárias 2020, 18, 38–46. [Google Scholar] [CrossRef]
  11. Cysneiros, V.C.; Pelissari, A.L.; Gaui, T.D.; Fiorentin, L.D.; de Carvalho, D.C.; Silveira Filho, T.B.; Machado, S. do A. Modeling of Tree Height–Diameter Relationships in the Atlantic Forest: Effect of Forest Type on Tree Allometry. Can. J. For. Res. 2020, 50, 1289–1298. [Google Scholar] [CrossRef]
  12. Stankova, T.V.; Diéguez-Aranda, U. Height-Diameter Relationships for Scots Pine Plantation in Bulgaria: Optimal Combination of Model Type and Application. Ann. For. Res. 2013, 56, 149–163. [Google Scholar]
  13. Li, Y.; Deng, X.; Huang, Z.; Xiang, W.; Yan, W.; Lei, P.; Zhou, X.; Peng, C. Development and Evaluation of Models for the Relationship between Tree Height and Diameter at Breast Height for Chinese-Fir Plantations in Subtropical China. PLoS ONE 2015, 10, e0125118. [Google Scholar] [CrossRef]
  14. Kafuti, C.; van den Bulcke, J.; Beeckman, H.; van Acker, J.; Hubau, W.; de Mil, T.; Hatakiwe, H.; Djiofack, B.; Fayolle, A.; Loubota Panzou, G.J.; et al. Height-Diameter Allometric Equations of an Emergent Tree Species from the Congo Basin. For. Ecol. Manag. 2022, 504, 119822. [Google Scholar] [CrossRef]
  15. Otto, S. Die Abhängigkeit Des Hirngewichts von Dem Körpergewicht Und Den Geistigen Fähigkeiten. Arch. Psychiatr 1982, 23, 436–446. [Google Scholar]
  16. Skudnik, M.; Jevšenak, J. Artificial Neural Networks as an Alternative Method to Nonlinear Mixed-Effects Models for Tree Height Predictions. For. Ecol. Manag. 2022, 507, 120017. [Google Scholar] [CrossRef]
  17. Kindermann, G. Evaluation of Growth Functions for Tree Height Modelling. Austrian J. For. Sci. 2016, 133, 353–376. [Google Scholar]
  18. Calama, R.; Montero, G. Interregional Nonlinear Height-Diameter Model with Random Coefficients for Stone Pine in Spain. Can. J. For. Res. 2004, 34, 150–163. [Google Scholar] [CrossRef]
  19. Trincado, G.; VanderSchaaf, C.L.; Burkhart, H.E. Regional Mixed-Effects Height–Diameter Models for Loblolly Pine (Pinus Taeda L.) Plantations. Eur. J. For. Res. 2007, 126, 253–262. [Google Scholar] [CrossRef]
  20. Adame, P.; del Río, M.; Cañellas, I. A Mixed Nonlinear Height–Diameter Model for Pyrenean Oak (Quercus Pyrenaica Willd.). For. Ecol. Manag. 2008, 256, 88–98. [Google Scholar] [CrossRef]
  21. Costa, E.A.; Hess, A.F.; Klein, D.R.; Finger, C.A.G. Height-Diameter Models for Araucaria angustifolia (Bertol.) Kuntze in Natural Forests. J. Agric. Sci. 2018, 10, 133. [Google Scholar] [CrossRef]
  22. Özçelik, R.; Cao, Q.V.; Trincado, G.; Göçer, N. Predicting Tree Height from Tree Diameter and Dominant Height Using Mixed-Effects and Quantile Regression Models for Two Species in Turkey. For. Ecol. Manag. 2018, 419–420, 240–248. [Google Scholar] [CrossRef]
  23. Hofiço, N.S.A.; Costa, E.A.; Fleig, F.D.; Finger, C.A.G.; Hess, A.F. Height-Diameter Relationships For Eucalyptus Grandis Hill Ex. Maiden In Mozambique: Using Mixed-Effects Modeling Approach. Cerne 2020, 26, 183–192. [Google Scholar] [CrossRef]
  24. Özçelik, R.; Diamantopoulou, M.J.; Brooks, J.R.; Wiant, H.V. Estimating Tree Bole Volume Using Artificial Neural Network Models for Four Species in Turkey. J. Environ. Manag. 2010, 91, 742–753. [Google Scholar] [CrossRef] [PubMed]
  25. Tiryaki, S.; Aydın, A. An Artificial Neural Network Model for Predicting Compression Strength of Heat Treated Woods and Comparison with a Multiple Linear Regression Model. Constr. Build. Mater. 2014, 62, 102–108. [Google Scholar] [CrossRef]
  26. Vahedi, A.A. Artificial Neural Network Application in Comparison with Modeling Allometric Equations for Predicting Above-Ground Biomass in the Hyrcanian Mixed-Beech Forests of Iran. Biomass Bioenergy 2016, 88, 66–76. [Google Scholar] [CrossRef]
  27. Batista, T.S.; Teodoro, L.P.R.; de Azevedo, G.B.; Azevedo, G.T.D.O.S.; Poersch, N.L.; Borges, M.V.V.; Teodoro, P.E. Artificial Neural Networks and Non-Linear Regression for Quantifying the Wood Volume in Eucalyptus Species. South. For. A J. For. Sci. 2022, 84, 1–7. [Google Scholar] [CrossRef]
  28. Júnior, I.D.S.T.; de Souza, J.R.M.; Lopes, L.S.D.S.; Fardin, L.P.; Casas, G.G.; Neto, R.R.D.O.; Leite, R.V.; Leite, H.G. Machine Learning and Regression Models to Predict Multiple Tree Stem Volumes for Teak. South. For. A J. For. Sci. 2021, 83, 294–302. [Google Scholar] [CrossRef]
  29. Binoti, M.L.M.D.S.; Binoti, D.H.B.; Leite, H.G.; da Silva, A.A.L.; Pontes, C. Utilização de Redes Neurais Artificiais Para a Projeção Da Distribuição Diamétrica de Povoamento Equiâneos. Rev. Árvore 2014, 38, 747–754. [Google Scholar] [CrossRef]
  30. Binoti, M.L.M.D.S.; Binoti, D.H.B.; Leite, H.G. Aplicação de Redes Neurais Artificiais Para Estimação Da Altura de Povoamentos Equiâneos de Eucalipto. Rev. Árvore 2013, 37, 639–645. [Google Scholar] [CrossRef]
  31. Gonçalves, S.B.; Fiedler, N.C.; Silva, J.P.M.; da Silva, G.F.; da Silva, M.L.M.; Minette, L.J.; Pereira, D.P.; Lopes, D.M.M.; da Silva, E.F.; Ramalho, A.H.C.; et al. Machine Learning Techniques to Estimate Mechanised Forest Cutting Productivity. South. For. A J. For. Sci. 2021, 83, 276–283. [Google Scholar] [CrossRef]
  32. Castaño-Santamaría, J.; Crecente-Campo, F.; Fernández-Martínez, J.L.; Barrio-Anta, M.; Obeso, J.R. Tree Height Prediction Approaches for Uneven-Aged Beech Forests in Northwestern Spain. For. Ecol. Manag. 2013, 307, 63–73. [Google Scholar] [CrossRef]
  33. Bayat, M.; Bettinger, P.; Heidari, S.; Khalyani, A.H.; Jourgholami, M.; Hamidi, S.K. Estimation of Tree Heights in an Uneven-Aged, Mixed Forest in Northern Iran Using Artificial Intelligence and Empirical Models. Forests 2020, 11, 324. [Google Scholar] [CrossRef]
  34. Costa, E.A.; Liesenberg, V.; Finger, C.A.G.; Hess, A.F.; Schons, C.T. Understanding Bark Thickness Variations for Araucaria angustifolia in Southern Brazil. J. For. Res. 2021, 32, 1077–1087. [Google Scholar] [CrossRef]
  35. Barbosa, L.O.; Costa, E.A.; Schons, C.T.; Finger, C.A.G.; Liesenberg, V.; Bispo, P.D.C. Individual Tree Basal Area Increment Models for Brazilian Pine (Araucaria angustifolia) Using Artificial Neural Networks. Forests 2022, 13, 1108. [Google Scholar] [CrossRef]
  36. Schmidt, M.; Kiviste, A.; von Gadow, K. A Spatially Explicit Height–Diameter Model for Scots Pine in Estonia. Eur. J. For. Res. 2011, 130, 303–315. [Google Scholar] [CrossRef]
  37. Haykin, S. Neural Networks: A Comprehensive Foundation, 2nd ed.; Prentice-Hall: Englewood Cliffs, NJ, USA, 1999. [Google Scholar]
  38. Özkan, C.; Erbek, F.S. The Comparison of Activation Functions for Multispectral Landsat Tm Image Classification. Photogramm. Eng. Remote Sens. 2003, 69, 1225–1234. [Google Scholar] [CrossRef]
  39. Carrijo, J.V.N.; Ferreira, A.B.D.; Ferreira, M.C.; de Aguiar, M.C.; Miguel, E.P.; Matricardi, E.A.T.; Rezende, A.V. The Growth and Production Modeling of Individual Trees Of Eucalyptus Urophylla plantations. J. For. Res. 2020, 31, 1663–1672. [Google Scholar] [CrossRef]
  40. Ayalakshmi, T.; Santhakumaran, A. Statistical Normalization and Back Propagation for Classification. Int. J. Comput. Theory Eng. 2011, 3, 1793–8201. [Google Scholar]
  41. Igwe, K.C.; Oyedum, O.D.; Ajewole, M.O.; Aibinu, A.M. Received Signal Strength Computation for Broadcast Services Using Artificial Neural Network. In Proceedings of the 2017 13th International Conference on Electronics, Computer and Computation (ICECCO), Abuja, Nigeria, 28–29 November 2017; pp. 1–6. [Google Scholar]
  42. Alvares, C.A.; Stape, J.L.; Sentelhas, P.C.; de Moraes Gonçalves, J.L.; Sparovek, G. Köppen’s Climate Classification Map for Brazil. Meteorol. Z. 2013, 22, 711–728. [Google Scholar] [CrossRef]
  43. Patton, M. Qualitative Research and Evaluation Methods, 3rd ed.; Sage Publications: Thousand Oaks, CA, USA, 2002. [Google Scholar]
  44. Costa, E.A.; Liesenberg, V.; Hess, A.F.; Finger, C.G.; Schneider, P.R.; Longhi, R.V.; Schons, C.; Borsoi, G.A. Simulating Araucaria angustifolia (Bertol.) Kuntze Timber Stocks With Liocourt’s Law in a Natural Forest in Southern Brazil. Forests 2020, 11, 339. [Google Scholar] [CrossRef]
  45. Hess, A.F.; Minatti, M.; Costa, E.A.; Schorr, L.P.B.; da Rosa, G.T.; de Arruda Souza, I.; Borsoi, G.A.; Liesenberg, V.; Stepka, T.F.; Abatti, R. Height-to-Diameter Ratios with Temporal and Dendro/Morphometric Variables for Brazilian Pine in South Brazil. J. For. Res. 2021, 32, 191–202. [Google Scholar] [CrossRef]
  46. Barbosa, L.O.; Finger, C.A.G.; Costa, E.A.; Campoe, O.C.; Schons, C.T. Using Crown Characterisation Variables as Indicators of the Vigour, Competition and Growth of Brazilian Pine. South. For. A J. For. Sci. 2021, 83, 240–253. [Google Scholar] [CrossRef]
  47. Costa, E.A.; Finger, C.A.G.; Cunha, T.A. Influência Da Posição Sociológica Na Relação Hipsométrica de Araucaria angustifolia. Rev. Bras. De Ciências Agrárias-Braz. J. Agric. Sci. 2014, 9, 110–116. [Google Scholar] [CrossRef]
  48. Bourque, C.P.-A.; Bayat, M.; Zhang, C. An Assessment of Height–Diameter Growth Variation in an Unmanaged Fagus Orientalis-Dominated Forest. Eur. J. For. Res. 2019, 138, 607–621. [Google Scholar] [CrossRef]
  49. Salehnasab, A.; Bayat, M.; Namiranian, M.; Khaleghi, B.; Omid, M.; Masood Awan, H.U.; Al-Ansari, N.; Jaafari, A. Machine Learning for the Estimation of Diameter Increment in Mixed and Uneven-Aged Forests. Sustainability 2022, 14, 3386. [Google Scholar] [CrossRef]
  50. Tiryaki, S.; Hamzaçebi, C. Predicting Modulus of Rupture (MOR) and Modulus of Elasticity (MOE) of Heat Treated Woods by Artificial Neural Networks. Measurement 2014, 49, 266–274. [Google Scholar] [CrossRef]
  51. Hamidi, S.K.; Zenner, E.K.; Bayat, M.; Fallah, A. Analysis of Plot-Level Volume Increment Models Developed from Machine Learning Methods Applied to an Uneven-Aged Mixed Forest. Ann. For. Sci. 2021, 78, 4. [Google Scholar] [CrossRef]
  52. Bayat, M.; Bettinger, P.; Hassani, M.; Heidari, S. Ten-Year Estimation of Oriental Beech (Fagus Orientalis Lipsky) Volume Increment in Natural Forests: A Comparison of an Artificial Neural Networks Model, Multiple Linear Regression and Actual Increment. For. Int. J. For. Res. 2021, 94, 598–609. [Google Scholar] [CrossRef]
  53. Haykin, S. Neural Networks and Learning Machines; Prentice Hall: Hoboken, NJ, USA, 2009. [Google Scholar]
  54. Wang, Y.; Li, Y.; Song, Y.; Rong, X. The Influence of the Activation Function in a Convolution Neural Network Model of Facial Expression Recognition. Appl. Sci. 2020, 10, 1897. [Google Scholar] [CrossRef]
  55. Suszyński, M.; Peta, K. Assembly Sequence Planning Using Artificial Neural Networks for Mechanical Parts Based on Selected Criteria. Appl. Sci. 2021, 11, 10414. [Google Scholar] [CrossRef]
  56. Wang, X.; Ren, H.; Wang, A. Smish: A Novel Activation Function for Deep Learning Methods. Electronics 2022, 11, 540. [Google Scholar] [CrossRef]
  57. Goodfellow, Y.; Bengio, Y.; Courville, A. Deep Learning; MIT Press: Cambridge, MA, USA, 2016. [Google Scholar]
  58. Silva, I.N.; Spatti, D.H.; Flauzino, R.A. Redes Neurais Artificiais: Para Engenharia E Ciências Aplicadas; ARTLIBER: São Paulo, Brazil, 2010. [Google Scholar]
  59. Fritsch, S.; Guenther, F.; Wright, M.N.R.; Suling, M.; Mueller, S.M. Package ‘Neuralnet’, R package version 1.44.2; 2019. Available online: https://github.com/bips-hb/neuralnet (accessed on 1 July 2022).
  60. Corne, S.A.; Carver, S.J.; Kunin, W.E.; Lennon, J.J.; van Hees, W.W.V. Predicting Forest Attributes in Southeast Alaska Using Artificial Neural Networks. For. Sci. 2004, 50, 259–276. [Google Scholar]
  61. Vendruscolo, D.G.S.; Drescher, R.; Souza, H.S.; Moura, J.P.V.M.; Mamoré, F.M.D.; Siqueira, T.A.D.S. Estimativa Da Altura De Eucalipto Por Meio De Regressão Não Linear E Redes Neurais Artificiais. Rev. Bras. Biom. 2015, 33, 5565–5569. [Google Scholar]
  62. Chiarello, F.; Steiner, M.T.A.; De Oliveira, E.B.; Arce, J.E.; Ferreira, J.C. Artificial Neural Networks Applied In Forest Biometrics And Modeling: State Of The Art. CERNE 2019, 25, 140–155. [Google Scholar] [CrossRef]
  63. Costa, E.A.; Finger, C.A.G.; Hess, A.F. Competition Indices and Their Relationship With Basal Area Increment of Araucaria. J. Agric. Sci. 2018, 10, 198. [Google Scholar] [CrossRef]
  64. Cassol, H.L.G.; Shimabukuro, Y.E.; Carreiras, J.M.D.B.; Moraes, E.C. Improved Tree Height Estimation of Secondary Forests in the Brazilian Amazon. Acta Amaz. 2018, 48, 179–190. [Google Scholar] [CrossRef]
  65. Ou, Q.; Lei, X.; Shen, C. Individual Tree Diameter Growth Models of Larch–Spruce–Fir Mixed Forests Based on Machine Learning Algorithms. Forests 2019, 10, 187. [Google Scholar] [CrossRef]
  66. Ashraf, M.I.; Meng, F.-R.; Bourque, C.P.-A.; MacLean, D.A. A Novel Modelling Approach for Predicting Forest Growth and Yield under Climate Change. PLoS ONE 2015, 10, e0132066. [Google Scholar] [CrossRef]
  67. Ying, X. An Overview of Overfitting and Its Solutions. J. Phys. Conf. Ser. 2019, 1168, 22022. [Google Scholar] [CrossRef]
  68. Benitez, J.M.; Castro, J.L.; Requena, I. Are Artificial Neural Networks Black Boxes? IEEE Trans. Neural Netw. 1997, 8, 1156–1164. [Google Scholar] [CrossRef]
  69. Qiu, F.; Jensen, J.R. Opening the Black Box of Neural Networks for Remote Sensing Image Classification. Int. J. Remote Sens. 2004, 25, 1749–1768. [Google Scholar] [CrossRef]
  70. Bhering, L.L.; Cruz, C.D.; Peixoto, L.D.A.; Rosado, A.M.; Laviola, B.G.; Nascimento, M. Application of Neural Networks to Predict Volume in Eucalyptus. Crop Breed. Appl. Biotechnol. 2015, 15, 125–131. [Google Scholar] [CrossRef]
  71. Silva-Ribeiro, R.B.D.; Gama, J.R.V.; Souza, A.L.D.; Leite, H.G.; Soares, C.P.B.; Silva, G.F.D. Métodos para estimar o volume de fustes e galhos na Floresta Nacional Do Tapajós1. Rev. Árvore 2016, 40, 81–88. [Google Scholar] [CrossRef]
  72. Mosaffaei, Z.; Jahani, A. Modeling of Ash (Fraxinus Excelsior) Bark Thickness in Urban Forests Using Artificial Neural Network (ANN) and Regression Models. Modeling Earth Syst. Environ. 2021, 7, 1443–1452. [Google Scholar] [CrossRef]
  73. Şenyurt, M.; Ercanlı, İ.; Günlü, A.; Bolat, F.; Bulut, S. Artificial Neural Network Models for Predicting Relationships between Diameter at Breast Height and Stump Diameter: Crimean Pine Stands at ÇAKÜ Forest. Bosque 2020, 41, 25–34. [Google Scholar] [CrossRef]
  74. Ashraf, M.I.; Zhao, Z.; Bourque, C.P.-A.; MacLean, D.A.; Meng, F.-R. Integrating Biophysical Controls in Forest Growth and Yield Predictions with Artificial Intelligence Technology. Can. J. For. Res. 2013, 43, 1162–1171. [Google Scholar] [CrossRef]
  75. Tavares Júnior, I.D.S.; Torres, C.M.M.E.; Leite, H.G.; De Castro, N.L.M.; Soares, C.P.B.; Castro, R.V.O.; Farias, A.A. Machine Learning: Modeling Increment in Diameter of Individual Trees on Atlantic Forest Fragments. Ecol. Indic. 2020, 117, 106685. [Google Scholar] [CrossRef]
  76. Vendruscolo, D.G.S.; Chaves, A.G.S.; Medeiros, R.A.; Da Silva, R.S.; Souza, H.S.; Drescher, R.; Leite, H.G. Estimativa Da Altura de Árvores de Tectona Grandis, L.f. Utilizando Regressão e Redes Neurais Artificiais. Nativa 2017, 5, 52–58. [Google Scholar] [CrossRef]
  77. Dantas, D.; Rodrigues Pinto, L.O.; Terra, M.D.C.N.S.; Calegario, N.; De Oliveira, M.L.R. Reduction of Sampling Intensity in Forest Inventories to Estimate the Total Height of Eucalyptus Trees. Bosque 2020, 41, 353–364. [Google Scholar] [CrossRef]
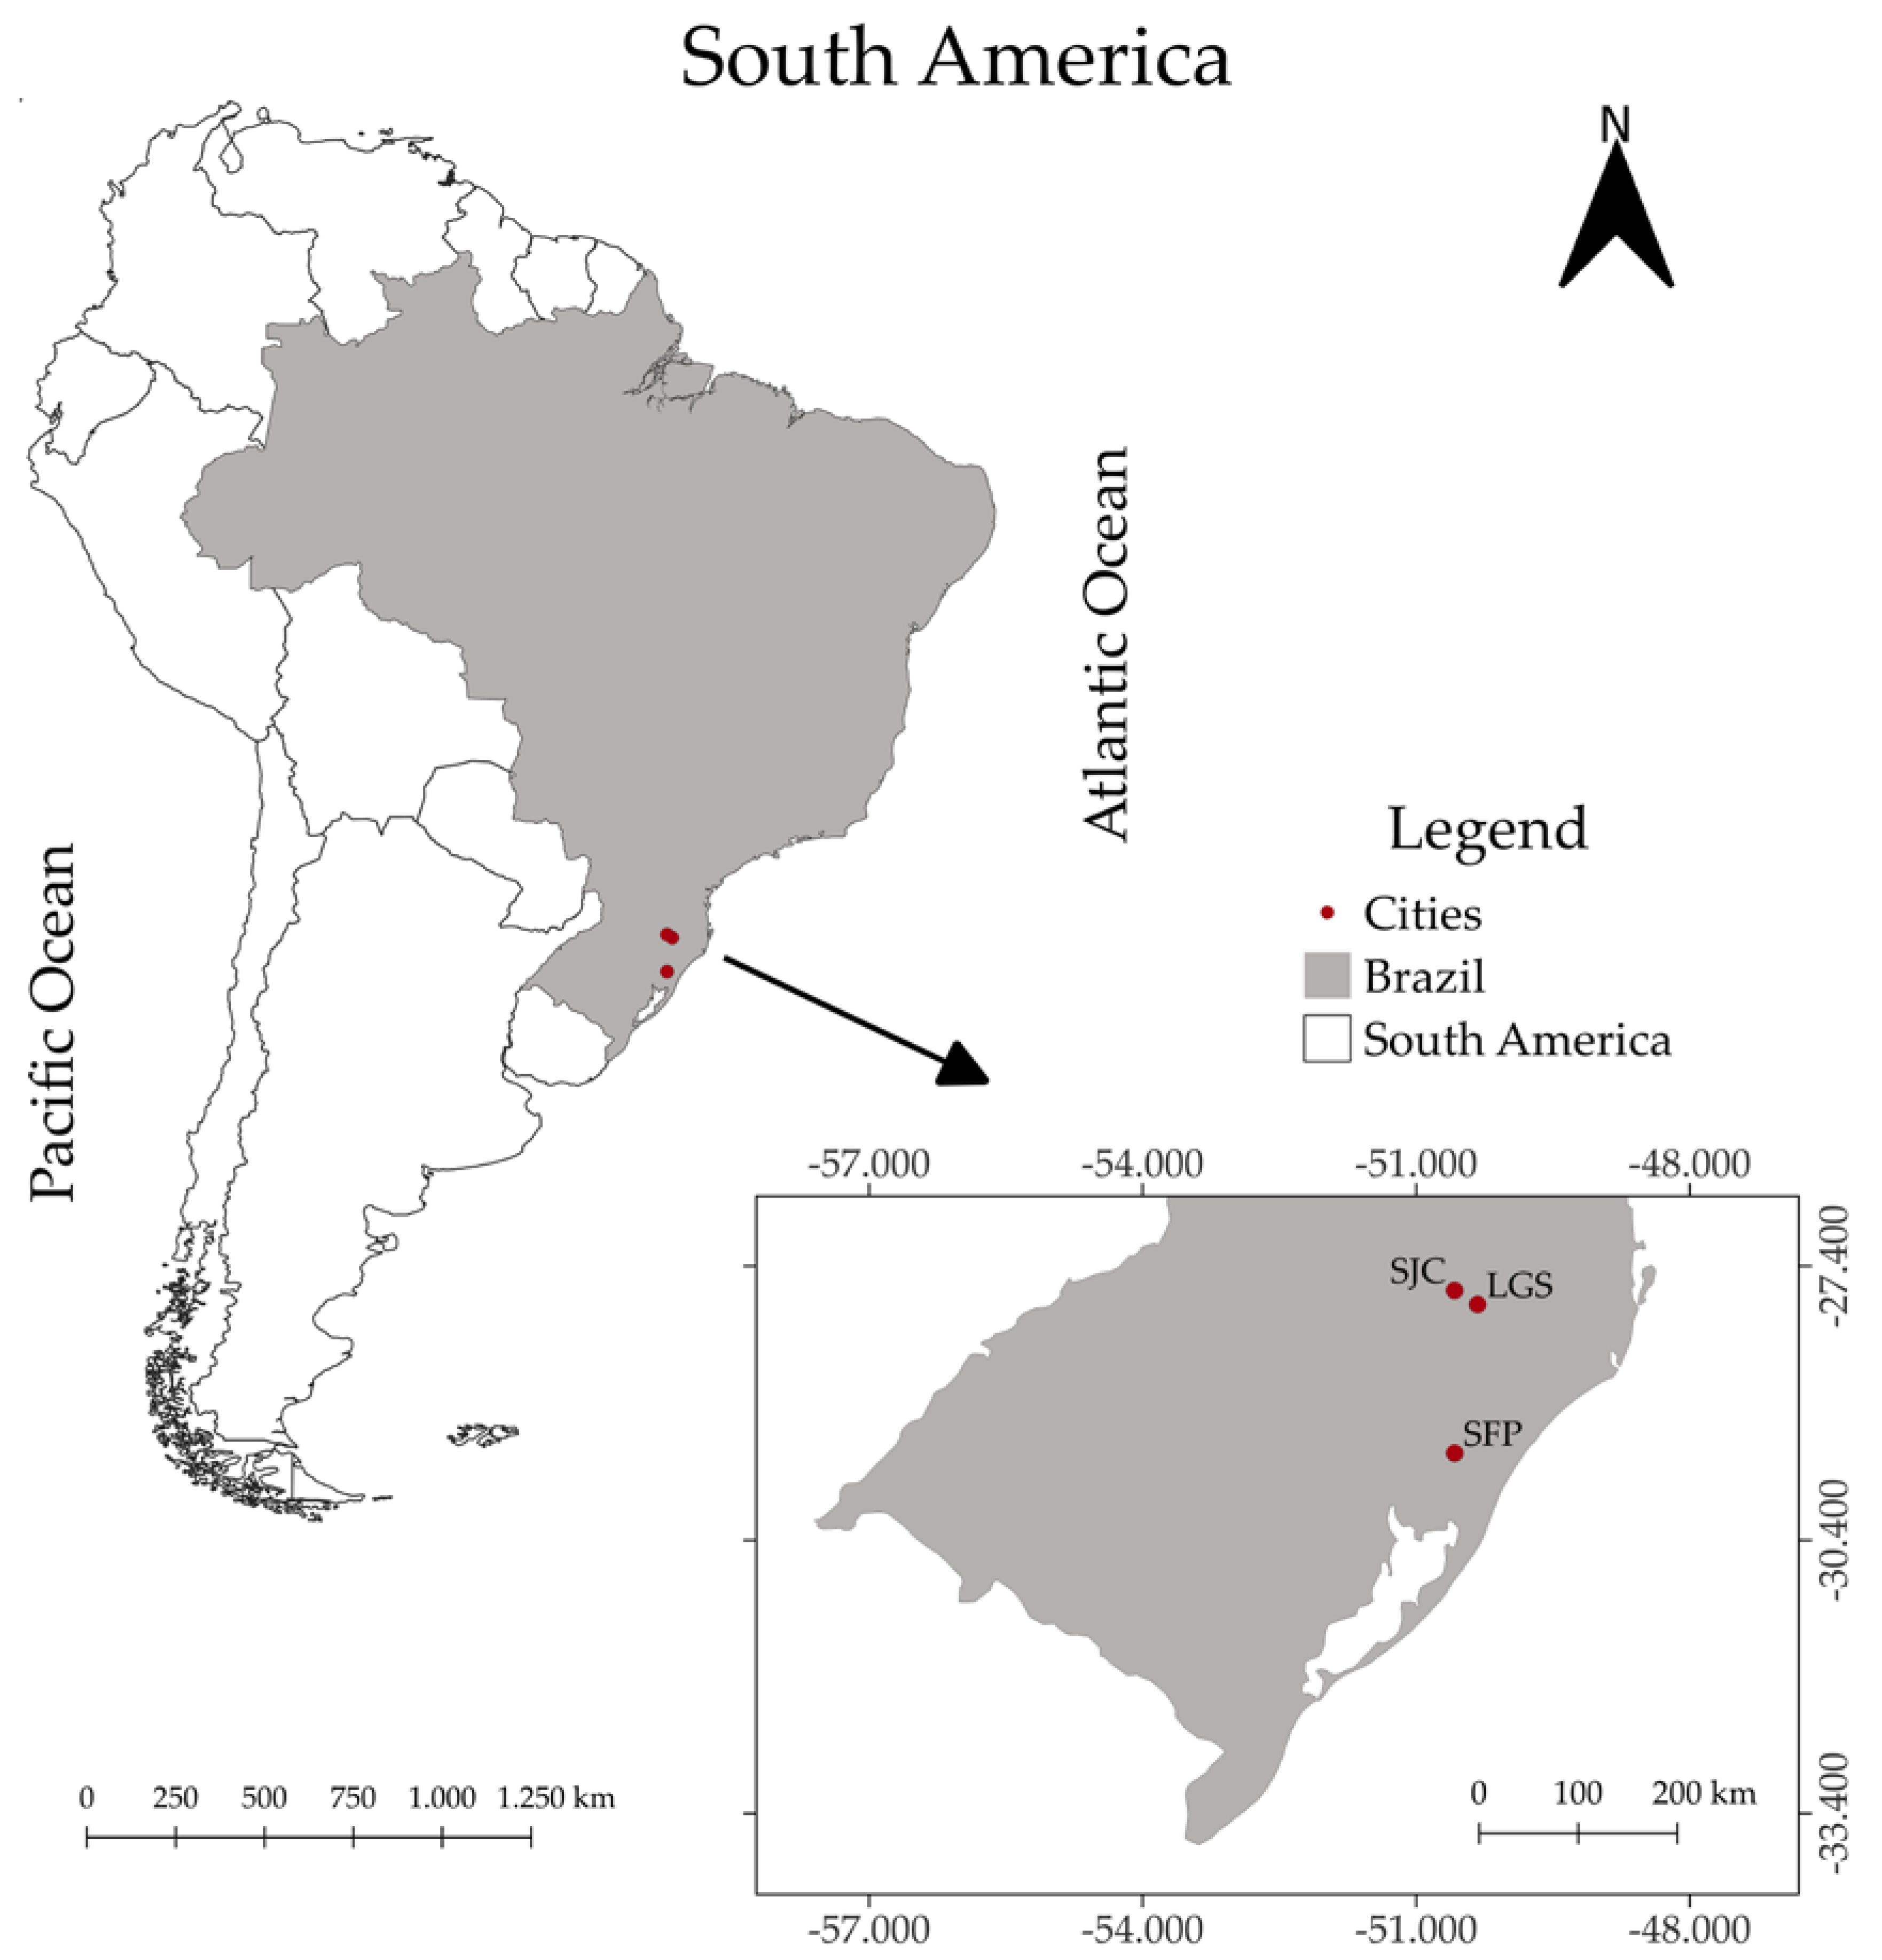
Figure 1. Study areas in different locations in southern Brazil.
Forests 13 01284 g001
Figure 2. Basic structure of a Multi-layer Perceptron (MLP).
Forests 13 01284 g002
Figure 3. Architecture of Artificial Neural Networks (ANNs) used in training for the prediction of height for Brazilian pine.
Forests 13 01284 g003
Figure 4. Residual distribution of the best-trained networks (ANNLS-35 and ANNTH-76) to describe the height of Brazilian pine trees in mixed forests. (a) and (c) correspond to the training set; (b) and (d) correspond to the validation set.
Forests 13 01284 g004
Figure 5. Residual distribution of the four compare methodologies using the validation data for estimating Brazilian pine height. NL: Non-linear (a). LDV: Linear with Dummy Variables (b). PC-MNLR: Principal Component with Mixed Non-linear Regression (c). ANNLS–35: Artificial Neural Networks (d). The colors mean the Sociological Position (SP) of the tree in the forest, where: dominant-SP1 (yellow), codominant-SP2 (red), and dominated-SP3 (blue).
Forests 13 01284 g005
Table 1. Climate characteristics of the three study areas.
CityStateLatitudeLongitudeAltitudeMATAP
Lages (LGS)SC27°49′ S50°19′ W986.815.21684.7
São José do Cerrito (SJC)SC27°39′ S50°34′ W888.016.01690.0
São Francisco de Paula (SFP)RS29°26′ S50°34′ W853.815.02016.4
SC: Santa Catarina. RS: Rio Grande do Sul. MAT: Mean Annual Temperature. AP: Annual Precipitation.
Table 2. Descriptive statistics of dendrometric variable measurements of Brazilian pine.
VariablesDataMinimumMeanMaximumStandard Deviation
DBHTraining [N = 603]9.942.297.116.2
HCB3.012.822.33.9
SP1.01.73.00.8
h7.217.525.13.4
DBHValidation [N = 201]11.142.593.016.2
HCB3.213.220.13.7
SP1.01.73.00.8
h8.417.824.83.3
DBH: diameter at breast height; HCB: height at the base of the crown; SP: sociological position; and H: height.
Table 3. Precision measures of the studied Artificial Neural Networks (ANN) variations for height estimation of Brazilian pine.
Data
Normalization
Activation Function in the Hidden LayerArchitectureANNsTrainingValidation
R2RMSEMAEMAPER2RMSEMAEMAPEt (p-Value)
[0, 1]Logistic Sigmoid3-3-1870.831.421.106.540.801.471.126.540.3669
3-4-11510.841.381.086.450.801.471.106.460.3669
3-5-11330.841.371.076.350.801.481.106.440.3222
3-6-1350.841.361.066.290.801.491.126.530.3925
3-7-11120.851.341.046.130.781.571.186.940.2157
3-8-120.851.331.036.110.791.541.156.820.2076
3-9-1270.851.331.046.170.781.561.197.180.2782
[−1, 1]Tangent Hyperbolic3-3-1630.831.421.106.540.801.471.126.540.3669
3-4-11860.831.381.086.470.801.481.106.470.3776
3-5-11420.841.361.066.320.791.511.136.620.3595
3-6-1760.841.361.056.270.801.481.116.430.3926
3-7-1210.841.351.056.250.791.521.146.780.3688
3-8-1850.851.321.036.110.781.551.207.130.3583
3-9-1880.851.321.036.100.781.551.186.910.4455
In which ANNs refers to the identification number of the selected network; R2, to the coefficient of determination; RMSE, to root-mean-square error; MAE, to mean absolute error; MAPE, to mean absolute percentage error; and the t-test score between observed and estimated data.
Table 4. Parameters (synaptic weights and biases) of the Artificial Neural Networks (ANN) selected to describe the height of Brazilian pine.
OutputDescriptionSymbologyParameters *
h [ANNLS–35]Connection weight between the i-th input neuron and the j-th neuron of the hidden layerw113.32816051171092
w125.63564847455494
w13−4.40653201913032
w142.68858077614371
w15−1.68221666104095
w21−3.24989570960590
w22−5.77536858770656
w233.87689105761618
w24−1.13376891107571
w251.25838992740362
w31−321.30491714453200
w32−381.40410414733300
w3386.20493085148810
w3488.90641991865460
w3521.61783043205750
w41−22.89030349033760
w42410.83399462375600
w430.50990767756676
w44−125.55254893517100
w45−36.36394357853860
w513.94323030362454
w525.80007401299029
w53−0.78654999414145
w540.20965400755131
w55−0.14330472749885
w614.07529360272997
w626.59876667861121
w63−0.08872791410663
w64−2.17397149230597
w650.68803696120158
Bias value of the j-th neuron of the hidden layerβ1−3.50954443727372
β24.05439213215968
β3196.62632091995300
β4−161.28176733076100
β5−0.68610189401701
β6−1.58674993359591
Connection weightsv1−10.01973417076710
v2−10.27312884996830
v30.09861299114926
v40.04642360435809
v58.18137541276566
v6−6.94837517016951
Bias value of the output neuronθ9.71477261782129
* Input variables used were: diameter at breast height (DBH). Height at the base of the crown (HCB). Sociological position of the trees (SP1 = 1; SP2 = 2 and SP3 = 3).
Table 5. Performance of different techniques to estimate the height of Brazilian pine trees.
TypeSocial PositionCL bValidation *
RMSEMAEMAPE
NL aSP1 1.951.558.69
SP2 2.712.1812.47
SP3 2.742.3714.97
LDV aSP1, SP2, SP3D1, D22.411.9311.21
PC-MNLR a 2.121.7810.52
ANNLS-35 1.491.136.57
NL: Non-linear. LDV: Linear with Dummy Variables. PC-MNLR: Principal Component with Mixed Non-linear Regression. ANNLS–35: Artificial Neural Networks. a Coefficients estimated and defined as described by Costa et al. [21] and Costa et al. [47]. b Definition of dummy variable. D1: codominant trees. D2: dominated trees. SP: Sociological Position of tree in the forest. * Validation performed with data (n = 199 observations used) in diametric amplitude from 11.1 to 86.0 cm. Due to the structures of the compared models.
Publisher’s Note: MDPI stays neutral with regard to jurisdictional claims in published maps and institutional affiliations.