Article

Combined Transcriptomic and Metabolomic Analysis Reveals the Mechanism of Flavonoid Biosynthesis in Handroanthus chrysanthus (Jacq.) S.O.Grose

Research Institute of Fast-Growing Trees, CAF, 30 Mid Renmin Dadao, Zhanjiang 524022, China
*
Author to whom correspondence should be addressed.
Forests 2022, 13(8), 1285; https://doi.org/10.3390/f13081285
Submission received: 17 July 2022 / Revised: 9 August 2022 / Accepted: 11 August 2022 / Published: 14 August 2022
(This article belongs to the Section Genetics and Molecular Biology)

Abstract

:
Handroanthus and Tabebuia are known for their ornamental and medicinal value, which are attributed to metabolites. However, the mechanisms underlying the synthesis of these metabolites are poorly understood. In this study, the expression levels of secondary metabolites and the mechanism of flavonoid biosynthesis in the bark and leaves of Handroanthus chrysantha (Jaq.) were examined using transcriptomic and metabolomic techniques. Metabolic analysis identified several differentially accumulated metabolites (DAMs), most of which were flavonoids, isoprenoids, and sterols. Additionally, 30 flavonoids were identified in the bark and leaves of H. chrysantha. Transcriptomic analysis identified 69 genes involved in flavonoid biosynthesis, among which 49 were significantly different between the bark and leaves. qRT-PCR analysis of eight genes involved in flavonoid biosynthesis showed that the expression patterns of the genes were consistent with the transcriptome sequencing data. Integrative transcriptomic and metabolomic analysis showed that 20 differentially expressed genes (DEGs) associated with flavonoid biosynthesis were strongly correlated with seven DAMs, confirming the involvement of the DEGs in flavonoid biosynthesis. These findings considerably contribute to the understanding of the biosynthesis of secondary metabolites in H. chrysantha and serve as a reference for further pharmacological studies.

1. Introduction

The Handroanthus and Tabebuia species belong to the Bignoniaceae family, which comprises 67 Tabebuia, 30 Handroanthus, and 2 Roseodendron species [1,2]. The flowers of the tree species are popular owing to their high ornamental value [3,4]. The Handroanthus and Tabebuia species are native to the tropical and subtropical regions of America, distributed from Mexico and the Caribbean to Argentina, with most species being native to Cuba and Haiti [2,5]. The species were first introduced to Taiwan during the 1960s [6], and they were introduced from the American Los Angeles Arboretum to the South China Botanical Garden in Guangzhou during the 1970s [7]. The trees have been gradually utilized for the afforestation of gardens, streets, and landscapes because of their beautiful flowers. The trees have been planted in Guangdong, Guangxi, Hainan, and other provinces (regions) in South China and in the southwest tropical region of China [8].
Apart from their ornamental value, Handroanthus and Tabebuia possess high medicinal value [9,10,11,12]. Recently, several studies have shown that compounds isolated from the Handroanthus and Tabebuia species possess anti-injury, anti-edema, antibiotic, antidepressant [13,14,15], anti-obesity, antifungal, anti-psoriasis, anti-oxidation, anti-inflammatory, and anti-cancer properties [16,17]. As early as 1873, physicians described the therapeutic properties of the plant extract and its use as a drug to treat fever, ulcer, and rheumatism [18,19]. Additionally, the bark can be made into a plaster or concentrated tea to treat various types of skin inflammation, especially eczema, herpes, and scabies [13,20]). Tabebuia aurea hydroethanolic extract possesses good therapeutic effects in chronic gastric diseases and snake venom-induced hyperalgesia and neuron damage [21,22]. Moreover, the bark and leaves can be used to treat toothaches, back pain, and sexually transmitted diseases [23]. Several secondary metabolites, including quinones, flavonoids, benzoic acids, and phenols, have been detected in T. imperitiginose [16,24]. Secondary metabolites play a unique role in the physiological activities of plants; moreover, the pharmacological activities of several medicinal plants are attributed to their secondary metabolites.
Recently, high-throughput transcriptome sequencing technology has been widely used in animal and plant research as well as in traditional Chinese herbal medicine investigations to identify the genetic mechanisms of physiological changes in response to different treatments. The purpose of transcriptomic research is to determine the transcriptional patterns of genes and elucidate gene functions [25]. Metabolites are the final products of gene expression; therefore, combined transcriptomic and metabolomic analysis can clearly reflect physiological changes in organisms [26,27]. Multi-cluster technology can be used to identify and analyze the interaction of individual or multiple genes in metabolic pathways [28]. Moreover, multi-omics analyses facilitate the study of the pharmacological properties and effects of medicinal plants [29].
However, studies on the medicinal properties of the Handroanthus and Tabebuia species in China and the distribution of their secondary metabolites are currently lacking. Therefore, the aim of this study was to elucidate the mechanisms of the biosynthesis of secondary metabolites, particularly flavonoids, in the bark and leaves of Tabebuia chrysantha (Jaq.) Nicholson using transcriptomic and metabolomic techniques. It is anticipated that the findings of this study could serve as a theoretical basis for molecular improvement and breeding to enhance the medicinal value of the Handroanthus and Tabebuia species.

2. Materials and Methods

2.1. Plant Materials and Treatments

The experimental materials were collected from the H. chrysantha germplasm resource bank of the Southern National Forest Seedling Demonstration Base. The bark (P) and leaves (Y) of six 5-year-old plants with consistent growth and no diseases and pests were sampled. Samples of bark were collected from the top, middle, and bottom of the trunk and mixed. Young leaves around the crown of each tree were sampled and mixed. A portion of the samples of the bark and leaves was used for metabolomic analysis, and six samples were mixed in pairs to prepare three samples for transcriptome sequencing. After rapid freezing in liquid nitrogen, each sample was stored in an ultra-low temperature refrigerator at −80 °C (Haier, DW-86L626, Qingdao, China) until further analysis. Six and three biological replicates were used for metabolome and transcriptome analyses, respectively.

2.2. Metabolite Extraction

The samples were prepared according to the methods described by Vasilev et al. [30]. Briefly, 50 mg of the bark/leaf samples was transferred into 2 mL centrifuge tubes, and 1000 μL of an extraction solvent (2:2:1 mixture of methanol/acetonitrile/water) containing an internal standard (20 mg/L of 2-chloro-l-phenylalanine) was added. Thereafter, 100 mg glass beads were added to each tube and oscillated for 30 s, followed by homogenization with a 60 Hz abrader for 90 s using a tissue homogenizer. The samples were ultrasonicated for 15 min at room temperature and centrifuged at 12,000 rpm for 10 min at 4 °C. The supernatant was then passed through a 0.22 μm membrane filter and stored at −80 °C in an ultra-low temperature refrigerator until further analysis. Quality control samples were prepared by evenly mixing the supernatants of all samples [31,32,33,34].

2.3. LC-MS/MS Analysis and Data Processing

For metabolic analysis, the extracted samples were analyzed using Agilent 1290 equipped with an ACQUITY UPLC® HSS T3 column (1.8 Y UPLC® HSS mM; Waters, Milford, MA, USA), with acetonitrile (A) and 5 mM ammonium formate water (B) as the mobile phases. The elution gradient was 2%–98% from 0–12 min, 98% from 12–13.5 min, 95%–2% from 13.5–14.0 min, and 2% from 14–20 min. MS/MS Conditions: ESI ion source spray voltage, 3500 V (positive ion mode) or −2500 V (negative ion mode); capillary temperature, 325 °C; sheath gas flow rate, 30 Arb; auxiliary gas flow rate, 10 Arb. First-order full scanning was performed at a resolution of 70,000. The first-stage ion scan range was 81–1000 m/z, the second-stage cleavage collision voltage was 30%, and the second-stage resolution was 17,500. Invalid MS/MS information was removed by dynamic exclusion [35,36].
Secondary metabolites were identified based on the online METLIN database, and primary and secondary spectrum data detected by mass spectrometry were qualitatively analyzed. R software packages were used for metabolomic analysis and to produce heat maps [37]. Principal component analysis (PCA) and orthogonal partial least square analysis (OPLS-DA) were performed for 12 samples. Significantly differentially accumulated metabolites (DAMs) were screened based on the variable importance in projection (VIP) ≥ 1 and p < 0.05. Subsequently, the DAMs were annotated using the Kyoto Encyclopedia of genes and genomes (KEGG, www.genome.jp/kegg, accessed on 10 May 2022) and the plant metabolic network (PMN, www.plantcyc.org, accessed on 10 May 2022) databases to identify flavonoid biosynthesis pathways. PCA and OPLS-DA were also used to compare specific differences between key metabolites.

2.4. High Throughput Sequencing for Transcriptomic Analysis and Data Processing

The total RNA was extracted from the leaves and bark using the RNAprep pure plant kit (DP441, Tiangen, Beijing, China), according to the manufacturer’s instructions. The total RNA concentration and purity were determined using a NanoDrop 2000 spectrophotometer (Thermo Fisher Scientific, Wilmington, DE, USA). The VAHTS mRNA-seq V3 Library Prep Kit for Illumina® (NEB, Ipswich, MA, USA) was used for mRNA purification and cDNA library construction. The obtained cDNA library was amplified and enriched by PCR. PCR products were purified (AMPure XP system), and library quality was assessed on an Agilent Bioanalyzer 2100 system. Double-ended sequencing was performed on an Illumina novaseq 6000 platform (Agilent Technologies, Santa Clara, CA, USA), with three technical repeats. Raw reads were first removed from the joint sequence, and low-quality sequences were filtered to obtain clean reads. The clean reads were aligned against the Handroanthus impetiginosus genome to obtain the accurate locations of the query sequences on the reference genome using Hisat2 software [38].
The transcripts were quantified using Feature Counts [39], and the expressed levels of genes were estimated using fragments per kilobase of transcription per million fragments mapped (FPKM) reads [40]. Differentially expressed genes (DEGs) were screened based on fold change (FC) ≥ 2 and false discovery rate (FDR) < 0.05 [41]. The DEGs were annotated against NR, Swiss prot, KEGG, COG, KOG, and other databases (e-value < 1 × 10⁻⁵). The functions of DEGs were annotated according to the amino acid sequences that shared high homologies with the corresponding target genes. Gene Ontology (GO, http://geneontology.org/, accessed on 18 May 2022) functional classifications and KEGG (http://geneontology.org/, accessed on 18 May 2022) pathway analysis of the DEGs were conducted using the Goseq R package. based on Wallenius non-central hypergeometric distribution [42] and KOBAS software, respectively [43].

2.5. Quantitative Real-Time PCR (qRT-PCR) Analysis

qRT-PCR was performed to verify the reliability of the transcriptome data. Eight genes related to the flavonoid pathway were selected for qRT-PCR. Additionally, qRT-PCR was used to detect the expression of genes in the root and xylem. Primers were designed using Primer 3.0 software, and the primer sequences are listed in Supplementary Table S1, with an 18S gene used as the endogenous control. All qRT-PCR analyses were performed using three biological replicates, and the relative expression of transcripts was calculated using the 2ΔΔct method [44].

2.6. Combined Transcriptomic–Metabolomic Analysis

Spearman’s correlation was used to analyze the two datasets without considering the linear relationship. DEGs and DAMs were simultaneously mapped to the KEGG pathways. Spearman’s correlation analysis of the DEG and DAM datasets related to flavonoid synthesis in the bark and leaves of H. chrysantha was performed using Graphpad Prism 8 software [45,46,47]. Parameters were considered significantly correlated at p < 0.05 and |R| > 0.9. A network interaction diagram was prepared for highly correlated DAMs and DEGs using cytoscape-v3.9.1plea software.

3. Results

3.1. Multivariate Statistical Analysis

Multivariate statistical analysis was performed to compare the metabolite compositions of the bark and leaves of H. chrysantha. The PCA score diagram represents the degree of separation of original data from the different samples [48]. PCA showed that PC1 and PC2 accounted for 46.96% and 10.42% of the total variation. The metabolites formed distinct clusters according to the samples (Figure 1a); however, the degree of separation in the bark was greater than that in the leaves within groups. Cluster analysis was performed to further evaluate the differences in the metabolites between the bark and leaves. Similarly, the metabolites were clustered into two distinct groups according to the samples (Figure 1b). The first category of metabolites accumulated more in the bark, while the second category accumulated more in the leaves. The number of metabolites in the first category was significantly less than that in the second category, indicating that there were significant differences in metabolites between the bark and leaves.
The metabolome data were analyzed according to the OPLS-DA model. Based on the distribution morphology (Figure 1), metabolites in the bark were distributed on the left side of the confidence interval, whereas those in the leaves were distributed on the right side of the confidence interval, indicating that the metabolites formed distinct clusters according to the samples. Additionally, the dispersion degree of the metabolites in the bark was significantly greater than that in the leaves, although some differences existed within the groups. The displacement results for the model parameters defined by OPLS-DA—the explanatory rate of the model to the X matrix R2X = 0.623, the explanatory rate of the model to the Y matrix R2Y = 1, and the predictive power of the model Q2 = 0.983 (>0.9)—indicated that the OPLS-DA model could sufficiently explain and predict the differences between the two groups of samples (Figure 1c).
Metabolites with VIP ≥ 1 and p < 0.05 were identified as DAMs. A comparative analysis of the metabolites in the bark and leaves showed that the size of scattered points represented the VIP value of the OPLS-DA model. The larger the scattered points, the greater the VIP value, indicating that the screened metabolites with differential expression were reliable. A total of 400 DAMs were screened between the bark and leaves, 313 of which were significantly upregulated (red dots) and 87 of which were significantly downregulated (blue dots; Figure 1d). Gray dots represent metabolites that were not significantly different between the two groups.
The top 10 significantly upregulated and downregulated metabolites in the bark and leaves are listed in Table 1. The metabolites were mainly classified into three categories: flavonoids, isoprenoids, and sterols. Among the 10 upregulated metabolic components, cyanidin 3-glucoside, peonidin-3-glucoside, and malvidin 3-glucoside were flavonoids. Among the 10 downregulated metabolic components, silibinin, chalconaringenin, and epicatechin were flavonoids.

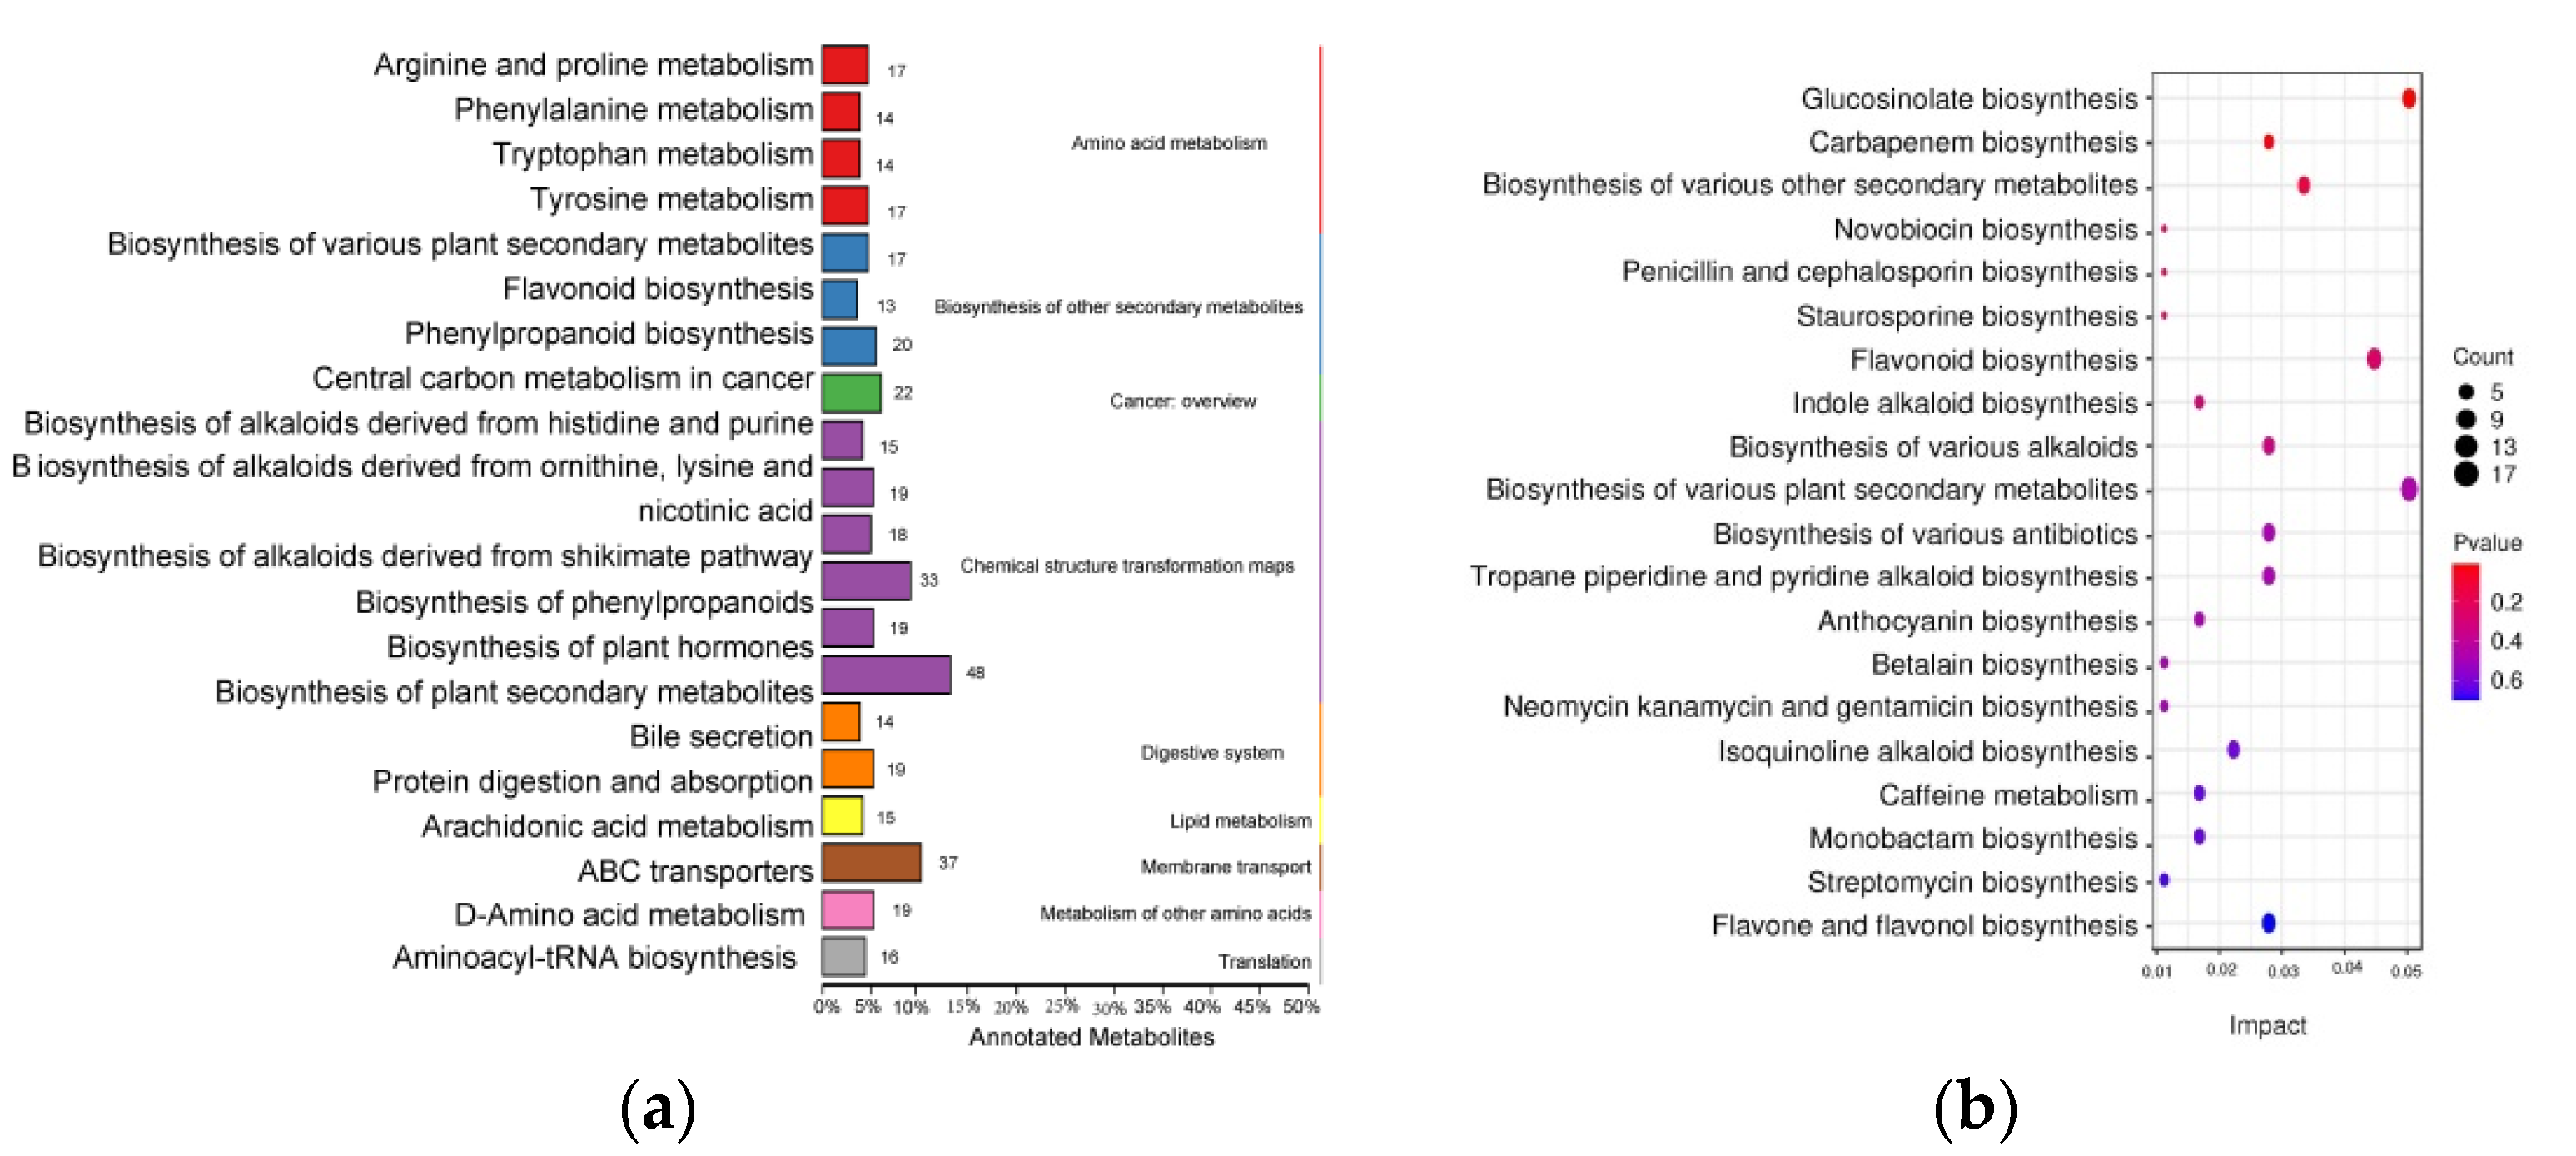
3.2. Metabolites in the Bark and Leaves of H. chrysantha

DAMs were annotated on the KEGG database using clusterProfiler software (https://www.genome.jp/kegg, accessed on 10 May 2022) to determine significantly enriched pathways [49]. A total of 365 DAMs were enriched in 179 metabolic pathways (Table S2). Among the enriched pathways, the top 20 pathways were related to the amino acid metabolism, secondary metabolite biosynthesis, cancer overview, chemical structure transformation maps, digestive system, lipid metabolism, membrane transport, other amino acid metabolism, and translation (Figure 2). A total of 112 DAMs were linked to pathways for the biosynthesis of secondary metabolites, and 108 DAMs were related to amino acid metabolism. Among the pathways involved in the biosynthesis of plant secondary metabolites, more than 20 DAMs were enriched in ABC transporters, phenylpropanoid biosynthesis, central carbon metabolism in cancer, and phenylpropanoid biosynthesis. Flavonoids are important plant secondary metabolites which have a wide range of pharmacological effects, such as antioxidant, antibacterial, antiviral, and analgesic effects [50,51,52]. The further enrichment analysis of flavonoid biosynthesis showed that flavonoids, flavones, and flavonols were the main secondary metabolites enriched by the pathways.

3.3. Secondary Metabolites Identified in the Flavonoid Pathway

A further analysis of the flavonoid pathways based on metabolomic data showed that there were 48 flavonoids in the bark and leaves (Table S3), including secondary metabolites, such as anthocyanins, flavones, flavanols, isoflavones, and chalcones. Using VIP ≥ 1 and p < 0.05 as screening standards, we identified 30 flavonoids in the leaves and bark (Table S4). The cluster analysis showed that there were 16 flavonoids in the leaves and 14 metabolites in the bark (Figure 3). The chrysosplenetin, chalconaringenin, and silibinin contents of the bark were more than 100-fold those of the leaves, whereas the malvidin 3-glucoside, peonidin-3-glucoside, vincein 2, cyanidin 3-glucoside, and 3-o-methylquercetin contents of the leaves were more than 100-fold those of the bark.

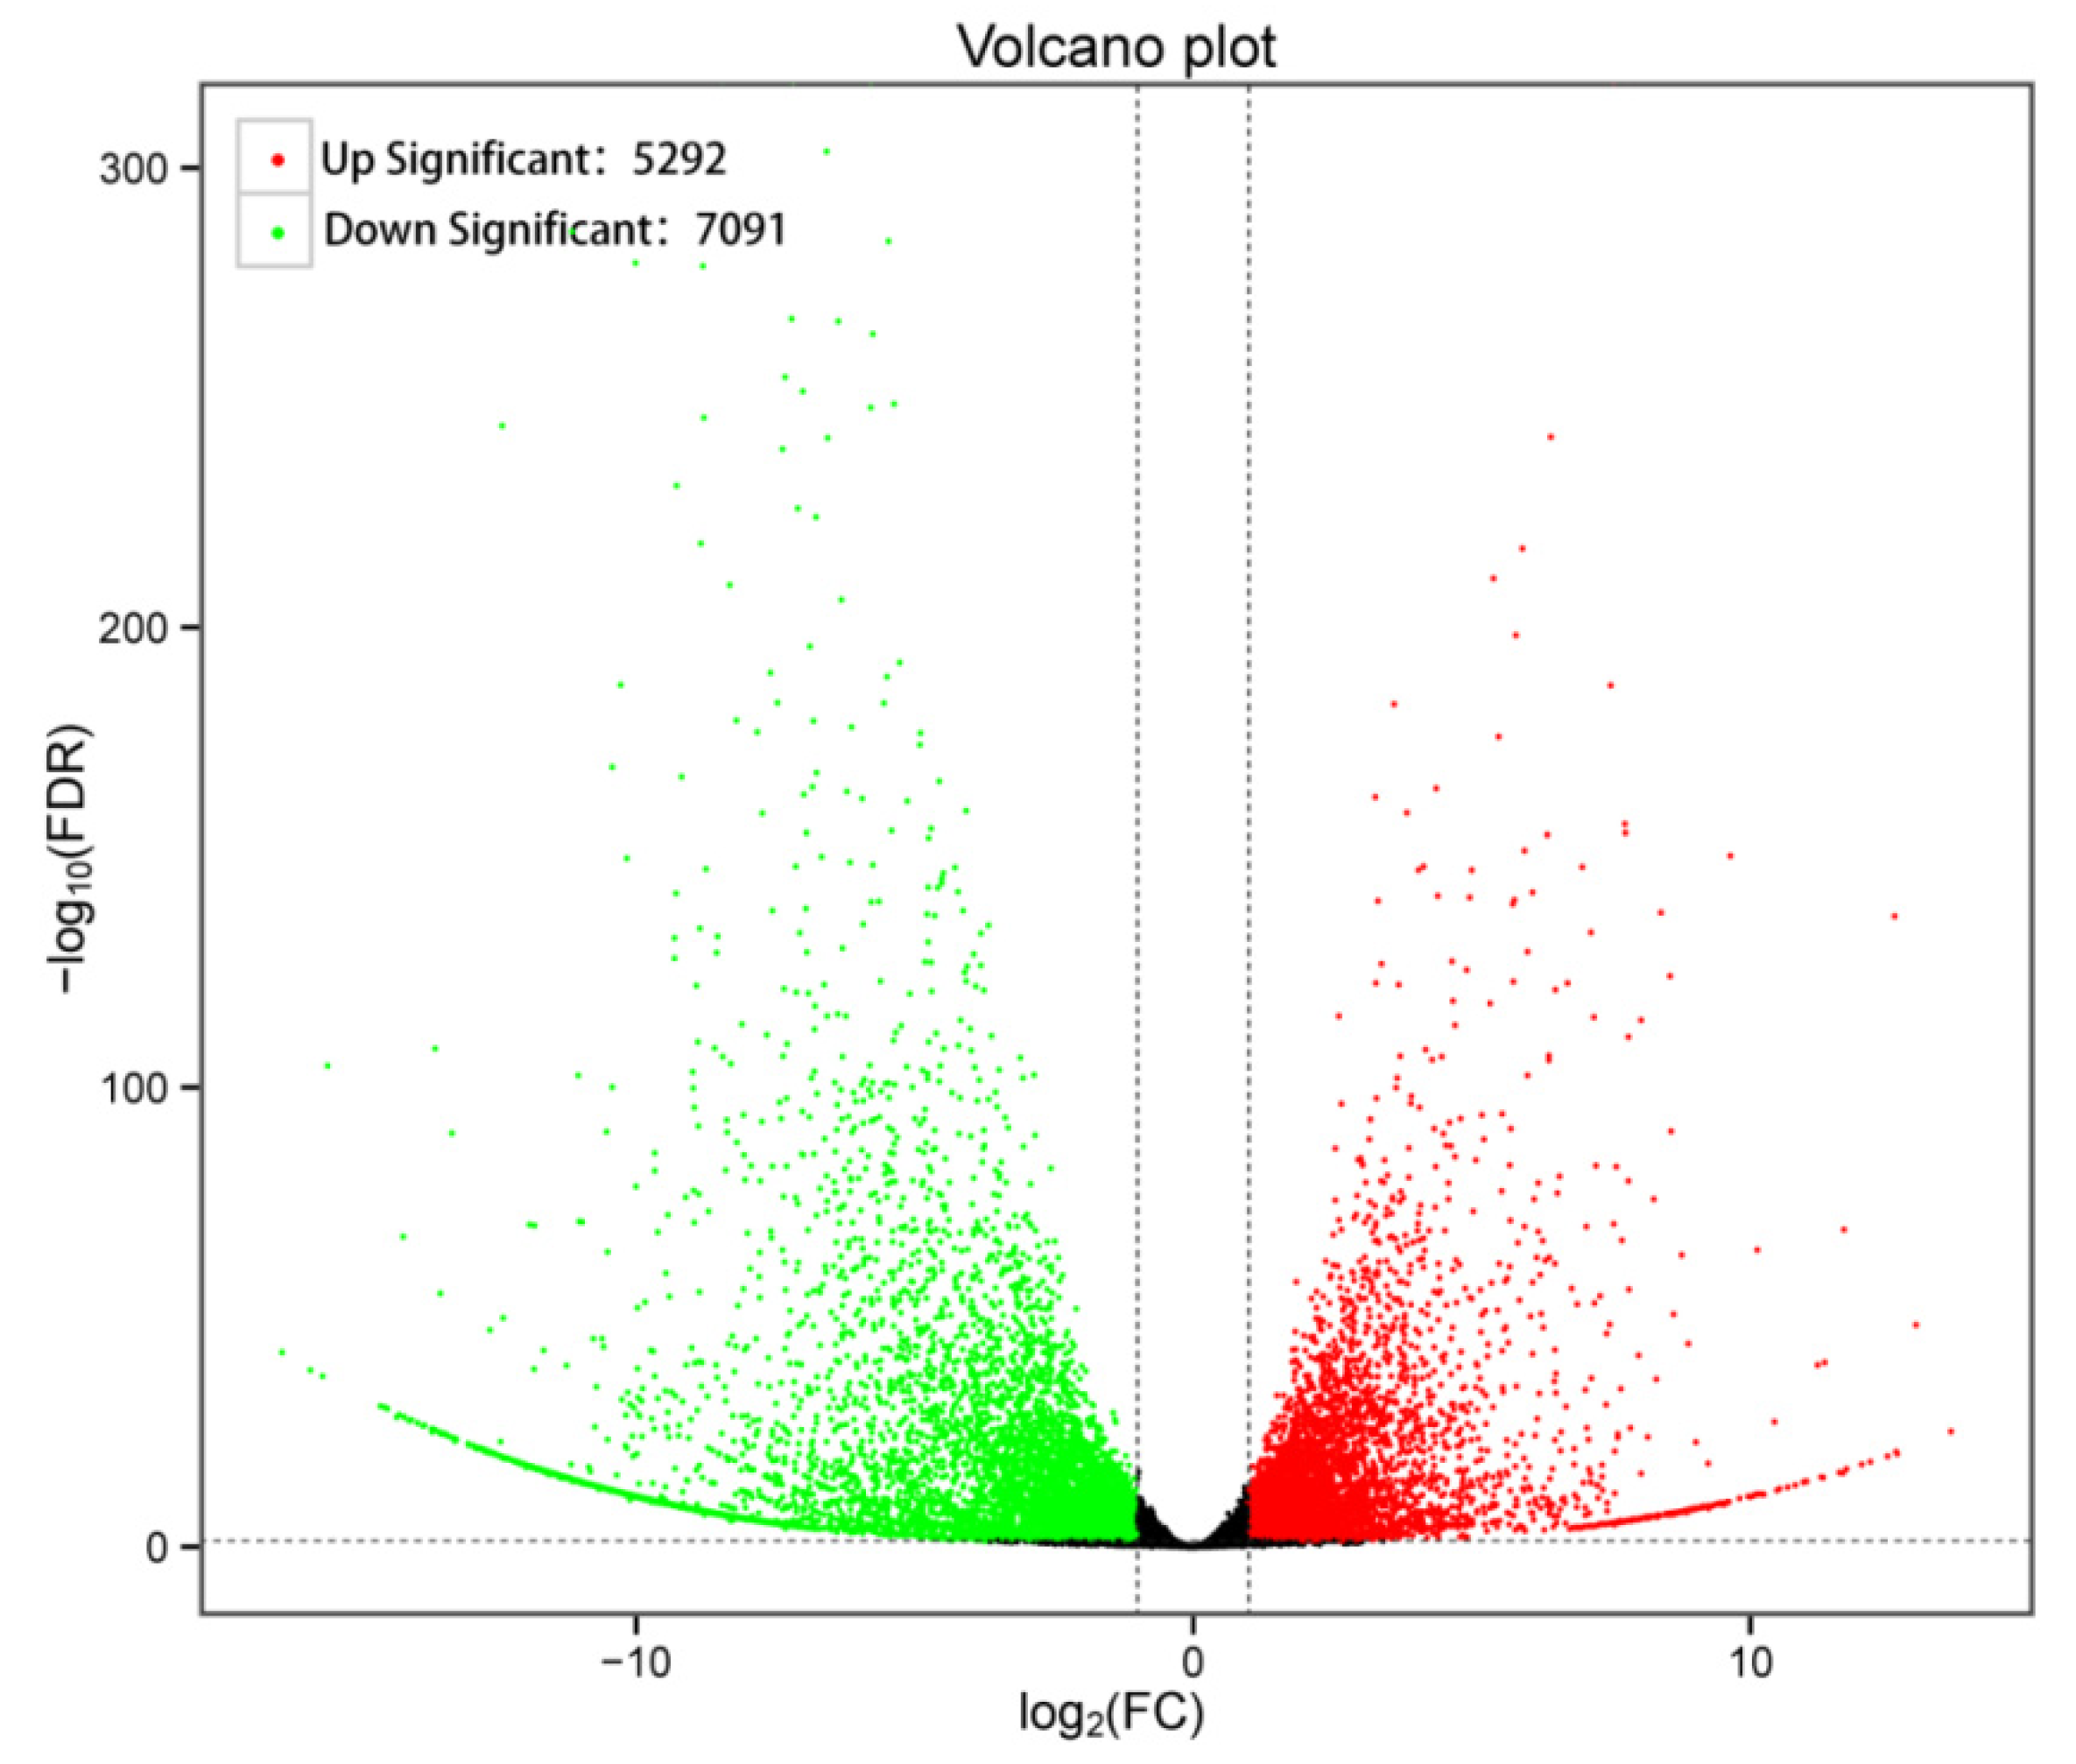
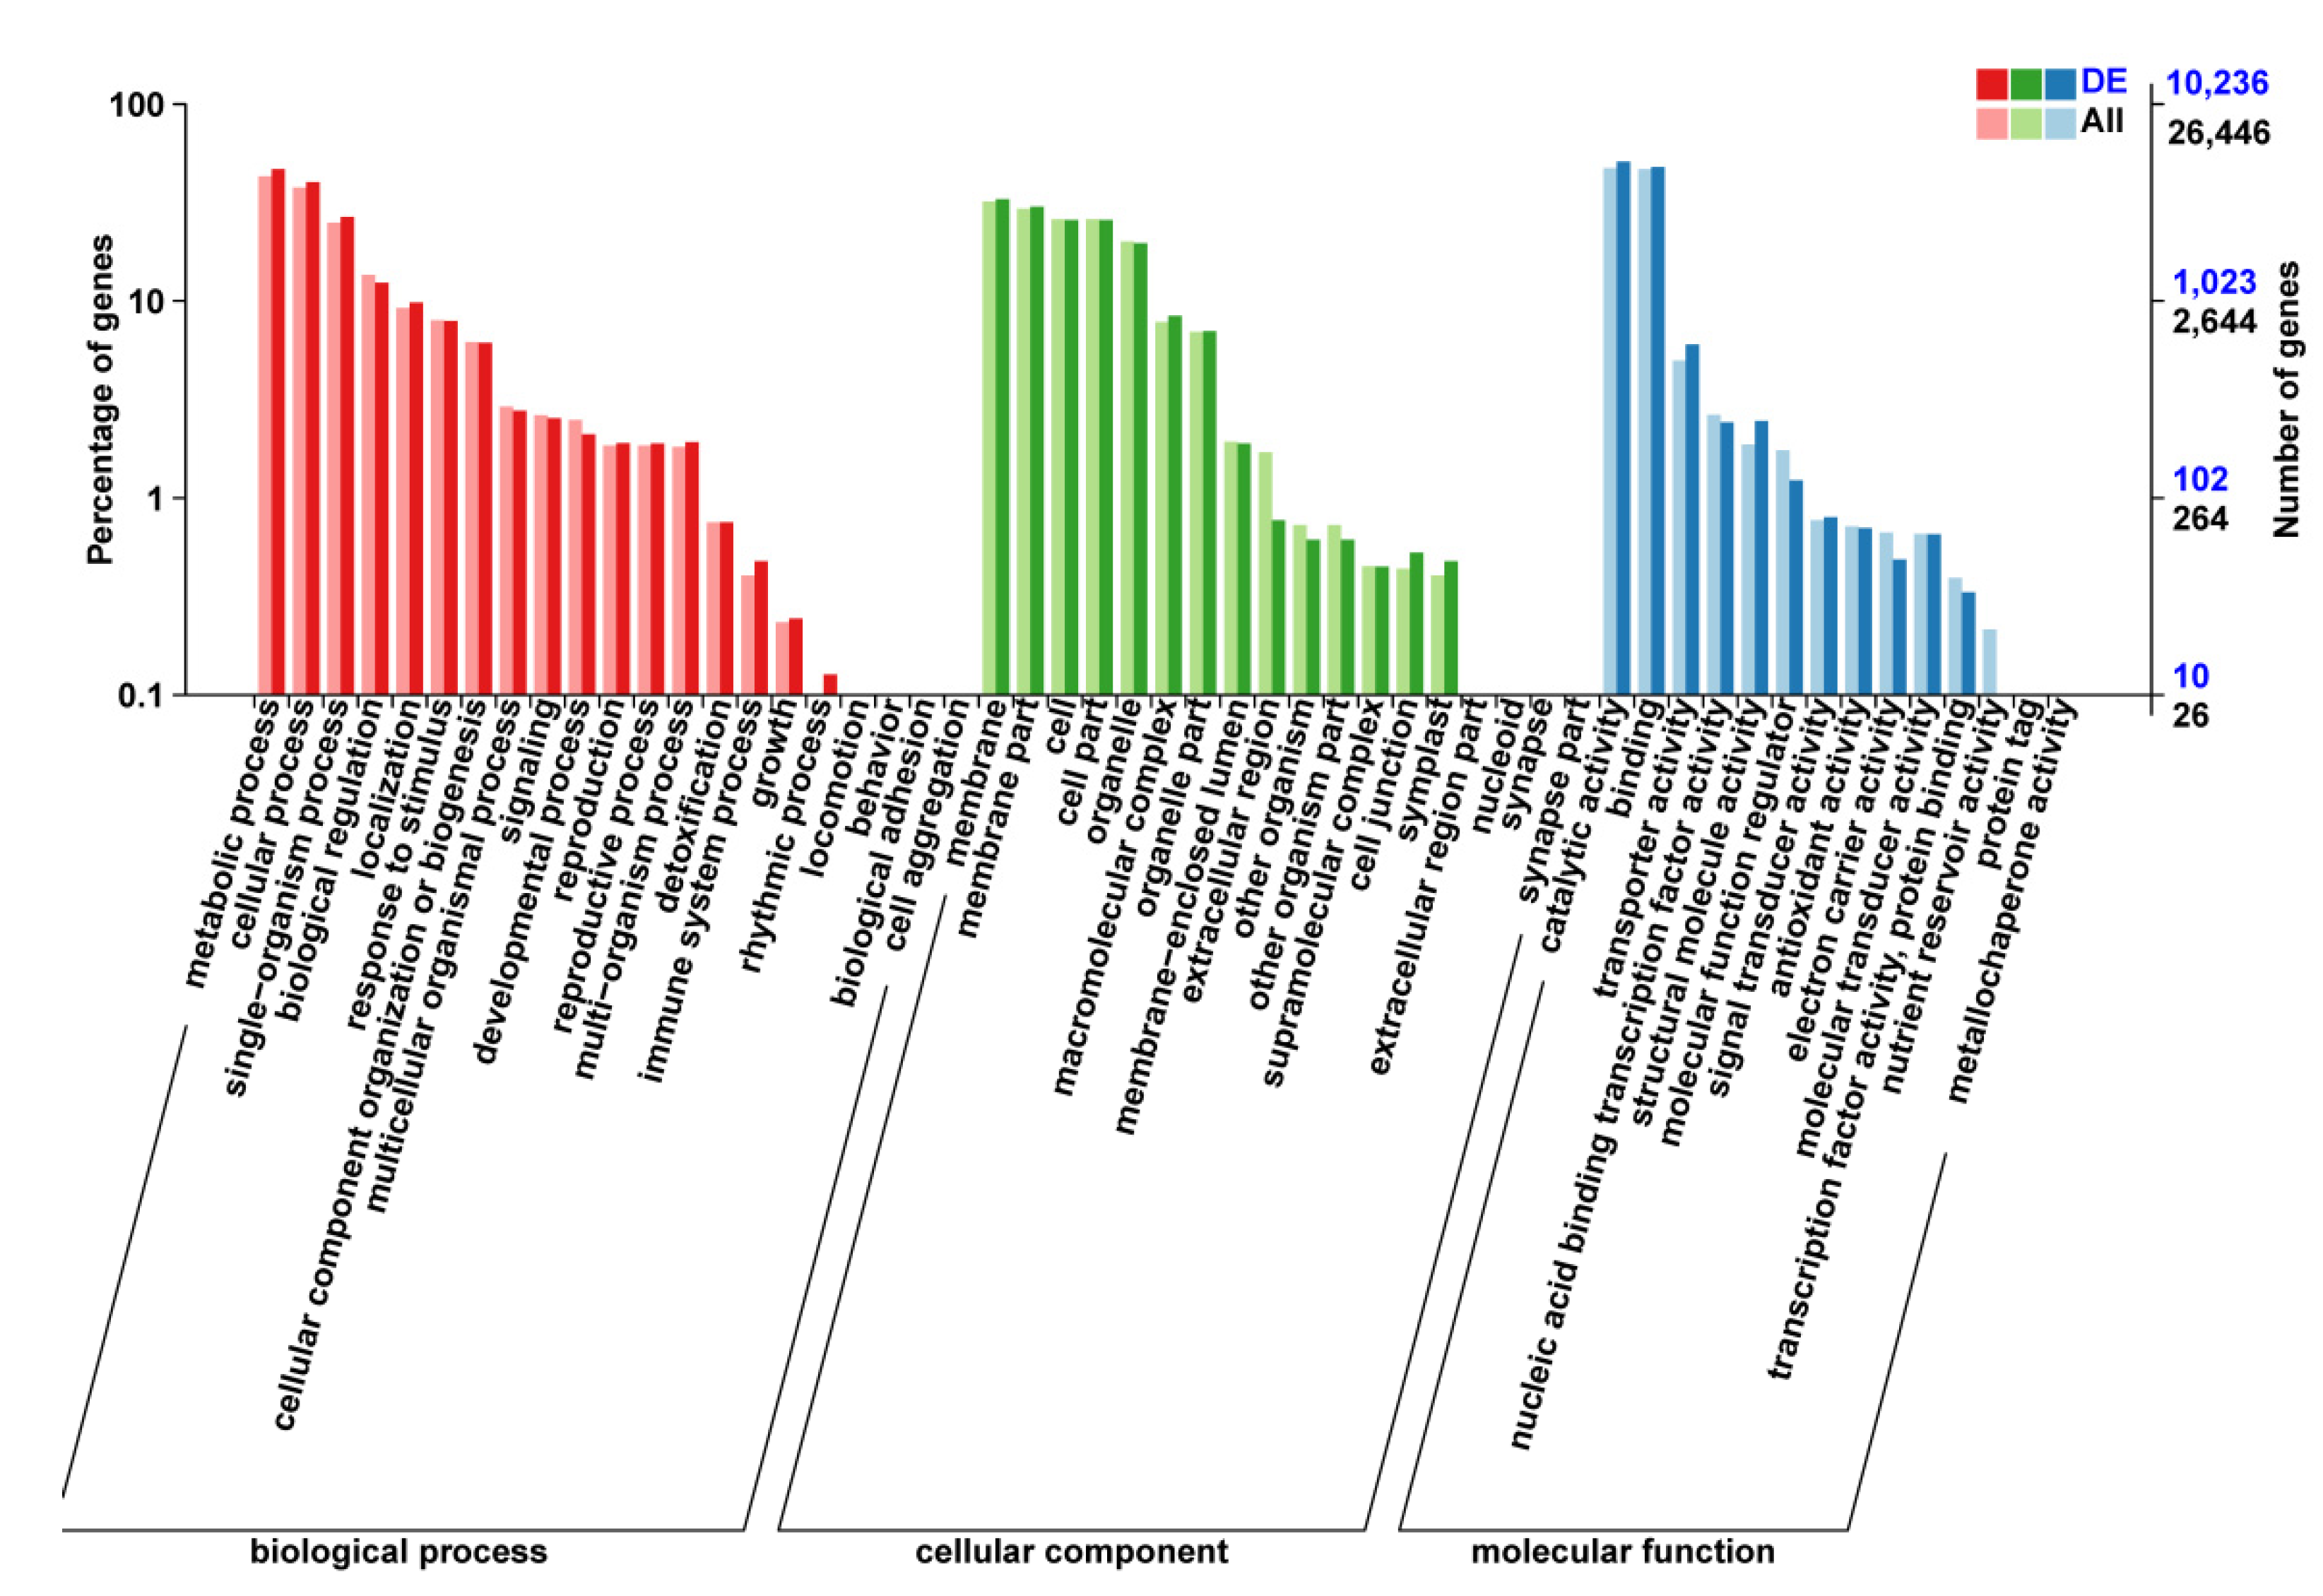
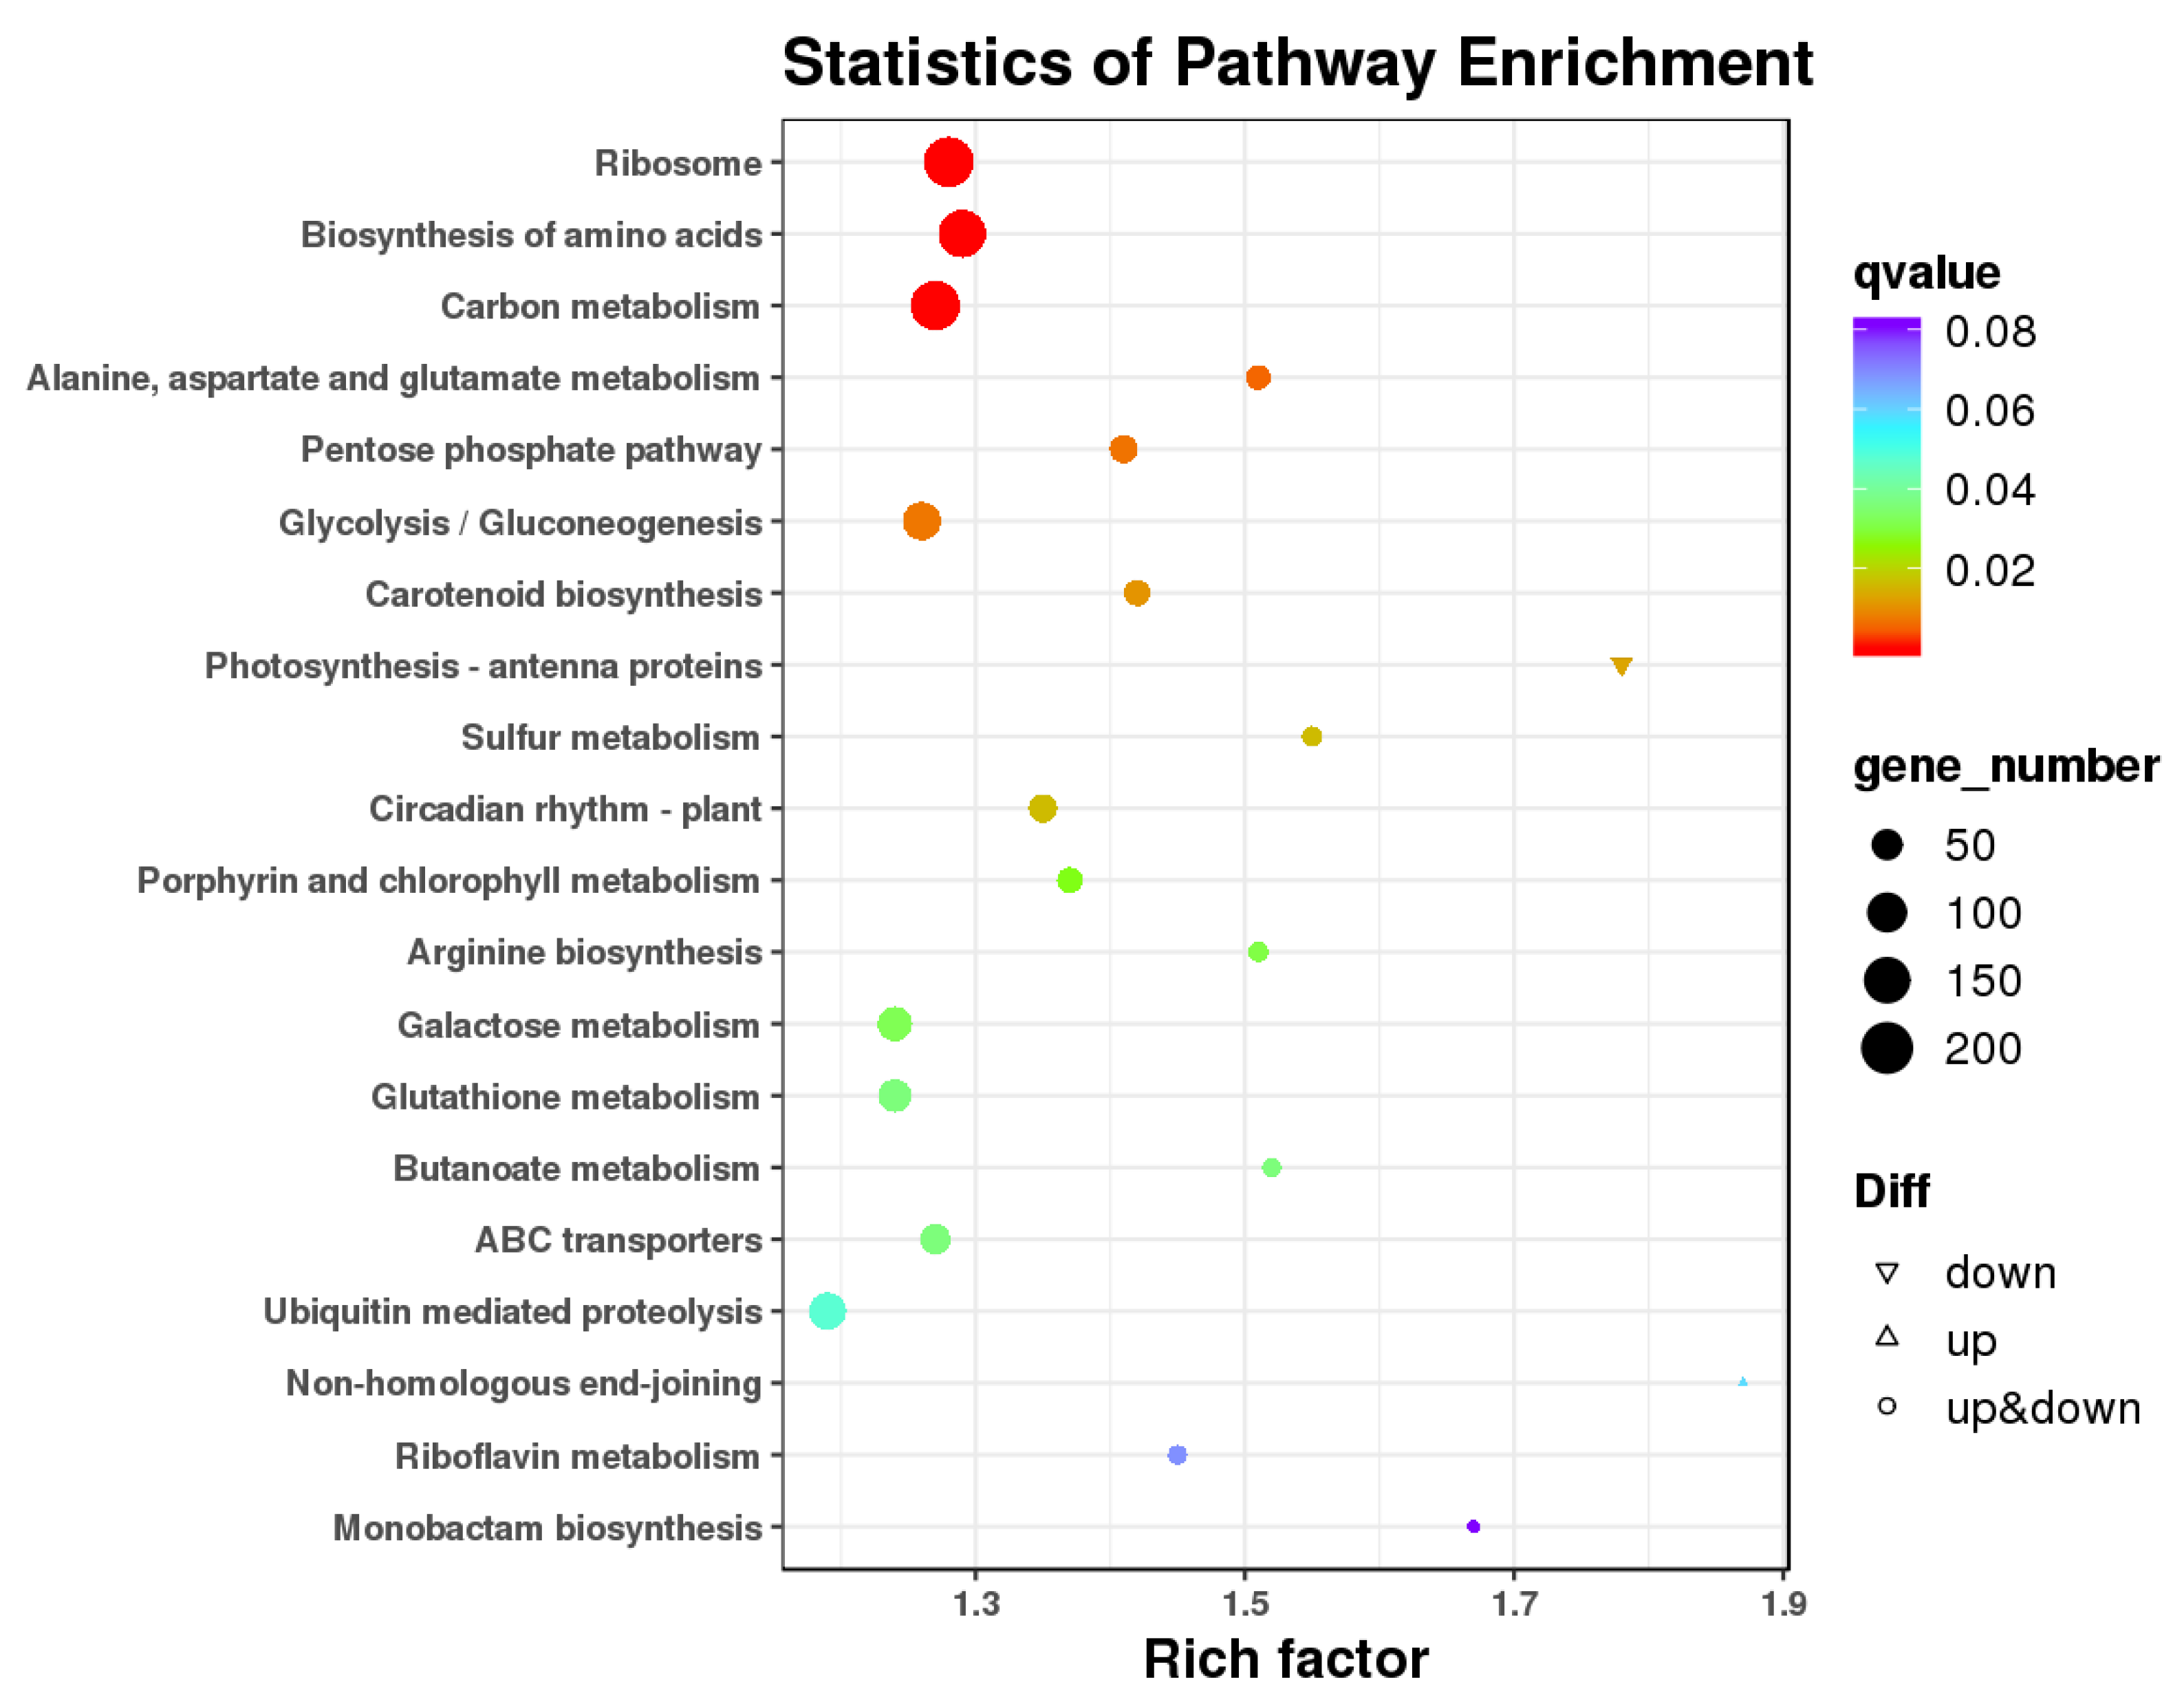
3.4. GO Enrichment and KEGG Pathway Analysis of DEGs

The differential analysis of DEGs (FC ≥ 2 and FDR < 0.05) between the bark and leaves identified 12,283 non-redundant DEGs, among which 5192 were significantly upregulated and 7091 were significantly downregulated in Y and P (Figure 4). The functional annotation on the GO database showed that 10,236 DEGs (q < 0.05) were enriched in 3 categories and 53 subclasses, including 21 biological processes, 18 cellular components, and 14 molecular functions. Most DEGs were enriched in metallic and cellular processes in biological processes, in membrane biosynthesis in cellular components, and in catalytic and activity binding in molecular functions (Figure 5).
Pathway annotation analysis on the KEGG database showed that 4615 DEGs were enriched in 134 KEGG pathways, among which 2270 were annotated in metabolic pathways and 30 were annotated in significantly enriched pathways (p < 0.05). The most significantly enriched pathways included ribosome biosynthesis; amino acid biosynthesis; carbon metabolism; alanine, aspartate, and glutamate metabolism; and pentose phosphate pathways (Figure 6). Most DEGs (592) were annotated in metabolic pathways, including carbon metabolism; alanine, aspartate, and glutamate metabolism; sulfur metabolism; porphyrin and chlorophyll metabolism; galactose metabolism; butanoate metabolism; glutathione metabolism; and riboflavin metabolism.

3.5. Analysis of Transcription Factors (TF)

TFs can activate the co-expression of multiple genes in secondary metabolic pathways by combining with structural genes [53]. Transcriptome analysis identified a total of 1934 TFs in the bark and leaves, which were classified into 69 TF families (Table S5). MYB and bHLH TF families were the most abundant, followed by AP2/ERF-ERF, C2H2 NAC, and WRKY. A total of 665 TFs differed between the bark and leaves, among which 274 were upregulated and 391 were downregulated (Table S6). TFs belonging to the MYB, MYC (bHLH), and bZIP families regulate the biosynthesis of flavonoids. Further analysis identified 63 (21 upregulated/41 downregulated) MYB, 45 (18/27) MYC (bHLH), and 23 (10/23) bZIP TF families in the bark and leaves. Among the top 20 TF families (Figure 7), MYB, bHLH, bZIP, AP2, WRKY, NAC, and bZIP regulate the plant secondary metabolism by activating the expression of multiple synthesis genes [54].

3.6. Enzyme Genes in Flavonoid Biosynthesis
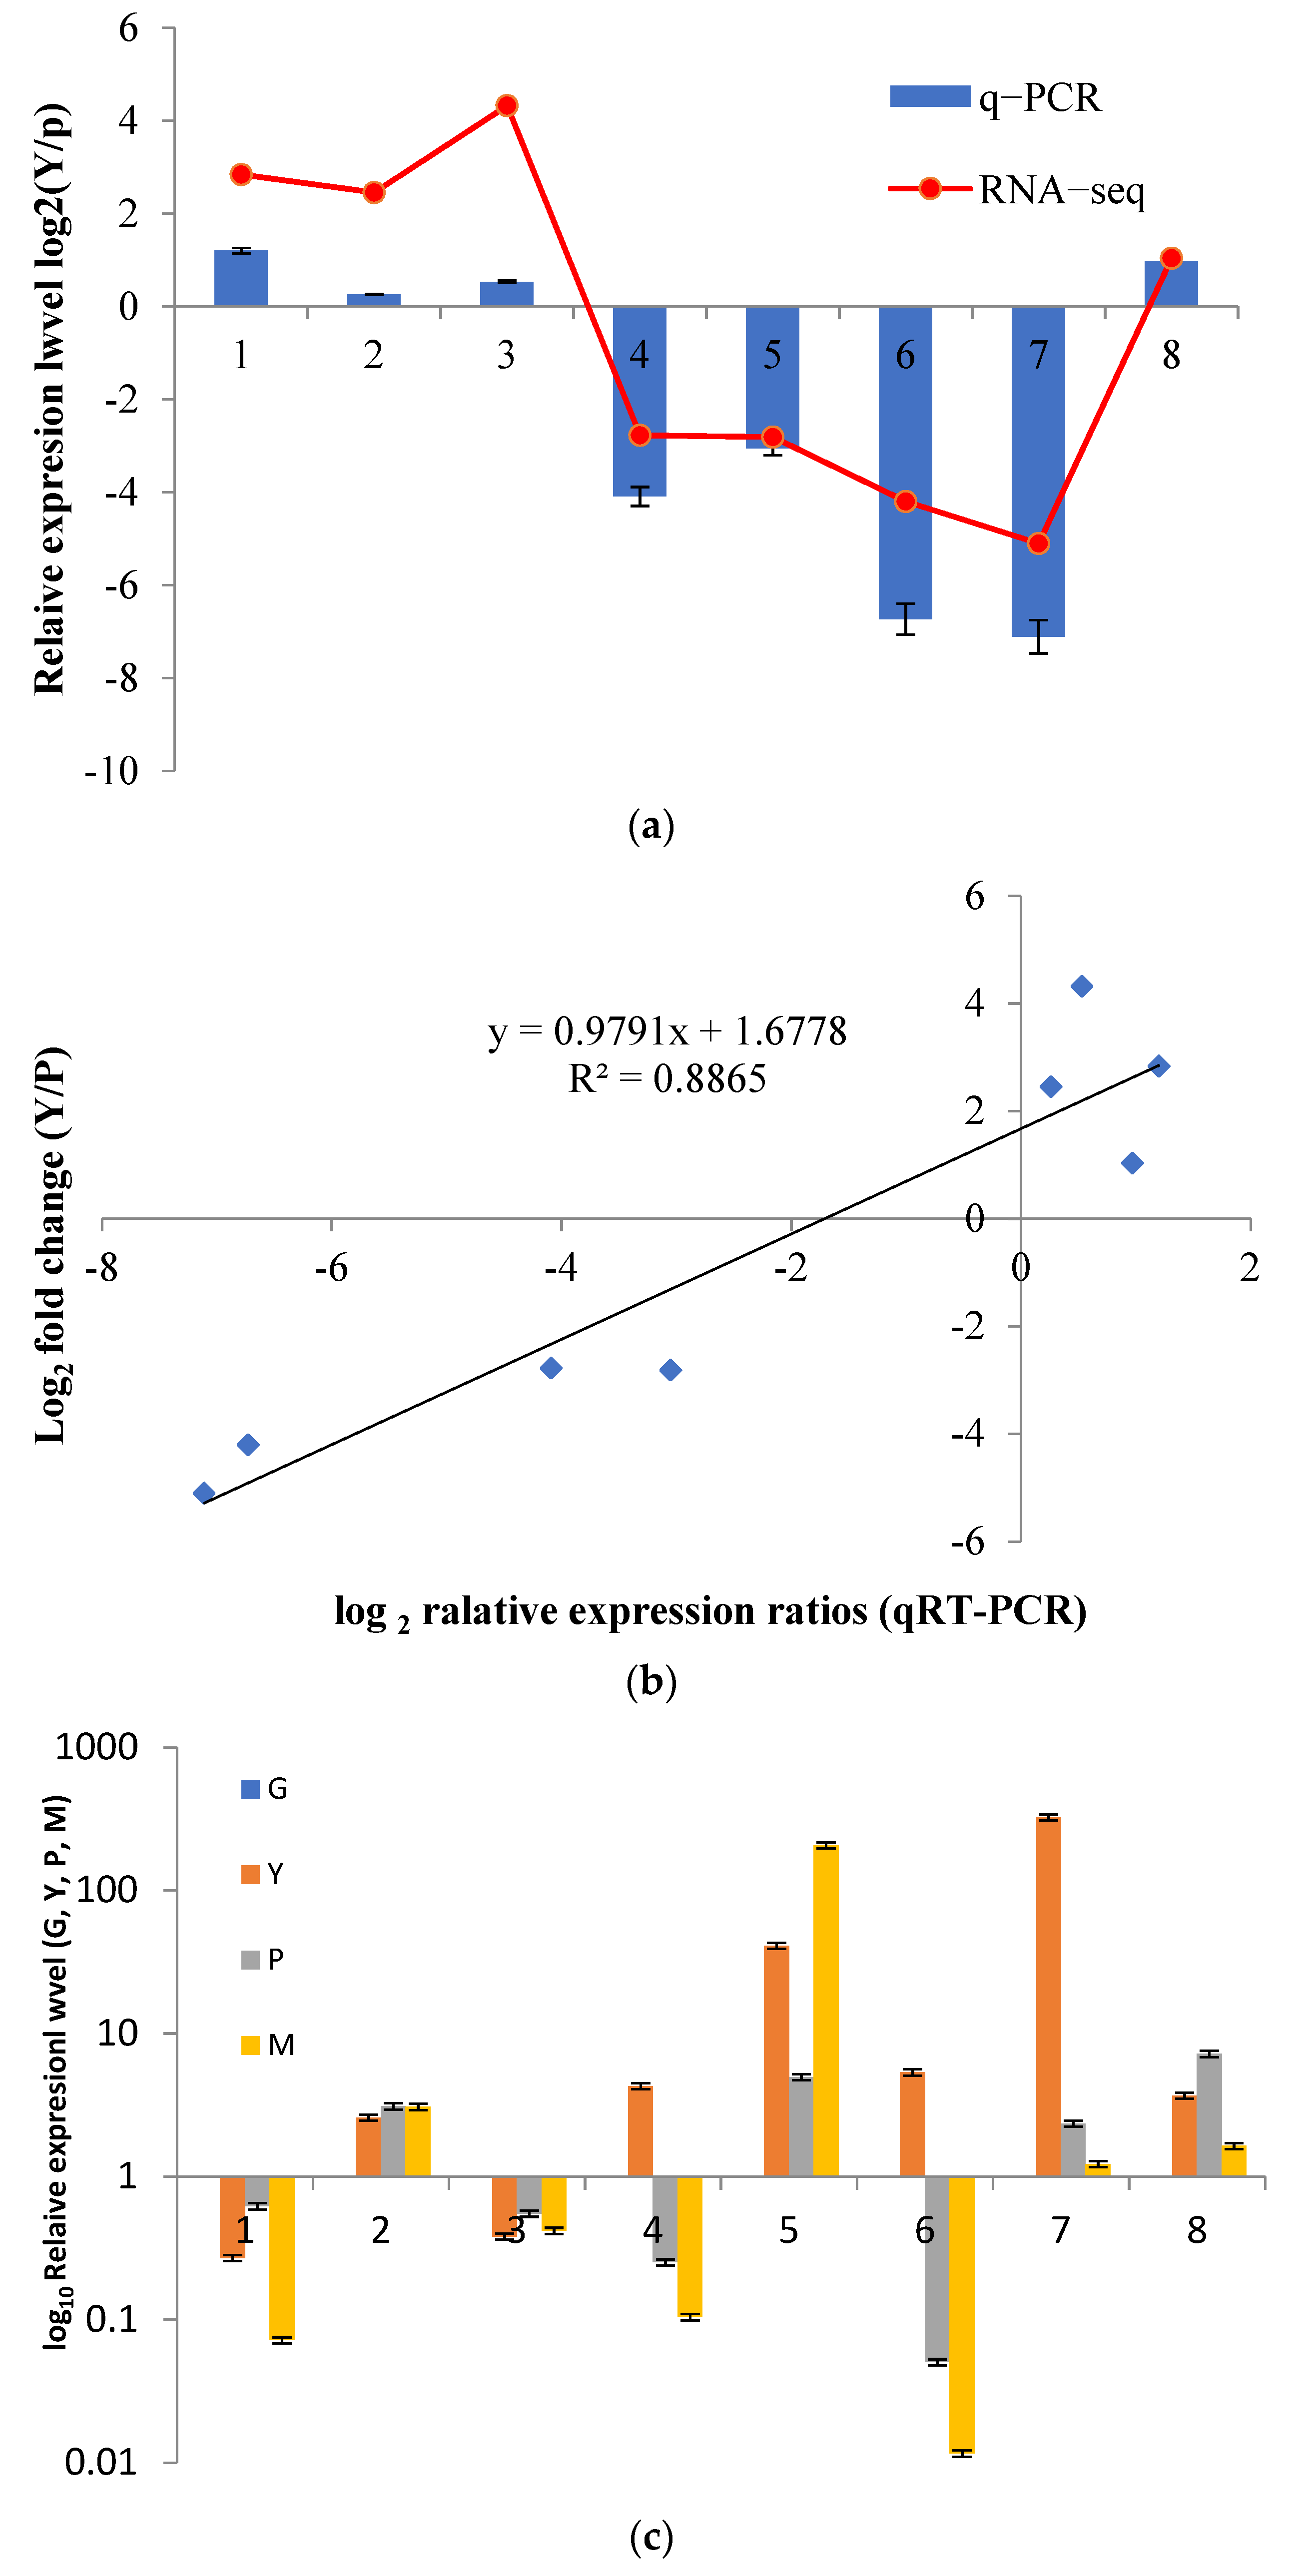
KEGG enrichment analysis identified 69 genes related to flavonoid biosynthesis in the bark and leaves. Based on the sequence alignment, the 69 genes were divided into 12 structural gene classes related to flavonoid biosynthesis (Table S7), among which most belonged to flavone-4-reductases (DFR). However, some genes were related to flavanone 3-hydroxylase (FHT), phenyl alanine ammonia lyase (PAL), and flavonoid-3′-monooxygenase (F3′H). Further analysis of the relative expression of the 69 flavonoids showed that there were differences in the expression of the 49 flavonoid synthase (FNS) genes between the bark and leaves, most of which were highly expressed in the leaves, and only 8 had higher expression in the bark. CDL12_26055, DL12_11939, gene-CDL12_13773, CDL12_12704, CDL12_18918, H_newGene_184, and CDL12_24374 were the most downregulated genes related to flavonoid synthesis in the bark and leaves. The upregulated genes were H_newGene_7916 and H_newGene_2602. These results indicate that the synthesis of flavonoids in the leaves and bark is regulated by the expression of specific genes.

3.7. qRT-PCR

qRT-PCR was performed to determine the expression patterns of eight key DEGs involved in flavonoid biosynthesis pathways in the bark and leaves (Figure 8a). The expression patterns of the eight genes were consistent with the transcriptome data. Additionally, the Pearson’s correlation coefficient of the relationship between the qRT-PCR and RNA-seq data was 0.8865 (Figure 8b), indicating that the RNA-seq data were reliable.
Furthermore, qRT-PCR was performed to determine the relative expression levels of eight flavonoid biosynthesis genes in the roots, leaves, bark, and xylem (Figure 8c). The roots had higher expression levels of H_newGene_3959 and H_newGene_3324 compared with other organs. However, the leaves had higher expression levels of CDL12_23925, CDL12_22415, and CDL12_13017, while the bark had higher expression levels of CDL12_07551. Additionally, the xylem had a higher expression of CDL12_17805 compared with other organs.

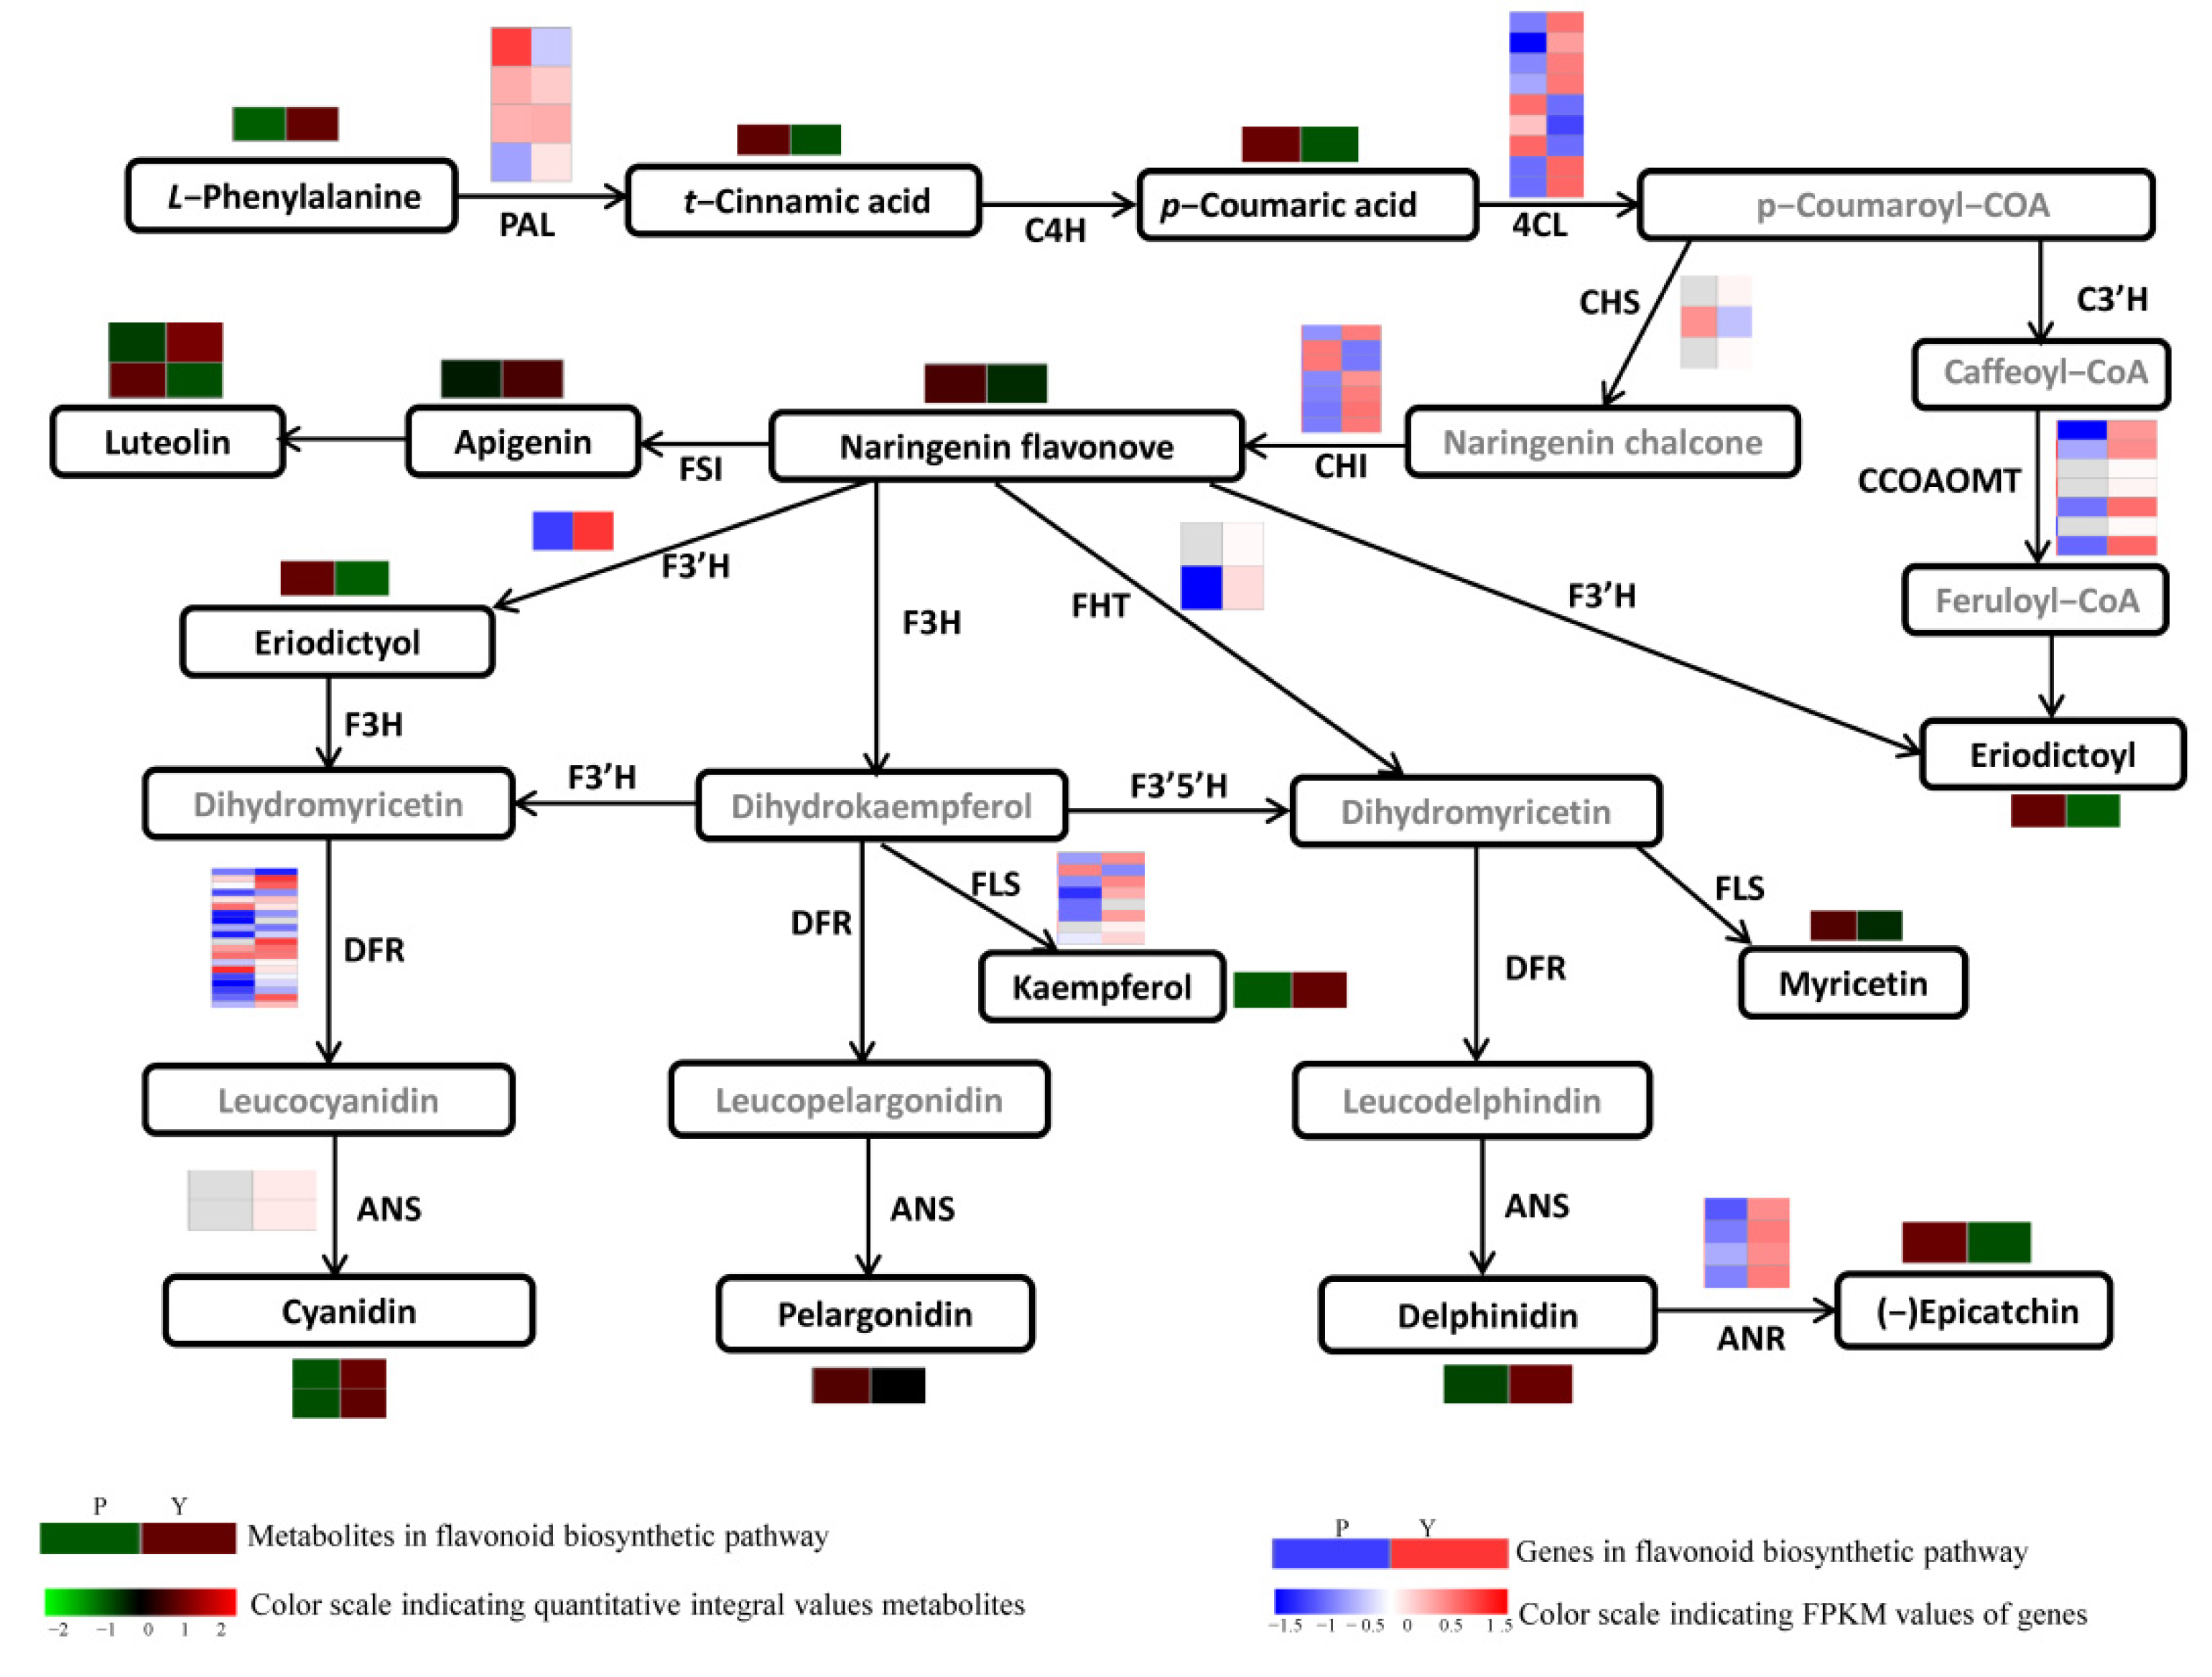
3.8. Regulatory Network of Flavonoid Biosynthesis

A network diagram was generated for the correlation between DEGs and DAMs in the flavonoid biosynthesis pathway of H. chrysantha (Figure 9). There are two categories of functional enzyme genes in the flavonoid biosynthesis pathway: the early biosynthase catalyzes the synthesis of functional enzymes in the flavonoid biosynthesis pathway. Early biological synthetases catalyze the synthesis of all flavonoids, and late biological synthetases catalyze the synthesis of anthocyanins [54]. First, some PAL, 4-coumaric acid coenzyme A (4CL), and chalcone synthase (CHS) genes in the early flavonoid synthesis stage were accumulated in leaves, and others were accumulated in bark; caffeoyl-CoA O-methyltransferase (CCOAOMT) was accumulated only in leaves, and F3′H, FHT, flavonol synthase (FLS), flavanone 4-reductase (DFR), anthocyanin synthetase (ANS), and anthocyanin reductase (ANR) were mainly accumulated in leaves in later stages of the flavonoid synthesis. In the early stage of flavonoid synthesis, metabolites of phenylalanine accumulated in leaves, and cinnamic acid and coumaric acid accumulated in bark. In the downstream stage, delphinidin 3-rutinoside, cyanidin 3-glucoside, cyanidin 3-rutinoside, and kaempferol accumulated in leaves, and eriodictyol, epicatechin, myricetin, luteolin, and cinnamaldehyde accumulated in bark.
The correlation analysis of the regulatory networks (Table S8) showed that 20 DEGs were strongly correlated with seven DAMs (r > 0.9). Some genes were positively correlated with the metabolites, whereas others were negatively correlated (Figure 10), indicating that the DEGs were involved in regulating the biosynthesis of flavonoids. In contrast, CDL12_17225 negatively regulated kaempferol, while the remaining 19 genes simultaneously regulated multiple metabolites, among which three genes (H_newGene_3324, CDL12_16005 (FLS), and H_newGene_3959 (HST)) positively regulated multiple metabolites. The increased expression of DEGs in leaves increased the metabolites in the flavonoid synthesis pathway. Additionally, CDL12_11939 (CHS), CDL12_24374 (F3′H), CDL12_26251 (CHI), CDL12_10570 (CHS), H_newGene_7465 (ANR), CDL12_03315 (FNS), and CDL12_03316 (FNS) negatively regulated multiple metabolites. The remaining nine genes both positively and negatively regulated multiple metabolites. Combined metabolomic and transcriptomic analysis showed that the DEGs were involved in regulating flavonoid biosynthesis in the bark and leaves of H. chrysantha.

4. Discussion

The Handroanthus and Tabebuia species are popular for their ornamental flowers and are used for landscaping gardens and streets. Apart from their ornamental value, the trees also possess several medicinal properties, including anti-inflammatory and anti-cancer properties. In the present study, combined transcriptomic and metabolomic analyses were performed to elucidate the biosynthesis of metabolites in the bark and leaves of H. chrysantha. Specifically, key genes regulating flavonoid biosynthesis were identified. Metabolomics analysis showed a distinct divergence in the metabolites in the bark and leaf tissues, indicating that the composition of secondary metabolites was significantly different between the bark and leaves (Figure 1). The main secondary metabolites in the bark and leaves of H. chrysantha were flavonoids, coumarins, phenylpropanoids, and benzoic acid. Previous studies have reported that the main secondary metabolites in the Handroanthus and Tabebuia species are quinones, benzoic acid, flavonoids, cyclopentadienal, coumarins, iridoids, and phenolic glycosides [55,56,57,58]. Warashina et al. [59] detected 19 glycosides in the bark and wood of T. imperitiginose, including 4 iridoids, 2 lignan glycosides, 2 isocoumarin glycosides, 3 phenylethanol glycosides, and 8 phenolic glycosides. In this study, a total of 14 glycosides, including 10 flavonoid glycosides, 1 coumarin glycoside, 1 terpene glycoside, 1 acyl glycoside, and 1 steroidal glycoside, were detected in the bark and leaves of H. chrysantha. Pires et al. [16] identified fatty acids, especially oleic acid, palmitic acid, and linoleic acid, in the bark of T. imperitiginose. Similarly, oleic acid, palmitic acid, and linoleic acid were identified in the bark of H. chrysantha in the present study. The contents of flavonoids, phenylpropionic acid, coumarin, cinnamic acid, and other active components in the bark and leaf tissues of H. chrysantha were high, indicating that the bark and leaves had considerable medicinal value. Additionally, 4-methoxybenzaldehyde, which has antioxidant activity, was detected in the present study, consistent with previous findings [60]. Cyclopentene derivatives are secondary metabolites of plants and may have significant anti-inflammatory effects on lipopolysaccharides [61]. However, only one cyclopentene nucleoside was detected in the present study. Benzoic acid compounds can be used for treating fungal infections, such as tinea manus and pedis, tinea corporis, and tinea versicolor. In the present study, 12 benzoic acid metabolites were detected in the bark and leaves of H. chrysantha, all of which were highly expressed in the leaves, except for p-anilic acid.
Flavonoids are important secondary metabolites of plants, and 4000 types of flavonoids have been identified in plants [62]. Flavonoids possess several pharmacological effects, such as anti-oxidant, anti-inflammatory, anti-tumor, antibacterial, antiviral, and analgesic effects [63,64,65]. Notably, quercetin relieves cough, asthma, detumescence, and diuresis and improves immunity [66,67]. In this study, quercetin and 3-O-methylquercetin were detected in the bark and leaves. Silybin is an anticancer and chemo-preventive compound which inhibits cell proliferation and migration [68,69]. Kaempferol has inhibitory effects against Salmonella typhi, Staphylococcus aureus, and Shigella. Luteolin possess anti-inflammatory, antibacterial, anti-allergic, anti-tumor, anti-virus, and other pharmacological activities and can be used to treat cough, cardiovascular diseases, hepatitis, and other diseases. In the present study, the bark had higher contents of the flavonoids highlighted above compared with the leaves.
Presently, there are no relevant reports on flavonoid anabolism-related enzyme genes in H. chrysantha. In this study, 12 classes of 69 key enzyme genes related to flavonoid synthesis were reported. Additionally, 49 genes involved in flavonoid biosynthesis were significantly expressed in the bark and leaves of H. chrysantha, among which 8 were upregulated in the bark. These results indicated that the accumulation of flavonoids in the bark and leaves of H. chrysantha was regulated by the expression of flavonoid-related genes.
As secondary metabolites are effective components of medicinal plants, their biosynthesis is closely related to the expression of structural genes and TFs [70]. The active expression of synthetases is regulated by TFs and other regulatory genes, among which the transcriptional activation of synthetic factors is an important regulatory link in plant secondary metabolism [71]. Previous studies have identified TFs belonging to different families (MYB, MYC (bHLH), bZIP, WD40) involved in flavonoid biosynthesis in maize, Arabidopsis, Petunia, rice, and other crops [72,73,74,75]. However, further studies are necessary to elucidate the mechanism of these TFs in flavonoid synthesis in H. chrysantha.
Integrative transcriptomic and metabolomic analysis could help in identifying the biosynthesis pathways of metabolites with pharmacological importance. In the present study, 20 DEGs were strongly correlated with 7 DAMs; moreover, some genes exhibited varying relationships with the metabolites. Furthermore, the integrative transcriptomic and metabolomic analysis of genes regulating the synthesis of metabolites could help in identifying the biological phenotypes of plant species at the molecular level.

5. Conclusions

In summary, metabolome analysis identified 48 flavonoids in the leaves and bark of H. chrysantha, including anthocyanins, flavones, flavanols, isoflavones, and chalcones. Transcriptomic analysis identified DEGs in the leaves and bark involved in flavonoid synthesis, including H_newGene_3959, H_newGene_3324, CDL12_23925, CDL12_22415, CDL12_13017, CDL12_07551, and CDL12_17805. Integrative transcriptome and metabolome analysis identified key genes and pathways involved in flavonoid synthesis in the bark and leaves of H. chrysantha. Notably, 20 DEGs were strongly correlated with 7 DAMs. However, further studies are necessary to elucidate the specific role of some genes and TFs in the flavonoid biosynthesis pathway. Overall, these findings contribute to the understanding of the underlying mechanisms of flavonoid biosynthesis in H. chrysantha and may serve as a theoretical basis for breeding plants for specific medicinal components.

Supplementary Materials

The following are available online at https://www.mdpi.com/article/10.3390/f13081285/s1, Table S1: Details of the primers of 8 genes involved in flavonoid synthesis; Table S2: KEGG pathway enrichment of metabolites in the bark and leaves of H. chrysantha; Table S3: Flavonoid biosynthesis-related metabolites in the bark and leaves of H. chrysantha; Table S4: Differentially accumulated metabolites involved in flavonoid biosynthesis in the bark and leaves of H. chrysantha; Table S5: Transcription factors expressed in the bark and leaves of H. chrysantha; Table S6: Differentially expressed transcription factors in bark and leaves of H. chrysantha; Table S7: Flavonoid biosynthesis-related genes in the bark and leaves of H. chrysantha; Table S8: Correlation analysis of flavonoid synthesis.

Author Contributions

X.S. and P.Z. conceived and designed the experiments. P.Z. and G.L. performed the experiments. X.S. and Z.W. analyzed the data. X.S. and P.Z. wrote the manuscript. All authors have read and agreed to the published version of the manuscript.

Funding

This work was supported by the Guang Dong Basic and Applied Basic Research Foundation (Project Number: 2019A1515110299) and the Scientific and Technological Achievements in Forestry and Grassland National Promotion Project (Project Number: 2020133108).

Data Availability Statement

The RNA sequencing data were deposited at the Sequence Read Archive (SRA): SRP852684.

Conflicts of Interest

The authors declare no conflict of interest.

References

  1. Alwyn, H. Bignoniaceae: Part II (Tribe Tecomeae). Flora Neotrop. Monogr. 1992, 25, 1–370. [Google Scholar] [CrossRef]
  2. Grose, S.O.; Olmstead, R.G. Evolution of a Charismatic Neotropical Clade: Molecular Phytogeny of Tabebuia S.L. Crescentieae, and Allied Genera (Bignoniaceae). Syst. Bot. 2007, 32, 650–659. [Google Scholar] [CrossRef]
  3. Grose, S.O.; Olmstead, R.G. Taxonomic Revisions in the Polyphyletic Genus Tabebuia S. I. (Bignoniaceae). Syst. Bot. 2009, 32, 660–670. [Google Scholar] [CrossRef]
  4. Kadereit, J. The Families and Genera of Vascular Plants: Volume VII Flowering Plants, Dicotyledons: Lamiales. (Except Acanthaceae Including Avicenniaceae); Springer: Berlin, Germany, 2004; pp. 9–38. [Google Scholar]
  5. George, W.; Derra, l.R. A Tropical Garden Flora; Bishop Museum Press: Honolulu, HI, USA, 2005. [Google Scholar]
  6. Wang, X. Botanical Garden Tree Species of Tabebuia Chrysantha. Guangdong For. Sci. Technol. 2007, 23, 115–116. [Google Scholar] [CrossRef]
  7. Yuan, L.; Wang, S.; Liu, N.; Zhang, Q.; Ren, H.; Lei, Z.; Pan, G.; Luo, J. The Ecological and Biological Characteristics and Sowing Propagation Techniques of Tabebuia chrysantha. Ecol. Sci. 2014, 33, 984–990. [Google Scholar]
  8. Cai, D.; Fang, L.; Shang, X.; Zhang, P. Research Status and Development Prospects of Tabebuia. Eucalypt Sci. Technol. 2016, 33, 46–50. [Google Scholar]
  9. Ana, C.D.S.B.; Maria, L.G.; Joelma, F.D.O.F.; Nasser, R.A.; Eric, H.F.F.F.; Mario, B.F. Effects of a Tabebuia avellanedae Extract and Lapachol on the Labeling of Blood Constituents with Technetium-99M. Sci. Res. Essays 2015, 10, 97–104. [Google Scholar] [CrossRef]
  10. Kim, J.H.; Lee, S.M.; Myung, C.H.; Lee, K.R.; Hyun, S.M.; Lee, J.E.; Park, Y.S.; Jeon, S.R.; Park, J.I.; Chang, S.E.; et al. Melanogenesis Inhibition of β-Lapachone, a Natural Product from Tabebuia avellanedae, with Effective In Vivo Lightening Potency. Arch. Dermatol. Res. 2015, 307, 229–238. [Google Scholar] [CrossRef] [PubMed]
  11. Reis, F.P.; Senna Bonfa, I.M.; Cavalcante, R.B.; Okoba, D.; de Souza Vasconcelos, S.B.; Candeloro, L.; de Oliveira Filiu, W.F.; Duenhas Monreal, A.C.; da Silva, V.J.; Santa Rita, P.H.; et al. Tabebuia Aurea Decreases Inflammatory, Myotoxic and Hemorrhagic Activities Induced by the Venom of Bothrops Neuwiedi. J. Ethnopharmacol. 2014, 158, 352–357. [Google Scholar] [CrossRef] [PubMed]
  12. Koyama, J.; Morita, I.; Tagahara, K.; Hirai, K.J. Cyclopentene Dialdehydes from Tabebuia impetiginosa. Phytochemistry 2000, 53, 869–872. [Google Scholar] [CrossRef]
  13. De Miranda, F.G.; Vilar, J.C.; Alves, I.A.; Cavalcanti, S.C.; Antoniolli, A.R. Antinociceptive and Antiedematogenic Properties and Acute Toxicity of Tabebuia Avellanedae Lor. Ex Griseb. Inner Bark Aqueous Extract. BMC Pharmacol. 2001, 1, 6. [Google Scholar] [CrossRef] [PubMed]
  14. Freitas, A.E.; Moretti, M.; Budni, J.; Balen, G.O.; Fernandes, S.C.; Veronezi, P.O.; Heller, M.; Micke, G.A.; Pizzolatti, M.G.; Rodrigues, A.L. NMDA Receptors and the l-Arginine-Nitric Oxide-Cyclic Guanosine Monophosphate Pathway Are Implicated in the Antidepressant-Like Action of the Ethanolic Extract from Tabebuia Avellanedaein Mice. J. Med. Food 2013, 16, 1030–1038. [Google Scholar] [CrossRef] [PubMed]
  15. Fernandez, A.; Cock, I.E. Tabebuia impetiginosa (Mart. Ex DC. Mattos) Bark Extracts Inhibit the Growth Gastrointestinal Bacterial Pathogens and Potentiate the Activity of Some Conventional Antibiotics. Pharmacogn. Commun. 2020, 10, 75–82. [Google Scholar] [CrossRef]
  16. Pires, T.C.; Dias, M.I.; Calhelha, R.C.; Carvalho, A.M.; Queiroz, M.J.; Barros, L.; Ferreira, I.C. Bioactive Properties of Tabebuia impetiginosa-Based Phytopreparations and Phytoformulations: A Comparison Between Extracts and Dietary Supplements. Molecules 2015, 20, 22863–22871. [Google Scholar] [CrossRef] [PubMed]
  17. Iwamoto, K.; Fukuda, Y.; Tokikura, C.; Noda, M.; Yamamoto, A.; Yamamoto, M.; Yamashita, M.; Zaima, N.; Iida, A.; Moriyama, T. The Anti-obesity Effect of Taheebo (Tabebuia avellanedae Lorentz Ex Griseb) Extract in Ovariectomized Mice and the Identification of a Potential Anti-obesity Compound. Biochem. Biophys. Res. Commun. 2016, 478, 1136–1140. [Google Scholar] [CrossRef] [PubMed]
  18. Dos Santos, E.V.; Carneiro, J.W.; Ferreira, V.F. Quantitative Structure-Activity Relationship in Aziridinyl-1,4-Naphthoquinone Antimalarials: Study of Theoretical Correlations by the PM3 Method. Bioorg. Med. Chem. 2004, 12, 87–93. [Google Scholar] [CrossRef]
  19. Cragg, G.M.; Newman, D.J. Plants as a Source of Anti-cancer Agents. J. Ethnopharmacol. 2005, 100, 72–79. [Google Scholar] [CrossRef]
  20. Byeon, S.E.; Chung, J.Y.; Lee, Y.G.; Kim, B.H.; Kim, K.H.; Cho, J.Y. In Vitro and In Vivo Anti-Inflammatory Effects of Taheebo, a Water Extract from the Inner Bark of Tabebuia avellanedae. J. Ethnopharmacol. 2008, 119, 145–152. [Google Scholar] [CrossRef]
  21. Twardowschy, A.; Freitas, C.S.; Baggio, C.H.; Mayer, B.; dos Santos, A.C.; Pizzolatti, M.G.; Zacarias, A.A.; dos Santos, E.P.; Otuki, M.F.; Marques, M.C. Antiulcerogenic Activity of Bark Extract of Tabebuia Avellanedae, Lorentz Ex Griseb. J. Ethnopharmacol. 2008, 118, 455–459. [Google Scholar] [CrossRef]
  22. Malange, K.F.; Dos Santos, G.G.; Kato, N.N.; Toffoli-Kadri, M.C.; Carollo, C.A.; Silva, D.B.; Portugal, L.C.; Alves, F.M.; Rita, P.H.S.; Parada, C.A.; et al. Tabebuia Aurea Decreases Hyperalgesia and Neuronal Injury Induced by Snake Venom. J. Ethnopharmacol. 2019, 233, 131–140. [Google Scholar] [CrossRef]
  23. Mistrangelo, M.; Cornaglia, S.; Pizzio, M.; Rimonda, R.; Gavello, G.; Dal Conte, I.; Mussa, A. Immunostimulation to Reduce Recurrence after Surgery for Anal Condyloma Acuminata: A Prospective Randomized Controlled Trial. Colorectal Dis. 2010, 12, 799–803. [Google Scholar] [CrossRef] [PubMed]
  24. Jin, Y.; Jeong, K.M.; Lee, J.; Zhao, J.; Choi, S.Y.; Baek, K.S. Development and Validation of an Analytical Method Readily Applicable for Quality Control of Tabebuia impetiginosa (Taheebo) Ethanolic Extract. J. AOAC Int. 2018, 101, 695–700. [Google Scholar] [CrossRef]
  25. Wang, Z.; Gerstein, M.; Snyder, M. RNA-Seq: A Revolutionary Tool for Transcriptomics. Nat. Rev. Genet. 2009, 10, 57–63. [Google Scholar] [CrossRef]
  26. Rai, A.; Saito, K.; Yamazaki, M. Integrated Omics Analysis of Specialized Metabolism in Medicinal Plants. Plant J. 2017, 90, 764–787. [Google Scholar] [CrossRef]
  27. Riaño-Pachón, D.M.; Nagel, A.; Neigenfind, J.; Wagner, R.; Basekow, R.; Weber, E.; Mueller-Roeber, B.; Diehl, S.; Kersten, B. GabiPD: The GABI Primary Database-A Plant Integrative ‘Omics’ Database. Nucleic Acids Res. 2009, 37, D954–D959. [Google Scholar] [CrossRef]
  28. Shen, Q.; Fu, L.; Dai, F.; Jiang, L.; Zhang, G.; Wu, D. Multi-omics Analysis Reveals Molecular Mechanisms of Shoot Adaption to Salt Stress in Tibetan Wild Barley. BMC Genom. 2016, 17, 889. [Google Scholar] [CrossRef]
  29. Villar, M.; Ayllón, N.; Alberdi, P.; Moreno, A.; Moreno, M.; Tobes, R.; Mateos-Hernández, L.; Weisheit, S.; Bell-Sakyi, L.; de la Fuente, J. Integrated Metabolomics, Transcriptomics and Proteomics Identifies Metabolic Pathways Affected by Anaplasma phagocytophilum Infection in Tick Cells. Mol. Cell. Proteom. 2015, 14, 3154–3172. [Google Scholar] [CrossRef]
  30. Vasilev, N.; Boccard, J.; Lang, G.; Grömping, U.; Fischer, R.; Goepfert, S.; Rudaz, S.; Schillberg, S. Structured Plant Metabolomics for the Simultaneous Exploration of Multiple Factors. Sci. Rep. 2016, 6, 37390. [Google Scholar] [CrossRef] [PubMed]
  31. Cai, Y.; Weng, K.; Guo, Y.; Peng, J.; Zhu, Z. An Integrated Targeted Metabolomic Platform for High-Throughput Metabolite Profiling and Automated Data Processing. Metabolomics 2015, 11, 1575–1586. [Google Scholar] [CrossRef]
  32. Dunn, W.B.; Broadhurst, D.; Begley, P.; Zelena, E.; Francis-McIntyre, S.; Anderson, N.; Brown, M.; Knowles, J.D.; Halsall, A.; Haselden, J.N.; et al. Procedures for Large-Scale Metabolic Profiling of Serum and Plasma Using Gas Chromatography and Liquid Chromatography Coupled to Mass Spectrometry. Nat. Protoc. 2011, 6, 1060–1083. [Google Scholar] [CrossRef]
  33. Want, E.J.; Wilson, I.D.; Gika, H.; Theodoridis, G.; Plumb, R.S.; Shockcor, J.; Holmes, E.; Nicholson, J.K. Global Metabolic Profiling Procedures for Urine Using UPLC-MS. Nat. Protoc. 2010, 5, 1005–1018. [Google Scholar] [CrossRef]
  34. Zelena, E.; Dunn, W.B.; Broadhurst, D.; Francis-McIntyre, S.; Carroll, K.M.; Begley, P.; O’Hagan, S.; Knowles, J.D.; Halsall, A.; HUSERMET Consortium; et al. Development of a Robust and Repeatable UPLC-MS Method for the Long-Term Metabolomic Study of Human Serum. Anal. Chem. 2009, 81, 1357–1364. [Google Scholar] [CrossRef] [PubMed]
  35. Want, E.J.; Masson, P.; Michopoulos, F.; Wilson, I.D.; Theodoridis, G.; Plumb, R.S.; Shockcor, J.; Loftus, N.; Holmes, E.; Nicholson, J.K. Global Metabolic Profiling of Animal and Human Tissues via UPLC-MS. Nat. Protoc. 2013, 8, 17–32. [Google Scholar] [CrossRef] [PubMed]
  36. Wang, J.; Zhang, T.; Shen, X.; Liu, J.; Zhao, D.; Sun, Y.; Wang, L.; Liu, Y.; Gong, X.; Liu, Y.; et al. Serum Metabolomics for Early Diagnosis of Esophageal Squamous Cell Carcinoma by UHPLC-QTOF/MS. Metabolomics 2016, 12, 116. [Google Scholar] [CrossRef]
  37. Smith, C.A.; Want, E.J.; O’maille, G.; Abagyan, R.; Siuzdak, G. XCMS: Processing Mass Spectrometry Data for Metabolite Profiling Using Nonlinear Peak Alignment, Matching, and Identification. Anal. Chem. 2006, 78, 779–787. [Google Scholar] [CrossRef] [PubMed]
  38. Kim, D.; Langmead, B.; Salzberg, S.L. HISAT: A Fast Spliced Aligner with Low Memory Requirements. Nat. Methods 2015, 12, 357–360. [Google Scholar] [CrossRef] [PubMed]
  39. Liao, Y.; Smyth, G.K.; Shi, W. Feature Counts: An Efficient General Purpose Program for Assigning Sequence Reads to Genomic Features. Bioinformatics 2014, 30, 923–930. [Google Scholar] [CrossRef] [PubMed]
  40. Trapnell, C.; Williams, B.A.; Pertea, G.; Mortazavi, A.; Kwan, G.; van Baren, M.J.; Salzberg, S.L.; Wold, B.J.; Pachter, L. Transcript Assembly and Quantification by RNA-Seq Reveals Unannotated Transcripts and Isoform Switching During Cell Differentiation. Nat. Biotechnol. 2010, 28, 511–515. [Google Scholar] [CrossRef] [PubMed]
  41. Benjamini, Y.; Hochberg, Y. Controlling the False Discovery Rate: A Practical and Powerful Approach to Multiple Testing. J. R. Stat. Soc. 1995, 57, 289–300. [Google Scholar] [CrossRef]
  42. Young, M.D.; Wakefield, M.J.; Smyth, G.K.; Oshlack, A. Gene Ontology Analysis for RNA-Seq: Accounting for Selection Bias. Genome Biol. 2010, 11, R14. [Google Scholar] [CrossRef] [PubMed]
  43. Mao, X.; Cai, T.; Olyarchuk, J.G.; Wei, L. Automated Genome Annotation and Pathway Identification Using the KEGG Orthology (KO) as a Controlled Vocabulary. Bioinformatics 2005, 21, 3787–3793. [Google Scholar] [CrossRef]
  44. Livak, K.J.; Schmittgen, T.D. Analysis of Relative Gene Expression Data Using Real-Time Quantitative PCR and the 2(-Delta Delta C(T)) Method. Methods 2001, 25, 405–408. [Google Scholar] [CrossRef] [PubMed]
  45. Hauke, J.; Kossowski, T. Comparison of Values of Pearson’s and Spearman’s Correlation Coefficients on the Same Sets of Data. Quaest. Geogr. 2011, 30, 87–93. [Google Scholar] [CrossRef]
  46. Kumari, S.; Nie, J.; Chen, H.S.; Ma, H.; Stewart, R.; Li, X.; Lu, M.Z.; Taylor, W.M.; Wei, H. Evaluation of Gene Association Methods for coexpression Network Construction and Biological Knowledge Discovery. PLoS ONE 2012, 7, e50411. [Google Scholar] [CrossRef]
  47. Rebekić, A.; Lončarić, Z.; Petrović, S.; Marić, S. Pearson’s or Spearman’s Correlation Coefficient-Which One to Use? Poljoprivreda 2015, 21, 47–54. [Google Scholar] [CrossRef]
  48. S Song, T.; Xu, H.; Sun, N.; Jiang, L.; Tian, P.; Yong, Y.; Yang, W.; Cai, H.; Cui, G. Metabolomic Analysis of Alfalfa (Medicago Sativa L.) Root-Symbiotic Rhizobia Responses under Alkali Stress. Front. Plant Sci. 2017, 8, 12. [Google Scholar] [CrossRef] [PubMed]
  49. Kanehisa, M.; Araki, M.; Goto, S.; Hattori, M.; Hirakawa, M.; Itoh, M.; Katayama, T.; Kawashima, S.; Okuda, S.; Tokimatsu, T.; et al. KEGG for Linking Genomes to Life and the Environment. Nucleic Acids Res. 2008, 36, D480–D484. [Google Scholar] [CrossRef] [PubMed]
  50. Lepiniec, L.; Debeaujon, I.; Routaboul, J.M.; Baudry, A.; Pourcel, L.; Nesi, N.; Caboche, M. Genetics and Biochemistry of Seed Flavonoids. Annu. Rev. Plant Biol. 2006, 57, 405–430. [Google Scholar] [CrossRef] [PubMed]
  51. Ren, W.; Qiao, Z.; Wang, H.; Zhu, L.; Zhang, L. Flavonoids: Promising Anticancer Agents. Med. Res. Rev. 2003, 23, 519–534. [Google Scholar] [CrossRef] [PubMed]
  52. Cushnie, T.P.T.; Lamb, A.J. Antimicrobial Activity of Flavonoids. Int. J. Antimicrob. Agents 2005, 26, 343–356. [Google Scholar] [CrossRef]
  53. Ji, X.; Ren, J.; Lang, S.; Wang, D.; Zhu, L.; Song, X. Differential Regulation of Anthocyanins in Cerasus humilis Fruit Color Revealed by Combined Transcriptome and Metabolome Analysis. Forests 2020, 11, 1065. [Google Scholar] [CrossRef]
  54. Shen, Z.; Xu, Y.; Xia, B.; Li, J. Transcription Factors Involved in Plant Flavonoid Biosynthesis of Secondary Metabolism and Its Application in Genetic Engineering. Mol. Plant Breed. 2008, 16, 542–548. [Google Scholar] [CrossRef]
  55. Sharma, P.K.; Khanna, R.N.; Rohatgi, B.K.; Thomson, R.H. Tecomaquinone-III: A New Quinone from Tabebuia pentaphylla. Phytochemistry 1988, 27, 632–633. [Google Scholar] [CrossRef]
  56. Manners, G.D.; Jurd, L. A New Naphthaquinone from Tabebuia guayacan. Phytochemistry 1976, 15, 225–226. [Google Scholar] [CrossRef]
  57. Blatt, C.T.T.; Salatino, A.; Salatino, M.L.F. Flavonoids of Tabebuia caraiba (Bignoniaceae). Biochem. Syst. Ecol. 1996, 24, 89. [Google Scholar] [CrossRef]
  58. Wagner, H.; Kreher, B.; Lotter, H.; Hamburger, M.O.; Cordell, G.A. Structure Determination of New Isomeric Naphtho [2,3-b] Furan-4,9-Diones from Tabebuia Avellanedae by the Selective-INEPT Technique. Helv. Chim. Acta 1989, 72, 659–667. [Google Scholar] [CrossRef]
  59. Warashina, T.; Nagatani, Y.; Noro, T. Constituents from the Bark of Tabebuia impetiginosa. Phytochemistry 2004, 65, 2003–2011. [Google Scholar] [CrossRef] [PubMed]
  60. Park, B.S.; Lee, K.G.; Shibamoto, T.; Lee, S.E.; Takeoka, G.R. Antioxidant Activity and Characterization of v Olatile Constituents of Taheebo (Tabebuia impetiginosa Martius Ex DC). J. Agric. Food Chem. 2003, 51, 295–300. [Google Scholar] [CrossRef]
  61. Zhang, L.; Hasegawa, I.; Ohta, T. Anti-Inflammatory Cyclopentene Derivatives from the Inner Bark of Tabebuia Avellanedae. Fitoterapia 2016, 109, 217–223. [Google Scholar] [CrossRef]
  62. Yonekura-Sakakibara, K.; Higashi, Y.; Nakabayashi, R. The Origin and Evolution of Plant Flavonoid Metabolism. Front. Plant Sci. 2019, 10, 943. [Google Scholar] [CrossRef] [PubMed]
  63. Cassidy, A.; Minihane, A.M. The Role of Metabolism (and the Microbiome) in Defining the Clinical Efficacy of Dietary Flavonoids. Am. J. Clin. Nutr. 2017, 105, 10–22. [Google Scholar] [CrossRef] [PubMed]
  64. Nakayama, T.; Takahashi, S.; Waki, T. Formation of Flavonoid Metabolons: Functional Significance of Protein-Protein Interactions and Impact on Flavonoid Chemodiversity. Front. Plant Sci. 2019, 10, 821. [Google Scholar] [CrossRef]
  65. Farzaei, M.H.; Singh, A.K.; Kumar, R.; Croley, C.R.; Pandey, A.K.; Coy-Barrera, E.; Kumar Patra, J.; Das, G.; Kerry, R.G.; Annunziata, G.; et al. Targeting Inflammation by Flavonoids: Novel Therapeutic Strategy for Metabolic Disorders. Int. J. Mol. Sci. 2019, 20, 4957. [Google Scholar] [CrossRef] [PubMed]
  66. Russo, M.; Spagnuolo, C.; Tedesco, I.; Bilotto, S.; Russo, G.L. The Flavonoid Quercetin in Disease Prevention and Therapy: Facts and Fancies. Biochem. Pharmacol. 2012, 83, 6–15. [Google Scholar] [CrossRef]
  67. Bischoff, S.C. Quercetin: Potentials in the Prevention and Therapy of Disease. Curr. Opin. Clin. Nutr. Metab. Care 2008, 11, 733–740. [Google Scholar] [CrossRef] [PubMed]
  68. Ramasamy, K.; Dwyer-Nield, L.D.; Serkova, N.J.; Hasebroock, K.M.; Tyagi, A.; Raina, K.; Singh, R.P.; Malkinson, A.M.; Agarwal, R. Silibinin Prevents Lung Tumorigenesis in Wild-Type but Not in iNOS-/-Mice: Potential of Real-Time Micro-CT in Lung Cancer Chemoprevention Studies. Clin. Cancer Res. 2011, 17, 753–761. [Google Scholar] [CrossRef]
  69. Tyagi, A.; Agarwal, C.; Harrison, G.; Glode, L.M.; Agarwal, R. Silibinin Causes Cell Cycle Arrest and Apoptosis in Human Bladder Transitional Cell Carcinoma Cells by Regulating CDKI-CDK-Cyclin Cascade, and Caspase 3 and PARP Cleavages. Carcinogenesis 2004, 25, 1711–1720. [Google Scholar] [CrossRef] [PubMed]
  70. Su, J. Transcriptomic and Metabolomics Analysis Reveals the Biosynthesis and Distribution of Active Ingredients in Nanhaia speciosa; Guangzhou University of Chinese Medicine: Guangzhou, China, 2021; pp. 5–7. [Google Scholar]
  71. Spitz, F.; Furlong, E.E. Transcription Factors: From Enhancer Binding to Developmental Control. Nat. Rev. Genet. 2012, 13, 613–626. [Google Scholar] [CrossRef] [PubMed]
  72. Mathews, H.; Clendennen, S.K.; Caldwell, C.G.; Liu, X.L.; Connors, K.; Matheis, N.; Schuster, D.K.; Menasco, D.J.; Wagoner, W.; Lightner, J.; et al. Activation Tagging in Tomato Identifies a Transcriptional Regulator of Anthocyanin Biosynthesis, Modification, and Transport. Plant Cell 2003, 15, 1689–1703. [Google Scholar] [CrossRef]
  73. Goodrich, J.; Carpenter, R.; Coen, E.S. A Common Gene Regulates Pigmentation Pattern in Diverse Plant Species. Cell 1992, 68, 955–964. [Google Scholar] [CrossRef]
  74. Sagasser, M.; Lu, G.H.; Hahlbrock, K.; Weisshaar, B.A.A. Tshaliana TRANSPARENT TESTA 1 Is Involved in Seed Coat Development and Defines the WIP Subfamily of Plant Zinc Finger Proteins. Genes Dev. 2002, 16, 138–149. [Google Scholar] [CrossRef]
  75. Selinger, D.A.; Chandler, V.L. A Mutation in the Pale Aleurone color1 Gene Identifies a Novel Regulator of the Maize Anthocyanin Pathway. Plant Cell 1999, 11, 5–14. [Google Scholar] [CrossRef] [PubMed]
Figure 1. Multivariate statistical analysis of metabolites in the P (bark) and Y (leaves) of H. chrysantha. (a) PCA score map of metabolites in the P and Y samples. (b) Heatmap of metabolites in the P and Y samples. (c) OPLS-DA model diagram of differential metabolites in the P and Y samples. (d) Volcanic map of differential metabolites in the P and Y samples. Red dots represent upregulated metabolites, blue dots represent down-regulated metabolites, and gray dots represent unchanged metabolites.
Forests 13 01285 g001
Figure 2. KEGG enrichment pathway of different metabolites of the bark (P) and leaves (Y) of H. chrysantha. (a) KEGG differential metabolite classification diagram. The ordinate is the name of the KEGG metabolic pathway, and the abscissa is the number of metabolites annotated by this pathway and its proportion compared with the total number of metabolites annotated. (b) Scatter diagram of the enrichment of differential metabolites in KEGG pathways.
Forests 13 01285 g002
Figure 3. Heat maps of flavonoid biosynthesis metabolites in the bark (P) and leaves (Y) of H. chrysantha. Blue, white, and red indicate low, intermediate, and high expression, respectively.
Forests 13 01285 g003
Figure 4. Volcano map of DEGs. The abscissa is the change in gene expression (log2FC), and the ordinate is the significance level of differentially expressed genes (−log10 FDR). The expression of green genes was down-regulated, the expression of red genes was up-regulated, and the expression of black genes was not significantly different.
Forests 13 01285 g004
Figure 5. Functional categorization of DEGs with transcriptional changes between P (bark) and Y (leaves) in H. chrysantha.
Forests 13 01285 g005
Figure 6. KEGG enrichment of differentially expressed genes (DEGs) in the bark (P) and leaves (Y) of H. chrysantha. The enrichment factor is the ratio of the proportion of genes annotated in a pathway to the proportion of all annotated genes. The color of the circle represents the q-value, and the smaller the q-value, the more reliable the enrichment value of the DEGs in the pathway. The size of the circle indicates the number of genes enriched in the pathway, and the larger the circle is, the more genes were enriched.
Forests 13 01285 g006
Figure 7. Number of TFs in the top 20 transcription factor families. The x-axis represents the top 20 TFs, and the y-axis represents the number of TFs. The numbers on the red bar indicate the number of upregulated TFs, and the numbers on the green bar indicate the number of downregulated TFs.
Forests 13 01285 g007
Figure 8. qRT-PCR detection of eight key differentially expressed genes. (a) Expression patterns of eight key genes involved in flavonoid biosynthesis. Each column represents the average value of three biological replicates, and the standard error is represented by vertical bars. (b) Pearson’s correlation analysis of the expression patterns of eight genes between qRT−PCR and RNA-seq data. Y: leaf; P: bark. (c) Relative expression level of the eight genes in different tissues. G: root; Y: leaf; P: bark, M: xylem. The numbers 1–8 on the abscissa axis in (a,c) indicate names of the eight genes involved in flavonoid biosynthesis: H_newGene_3959, CDL12_17225, H_newGene_3324, CDL12_23925, CDL12_17805, CDL12_22415, CDL12_13017, and CDL12_07551.
Forests 13 01285 g008
Figure 9. Part of the flavonoid biosynthesis pathway that reveals the different expression levels of related genes and different contents of metabolites.
Forests 13 01285 g009
Figure 10. Correlation analysis of differentially accumulated metabolites (DAMs) and differentially expressed genes (DEGs) involved in flavonoid biosynthesis. Positive correlations are indicated by red lines, and negative correlations are indicated by green lines. Red highlights indicate genes, and green highlights indicate metabolites.
Forests 13 01285 g010
Table 1. Top 20 significantly different metabolites between the bark and leaves of H. chrysantha.
CompoundsFormulaClass1VIPFold-Change (FC)log2FC
Gibberellin A53C20H28O5Isoprenoids1.12568−9.15
SilibininC25H22O10Flavonoids1.08307−8.26
Cucurbitacin BC32H46O8Sterols1.34164−7.35
26-HydroxyecdysoneC27H44O7Sterols1.24155−7.28
WarfarinC19H16O4Coumarins and derivatives1.34131−7.03
ChalconaringeninC15H12O5Flavonoids1.28112−6.81
N-AcetylaspartylglutamateC11H16N2O8Sterols1.1899−6.63
BenzoateC7H6O2Benzenoids1.0586−6.42
PhytosphingosineC18H39NO3Organonitrogen compounds1.0671−6.14
EpicatechinC6H6N2OFlavonoids1.1067−6.06
D-XylonateC5H10O6Organooxygen compounds1.181807.49
GeranylgeraniolC20H34OIsoprenoids1.291827.51
Indoleacetic acidC10H9NO2Indoles and derivatives1.322117.72
Cyanidin 3-glucosideC21H21O11Flavonoids1.002137.74
PrunasinC14H17NO6Benzene and substituted derivatives1.382257.82
Geniposidic acidC16H22O10Isoprenoids1.012788.12
AstringinC20H22O9Aromatic polyketides1.254828.91
Peonidin−3-glucosideC22H23O11Flavonoids1.175149.00
Malvidin 3-glucosideC23H25O12Flavonoids1.34155410.60
Mycophenolic acid O-acyl-glucuronideC23H28O12Organooxygen compounds1.11323911.66
1VIP: Variable importance in projection. VIPs > 1 are considered DAMs.
Publisher’s Note: MDPI stays neutral with regard to jurisdictional claims in published maps and institutional affiliations.

