Article

Similar Pattern of Potential Distribution of Pinus yunnanensis Franch and Tomicusyunnanensis Kirkendall under Climate Change in China

1
College of Big Data and Intelligent Engineering, Southwest Forestry University, Kunming 650224, China
2
College of Further Education, Southwest Forestry University, Kunming 650224, China
*
Author to whom correspondence should be addressed.
Forests 2022, 13(9), 1379; https://doi.org/10.3390/f13091379
Submission received: 22 July 2022 / Revised: 24 August 2022 / Accepted: 26 August 2022 / Published: 29 August 2022

Abstract

:
Tomicus yunnanensis Kirkendall (Coleoptera: Scolytinae) is a stem-boring pest that endangers Pinus yunnanensis Franch (Pinales:Pinoideae), which seriously affects the ecological environment safety in southwest China. In order to understand the potential distribution pattern and change in the potential distribution of P. yunnanensis and T. yunnanensis, this study used the maximum entropy model to predict the distribution of potentially suitable areas for P. yunnanensis and T. yunnanensis and explored the relationships between their different spatiotemporal distributions based on change analysis. The experimental results show that altitude is the main factor restricting the current distribution of P. yunnanensis. The current suitable areas of P. yunnanensis are mainly distributed in Yunnan, Sichuan and Guizhou. The minimum temperature of the coldest month is the main factor affecting the current distribution of T. yunnanensis. The current suitable areas of T. yunnanensis are mainly distributed in Yunnan, Sichuan and Tibet. Under future climate scenarios, the total suitable areas of P. yunnanensis and T. yunnanensis are expected to increase. The suitable areas tend to move to higher altitudes in the west and higher latitudes in the north. At the same time, this study finds that there is an obvious bottleneck of expansion to northeastern Sichuan near the Daba Mountains. The results of intersection analysis showed that, with future climate change, P. yunnanensis and T. yunnanensis mainly showed lowly suitable (or unsuitable)—lowly suitable (or unsuitable) to moderately (or highly) suitable—and moderate (or high) variation patterns of suitable areas under the SSP1-2.6 climate scenario. These results will provide an important basis for the breeding of P. yunnanensis and controlling T. yunnanensis.

1. Introduction

Global climate change has seriously affected forests with different biomes and ecosystems’ stability, which is one of the crucial factors that affect the distribution of species and causes huge economic losses. According to the Sixth Assessment Report (AR6) “Climate Change 2021: The Physical Science Basis”, released by the Intergovernmental Panel on Climate Change (IPCC) in August 2021, global warming is expected to continue, with the average Earth’s surface temperature rising by 0.3–4.5 degrees Celsius by 2100 compared to 1986 to 2005 [1]. According to the Blue Book of China Climate Change (2021), released by the Climate Change Center of the China Meteorological Administration, China is a sensitive and significant area of global climate change, and its temperature rise rate is significantly higher than the global average level in the same period. From 1951–2020, China’s annual mean surface temperature has shown a significant upward trend with a rate of 0.26 °C/decade, and the average precipitation has shown an upward trend [2,3]. Previous studies showed [4,5,6] that global climate change, especially the rise of average temperature, posed a serious threat to the sustainability of the global ecosystem and hugely impacted species distribution. The synergistic effect of global climate change, human activities and biological invasions may lead to habitat destruction and increase the risk of species extinction [7]. Land-use changes caused by human activities, such as changes in management practices and land use, lead to habitat fragmentation, which has exerted great impacts on species distribution and climate change in China [8,9]. Balint et al. [10] pointed out that climate change is an important driver of biodiversity loss, habitat fragmentation and species spatial pattern changes. Therefore, understanding species distribution dynamics under climate change is crucial for making conservation plans and assessing the potential impacts of climate change on species migration [11].
Species distribution and richness are important indicators to protect biological diversity under global climate change [12]. Currently, species distribution models (SDMs) have been widely used in studies of species distribution on the impact of climate change, mainly to evaluate species occurrence or richness and spatial distribution [13,14]. SDMs are based on species’ known distribution points and environmental factors, using a mathematical algorithm to construct models, determine the distribution of the species unknown probability and then estimate its distribution in the whole ecological niche space, finally through the distribution of mapping to the study of geographic space for the regional distribution of species of potential [8,15]. At present, commonly used SDMs mainly include the Bioclimate Analysis and Prediction System (BIOCLIM), Ecological Niche Factor Analysis (ENFA), Genetic Algorithm for rule-set Production (GARP) and Maximum Entropy Modeling (MaxEnt) [15]. However, SDMs only consider environmental factors affecting species distribution and lack analysis of interactions between species and prediction of the potential distribution of species [16]. Currently, the MaxEnt model is a commonly used prediction model for species-suitable areas and can obtain good prediction results with few species distribution points. At the same time, the MaxEnt model is simple to operate and has been proven to be the most reliable SDM model [5]. The MaxEnt model has been widely used in agriculture [17,18,19,20], forestry [21,22], fisheries [23,24,25,26], endangered animal and plant protection [27,28,29,30] and pest prediction and control [31,32,33,34].
There are more than 113 formally recognized species of the genus Pinus, mainly distributed in the northern hemisphere; they form an important part of forest ecosystems [35]. Pinus yunnanensis Franch is mainly distributed in Yunnan, Sichuan, Guizhou, Guangxi and Tibet. It is a major timber and afforestation tree species in Yunnan Province, with an area of more than 4.8 million hm2 [36]. Tomicus yunnanensis Kirkendall and Faccoli is a stem-boring pest that harms a variety of pine plants. It is only distributed in Yunnan Province, Guizhou Province, Sichuan Province and other regions of China [37]. It is one of the main pests of P. yunnanensis. It occurs on a large scale every year and continues to spread to Sichuan Province, Guizhou Province and other places, seriously affecting the ecological and environmental security in southwest China [38]. However, there are few studies on the potential distribution relationship between P. yunnanensis and T. yunnanensis under climate change.
Based on the current distribution data of P. yunnanensis and T. yunnanensis, this study intends to use the MaxEnt model to predict the distribution of P. yunnanensis and T. yunnanensis and comparative analysis of suitability classes of potentially suitable areas based on factors such as future climatic conditions, topography and soil. The main contributions of this study are: (1) revealing the dominant environmental factors affecting the growth of P. yunnanensis and T. yunnanensis, (2) modeling the potential adaptation of P. yunnanensis and T. yunnanensis under current and future climate scenarios and (3) exploring the relationship between P. yunnanensis and T. yunnanensis, which provides resources for the breeding and cultivation of P. yunnanensis and the control of T. yunnanensis.

2. Materials and Methods

2.1. Species Occurrence Data and Environmental Factors

The distribution data of P. yunnanensis and T. yunnanensis were mainly collected through the Global Biodiversity Information Facility (https://www.gbif.org/zh/ accessed on 8 June 2022), the National Herbarium Teaching Specimen Resource Sharing Sub-Bank (http://mnh.scu.edu.cn/ accessed on 8 June 2022) and the China Journal Full-text Database (https://www.cnki.net/ accessed on 8 June 2022). After the data were acquired, the latitude and longitude were uniformly converted into a decimal by using the latitude and longitude conversion formula to realize the distribution data and the basic geospatial data. To prevent density distribution between P. yunnanensis and T. yunnanensis, dense distribution points would cause problems, such as the overfitting of the model. In this study, the duplicated data were first removed, and only one record was kept. Second, the distribution data of P. yunnanensis and T. yunnanensis were loaded into ArcGIS (version 10.8) to check for correct identification, and the Spatially Rarefy Occurrence Data for SDMs in the SDM Toolbox was used according to the principle that the distance between P. yunnanensis and T. yunnanensis was greater than 50 m. A total of 74 distribution points of P. yunnanensis and 14 distribution points of T. yunnanensis were finally selected. After the data processing, the distribution data were saved as a CSV file according to the species name, longitude and latitude.
A total of 24 environmental factors in 3 categories that influence the growth of P. yunnanensis and T. yunnanensis were selected for subsequent analysis (Table 1). The climate factors were obtained from the World Climate Database (https://www.worldclim.org/ accessed on 9 June 2022) with a spatial resolution of 2.5 min. The current climate factors used in this study were 19 bioclimatic factors (BIO1-BIO19) from 1970–2000 and elevation variables (ELEV). The soil and vegetation factors came from the National Qinghai–Tibet Plateau Data Science Center (http://data.tpdc.ac.cn/zh-hans/ accessed on 9 June 2022). Soil factors mainly include soil available water content (AWC_CLASS), soil pH (T_PH_H2O) and carbonate or lime content (T_CACO3), and vegetation factors mainly include vegetation type (VEGETATION). Due to the lack of future topographic data on climate change, this study defaults that the national topography will not change during the forecast period [4]. The base map of China came from the National Basic Geographic Information System (http://nfgis.nsdi.gov.cn/ accessed on 9 June 2022).
The future environmental factor variables in this study were selected from the BCC-CSM2-MR model in the World Climate Database. The emission paths were the future climate scenarios of SSP1-2.6 and SSP5-8.5 of shared social economy pathways (SSPs). The BCC-CSM2-MR model came from the Sixth International Coupling Model Comparison Program (CMIP6), which was a climate system model developed by the Beijing Climate Center. It accurately predicts variables such as temperature and precipitation [39]. Future climate forecasts include two periods, 2021–2040 and 2061–2080. All environmental factor variables were converted to ASCII format for MaxEnt analysis.

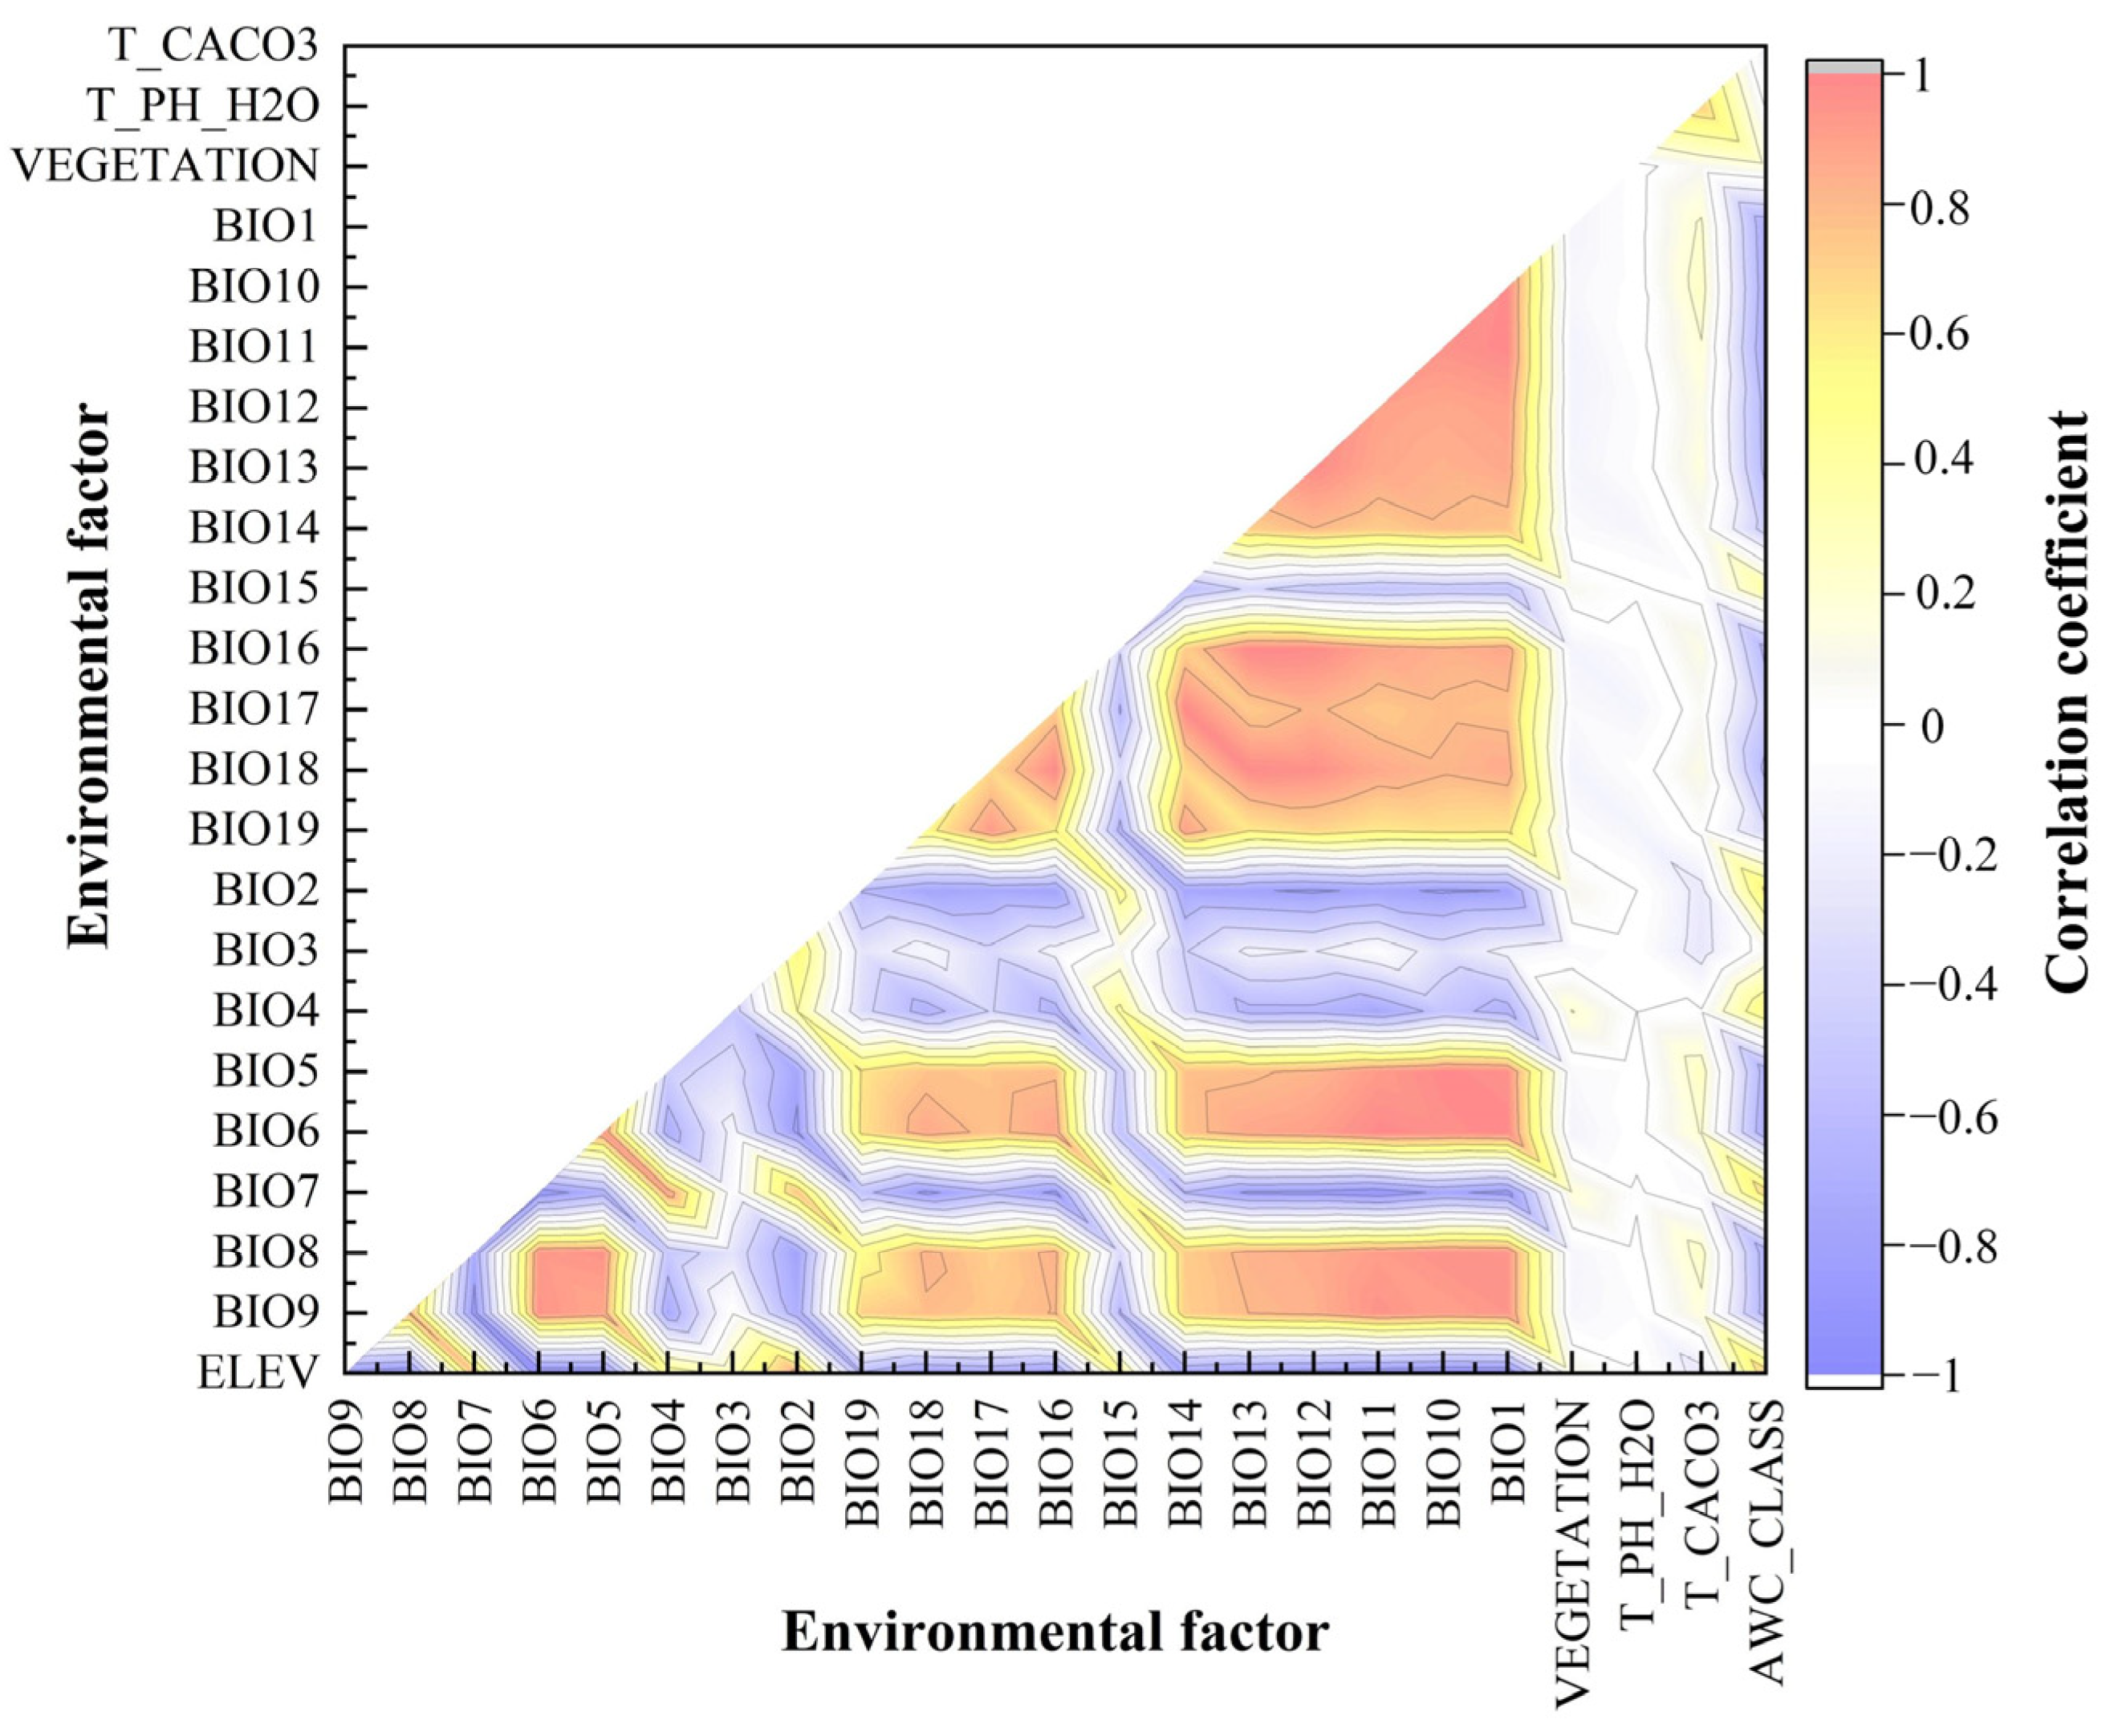
2.2. Environmental Factor Pre-Process

Previous studies have revealed the problem of multicollinearity among variables of environmental factors [21,40,41]. In order to avoid excessive fitting of the model and multiple linear relationships among variables, environmental factors were pretreated in this study. First, the environmental factors with similar properties were removed. Secondly, the Remove Highly Correlated Variables tool in the SDM Toolbox of ArcGIS was used to calculate the correlation among 24 environmental factor variables (Figure 1). If there were two or more environmental factor correlation coefficients |r| ≥ 0.8, the variable with the clearer ecological significance was retained. The filtered factors are shown in Table 1.

2.3. MaxEnt Model Construction and Result Evaluation

Based on the processed samples of P. yunnanensis and T. yunnanensis, the selected environmental factors were input into the MaxEnt model, 75% of the data were randomly selected as the training set for model construction, and the remaining 25% were used as the test set for model evaluation. The model was iterated 10 times, “Bootstrap” was selected for the iteration run type, and the default parameters were used for the others. For potential distribution predictions under future climates, future environmental factor variables need to be entered into the projection layers directory/file column, and 10 iterations were used to average each run.
In this study, the nonparametric estimation of the Jackknife method was used to evaluate the contribution rate of each environmental factor and the receiver operating characteristic (ROC) curve of the influence of each environmental variable on the distribution of P. yunnanensis and T. yunnanensis. The area under the ROC curve (AUC) was used to evaluate the accuracy of model predictions [40,41]. AUC values range from [0.5, 1], and typically, model performance was classified as failing (0.5–0.6), poor (0.6–0.7), fair (0.7–0.8), good (0.8–0.9) or excellent (0.9–1.0). AUC values close to 1 indicated that the model predicts more accurate results [42]. The relative contribution of each environmental factor to the model was evaluated according to the percentage contribution rate of environmental factors output by the MaxEnt model. The dominant environmental factors affected the geographical distribution of P. yunnanensis and T. yunnanensis.
The MaxEnt model estimated the suitable probability (P) of species in each grid in ASCII format, and the value range is [0,1]. First, the *.asc format was converted to raster format by using the conversion tool in ArcGIS. Then the reclassification tool in the analysis tool was used to divide the fitness level, and the maximum training sensitivity and specificity (MaxSS) [43] method was used to determine the threshold (y); when the existence probability of a species in a certain area P < y, it is defined as an unsuitable area. Then the mean value of (1-y) was used to define the lowly suitable areas, the moderately suitable areas and the highly suitable areas. Finally, the reclassification results are saved in raster format. The habitat suitability of P. yunnanensis was divided into unsuitable areas (0–0.2833), lowly suitable areas (0.2833–0.5222), moderately suitable areas (0.5222–0.7611) and highly suitable areas (0.7611–1) according to the definition of suitability grades from low to high. The habitat suitability of T. yunnanensis was divided into unsuitable areas (0–0.2423), lowly suitable areas (0.2423–0.4949), moderately suitable areas (0.4949–0.7475) and highly suitable areas (0.7475–1). Then this study calculated suitable areas under different climate scenarios by using calculated geometry.

2.4. Changes in the Potential Distribution of P. yunnanensis and T. yunnanensis

According to current and two different future climate change scenarios, the geographical distribution maps for current, 2021–2040 and 2061–2080 were created, and the potential distribution maps of P. yunnanensis and T. yunnanensis were compared. With a view to determine the spatial changes in the distribution, the data from different time periods in the raster format were converted into vectors using the raster–vector conversion tool in ArcGIS (Version10.8, Environmental Systems Research Institute Inc., Redlands, CA, USA). Intersection analysis was performed on the vector data to compute and analyze the differences [20,28].

3. Results

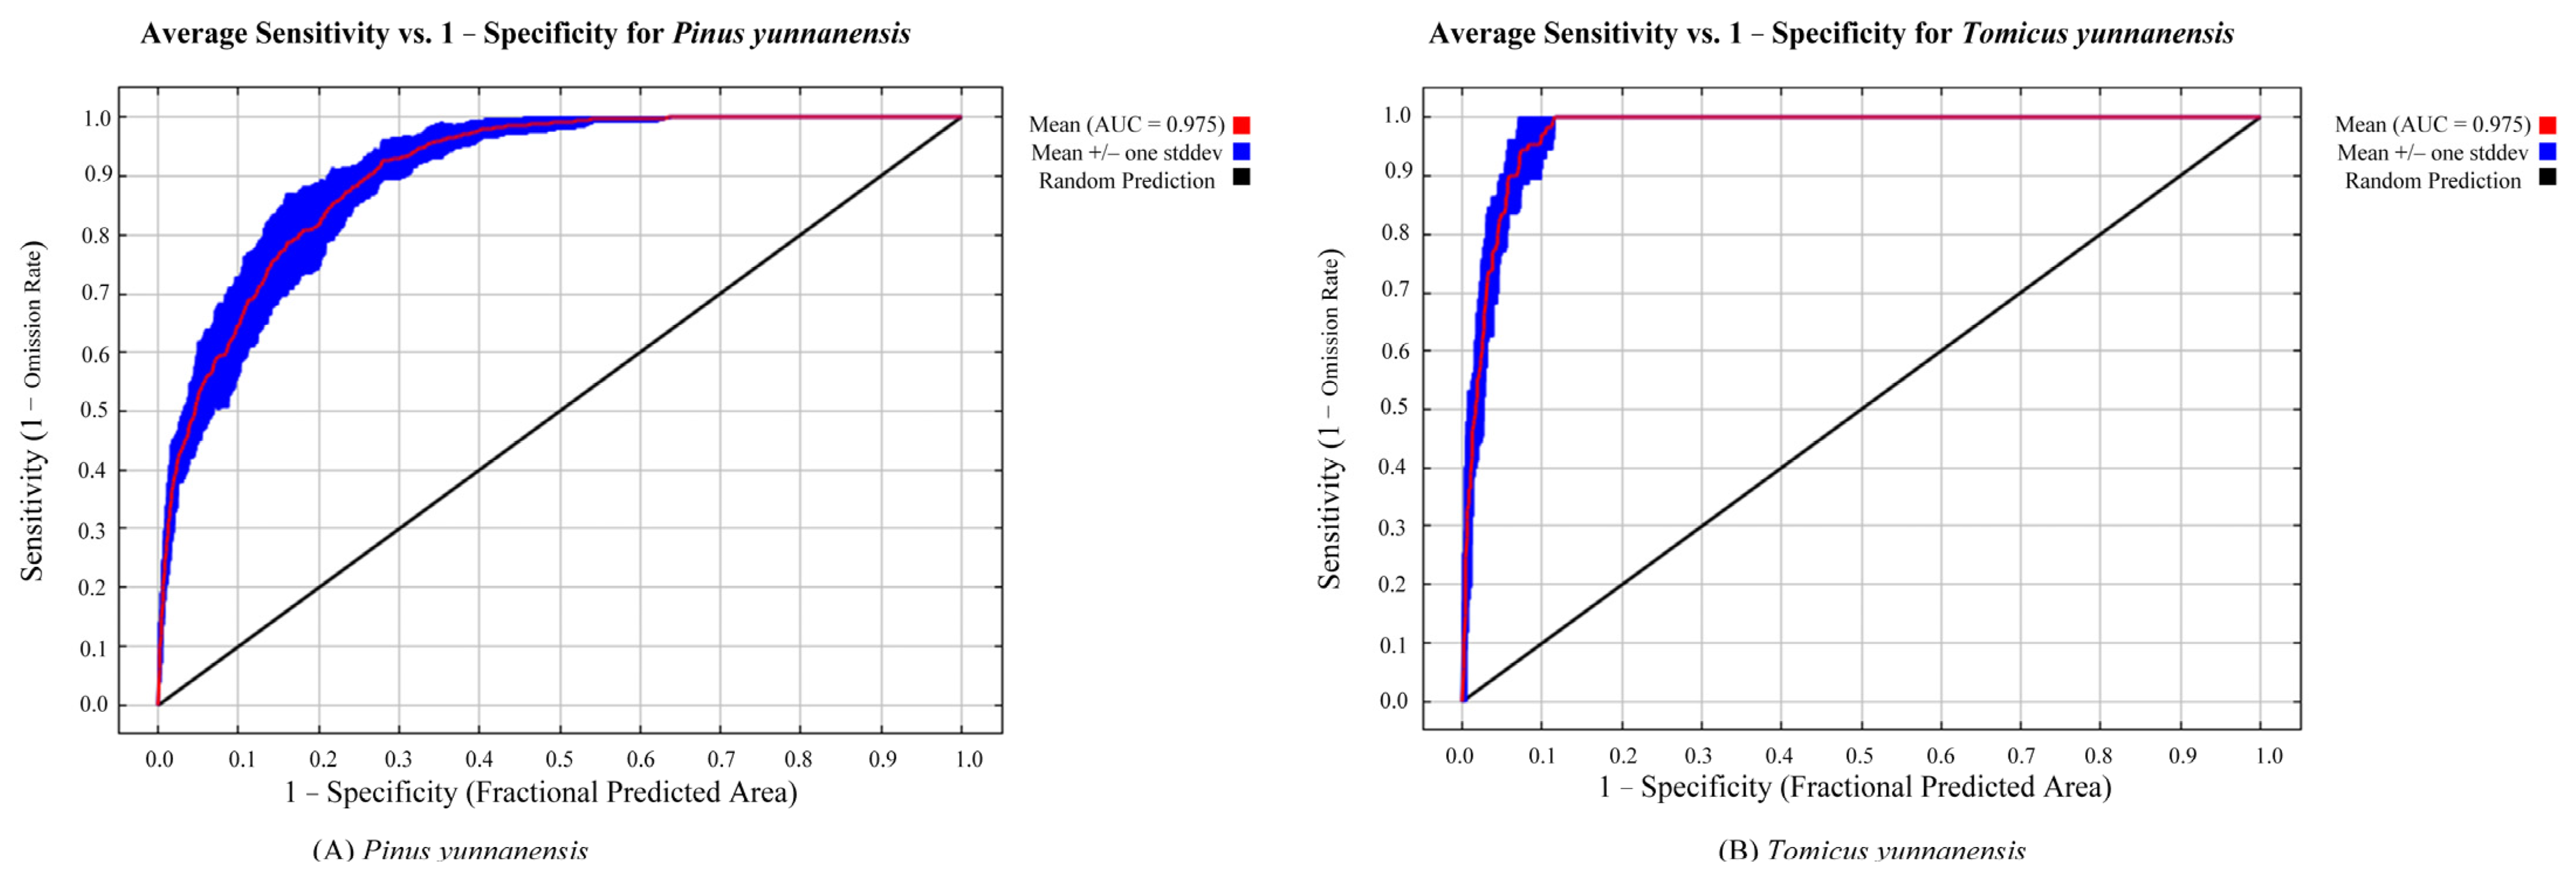
3.1. Model Accuracy Evaluation

The ROC curve was used to test the accuracy of the prediction of suitable areas for P. yunnanensis and T. yunnanensis. The average training AUC of the model, as shown in Figure 2, and the average AUC values are all over 0.9, which indicates that the model has excellent accuracy. Therefore, the MaxEnt (MaxEnt.jar) model can accurately simulate the potential geographic distribution of P. yunnanensis and T. yunnanensis.

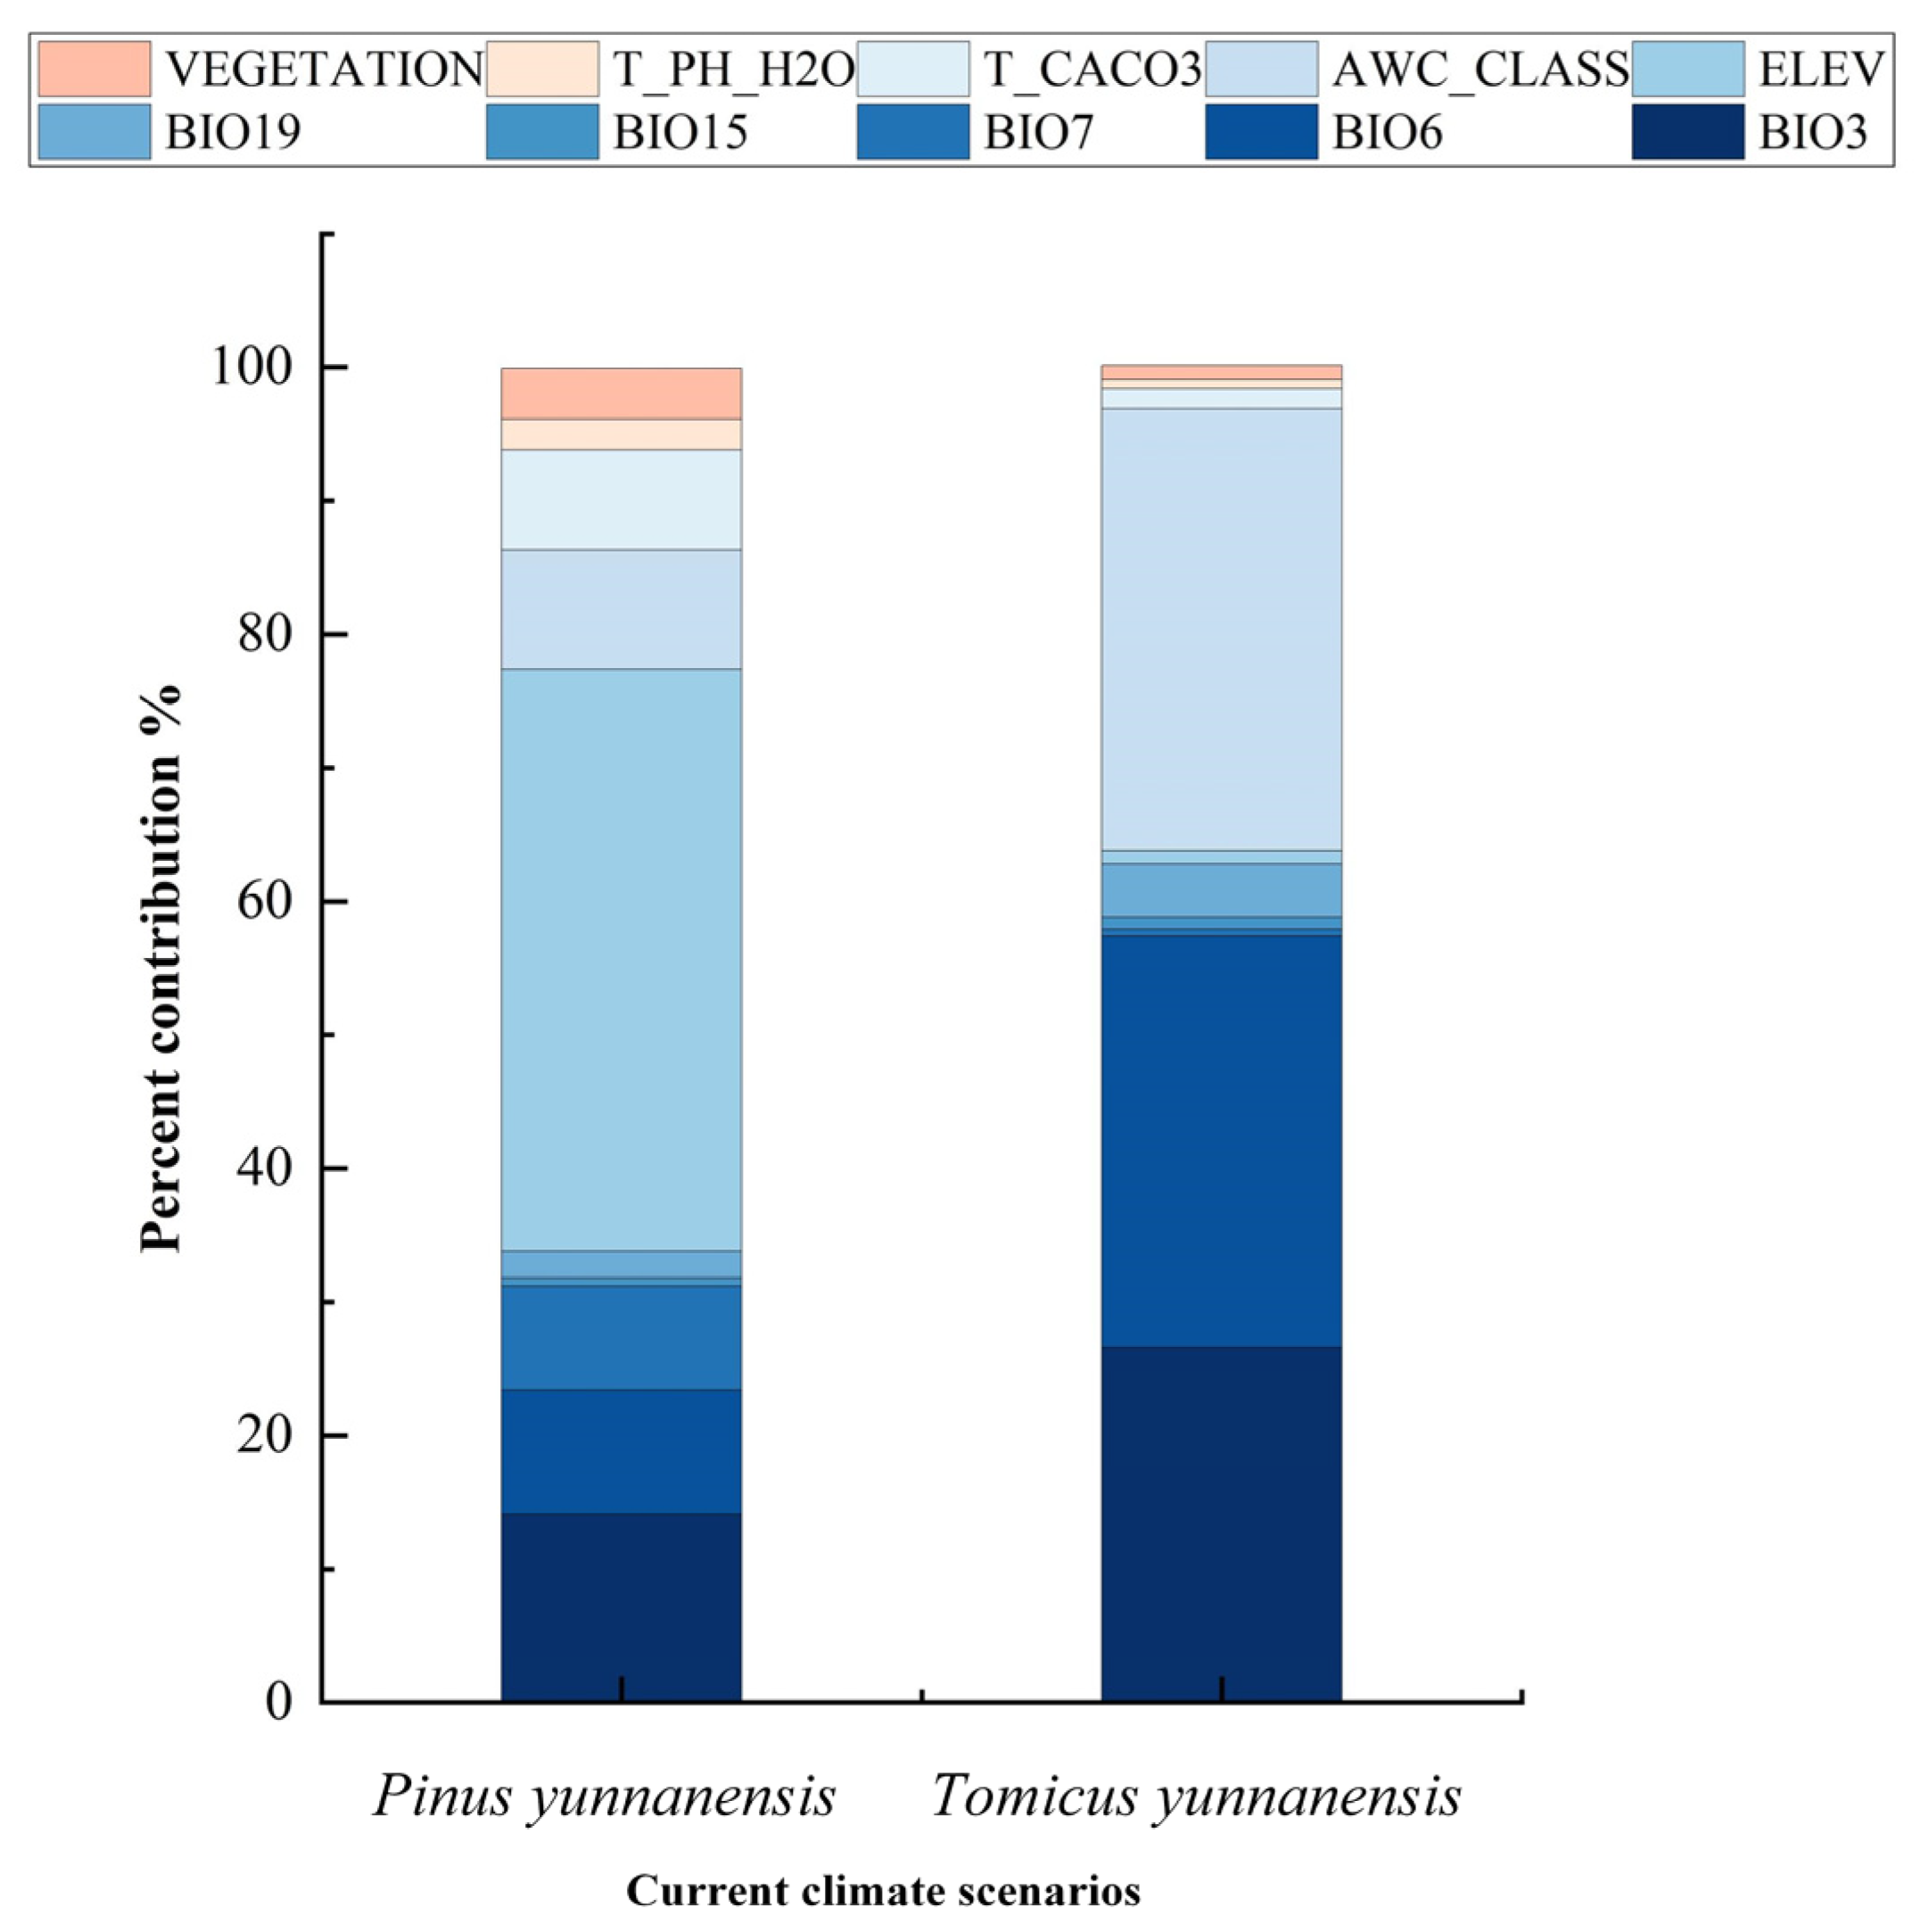
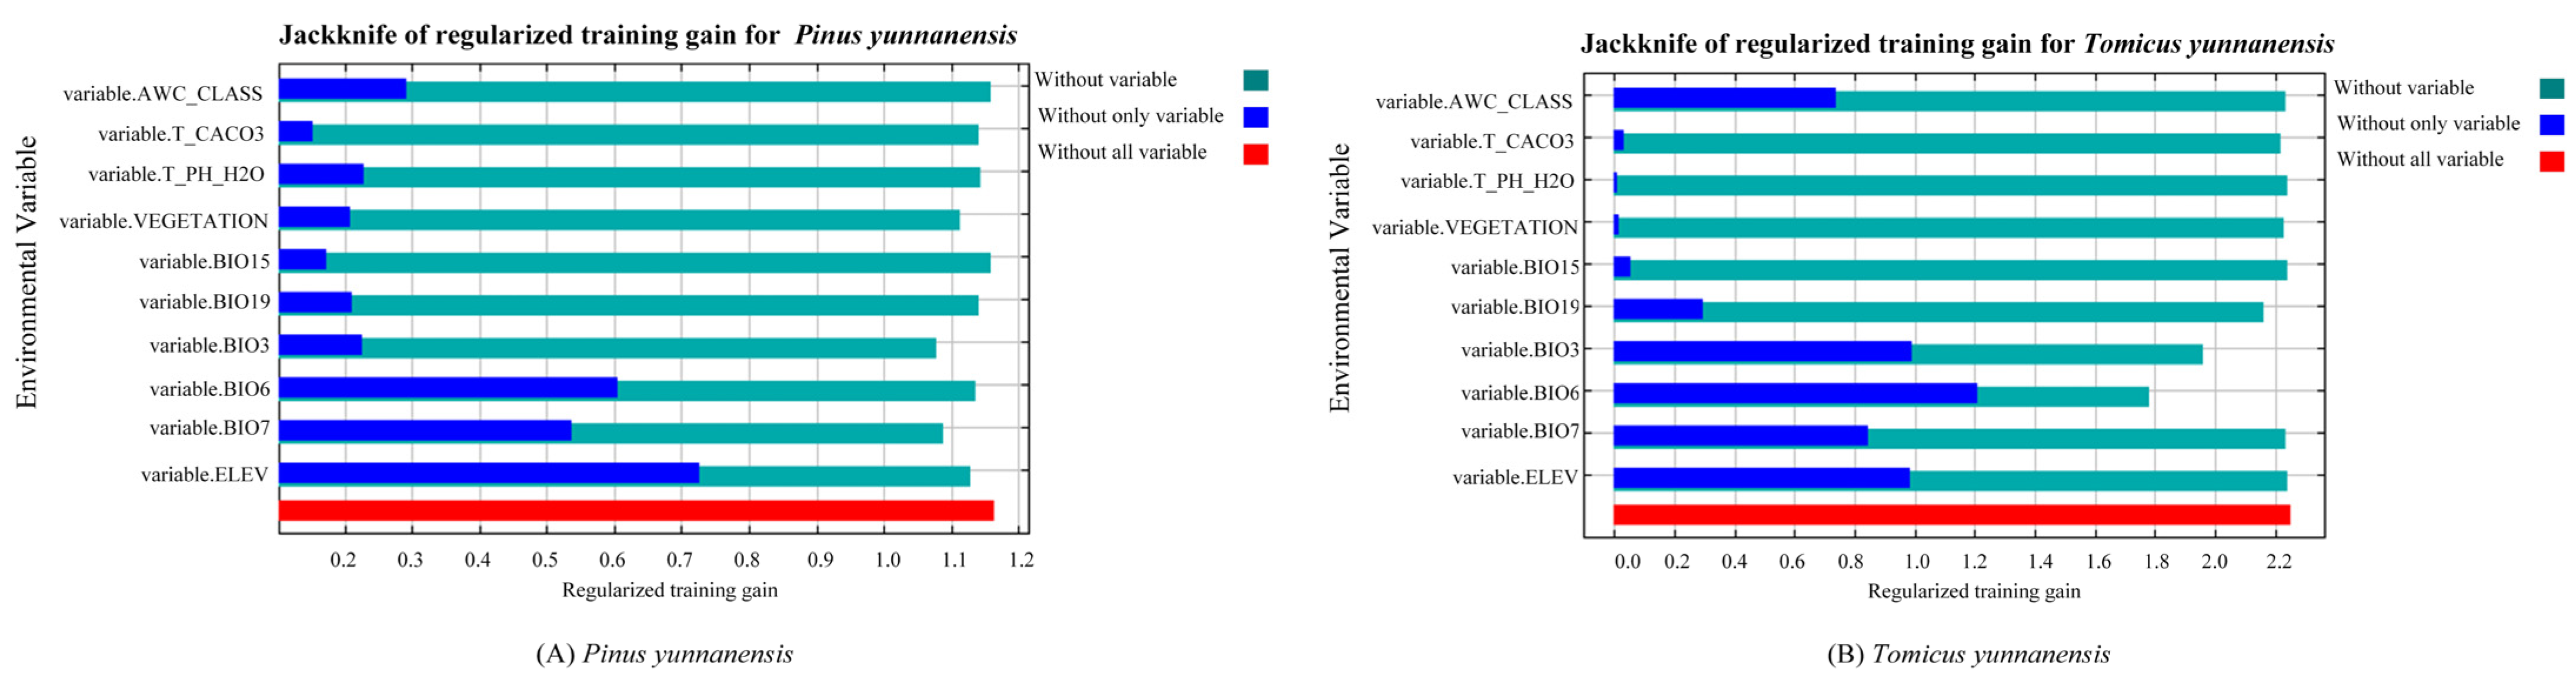
3.2. Environmental Factors Affecting the Distribution of P. yunnanensis and T. yunnanensis

Figure 3 shows the percentage contribution of each environmental factor output from the MaxEnt model to predict the current of P. yunnanensis and T. yunnanensis. The realization results show that under the current climate environment, altitude (43.6%), isothermality (14.1%), the minimum temperature of the coldest month (9.3%), soil’s available water content (8.9%), annual temperature range (7.8%) and topsoil carbonate or lime content (7.5%) are the dominant environmental factors affecting the potential distribution of P. yunnanensis. The soil’s available water content (31.6%), isothermality (29.7%) and the minimum temperature of the coldest month (29.2%) are the dominant environmental factors that affect the potential distribution of T. yunnanensis. Under the future climate scenario model, the dominant environmental factors affecting the potential distribution of P. yunnanensis and T. yunnanensis are the same as those under the current climate environment.
Using the Jackknife method to evaluate the impact of various environmental factors on predicting the current (Figure 4), the experimental results show that among the environmental factors affecting the potential distribution of P. yunnanensis, the single variable of elevation (ELEV) has the largest gain in modeling which indicates that this variable carries the most valuable information for modeling. The minimum temperature of the coldest month (BIO6) and annual temperature range (BIO7) also contribute significantly to the modeling. Among the environmental factors that affect the potential distribution of T. yunnanensis, the minimum temperature of the coldest month (BIO6) has the largest gain in modeling. When it is excluded alone, the gain decreases the most, which indicates that this variable carries the necessary modeling requirements and has the most valuable information.

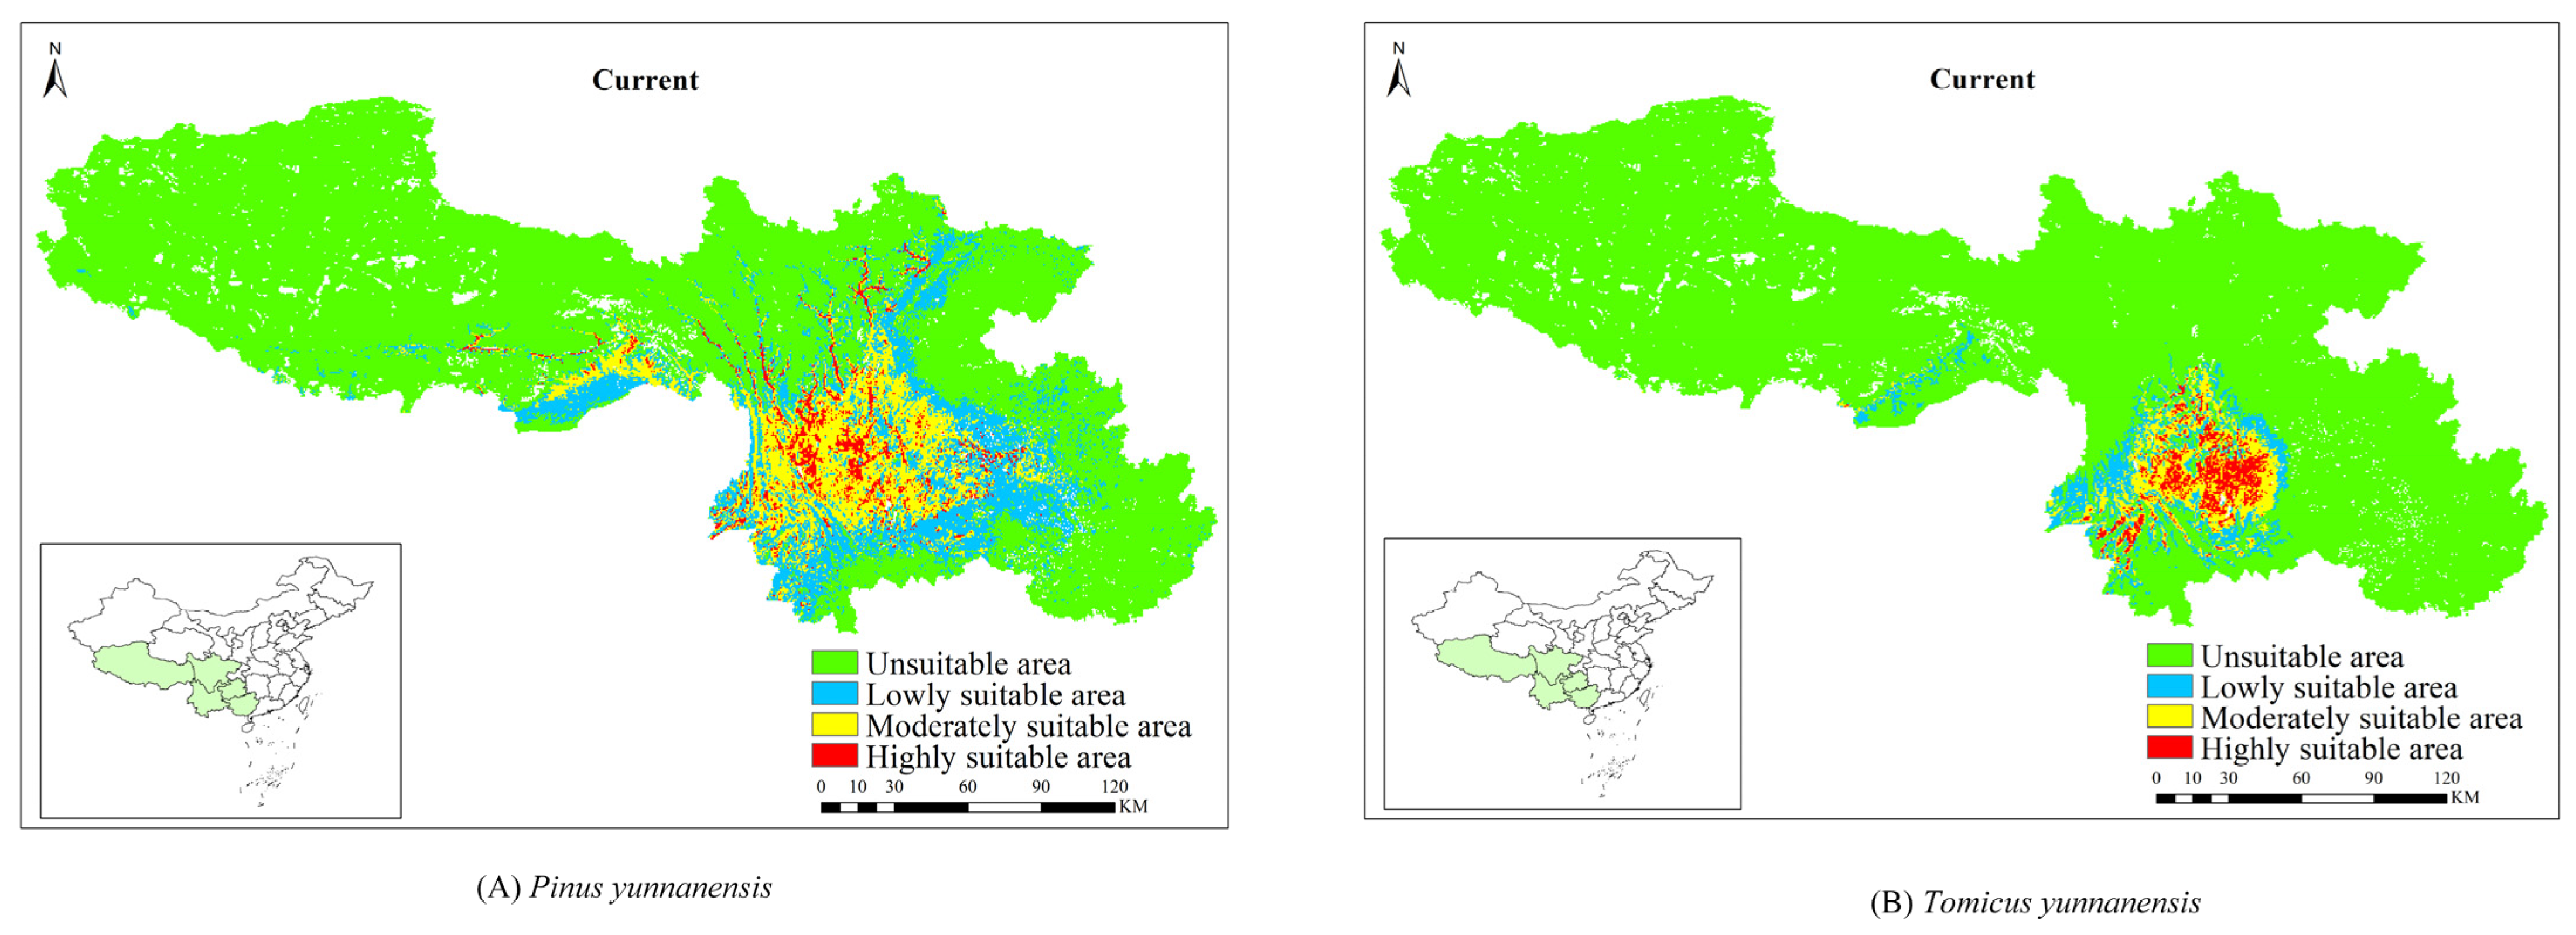
3.3. The Current Potential Distribution of P. yunnanensis and T. yunnanensis

The MaxEnt model was used to predict the current potential distribution of P. yunnanensis and T. yunnanensis (Figure 5, Table 2). The highly suitable areas of P. yunnanensis are scattered, while those of T. yunnanensis are more concentrated. The area of the highly suitable areas of P. yunnanensis is about 5.92 × 10⁴ km2, and the area of the moderately suitable areas is about 24.09 × 10⁴ km2. The area of the highly suitable areas of T. yunnanensis is about 4.31 × 10⁴ km2, and the area of the moderately suitable areas is about 9.14 × 10⁴ km2.

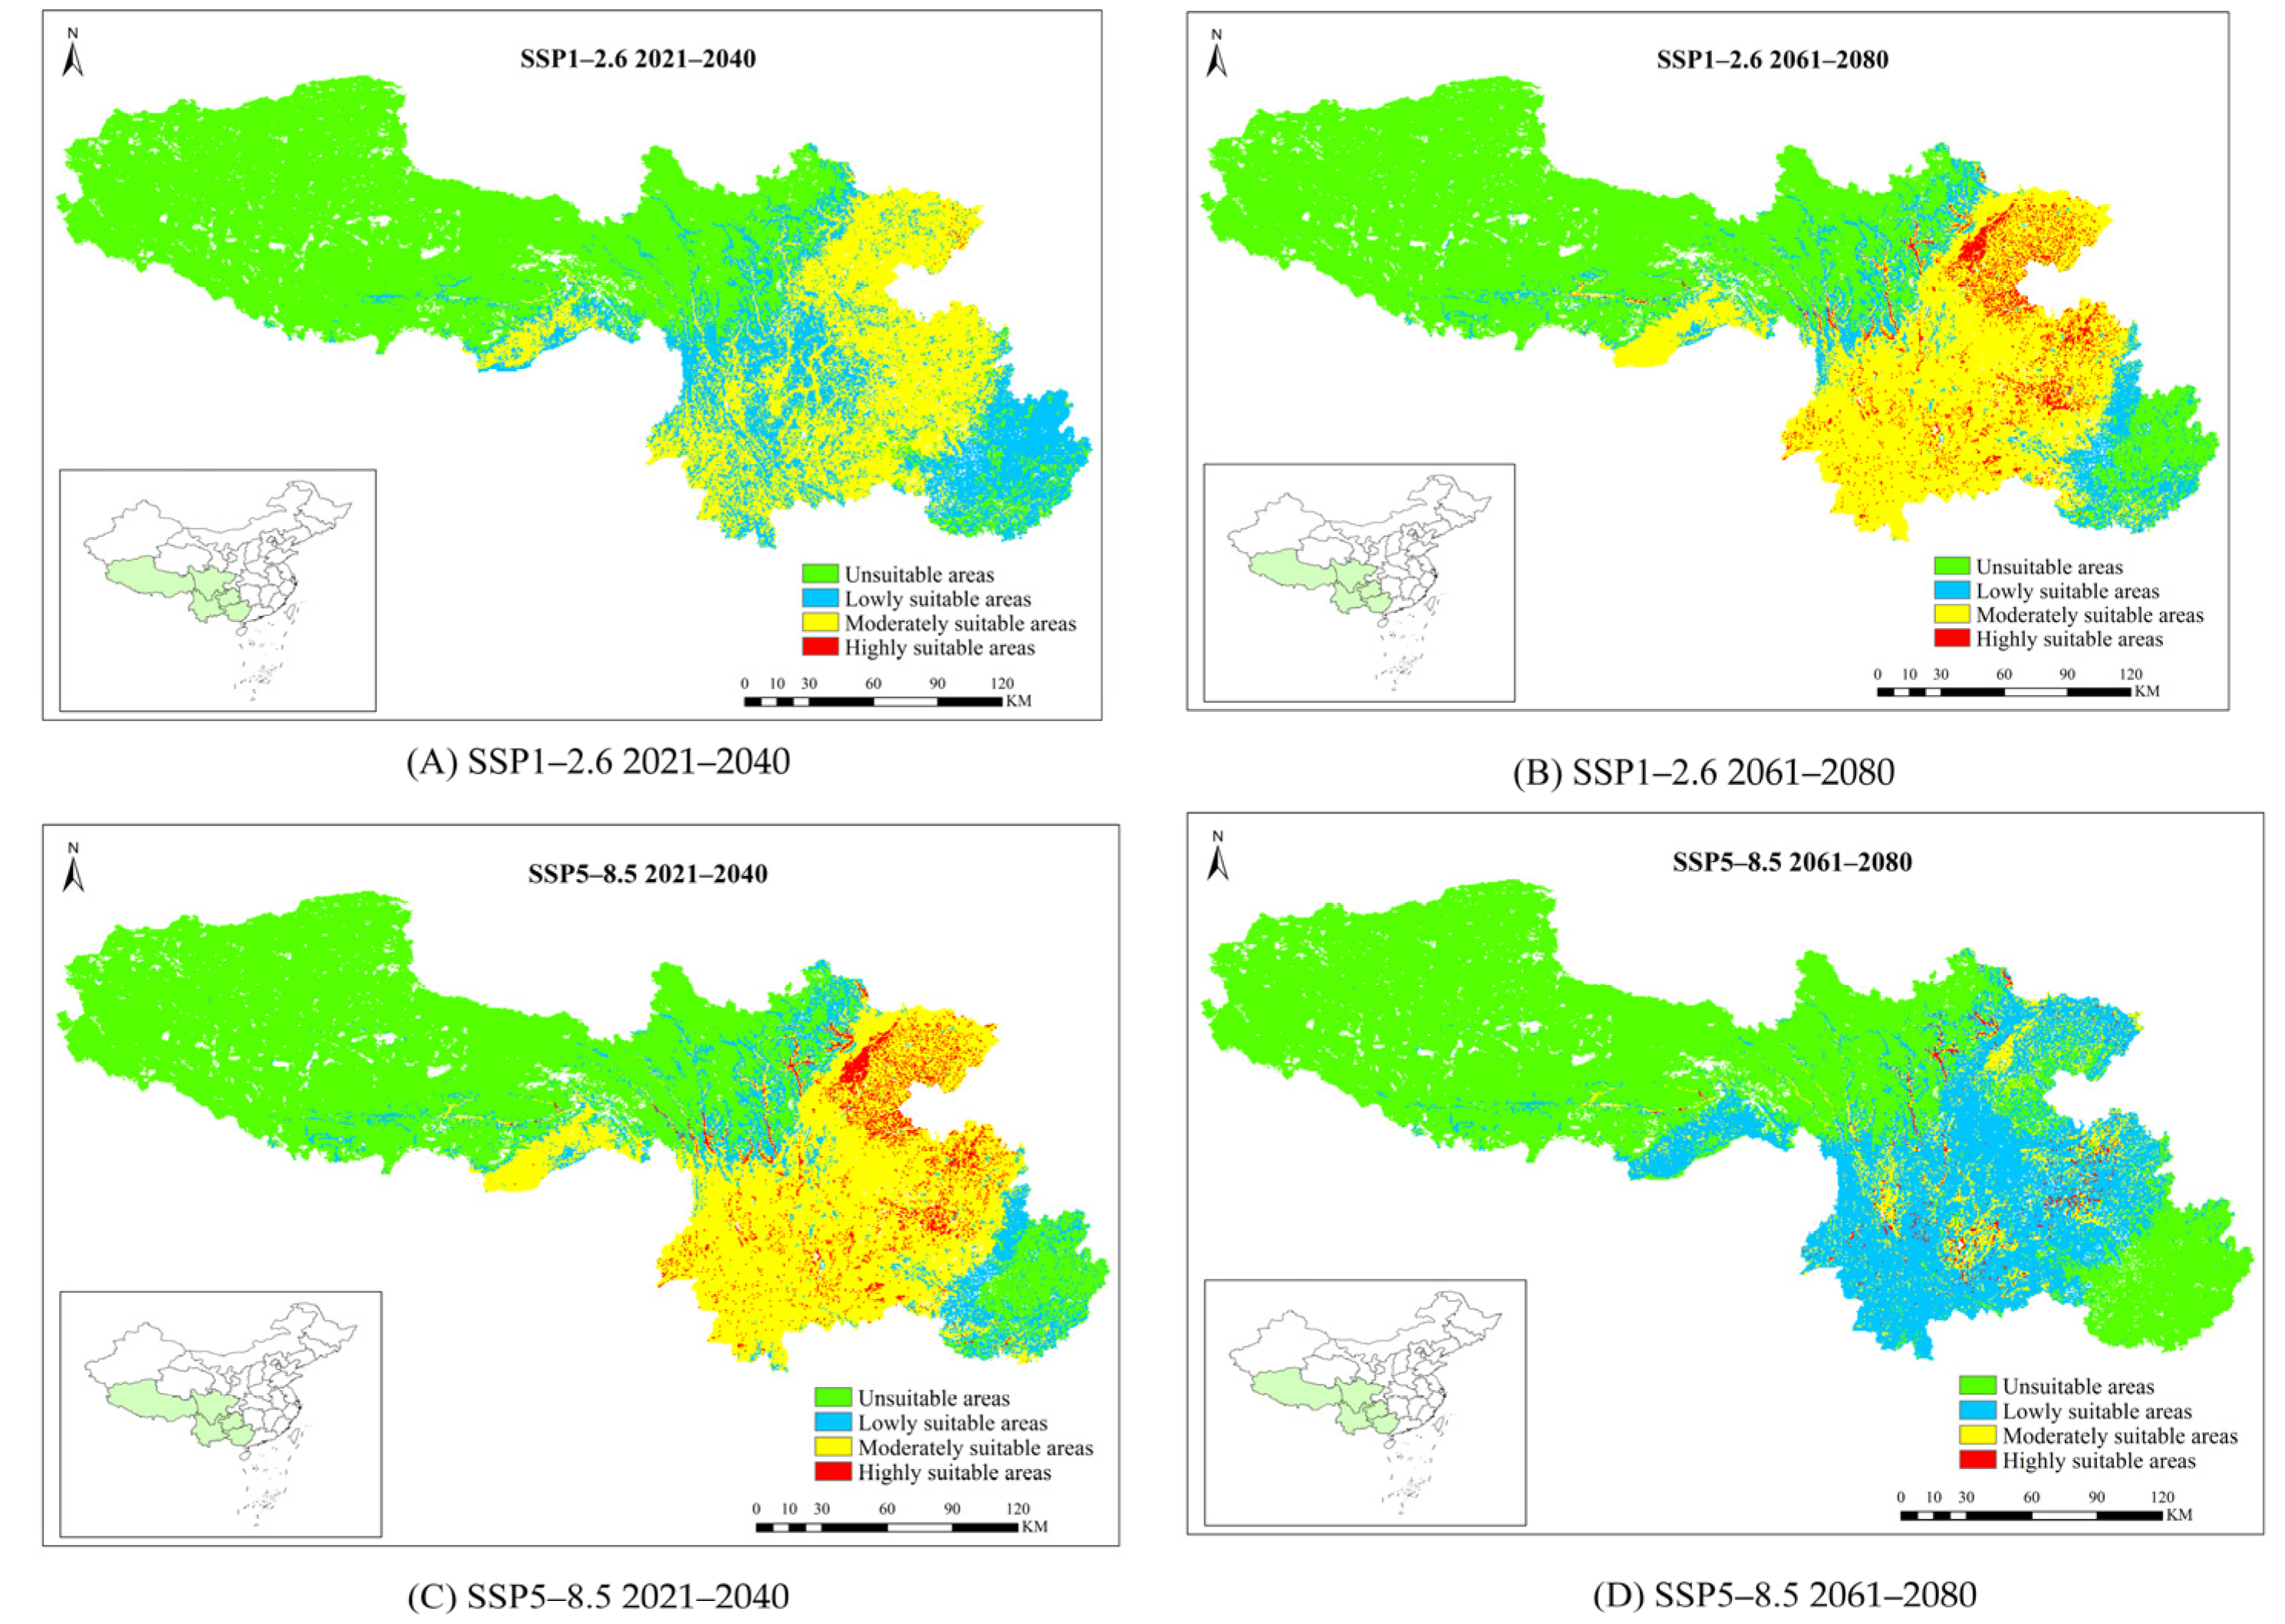
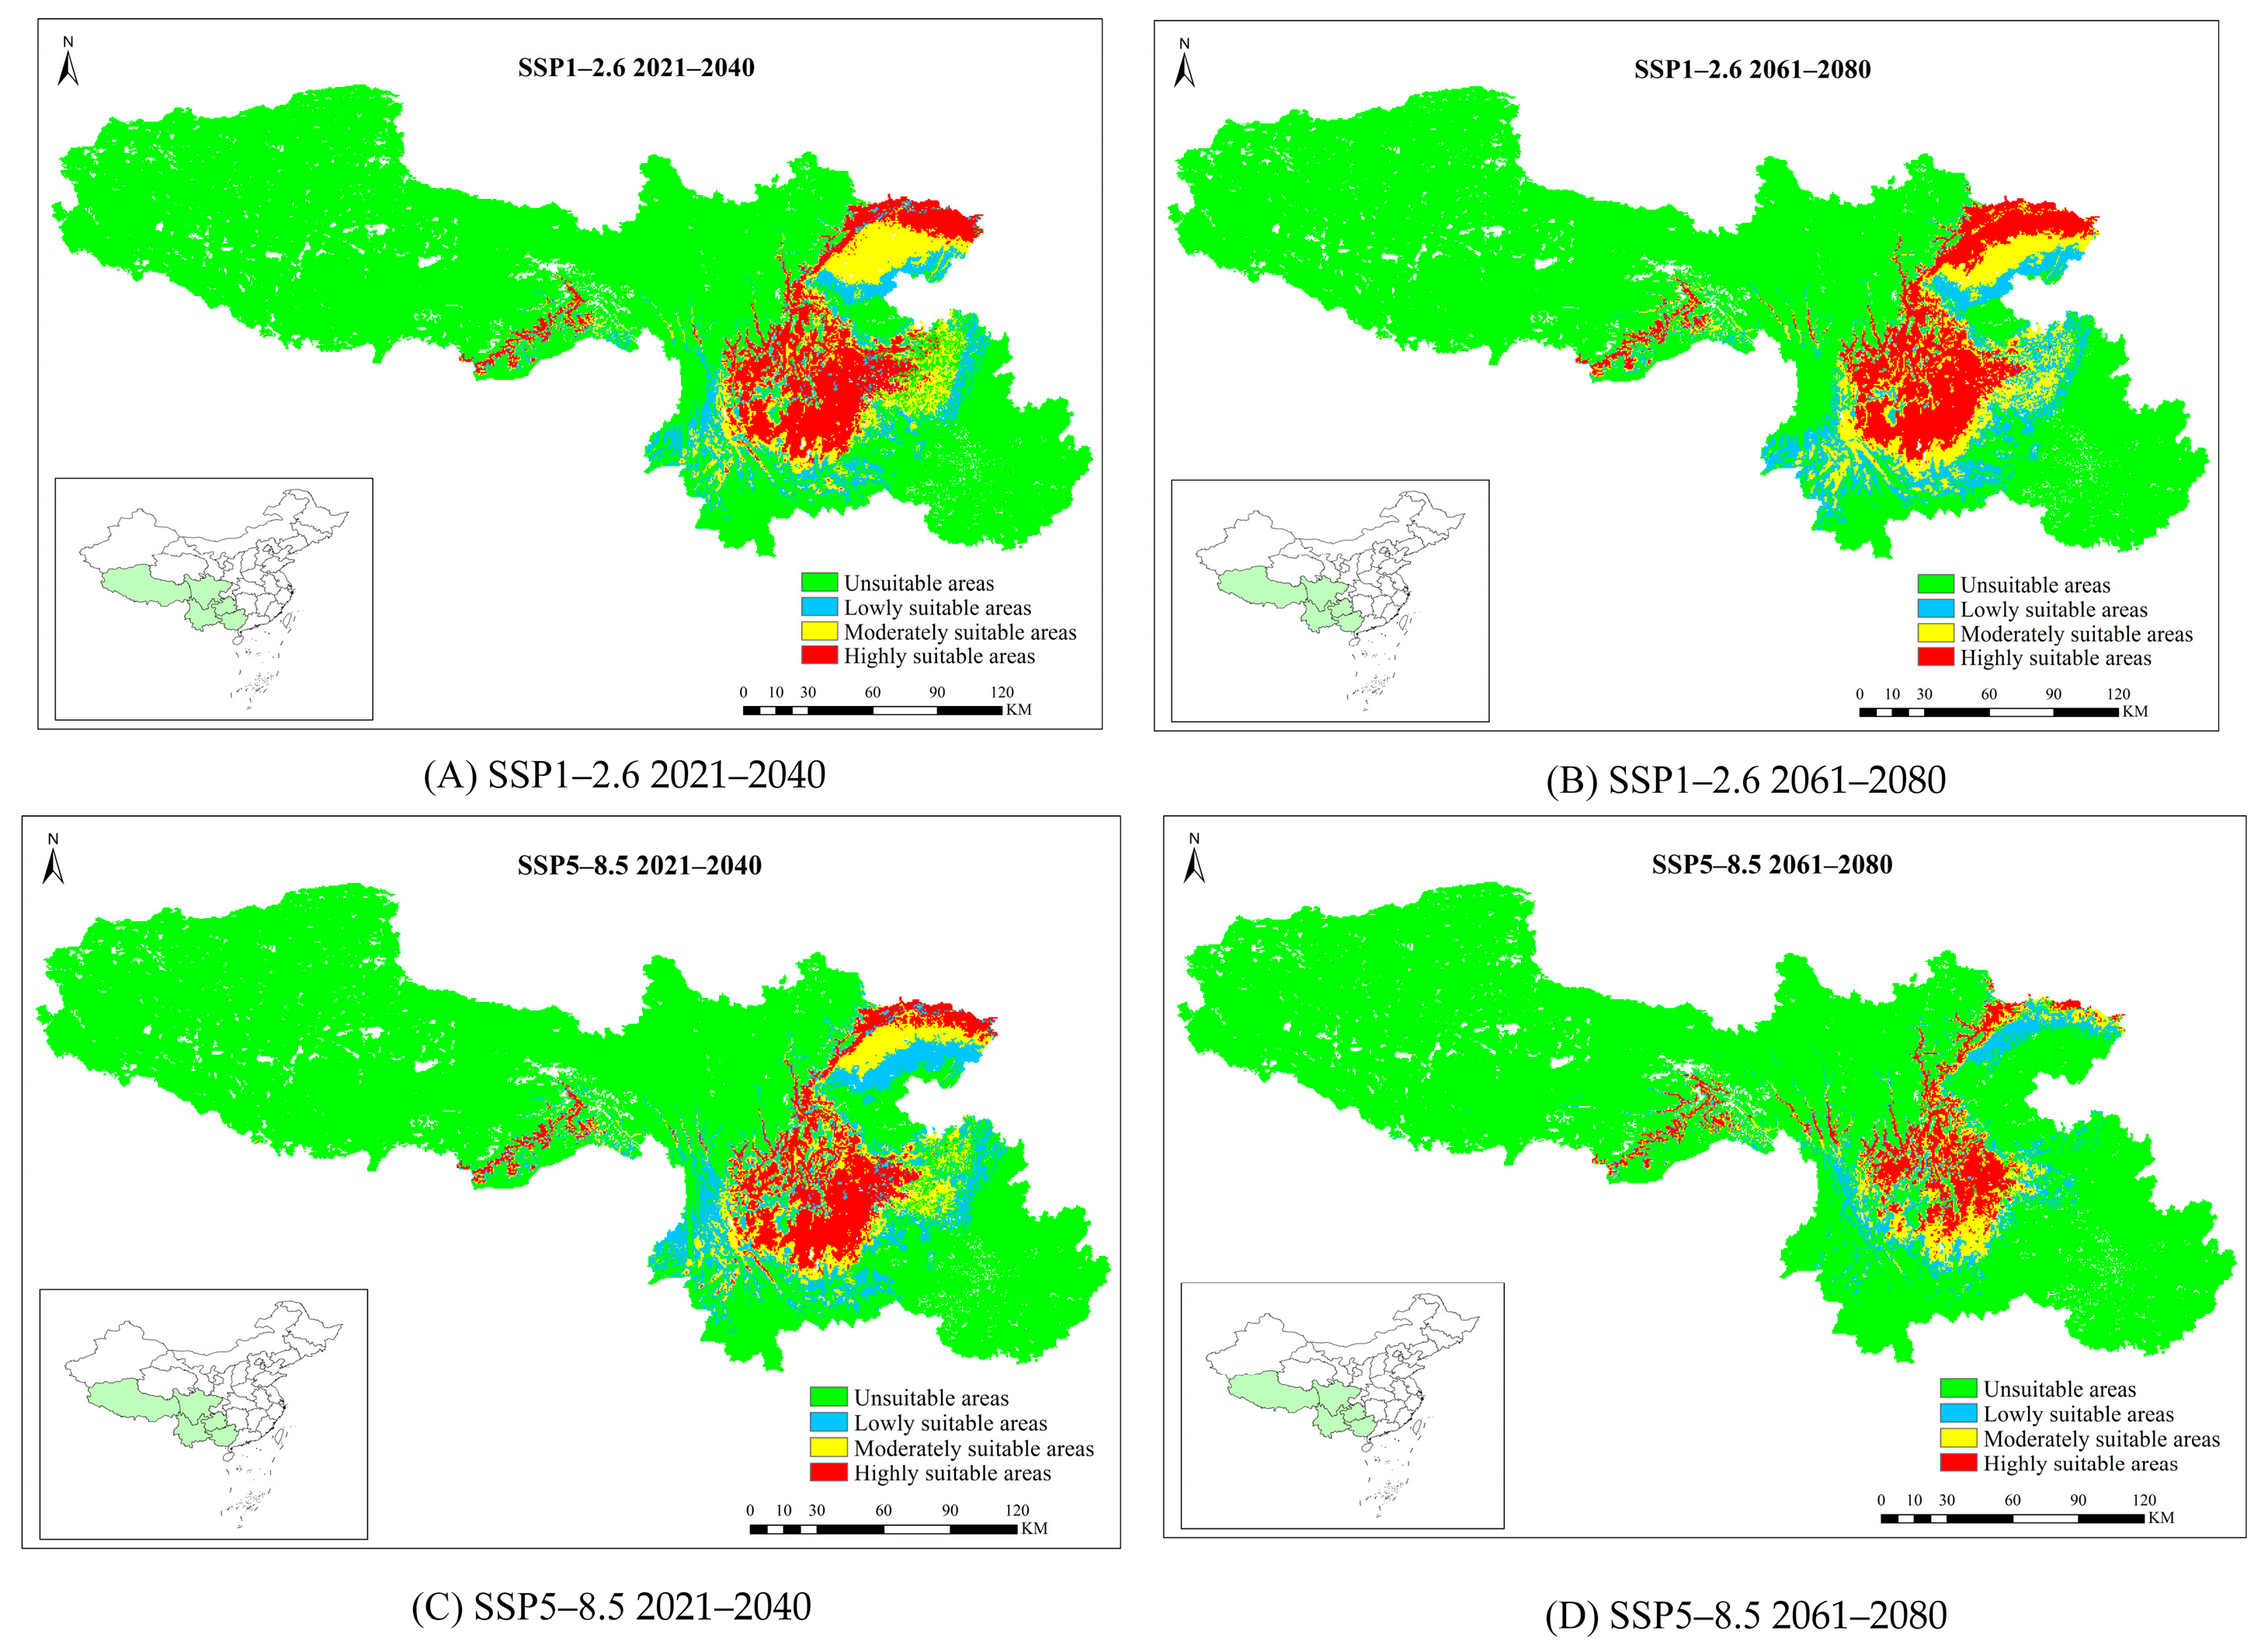
3.4. The Future Potential Distribution of P. yunnanensis and T. yunnanensis

This study analyzed the potential distribution of P. yunnanensis and T. yunnanensis under two shared socioeconomic pathways (SSP1-2.6 and SSP5-8.5) during two future periods (2021–2040 and 2061–2080) (Figure 6 and Figure 7, Table 2). Under the future climate scenario, the suitable areas of P. yunnanensis and T. yunnanensis will increase and expand to the northeast. Under the SSP1-2.6 climate scenario, the area of suitable areas for P. yunnanensis and T. yunnanensis shows an overall upward trend. At the same time, there is an overall upward and then a downward trend under the SSP2-8.5 climate scenario.
Under the SSP1-2.6 climate scenario, the area of lowly suitable areas for P. yunnanensis from 2021 to 2040 is expected to increase in southeastern Tibet, western Yunnan and eastern Guangxi. The area of moderately suitable areas is expected to increase in northeastern Sichuan, Guizhou and southeastern Yunnan, while the highly suitable areas will be mostly reduced. Compared with 2021–2040, the area of the lowly suitable area of P. yunnanensis shrinks by half from 2061 to 2080, while the moderately suitable areas increase by about 18.35 × 10⁴ km2, which are mainly distributed in southeastern Tibet, Yunnan, Guizhou, eastern Sichuan and Western Guangxi. The highly suitable areas of P. yunnanensis increase by about 7.78 × 10⁴ km2, mainly distributed in eastern Sichuan and western Guizhou. Under the SSP5-8.5 climate scenario, the area of the moderately suitable areas of P. yunnanensis shrink slightly from 2021 to 2040 and the area of the moderately suitable areas is expected to increase in southeastern Tibet, Yunnan, Guizhou, eastern Sichuan and western Guangxi, while the area of highly suitable areas is expected to increase in eastern Sichuan and western Guizhou. From 2061 to 2080, the total area of the suitable growth areas of P. yunnanensis will shrink. Compared with 2021 to 2040, the lowly suitable areas will increase by about 53.95 × 10⁴ km2, while the moderately suitable areas will shrink significantly by about 68.29 × 10⁴ km2, and the area of the highly suitable areas will shrink by about 6.43 × 10⁴ km2.
Under the SSP1-2.6 climate scenario, the total area of suitable areas for T. yunnanensis is expected to increase from 2021 to 2040, and the area of lowly suitable areas is expected to increase by about 4.79 × 10⁴ km2 in northeastern Sichuan, southwestern Yunnan and northwestern Guizhou. The area of moderately suitable areas is expected to increase by about 9.11 × 10⁴ km2 in northeastern Sichuan, northwestern Guizhou and southeastern Yunnan, and the area of highly suitable areas is expected to increase by about 18.07 × 10⁴ km2 in southeastern Tibet, northeastern Sichuan, western Guizhou and northeastern Yunnan. Compared with 2021–2040, the total area suitable for the growth of T. yunnanensis from 2061 to 2080 is expected to be the largest, about 59.47 × 10⁴ km2. Under the SSP5-8.5 climate scenario, from 2021–2040 to 2061–2080, the moderately suitable and highly suitable areas of T. yunnanensis are expected to increase substantially and then show a trend of shrinking. It is estimated that the area of the moderately suitable areas from 2061 to 2080 will decrease by 4.08 × 10⁴ km2. Compared with that of 2021 to 2040, the area of the highly suitable areas is expected to decrease by 6.39 × 10⁴ km2.

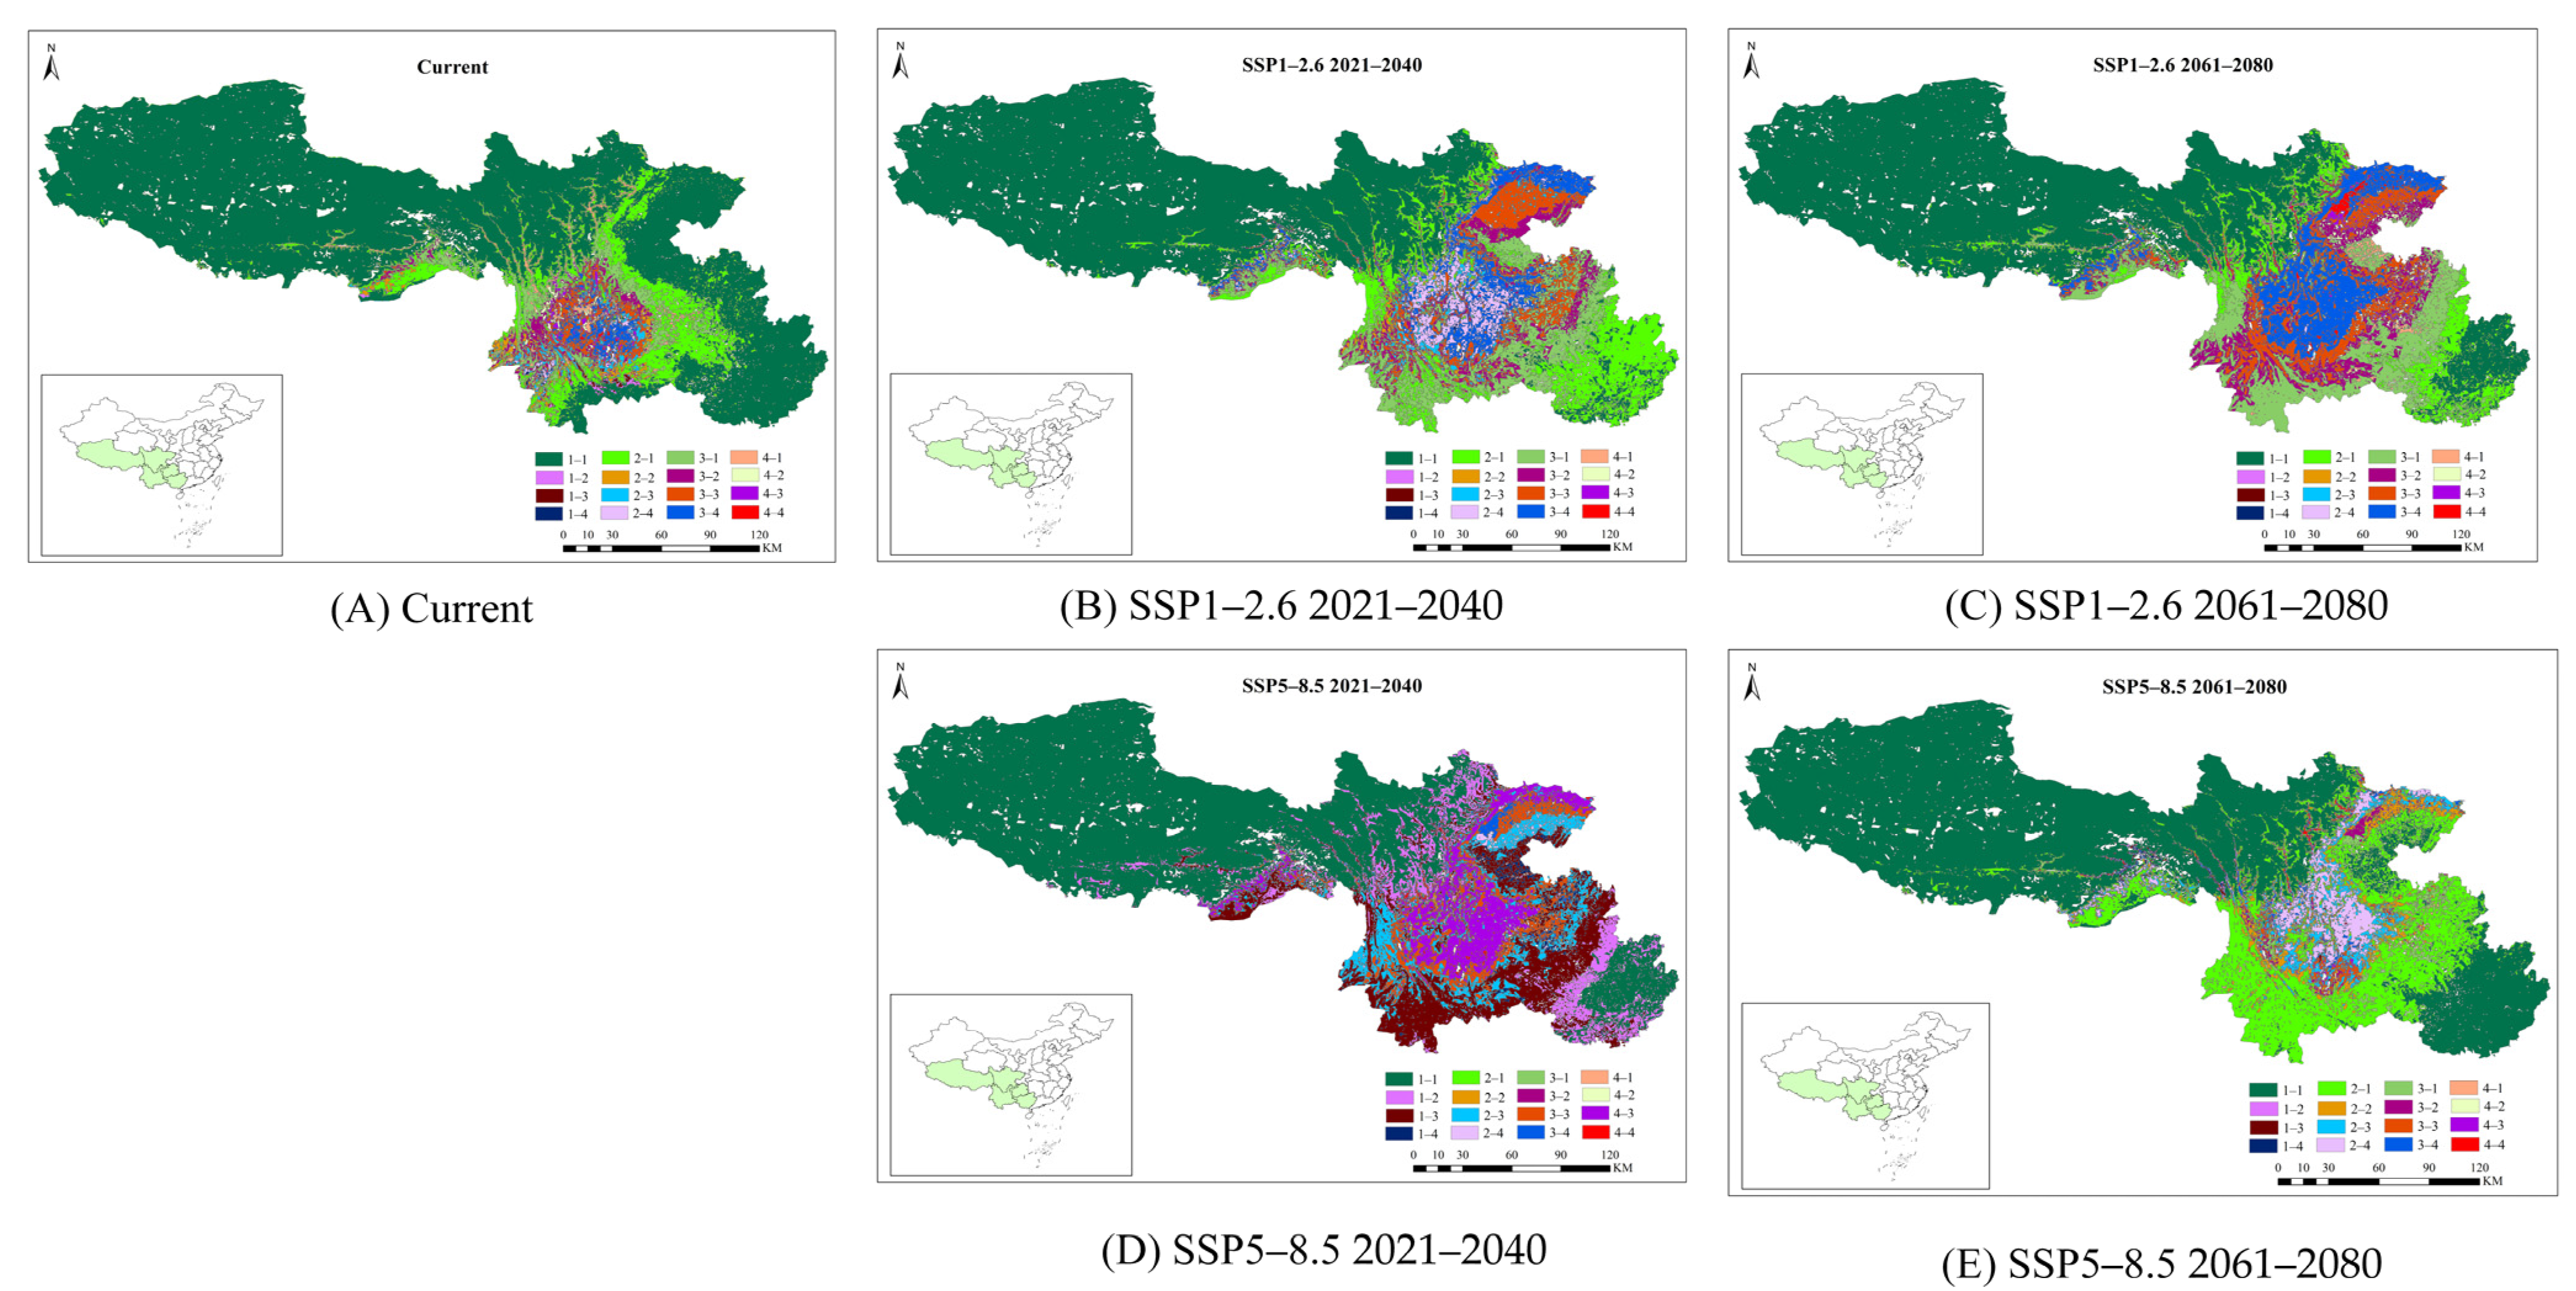
3.5. Changes in the Potential Distribution of P. yunnanensis and T. yunnanensis

By comparative analysis of suitable areas classes of P. yunnanensis and T. yunnanensis under different climate scenarios, the spatial variation map of habitat suitability area was mapped (Figure 8). Table 3 shows changes in the potential distribution of P. yunnanensis and T. yunnanensis under different climate scenarios. Two major observations can be drawn, as shown in Table 3. First, a suitable class 1 area for P. yunnanensis is 188.81 × 10⁴ km2, of which 187.78 × 10⁴ km2 is unsuitable for T. yunnanensis in the current climate. Under the climatic conditions of SSP1-2.6, the unsuitable areas of T. yunnanensis in 2021–2040 and 2061–2080 are 140.78 × 10⁴ and 140.61 × 10⁴ km2, respectively, whereas for the years 2021–2040 and 2061–2080 under SSP5-8.5, the areas of unsuitable areas are 141.02 × 10⁴ and 160.71 × 10⁴ km2, respectively. Secondly, a suitable class 4 area for P. yunnanensis is 5.92 × 10⁴ km2, and the potential distribution for P. yunnanensis is the unsuitable area, the lowly suitable area and the moderately suitable area, with an area of 5.6 × 10⁴ km2 in the current climate. Under the SSP1-2.6 climate scenario, a suitable class 4 area for P. yunnanensis will shrink by 98.64% and increase by 32.77% in 2021–2040 and 2061–2080 compared with the current climate, respectively, of which the unsuitable area, lowly suitable area and moderately suitable area of T. yunnanensis in 2021–2040 will shrink by 45.71% and increase by 6.42% in 2061–2080, respectively. A suitable class 4 area for P. yunnanensis will increase by 40.03% and shrink by 68.58% in 2021–2040 and 2061–2080 compared with the current climate, respectively, of which the unsuitable area, lowly suitable area and moderately suitable area of T. yunnanensis in 2021–2040 will increase by 215.71% and in 2061–2080 will shrink by 74.11% under the SSP5-8.5 climate scenario, respectively.

4. Discussion

4.1. Potential Current Distribution of Suitable Areas for P. yunnanensis and T. yunnanensis

The response curves showed how the predicted probability of presence changed as each environmental variable varied (Figure S1). A probability value greater than MaxSS indicated that the environment was suitable for the growth of P. yunnanensis and T. yunnanensis. Under current climatic conditions, the area of the currently suitable areas for P. yunnanensis is predicted to increase, with a highly suitable altitude of 1500 to 2500 m, an isotherm of 47–49 and a minimum temperature of 2–8 °C in the coldest months. Temperature changes have important effects on plant growth, and at high altitudes, where temperatures are relatively low, the physiological activity of trees is affected; temperature has a strong influence on the length of the growing season, and lower temperatures at high altitudes may shorten the length of the growing season for which plants are suitable [44]. Previous studies [44] have shown that the altitude of the P. yunnanensis distribution area is 1000–4000 m, with a larger distribution area at 2000–2500 m above sea level. The results of this study are also similar to those of previous studies.
Temperature and precipitation are the main factors limiting the current distribution of T. yunnanensis. The experimental results of the Jackknife method show that the minimum temperature of the coldest month (BIO6) has the greatest influence on the potential distribution of T. yunnanensis. Under current climatic conditions, the predicted minimum temperature of the coldest month for T. yunnanensis is 0–1 °C (Figure S2). The complex relationship between temperature and physiological processes affects the geographical distribution of species [45]. Since T. yunnanensis has almost no overwintering habit, it is a frequent tree resident throughout the year. T. yunnanensis also has a long period of adult moth damage and is highly susceptible to multiple tip changes. Typically, in years with moderate precipitation, trees grow extremely well and are highly resistant to insects. Abundant precipitation can curb the insect’s multiple translocations to the tops and trunks of trees. In the event of drought or relatively low temperatures, P. yunnanensis grows poorly and is poorly resistant to insects; the level of naturally secreted insect-resistant substances in the tree decreases and the release of volatile secretions that attract T. yunnanensis to settle increases, thus creating conditions for the reproduction and development of T. yunnanensis [46].

4.2. Potential Future Distribution and Relationship between P. yunnanensis and T. yunnanensis

Most previous studies have suggested that climate warming is causing plant and animal species to migrate to higher altitudes and toward polar regions [47,48,49,50]. In this study, different climate scenarios are used to predict the potential range changes of P. yunnanensis and T. yunnanensis (Figure 5, Figure 6 and Figure 7). The experimental results indicate that under future climate scenarios, the suitable areas of both P. yunnanensis and T. yunnanensis tend to move to higher altitudes in the west and higher latitudes in the north in response to global climate change. In general, the total area of suitable areas of P. yunnanensis increased. This trend is mainly reflected in the increase in the area of low and moderately suitable areas. The increase in the area of the low and moderately suitable areas is mainly manifested in two ways. First, global warming has transformed some areas of the Yunnan-Guizhou–Sichuan Plateau and the Qinghai–Tibet Plateau from initially unsuitable areas to lowly suitable areas and lowly suitable areas to moderately suitable areas [51,52]. Second, under the influence of climate change, some moderate and highly suitable areas are transformed into lowly suitable or even unsuitable areas. This phenomenon suggests that climate change limits the growth of plants in fitness areas, while global warming may also affect plant life activities through photosynthesis and respiration [5]. At the same time, land-use changes caused by human activities, such as changes in management practices and land use, lead to habitat fragmentation [8,9].
Under the future climate scenario of this study, the total suitable area of T. yunnanensis is expected to increase in the near future, especially in southeastern Tibet, northeastern Sichuan, western Guizhou and northeastern Yunnan, which may become the distribution centers of this species. Although the magnitude of area change in suitable areas varies under various scenarios, these scenarios will pose serious challenges for T. yunnanensis control in the coming decades. Figure 7 shows a clear bottleneck of expansion of T. yunnanensis into northeastern Sichuan near the Daba Mountains [53]. Therefore, in the coming decades, we need to focus on strengthening the monitoring and control of T. yunnanensis near the Daba Mountains while combining with MaxEnt models to predict the potential distribution of T. yunnanensis. At the same time, regular surveys should be conducted to ensure early detection of pest outbreaks, and a sound forest monitoring and reporting system should be established to ensure timely monitoring of climate change impacts on P. yunnanensis and T. yunnanensis, then timely formulation of T. yunnanensis control measures.
In this study, it can be observed from the current and future potential distribution of P. yunnanensis and T. yunnanensis (Figure 6 and Figure 7, Table 2 and Table 3) that under the SSP1-2.6 climate scenario, with the future climate change, the area of suitable habitats for P. yunnanensis and T. yunnanensis showed an upward trend. Especially in the moderately suitable areas of P. yunnanensis, the area of the suitable area for T. yunnanensis increased continuously and reached the maximum in 2061–2080. Under the SSP1-2.6 climate scenario, with the passage of time, the highly suitable area of P. yunnanensis, the unsuitable area, the lowly suitable area and the moderately suitable area of T. yunnanensis have significant upward trends. This may be related to the combination of socioeconomic trends and climate policies in the SSP1-2.6 scenario leading to an increase in forest area and good growth of P. yunnanensis [54]. In contrast, under the SSP5-8.5 climate scenario, in 2061–2080, due to the increase in greenhouse gas emissions and increased climate extremes [55,56], most of the suitable areas of P. yunnanensis change from moderately and highly suitable areas to lowly suitable areas due to poor growth and insect resistance of P. yunnanensis (Figure 6), resulting in the proliferation of T. yunnanensis. Therefore, under the SSP5-8.5 climate scenario, with the future climate change, the suitable areas of P. yunnanensis and T. yunnanensis showed a trend of first increasing and then decreasing (the highest in 2021–2040).

5. Conclusions

This study predicted the potential distribution of P. yunnanensis and T. yunnanensis under two periods and two shared socioeconomic pathways using the MaxEnt model. Under current climatic conditions, elevation (ELEV), the minimum temperature in the coldest month (BIO6) and annual temperature range (BIO7) constrain the current distribution of P. yunnanensi. The minimum temperature in the coldest month (BIO6), elevation (ELEV) and minimum temperature in the coldest month (BIO6) are the most important variable of the current distribution of T. yunnanensis. Under different climate change scenarios, the adaptation areas of P. yunnanensis and T. yunnanensis are increasing, and both have a tendency to move to higher altitudes in the west and higher latitudes in the north. At the same time, this study found an obvious bottleneck of expansion to the northeast of Sichuan near the Daba Mountains, which provides a possible solution for controlling T. yunnanensis. This study provides an important basis for the breeding of P. yunnanensis and controlling T. yunnanensis. However, this study only considers the influence of climatic factors in the woldclime database. In future research, the impact of human activities and economic development on P. yunnanensis and T. yunnanensis will be further studied.

Supplementary Materials

The following supporting information can be downloaded at: https://www.mdpi.com/article/10.3390/f13091379/s1, Figure S1: Response curves of 10 environmental variables in a potential distribution model of P. yunnanensis; Figure S2: Response curves of 10 environmental variables in a potential distribution model of T. yunnanensis.

Author Contributions

Conceptualization, B.H. and J.M.; methodology, B.H. and Y.C.; software, B.H. and Y.S.; validation, B.H., Y.Z. and J.M.; investigation, B.H. and Y.S.; data curation, J.M. and Y.C.; writing—original draft preparation, B.H.; writing—review and editing, Y.Z., Y.S. and Y.C.; supervision, Y.Z. and Z.X.; project administration, Y.Z.; funding acquisition, Y.Z. All authors have read and agreed to the published version of the manuscript.

Funding

This work was supported by projects of National Natural Science Foundation to Y.Z.; Digitalization, development and application of biotic resource; Key Laboratory for Forest Resources Conservation to Z.X. and Utilization in the Southwest Mountains of China, Ministry of Education to Y.Z., grant numbers 31960142, 202002AA10007 and KLESWFU-201905, respectively.

Institutional Review Board Statement

Not applicable.

Informed Consent Statement

Not applicable.

Data Availability Statement

Not applicable.

Conflicts of Interest

The authors declare no conflict of interest.

References

  1. IPCC. Summary for Policymakers. In Climate Change 2021: The Physical Science Basis. Contribution of Working Group I to the SixthAssessment Report of the Intergovernmental Panel on Climate Change; Intergovernmental Panel on Climate Change: Cambridge, UK; New York, NY, USA, 2021. [Google Scholar]
  2. Ying, Z. Projections of 2.0 °C Warming over the Globe and China under RCP4.5. Atmos. Ocean. Sci. Lett. 2012, 5, 514–520. [Google Scholar] [CrossRef]
  3. Zhao, D.S.; Gao, X.; Wu, S.G.; Zheng, D. Trend of climate variation in China from 1960 to 2018 based on natural regionalization. Adv. Earth Sci. 2020, 35, 750–760. [Google Scholar]
  4. Guo, Y.; Li, X.; Zhao, Z.; Nawaz, Z. Predicting the impacts of climate change, soils and vegetation types on the geographic distribution of Polyporus umbellatus in China. Sci. Total Environ. 2019, 648, 1–11. [Google Scholar] [CrossRef] [PubMed]
  5. Wang, X.; Zhang, W.; Zhao, X.; Zhu, H.; Ma, L.; Qian, Z.; Zhang, Z. Modeling the Potential Distribution of Three Taxa of Akebia Decne. Under Climate Change Scenarios in China. Forests 2021, 12, 1710. [Google Scholar]
  6. Dawson, T.P.; Jackson, S.T.; House, J.I.; Prentice, I.C.; Mace, G.M. Beyond Predictions: Biodiversity Conservation in a Changing Climate. Science 2011, 332, 53–58. [Google Scholar] [CrossRef]
  7. Yin, Y.; He, Q.; Pan, X.; Liu, Q.; Wu, Y.; Li, X. Predicting Current Potential Distribution and the Range Dynamics of Pomacea canaliculata in China under Global Climate Change. Biology 2022, 11, 110. [Google Scholar] [CrossRef]
  8. Chen, Y.G.; Yue, X.G.; Chen, Y.H.; Cheng, W.X.; Du, G.J.; Zhong, Q.L.; Cheng, Q.L. Identification of potential distribution area of Cunninghamia lanceolata in China under climate change based on the MaxEnt model. Chin. J. Appl. Ecol. 2022, 33, 1207–1214. [Google Scholar]
  9. Haddad, N.M.; Brudvig, L.A.; Clobert, J.; Davies, K.F.; Gonzalez, A.; Holt, R.D.; Lovejoy, T.E.; Sexton, J.O.; Austin, M.P.; Collins, C.D.; et al. Habitat fragmentation and its lasting impact on Earth’s ecosystems. Sci. Adv. 2015, 1, e1500052. [Google Scholar] [CrossRef]
  10. Bálint, M.; Domisch, S.; Engelhardt, C.H.M.; Haase, P.; Lehrian, S.; Sauer, J.; Theissinger, K.; Pauls, S.U.; Nowak, C. Cryptic biodiversity loss linked to global climate change. Nat. Clim. Chang. 2011, 1, 313–318. [Google Scholar] [CrossRef]
  11. Oliver, T.; Hill, J.K.; Thomas, C.D.; Brereton, T.; Roy, D.B. Changes in habitat specificity of species at their climatic range boundaries. Ecol. Lett. 2009, 12, 1091–1102. [Google Scholar] [CrossRef]
  12. Peterson, M.L.; Doak, D.F.; Morris, W.F. Incorporating local adaptation into forecasts of species’ distribution and abundance under climate change. Glob. Chang. Biol. 2019, 25, 775–793. [Google Scholar] [PubMed]
  13. Anderson, R.P. A framework for using niche models to estimate impacts of climate change on species distributions. Ann. N. Y. Acad. Sci. 2013, 1297, 8–28. [Google Scholar] [CrossRef] [PubMed]
  14. Elith, J.; Leathwick, J.R. Species Distribution Models: Ecological Explanation and Prediction Across Space and Time. Annu. Rev. Ecol. Evol. Syst. 2009, 40, 677–697. [Google Scholar] [CrossRef]
  15. Qiao, H.J.; Hu, J.H.; Huang, J.H. Theoretical basis, future directions, and challenges for ecological niche models. Sci. Sin. 2013, 43, 915–927. [Google Scholar] [CrossRef]
  16. Li, Y.; Li, M.; Li, C.; Liu, Z. Optimized Maxent Model Predictions of Climate Change Impacts on the Suitable Distribution of Cunninghamia lanceolata in China. Forests 2020, 11, 302. [Google Scholar] [CrossRef]
  17. Dang, A.T.N.; Kumar, L.; Reid, M. Modelling the Potential Impacts of Climate Change on Rice Cultivation in Mekong Delta, Vietnam. Sustainability 2020, 12, 9608. [Google Scholar] [CrossRef]
  18. Kogo, B.K.; Kumar, L.; Koech, R.; Kariyawasam, C.S. Modelling Climate Suitability for Rainfed Maize Cultivation in Kenya Using a Maximum Entropy (MaxENT) Approach. Agronomy 2019, 9, 727. [Google Scholar] [CrossRef]
  19. Li, H.Q.; Liu, X.H.; Wang, J.H.; Xing, L.G.; Fu, Y.Y. Maxent modelling for predicting climate change effects on the potential planting area of tuber mustard in China. J. Agric. Sci. 2019, 157, 375–381. [Google Scholar] [CrossRef]
  20. Ma, Y.; Lu, X.; Li, K.; Wang, C.; Guna, A.; Zhang, J. Prediction of Potential Geographical Distribution Patterns of Actinidia arguta under Different Climate Scenarios. Sustainability 2021, 13, 3526. [Google Scholar] [CrossRef]
  21. Çoban, H.O.; Örücü, Ö.K.; Arslan, E.S. MaxEnt Modeling for Predicting the Current and Future Potential Geographical Distribution of Quercus libani Olivier. Sustainability 2020, 12, 2671. [Google Scholar] [CrossRef]
  22. Zhao, H.; Zhang, H.; Xu, C. Study on Taiwania cryptomerioides under climate change: MaxEnt modeling for predicting the potential geographical distribution. Glob. Ecol. Conserv. 2020, 24, e01313. [Google Scholar] [CrossRef]
  23. Koo, K.S.; Park, D.; Oh, H.S. Analyzing habitat characteristics and predicting present and future suitable habitats of Sibynophis chinensis based on a climate change scenario. J. Asia-Pac. Biodivers. 2019, 12, 1–6. [Google Scholar] [CrossRef]
  24. Saeedi, H.; Costello, M.J.; Warren, D.; Brandt, A. Latitudinal and bathymetrical species richness patterns in the NW Pacific and adjacent Arctic Ocean. Sci. Rep. 2019, 9, 9303. [Google Scholar] [CrossRef] [Green Version]
  25. Saeedi, H.; Basher, Z.; Costello, M.J. Modelling present and future global distributions of razor clams (Bivalvia: Solenidae). Helgol. Mar. Res. 2016, 70, 235. [Google Scholar] [CrossRef]
  26. Jones, M.C.; Dye, S.R.; Pinnegar, J.K.; Warren, R.; Cheung, W.W.L. Modelling commercial fish distributions: Prediction and assessment using different approaches. Ecol. Model. 2012, 225, 133–145. [Google Scholar] [CrossRef]
  27. Yi, Y.-j.; Cheng, X.; Yang, Z.-F.; Zhang, S.-H. Maxent modeling for predicting the potential distribution of endangered medicinal plant (H. riparia Lour) in Yunnan, China. Ecol. Eng. 2016, 92, 260–269. [Google Scholar] [CrossRef]
  28. Du, Z.; He, Y.; Wang, H.; Wang, C.; Duan, Y. Potential geographical distribution and habitat shift of the genus Ammopiptanthus in China under current and future climate change based on the MaxEnt model. J. Arid. Environ. 2021, 184, 104328. [Google Scholar] [CrossRef]
  29. Anand, V.; Oinam, B.; Singh, I.H. Predicting the current and future potential spatial distribution of endangered Rucervus eldii eldii (Sangai) using MaxEnt model. Environ. Monit. Assess. 2021, 193, 147. [Google Scholar] [CrossRef]
  30. Thapa, A.; Wu, R.; Hu, Y.; Nie, Y.; Singh, P.B.; Khatiwada, J.R.; Yan, L.; Gu, X.; Wei, F. Predicting the potential distribution of the endangered red panda across its entire range using MaxEnt modeling. Ecol. Evol. 2018, 8, 10542–10554. [Google Scholar] [CrossRef]
  31. Ning, H.; Tang, M.; Chen, H. Impact of Climate Change on Potential Distribution of Chinese White Pine Beetle Dendroctonus armandi in China. Forests 2021, 12, 544. [Google Scholar] [CrossRef]
  32. Negrini, M.; Fidelis, E.G.; Picanco, M.C.; Ramos, R.S. Mapping of the Steneotarsonemus spinki invasion risk in suitable areas for rice (Oryza sativa) cultivation using MaxEnt. Exp. Appl. Acarol. 2020, 80, 445–461. [Google Scholar] [CrossRef] [PubMed]
  33. Zhu, H.; Kumar, S.; Neven, L.G. Codling Moth (Lepidoptera: Tortricidae) Establishment in China: Stages of Invasion and Potential Future Distribution. J. Insect. Sci. 2017, 17, 85. [Google Scholar] [CrossRef] [PubMed]
  34. Wang, R.; Yang, H.; Luo, W.; Wang, M.; Lu, X.; Huang, T.; Zhao, J.; Li, Q. Predicting the potential distribution of the Asian citrus psyllid, Diaphorina citri (Kuwayama), in China using the MaxEnt model. PeerJ 2019, 7, e7323. [Google Scholar] [CrossRef] [PubMed] [Green Version]
  35. Huang, B.; Liu, J.; Jiao, J.; Lu, J.; Lv, D.; Mao, J.; Zhao, Y.; Zhang, Y. Applications of machine learning in pine nuts classification. Sci. Rep. 2022, 12, 8799. [Google Scholar] [CrossRef]
  36. Chen, J.; Zhang, S.S.; Luo, T.; Zheng, W.; Yang, W.Z.; Li, J.W.; Wang, Y.B.; Wang, S. Distribution patterns of Pinus yunnanensis and P. yunnanensis var.pygmaea and related key ecological factors. J. Northeast. For. Univ. 2021, 49, 8–14. [Google Scholar]
  37. Wang, X.W.; Chen, P.; Wang, Y.X.; Yuan, R.L.; Feng, D.; Li, L.S.; Ye, H.; Pan, Y.; Lv, J.; Zhou, Y.F.; et al. Population Structure and Succession Law of Tomicus Species in Yunnan. For. Res. 2018, 31, 167–172. [Google Scholar]
  38. Yan, G.; Zhang, M.D.; Qian, L.B.; Ze, S.X.; Yang, B.; Li, Z.B. Electrophysiological and behavioral responses of Tominus yunnanensis to plant volatiles from primarily infected pinus yunnanensis in Yunnan, Southwest China. J. Environ. Entomol. 2021, 43, 1389–1397. [Google Scholar]
  39. Wu, T.; Lu, Y.; Fang, Y.; Xin, X.; Liu, X. The Beijing Climate Center Climate System Model (BCC-CSM): Main Progress from CMIP5 to CMIP6. Geosci. Model Dev. Discuss. 2019, 12, 1573–1600. [Google Scholar] [CrossRef]
  40. Xu, W.; Xiao, Y.; Zhang, J.; Yang, W.; Zhang, L.; Hull, V.; Wang, Z.; Zheng, H.; Liu, J.; Polasky, S.; et al. Strengthening protected areas for biodiversity and ecosystem services in China. Proc. Natl. Acad. Sci. USA 2017, 114, 1601–1606. [Google Scholar] [CrossRef]
  41. Alcala-Canto, Y.; Alberti-Navarro, A.; Figueroa-Castillo, J.A.; Ibarra-Velarde, F.; Vera-Montenegro, Y.; Cervantes-Valencia, M.E. Maximum Entropy Ecological Niche Prediction of the Current Potential Geographical Distribution of Eimeria Species of Cattle, Sheep and Goats in Mexico. Open J. Anim. Sci. 2019, 09, 234–248. [Google Scholar] [CrossRef]
  42. Zhao, Y.; Zhao, M.; Zhang, L.; Wang, C.; Xu, Y. Predicting Possible Distribution of Tea (Camellia sinensis L.) under Climate Change Scenarios Using MaxEnt Model in China. Agriculture 2021, 11, 1122. [Google Scholar] [CrossRef]
  43. Gebrewahid, Y.; Abrehe, S.; Meresa, E.; Eyasu, G.; Abay, K.; Gebreab, G.; Kidanemariam, K.; Adissu, G.; Abreha, G.; Darcha, G. Current and future predicting potential areas of Oxytenanthera abyssinica (A. Richard) using MaxEnt model under climate change in Northern Ethiopia. Ecol. Processes 2020, 9, 6. [Google Scholar] [CrossRef]
  44. Swets, J. Measuring the accuracy of diagnostic systems. Science 1988, 240, 1285–1293. [Google Scholar] [CrossRef] [PubMed]
  45. Lu, S.F.; Chen, Y.H.; Zhou, S.Y.; Yin, X.J. Responses of Pinus species to climate change in southwestern China. J. For. Environ. 2020, 40, 466–477. [Google Scholar]
  46. Yang, R.Q.; Fan, Z.X.; Li, Z.S.; Wen, Q.Z. Radial growth of Pinus yunnanensis at different elevations and their responses to climatic factors in the Yulong Snow Mountain, Northwest Yunnan, China. Acta Ecol. Sin. 2018, 38, 8983–8991. [Google Scholar]
  47. Regniere, J.; Powell, J.; Bentz, B.; Nealis, V. Effects of temperature on development, survival and reproduction of insects: Experimental design, data analysis and modeling. J. Insect Physiol. 2012, 58, 634–647. [Google Scholar] [CrossRef]
  48. Wang, Q. Effect of Extreme Climate on the Occurrence Tendency of Three Forest Pests. Master’s Thesis, Chinese Academy of Forestry, Beijing, China, July 2016. [Google Scholar]
  49. Chen, I.C.; Hill, J.K.; Ohlemuller, R.; Roy, D.B.; Thomas, C.D. Rapid range shifts of species associated with high levels of climate warming. Science 2011, 333, 1024–1026. [Google Scholar] [CrossRef]
  50. Thomas, C.D.; Gillingham, P.K. The performance of protected areas for biodiversity under climate change. Biol. J. Linn. Soc. 2015, 115, 718–730. [Google Scholar] [CrossRef] [Green Version]
  51. Rew, L.J.; McDougall, K.L.; Alexander, J.M.; Daehler, C.C.; Essl, F.; Haider, S.; Kueffer, C.; Lenoir, J.; Milbau, A.; Nuñez, M.A.; et al. Moving up and over: Redistribution of plants in alpine, Arctic, and Antarctic ecosystems under global change. Arct. Antarct. Alp. Res. 2020, 52, 651–665. [Google Scholar] [CrossRef]
  52. Hu, R.; Gu, Y.; Luo, M.; Lu, Z.; Wei, M.; Zhong, J. Shifts in bird ranges and conservation priorities in China under climate change. PLoS ONE 2020, 15, e0240225. [Google Scholar] [CrossRef]
  53. Weber, T.C. Maximum entropy modeling of mature hardwood forest distribution in four U.S. states. For. Ecol. Manag. 2011, 261, 779–788. [Google Scholar] [CrossRef]
  54. Chen, Y.H.; Lv, Y.W.; Yin, X.J. Predicting habitat suitability of 12 coniferous forest tree species in southwest China based on climate change. J. Nanjing For. Univ. (Nat. Sci. Ed.). 2019, 43, 113–120. [Google Scholar]
  55. Li, X.; Ma, B.; Lu, C.; Yang, H.; Sun, M. Spatial Pattern and Development of Protected Areas in the North-south Transitional Zone of China. Chin. Geogr. Sci. 2021, 31, 149–166. [Google Scholar] [CrossRef]
  56. Hurtt, G.C.; Chini, L.; Sahajpal, R.; Frolking, S.; Bodirsky, B.L.; Calvin, K.; Doelman, J.C.; Fisk, J.; Fujimori, S.; Klein Goldewijk, K.; et al. Harmonization of global land use change and management for the period 850–2100 (LUH2) for CMIP6. Geosci. Model Dev. 2020, 13, 5425–5464. [Google Scholar] [CrossRef]
Figure 1. Matrix of environmental factor correlation coefficients.
Forests 13 01379 g001
Figure 2. ROC curves and mean test AUC (10 replicate runs) of (A) P. yunnanensis and (B) T. yunnanensis.
Forests 13 01379 g002
Figure 3. Percentage of environmental factors of P. yunnanensis and T. yunnanensis.
Forests 13 01379 g003
Figure 4. Jackknife test of variable importance in the species ((A) P. yunnanensis; (B) T. yunnanensis).
Forests 13 01379 g004
Figure 5. Potential distribution of (A) P. yunnanensis and (B) T. yunnanensis under current climatic conditions.
Forests 13 01379 g005
Figure 6. The future potential distribution of P. yunnanensis under different climate scenarios.
Forests 13 01379 g006
Figure 7. The future potential distribution of T. yunnanensis under different climate scenarios.
Forests 13 01379 g007
Figure 8. Changes in the potential distribution of P. yunnanensis and T. yunnanensis under different climate scenarios. (“1” indicates unsuitable areas, “2” indicates lowly suitable areas, “3” indicates moderately suitable areas, and “4” indicates highly suitable areas).
Forests 13 01379 g008
Table 1. The 24 environmental factors used in this study.
TypeEnvironmental FactorsDescription of Environmental Factors
TemperatureBIO1Annual Mean Temperature
BIO2Mean Diurnal Range
BIO3 *Isothermality
BIO4Temperature Seasonality
BIO5Maximum Temperature of Warmest Month
BIO6 *Minimum Temperature of Coldest month
BIO7 *Temperature Annual Range
BIO8Mean Temperature of Wettest Quarter
BIO9Mean Temperature of Driest Quarter
BIO10Mean Temperature of Warmest Quarter
BIO11Mean Temperature of Coldest Quarter
PrecipitationBIO12Annual Precipitation
BIO13Precipitation of Wettest Month
BIO14Precipitation of Driest Month
BIO15 *Precipitation Seasonality
BIO16Precipitation of Wettest Quarter
BIO17Precipitation of Driest Quarter
BIO18Precipitation of Warmest Quarter
BIO19 *Precipitation of Coldest Quarter
TerrainELEV *Elevation
SoilAWC_CLASS *Soil’s available water content
T_CACO3 *Soil’s carbonate or lime content
T_PH_H2O *Soil’s pH
VegetationVEGETATION *Vegetation type
* Indicates the environmental factors involved in MaxEnt modeling after filtering.
Table 2. Predicted suitable areas of P. yunnanensis and T. yunnanensis under different climate scenarios.
SpeciesClimate ScenariosTotal Suitable AreaLowly Suitable AreaModerately Suitable AreaHighly Suitable
Area
Area
(×104 km2)
Trend (%)Area
(×104 km2)
Trend
(%)
Area
(×104 km2)
Trend
(%)
Area
(×104 km2)
Trend
(%)
P. yunnanensisCurrent1970–200063.42 33.40 24.09 5.92
SSP1-2.62021–2040111.1275.2147.9743.6263.08161.850.08−98.64
2061–2080111.7276.1522.43−32.8481.43238.027.8632.77
SSP5-8.52021–2040111.2875.4721.67−35.1181.32237.678.2940.03
2061–208090.7843.1475.62126.4013.03−45.911.86−68.58
T. yunnanensisCurrent1970–200022.81 9.36 9.14 4.31
SSP1-2.62021–204054.78140.1514.1551.1218.2599.6722.38419.26
2061–208059.47160.7117.0782.3119.04108.3223.35441.76
SSP5-8.52021–204053.94136.4819.63109.7215.7372.1018.57330.85
2061–208035.1253.9711.6824.7911.6527.4612.18182.60
Trend (%) reflects the percentage of area change compared to the current climate.
Table 3. Changes in the potential distribution of P. yunnanensis and T. yunnanensis under different climate scenarios.
CurrentSSP1-2.6SSP5-8.5
2021–20402061–20802021–20402061–2080
ChangeAera
(×104 km2)
ChangeAera
(×104 km2)
ChangeAera
(×104 km2)
ChangeAera
(×104 km2)
ChangeAera
(×104 km2)
1–1187.781–1140.781–1140.611–1141.021–1160.71
3–24.333–210.653–214.683–20.303–22.20
3–3 4.763–3 14.083–3 16.563–3 13.323–3 2.24
3–42.933–413.923–421.253–42.133–41.70
4–12.854–10.004–12.124–10.04–10.64
4–21.374–20.014–21.794–20.214–20.36
4–3 1.384–3 0.034–3 2.054–3 17.474–3 0.45
Publisher’s Note: MDPI stays neutral with regard to jurisdictional claims in published maps and institutional affiliations.

