Article

Urban Forest Locations and Patch Characteristics Regulate PM2.5 Mitigation Capacity

1
College of Landscape Architecture, Changchun University, Changchun 130022, China
2
Institute of Forest Management, Jilin Provincial Academy of Forestry Sciences, Changchun 130033, China
*
Author to whom correspondence should be addressed.
Forests 2022, 13(9), 1408; https://doi.org/10.3390/f13091408
Submission received: 30 July 2022 / Revised: 29 August 2022 / Accepted: 30 August 2022 / Published: 1 September 2022
(This article belongs to the Special Issue Forest Biodiversity and Ecosystem Stability)

Abstract

:
Atmospheric pollution caused by fine particulate matter (PM2.5) seriously damages human health. Urban forests have the ecological function of purifying the atmosphere, which can effectively reduce the ambient PM2.5 concentration. This paper analyzed the ability of different forest types to mitigate PM2.5 pollution and explored the effects of forest quality and morphological parameters on PM2.5 concentration on the forest patch level. The results concluded that the PM2.5 concentration of the Landscape and Relaxation Forest (LF) was significantly lower than that of the Roadside Forest (RF) and Affiliated Forest (AF) due to the environmental quality of their location. The effective distance of LF on PM2.5 reduction was 80 m, which was significantly higher than RF and AF. The Normalized Difference Vegetation Index (NDVI), which indicated forest growth status, was the most effective parameter for improving the urban forest PM2.5 mitigation ability. The concentration of PM2.5 decreased linearly with the increase in NDVI. The area and perimeter of the forest patches had a significant nonlinear negative correlation with PM2.5 concentration. In addition, the more irregular the shape of the forest patch, the lower the PM2.5 concentration of the forest. Moreover, the simpler shape of RF and AF helped to alleviate PM2.5 pollution. The round shape of AF more efficiently reduced PM2.5 concentration. Our study demonstrated that the surrounding environment, forest growth status, and patch forms determined the PM2.5 reduction capacity of an urban forest. The corresponding management and adjustment methods should be implemented in future urban forest management.

1. Introduction

Urbanization is an inevitable trend in the development of human society [1,2]. In 1950, 30% of the world’s population lived in cities, while the number reached 55% in 2018. It has been estimated that by 2050, 68% of the world’s population is expected to live in cities [3]. Since the reform and opening up, China’s urbanization rate has soared from 17.92% in 1978 to 63.89% in 2020 [4], which has exceeded the global average level. The intensification of urbanization has caused a series of environmental problems, among which air pollution has become a major environmental and public health problem all over the world [5,6]. The World Health Organization’s “Global Urban Environment” air pollution database shows that 98% of cities in low- and middle-income countries are exposed to air pollution far in excess of air quality guidelines [7]. Among numerous air pollutants, fine particulate matter (PM2.5) with an aerodynamic equivalent diameter of less than 2.5 microns has been significantly associated with human health [8,9,10]. It may cause premature death, increase lung inflammation, accelerate atherosclerosis, and change the heart function of humans [11]. In 2013, 910,000 people died prematurely from air pollution in China, and 760,000 of them were directly related to PM2.5 [12]. High concentrations of PM2.5 in urban air pose a threat to the health of urban residents [13]. Furthermore, it has serious impacts on the living environment and will affect the balance of the entire ecosystem as well as climate change in the long run [14,15]. At present, PM2.5 pollution matter has not only become a critical issue affecting national image, social harmony, and stability but has also become a worldwide problem [10].
Urban forests can directly or indirectly affect urban air quality by changing the urban atmospheric environment [16,17]. Previous studies on the relationship between urban forests and ambient particulate pollutants were mostly focused on PM10. In the past two decades, with the continuous confirmation of the link between PM2.5 and human health, PM2.5 has gradually attracted extensive attention. Urban forests decrease ambient particulate matter content by trapping particulate matter, releasing particulate matter (such as pollen), and resuspending particulate matter on plant surfaces [17] so that the concentration of particulate matter inside the forest is much lower than the forest edge and outside [18]. Some of these particles were absorbed by trees, while most of the rest were trapped by the plant surface. The intercepted particles are usually released back into the atmosphere, washed away by rain, or dropped to the ground with leaves and branches. During drought periods, particulate matter is constantly intercepted and resuspended, but during precipitation, it is washed away, dissolved, or transferred to the soil [19]. In addition, trees can indirectly affect particulate concentrations by changing air temperature, releasing volatile organic compounds (VOCs), reducing energy use (i.e., shading buildings, changing wind speeds, lowering temperatures, etc.), and reducing the emissions from power plants [20,21].
Studies have shown that increasing vegetation coverage in cities [22,23], changing the tree species [13,24] or community structure [25,26], or adjusting the landscape indices [27,28,29,30,31] can significantly reduce the PM2.5 concentration. However, except in the new planning area, it is not feasible to reduce air particulate pollution by substantially increasing the area of urban forests or large-scale changes in forest species, community structure, landscape composition, and configuration. Nevertheless, the growth status and spatial forms of existing urban forests can be moderately modified to improve the efficiency of PM2.5 mitigation. The ecological services of urban forests are affected by many factors. The basic components of the urban landscape, changes in the forest patch characteristics in terms of the forest growth status, and the spatial forms of the patch strongly affect the stability of ecological forest services. However, most of the studies were focused on the size or degree of fragmentation in forest patches [27,28], and the quantitative relationship between key characteristic parameters of urban forest patches and PM2.5 concentration remains unknown. How to optimize the shape configuration of the existing forests in the limited space and effectively improve the ecological services of the urban forest ecosystem is one of the key and difficult points in future urban ecology research. Moreover, the current concerns about the ability of urban forests to reduce PM2.5 mainly include urban street trees [32,33,34], green belts [30,35] and park green spaces [36,37], and few studies have been conducted on different functional types of urban forests, which were the basis of further studies to promote the harmonious development of urban ecological services.
In this paper, Changchun city, which is undergoing rapid urbanization, was selected as the study area. We analyzed the PM2.5 concentration differences in urban forests, compared their PM2.5 reduction capacity, and revealed the relationship between PM2.5 variation in forest patch growth status and form parameters with the help of plant ecology, spatial analysis, and statistical techniques. Moreover, this research attempted to provide some useful guidance and suggestions for urban forest management regarding PM2.5 mitigation. These findings were suitable for the cities suffering from serious air pollution problems brought about by rapid urbanization. Specifically, the three objectives of this study are: (1) to determine the PM2.5 concentration difference among different forest types, (2) to explore the PM2.5 reduction ability by comparing their PM2.5 reduction distance, and (3) to reveal the key factors of urban forest patches that affect PM2.5 mitigation.

2. Materials and Methods

2.1. Study Area

Changchun city (43°05′–45°15′ N; 124°18′–127°05′ E) is the capital of Jilin Province, located in the middle latitude of the Northern Hemisphere, the hinterland of the Northeastern Plain of China [38]. The built-up area is 543 km2, and it had a population of 4.468 million at the end of 2020. Changchun is in the warm temperate zone, a continental monsoon climate area, with an annual average temperature of 7.1 °C, annual precipitation of 662 mm, and an annual sunshine duration of 2688 h in 2020. The altitude is 250–350 m in Changchun, and the main types of soil are black soil, meadow soil, and chernozem soil. The vegetation area was 228.65 km2, and the coverage rate was 42.11% [39]. In 2020, 89.8% of days had good air quality in Jilin Province. Of the days with air quality exceeding the standard, 69.6% were caused by PM2.5 [40]. From 2018 to 2020, the primary air pollutant in Changchun was PM2.5, and the annual average concentrations were 33 μg/m3,38 μg/m3, and 42 μg/m3 [40,41,42], respectively, with an annual growth rate of 27%. With the acceleration of industrialization and urbanization, atmospheric environmental quality presented a downward trend. This study takes the built-up area of Changchun city as the research area, and the real-time air pollutants data were collected by the 8 Chinese National air quality monitoring stations within the area (Figure 1).

2.2. Data Sources

The PM2.5 concentration data of 8 monitoring stations in Changchun were provided by the China Environmental Monitoring Station (http://www.cnemc.cn/, accessed on 29 August 2022). The meteorological data were from the Daily Dataset of China Surface Climatic Data (V3.0) provided by the National Meteorological Science Data Center (https://data.cma.cn/dataService/cdcindex/datacode/A.0012.0001_220/show_value/normal.html, accessed on 29 August 2022), which mainly included precipitation, average air pressure, average wind speed, average temperature, and average relative humidity. The land-use data were from the Third National Land Resources Survey. Three Gaofen-2 images of different months in autumn were selected, with the dates of 23 August, 12 September, and 5 October 2020, respectively. The images had four multispectral bands (4 m resolution), namely a blue, green, red, and near-infrared spectrum, and one panchromatic band (1 m resolution), which were obtained from the High Resolution of the Earth Observation System Jilin Data and Application Center (http://gaofen.jlu.edu.cn/).

2.3. Methods

2.3.1. Urban Forest Classification and Extraction

The urban forests in Changchun were extracted from the Gaofen-2 images by ArcGIS10.8 (ESRI, Redlands, CA, USA) (Figure 1c). They were divided into 5 types [43] according to their location, function, and management method (Table S1), namely Roadside Forest (RF), Affiliated Forest (AF), Landscape and Relaxation Forest (LF), Ecological and Public Welfare Forest (EF), and Production and Management Forest (PF). The areas of the last two urban forest types in Changchun were relatively low; therefore, only RF, AF, and LF were analyzed in this study. In order to ensure visual interpretation accuracy, 50 of each forest type (about 1%) were randomly selected for site accuracy verification using a field survey. As all kinds of urban forests have clear shape, distribution, and tone characteristics, visual interpretation accuracy reaches 100%.

2.3.2. Forest Patch Characteristic Parameters

To measure the patch characteristics of the urban forests in terms of area, boundary, shape, complexity, and quality, we selected six indexes to represent the forest patch feature, which included patch area (AREA) and patch perimeter (PERIM) on the area and boundary level; shape index (SHAPE), fractal dimension index (FRAC), and related circumscribing circle (CIRCLE) on the patch shape scale level; in addition, the Normalized Difference Vegetation Index (NDVI) was used to indicate the growth status of the urban forests. The ecological significance of the six parameters is shown in Table 1.

2.3.3. PM2.5 Concentration Data

A Land Use Regression (LUR) model was used to simulate the concentration of PM2.5 [31,44,45] in Changchun, as it can accurately reflect the spatial distribution characteristics of air pollutants with a simple model structure and less computing resources than non-linear models [31]. There were mainly two or more independent variables and one dependent variable in the LUR model, as follows:
y = λ 0 + λ 1 Χ 1 + λ 2 Χ 2 + + λ n Χ n + δ
where the dependent variable y was the PM2.5 concentration of the monitoring sites, the independent variables X1, X2…Xn were the environmental factors that influence the PM2.5 variation, λ1, λ2…λn were the associated coefficients, and σ was the random variable.
Considering the city size and the research scale, we selected five categories as the independent variables, which included the traffic factor, land use factor, population factor, meteorological factor, and vegetation factor, respectively. Buffer zones of 300 m, 600 m, 900 m, 1200 m, and 1500 m radius were established at the 8 state-controlled monitoring points in Changchun, and a total number of 55 factors were calculated to establish the LUR model. The environmental factors of each category and their relationships with the PM2.5 concentration can be seen in Table S2. The variables with a correlation coefficient less than 0.4 with PM2.5 concentration were removed, and the remaining variables were analyzed by multiple linear regression. The optimal LUR model is listed in Equation (2). Then, ArcGIS 10.8 was used to grid the study area (the grid size was 1 km × 1 km), and the relevant environmental variables of each grid center point were calculated. After standardized processing, the PM2.5 concentration of each point in autumn was calculated according to the optimal LUR model. Finally, the ordinary kriging interpolation method was used to obtain the spatial distribution of the PM2.5 concentrations (Figure S1). The mean PM2.5 concentration was 52.70 μg/m3 in Changchun.
y = 42.54 + 0.152 x I L P 900 + 3.314 x T R O A D 600 + 2.801 x M R O A D 600 - 17.953 x N D V I 300 - 19.315 x P R E 300
The adjusted R2 was 0.852, and the p value was 0.018. Where y was the PM2.5 concertation calculated by LUR, x I L P 900   was the industrial land area of the 900 m buffer zone radius; x T R O A D 600 was the total road density of the 600 m buffer zone radius (km·km-2); x M R O A D 600 was the first-level road density of the 600 m buffer zone radius (km·km-2);   x N D V I 300 was the NDVI value of the 300m buffer zone radius, and x P R E 300 was the precipitation (mm) of the 300m buffer zone radius.

2.3.4. Data Analysis

The number of patches included in the analysis was determined by a stratified random sampling method. The forest patch metrics were obtained by FRAGSTATS 4.2 after being converted to a raster format in ArcGIS 10.8 (ESRI, Redlands, CA, USA). NDVI was calculated from the Gaofen-2 images through band calculation as Equation (3) in ENVI 5.3 (ITT Visual Information Solutions, Boulder, CO, USA). The PM2.5 data from the different forest types and buffer zones were extracted by spatial analysis in ArcGIS 10.8. One-Way ANOVA was applied to find the PM2.5 concentration differences among the different forest types, and Pearson correlation analysis and regression analysis between the patch characteristic parameters and PM2.5 concentrations were conducted in R (CRAN project). The PM2.5 mitigation distance was calculated by comparing the PM2.5 concentration of different buffer zones from the forest patches. In this study, the seasonal mean concentration of PM2.5 was used, and similar meteorological conditions were assumed in the same season. In this way, the influence of the urban forest landscape on the PM2.5 concentration can be highlighted under the premise of relatively consistent meteorological conditions.
NDVI = (NIR − R)/(NIR + R)
where NIR was the near-infrared spectrum, and R was the red spectrum of the Gaofen-2 images.

3. Results

3.1. Spatial Forms, NDVI and PM2.5 Concentration of Different Urban Forest Types

As shown in Table 2, the AREA and PERIM of LF were 10.29 km2 and 2380.94 m, respectively, and were much bigger than RF and AF, while FRAC and CIRCLE were the least in LF among the three forest types. Moreover, AREA and PERIM were more discrete in LF than RF and AF. The SHAPE index appeared to be very different among the different forest types, which presented as RF > LF > AF. In addition, the mean values of NDVI in RF, LF, and LF were not too different, but the maximum and minimum values varied greatly. RF had the lowest NDVI value of 0.43, and AF had the largest value of 0.89. The PM2.5 concentration was significantly different among the different urban forest types. RF had the highest PM2.5 concentration (52.23 μg/m3) and was significantly higher than AF (46.74 μg/m3) and LF (44.07 μg/m3), and LF was significantly lower than RF and AF. However, the standard deviation (SD) of LF was much lower than RF and AF.

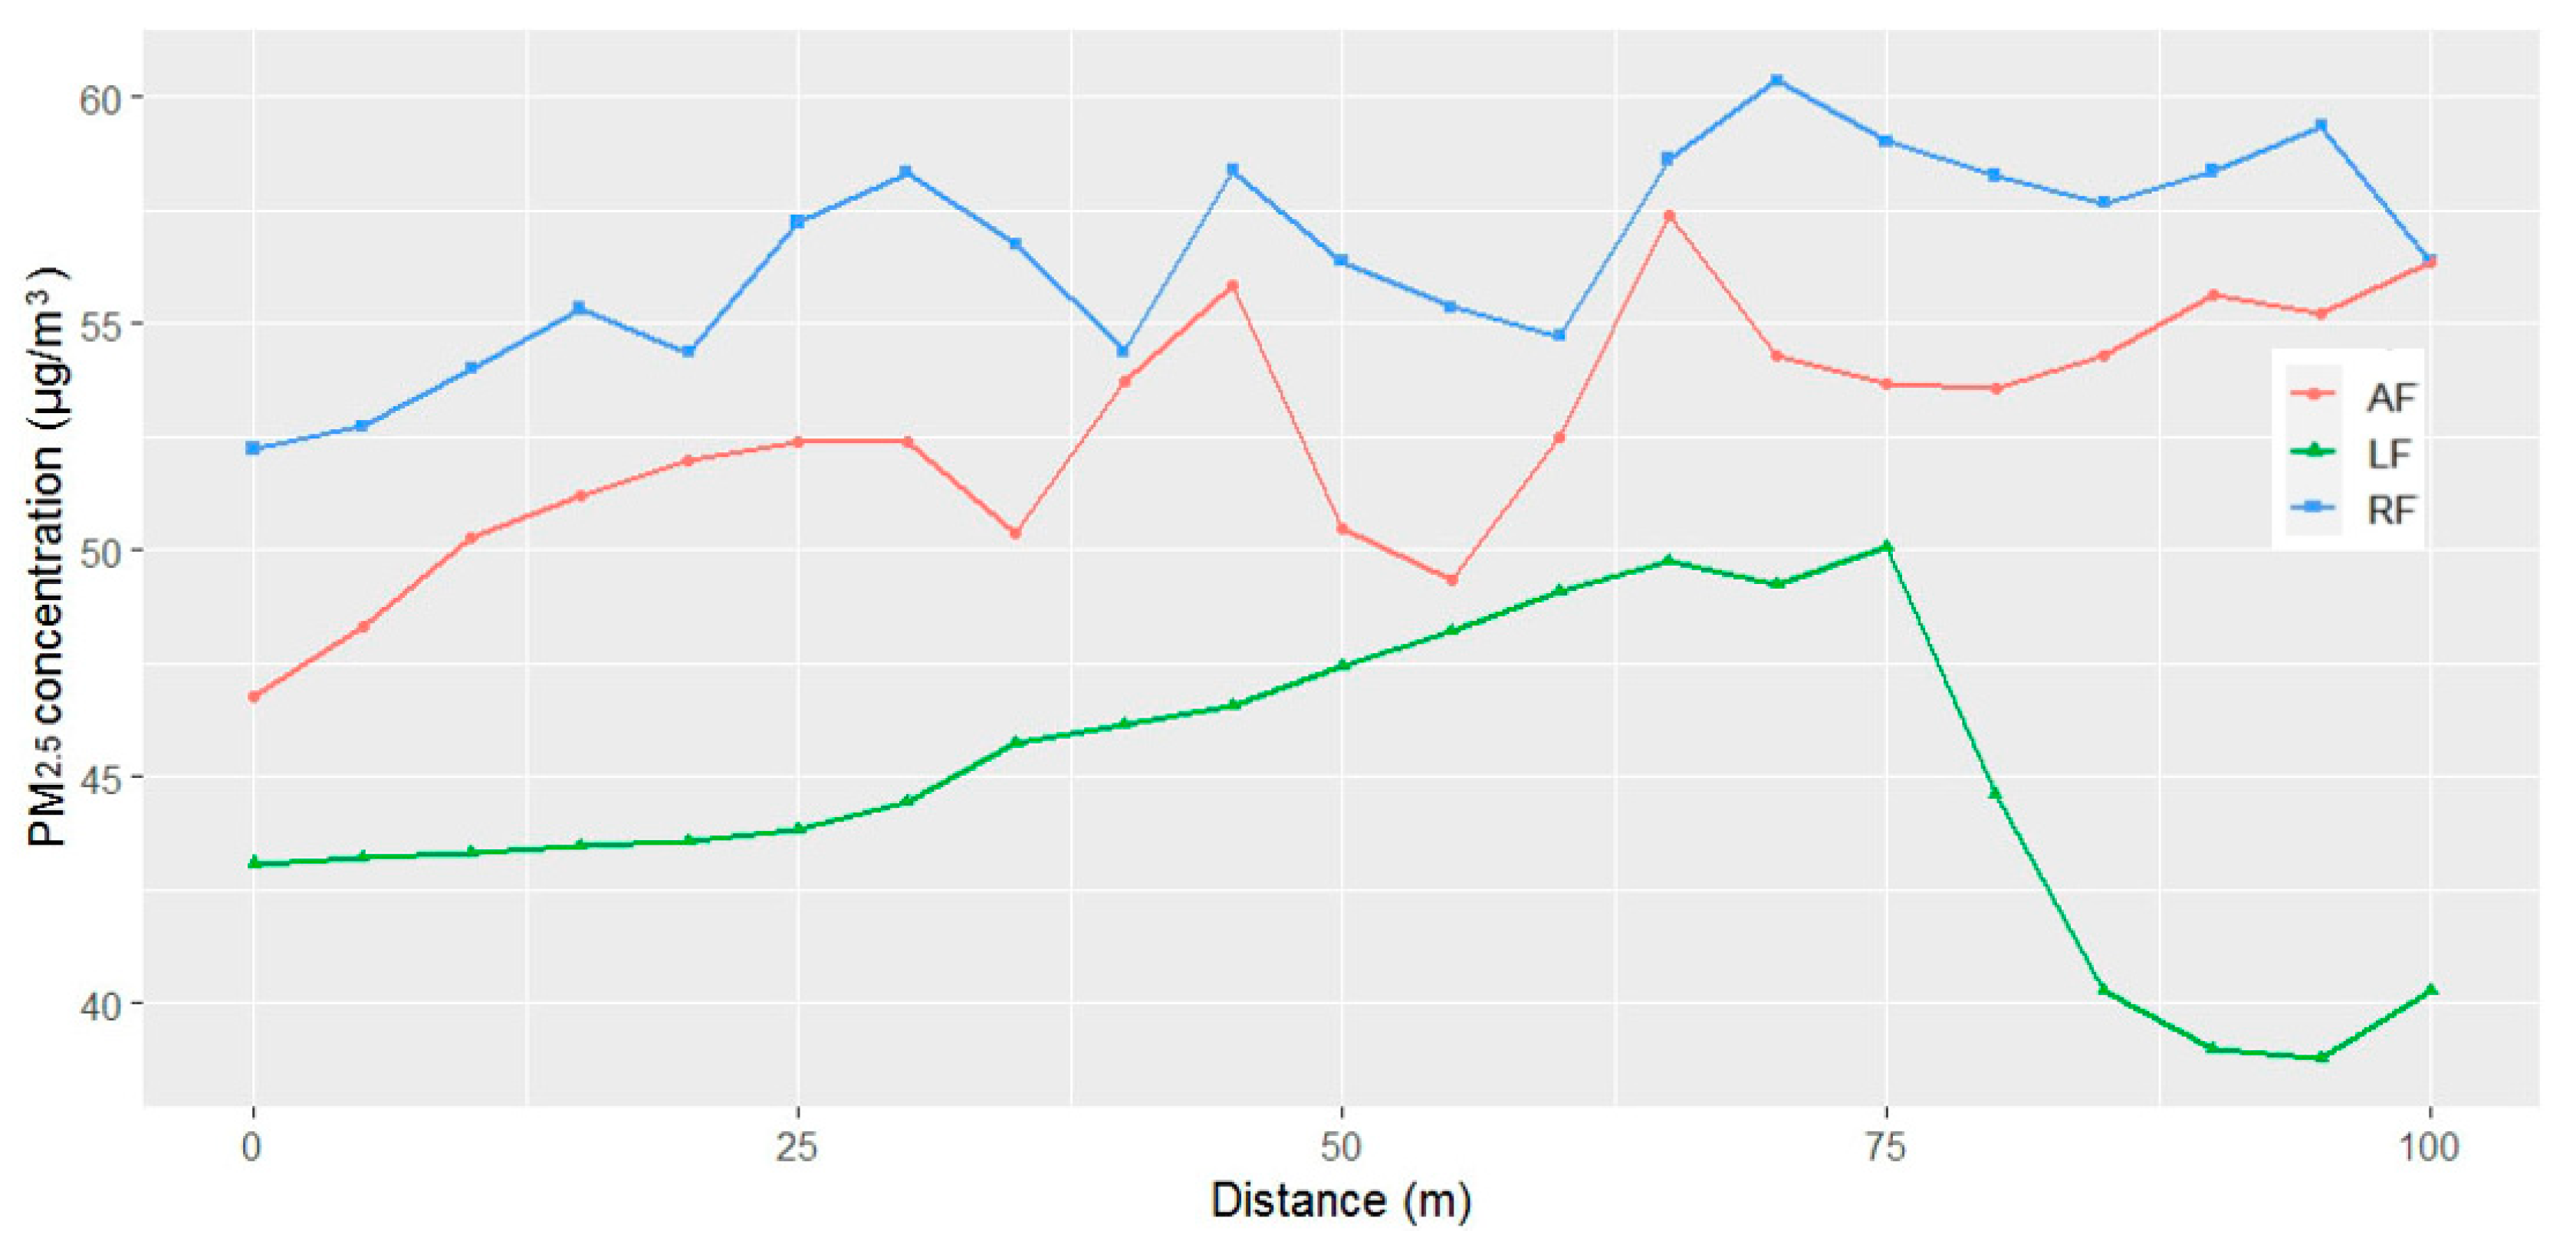
3.2. PM2.5 Reduction Capacity of Different Forest Types

As shown in Figure 2, LF had the longest PM2.5 reduction distance (80 m), and it was 5.3 times that of RF (15 m). The PM2.5 reduction distance of AF was 35 m, which was bigger than RF but much smaller than LF. The PM2.5 concentration of LF and AF fluctuated wildly within the 100 m buffer zone around the forest patch, while RF had a relatively stable variation. Moreover, the PM2.5 concentration of RF on each distance point was larger than AF and LF.

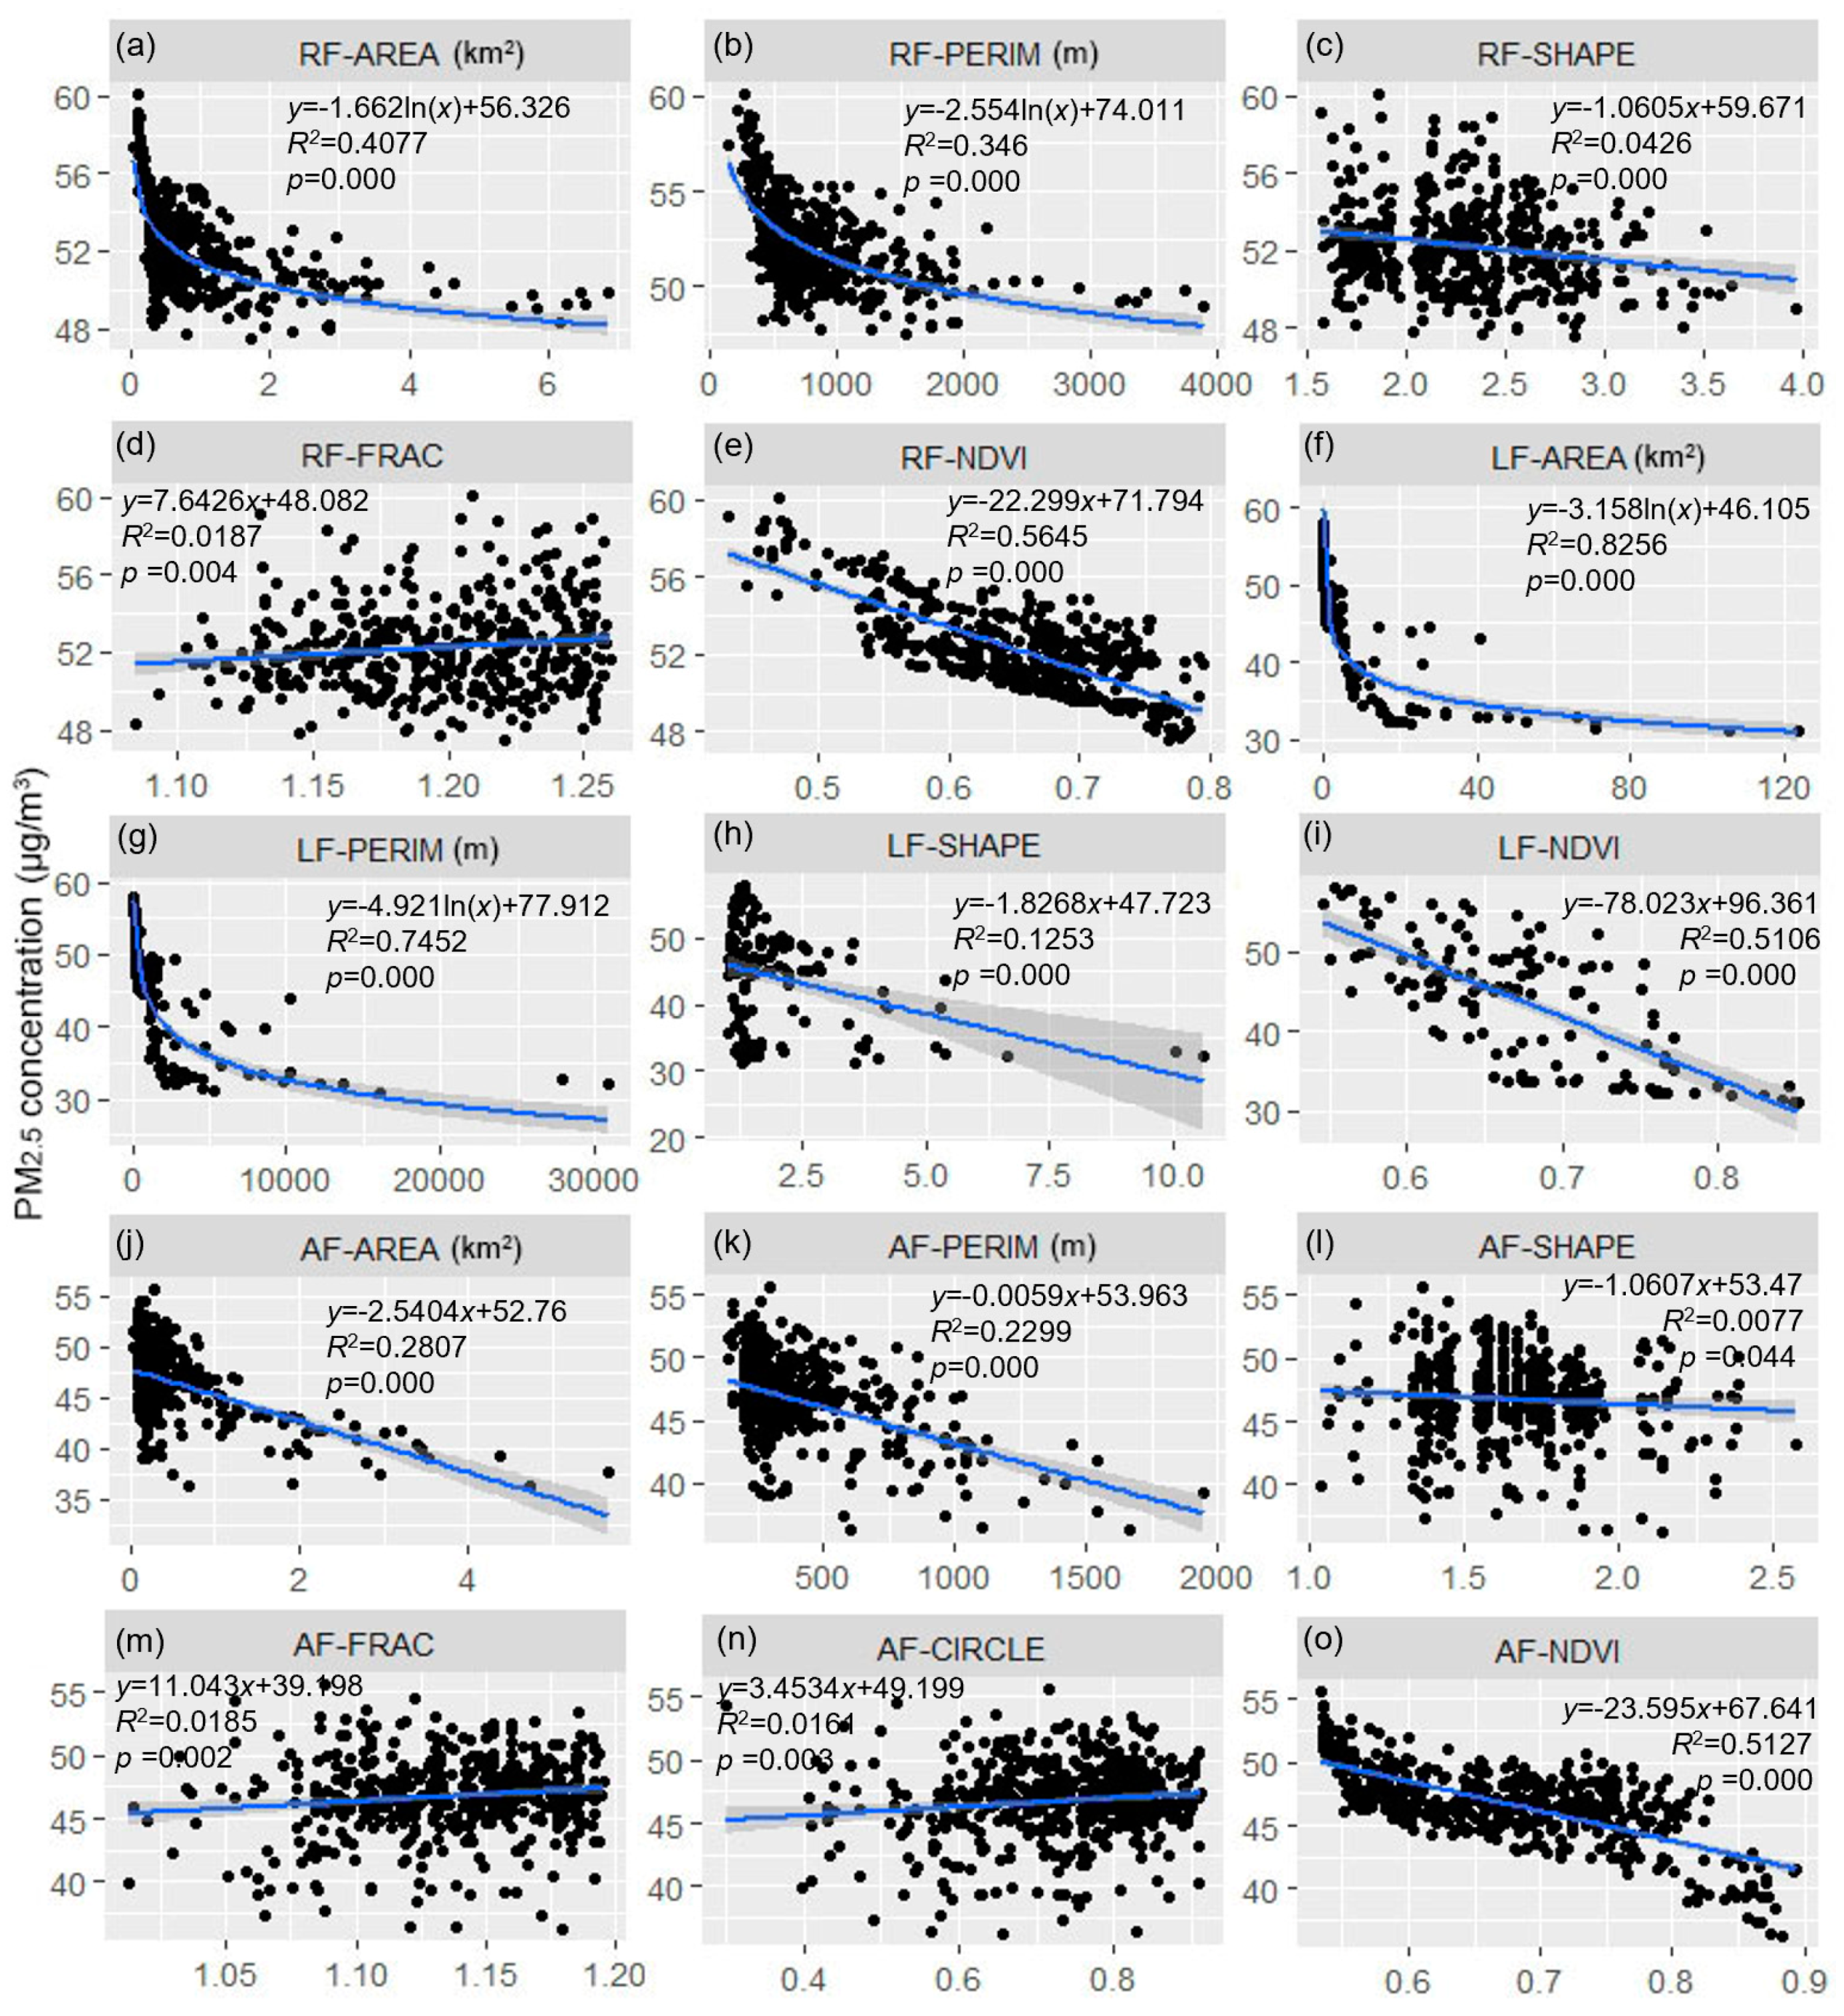
3.3. Relations of Forest Patch Characteristics Parameters and PM2.5 Concentration

3.3.1. Correlations of Forest Patch Characteristics and PM2.5 Concentration

The correlation of the patch characteristic parameters and PM2.5 concentration appeared to be different among the three forest types (Table 3). The AREA, PERIM, and NDVI of RF, LF, and AF had a high negative significance with the PM2.5 concentration. Moreover, NDVI had the biggest correlation coefficient, larger than AREA and PERIM. The SHAPE index had a negative significance in relation to the PM2.5 concentration of RF and LF at a 0.01 level but with AF at a 0.05 level. In addition, the relationship was negative between FRAC and PM2.5 concentration in LF, but it displayed a significant positive correlation in RF and AF. Moreover, the relationship between CIRCLE and the PM2.5 concentration was also inconsistent, as RF represented the negative correlation and LF and AF appeared to have a positive correlation.

3.3.2. Effects of Forest Patch Characteristics Parameters on PM2.5 Concentration

Figure 3 reveals the PM2.5 concentration variation with the urban forest patch parameters. AREA and PERI had a logarithmic relationship with the PM2.5 concentration in RF (Figure 3a,b), and LF (Figure 3f,g), but changed linearly in AF (Figure 3j,k). SHAPE had a negative linear relationship with PM2.5 concentration in all three forest types, but only 4.26%, 12.53%, and 0.77% of the variation of the PM2.5 concentration in RF, LF, and AF was associated with it (Figure 3c,h,l). Figure 3d,m show that a positive correlation existed between the PM2.5 concentration and FRAC in RF and AF, in which 1.87% and 1.85% of the PM2.5 concentration variation was caused by FRAC, respectively. CIRCLE appeared to have a positive relationship with the PM2.5 concentration in AF (Figure 3n). NDVI had the most associations with PM2.5 concentration, and it can explain 56.46%, 51.06%, and 51.27% of the PM2.5 concentration variation of RF, LF, and AF, respectively, by the linear regression models (Figure 3e,i,o).

4. Discussion

4.1. PM2.5 Mitigation Capability of Urban Forest

Urban forests can help to mitigate PM2.5 pollution, and according to Table 2, it was concluded that the PM2.5 concentrations of RF, LF, and AF were 0.89%, 16.38%, and 11.31% lower than the mean value of Changchun, respectively. The main reason that RF had a higher PM2.5 concentration than LF and AF may be due to the growth environment of their locations. RF planted by the roadside may suffer more gaseous pollutants from traffic transportation [32,35,46] than AF and LF. AF is usually located in the community or campus, and the distance from the road was further than RF, and the buildings around AF could help block pollutants. LF is usually located in favorable environments, such as parks or gardens [43]. Furthermore, apart from the advantage of its location, it also has a bigger size in the urban environment, which encourage forest ecological services to purify the atmosphere, similar to a natural forest. Moreover, the low species biodiversity of RF hindered the air pollution capacity. For the convenience of management and a trim appearance, unique species were selected for RF. Not only PM2.5 mitigation, other services such as carbon sequestration, oxygen release, as well as soil and water conservation could not reach their potential in low biodiversity [47,48]. In addition, most of the RF species had a good adaption to urban environments. However, the species in RF were not the best choice for PM2.5 removal. It was reported that conifer species ranked high in PM2.5 removal efficiency [13]. However, broad-leaf species are always selected for RF in Northern Chinese cities [49], which reduced the PM2.5 reduction capacity of RF.
The effective decreasing range of PM2.5 concertation was also a criterion for the PM2.5 reduction ability of urban forests. Generally, the further from the urban forest, the higher the PM2.5 concentration. Therefore, the breakpoints of the curve from rising to declining (Figure 2) was regarded as the maximum distance of PM2.5 reduction in urban forests. As illustrated in Figure 2, the PM2.5 mitigation distance of LF was significantly greater than RF and AF. In addition, the fluctuation ranges of RF, AF, and LF were 8.13 μg/m3, 10.64 μg/m3, and 9.81 μg/m3, respectively, in the 100m buffer zone radius. Although the fluctuation value was large in LF, all of the PM2.5 concentrations in the buffer zone radius were smaller than the average PM2.5 concentration in Changchun. Moreover, 4.76% and 57.14% of the PM2.5 concentrations were lower than the average value of RF and AF. LF had fewer ups and downs than RF and AF, which indicated its stable PM2.5 reduction capacity.

4.2. Forest Growth Status and Shape Regulated PM2.5 Concentration

NDVI had the strongest relationship with PM2.5 concentration than the other patch characteristic parameters in all of the forest types (Table 3). Healthy ecosystems provide stronger ecological services. As an important indicator reflecting plant growth and health [50,51], NDVI plays a critical role in PM2.5 reduction. Our study demonstrated that the PM2.5 concentration would decrease by more than 2.2 μg/m3 with an NDVI increasing by 0.1 (Figure 3). In addition, a negative linear correlation appeared between NDVI and the PM2.5 concentration of a forest patch, which meant that the PM2.5 concentration changed monotonously with NDVI.
In addition to NDVI, which indicated the forest growth status, the forest shape parameters also played a vital role in PM2.5 mitigation. Usually, AREA reflected the forest size. As is known, the ecological services provided by the small-sized forest were limited, and large-sized forests have stable ecological services [52], including PM2.5 reduction. However, the relationships between AREA and the PM2.5 concentration in RF and LF were non-linear; that is, the PM2.5 concentration would decrease gradually when the urban forest size increased with a forest size larger than a certain threshold. However, the AREA of AF displayed a linear variation with PM2.5 concentration. This may be caused by the AREA distribution differences among the different urban forest types. The mean AREA of RF and LF were bigger than AF (Table 2), and 96.62% of the AF patches AREA were smaller than 2 km2 (Figure 3), which did not reach the curves’ breakpoint of AF and LF. Similar to AREA, PERIM was another parameter that denoted forest size. Therefore, the relationship between PERIM and the PM2.5 concentration showed the same trend as the AREA in RF, LF, and AF. However, PERIM also signified forest patch boundary complexity. A large PERIM with the same AREA meant a longer border and more contact opportunities with the outside environment. When PERIM was bigger than the threshold, the PM2.5 reduction efficiency would decline, and atmospheric purification could not keep pace with the increasing rate of PM2.5 concentration. SHAPE signifies the regularity of the forest patch [30], the larger the value, the more irregular the forest patch (Table 1), and the bigger the ecologic ecotone area. As the results in Table 3 suggest, the PM2.5 concentrations in RF and LF were highly negatively correlated with SHAPE. It suggested that the irregular shape of the forest patch could help to mitigate PM2.5 concentration. On the other hand, the relationship between SHAPE and the PM2.5 concentration of AF was relatively low, as well as the explanation degree in the regression model (Table 3 and Figure 3). The mean SHAPE of AF was much smaller than RF and LF, and 92.29% were less than 2. For aesthetic purposes, green community spaces are usually designed in a square shape, and as such, the square or near-square shape of AF had fewer opportunities than the complicated shape for gas flow and exchange. Therefore, the SHAPE of AF had a lower significance level regarding the PM2.5 concentration compared with RF and LF. The variations in the FARC and PM2.5 concentration were not consistent in different urban forest types. With an increase in FARC, the PM2.5 concentration increased accordingly in RF and AF. However, there existed a weak negative relationship in LF. Unlike SHAPE, FARC represented the shape complexity of the forest patch on a spatial scale. Despite the FARC in RF, LF and AF had few differences; the SDs of LF were 12 times that of RF and two times that of AF. Therefore, there was no significant connection between FARC and the PM2.5 concentration of LF due to the large variation. CIRCLE reflected the shape of the patches, which either tend to be round or in strips (Table 1). The smaller the value, the closer the shape was to a circle. On the other hand, the closer the value was to 1, the closer the shape was to a strip. As shown in Table 2, RF had the biggest CIRCLE, which indicated that the RF patches were more stripped than LF and AF. The strip shape of the patches had more chances to contact and exchange with external materials, including particulate matter. Therefore, the CIRCLE of RF had an opposite relationship with the PM2.5 concentration than LF and AF.

5. Conclusions and Implications

This study extracted urban forest patches from remote sensing images and calculated patch quality and shape parameters with the help of image processing and landscape ecology methods. By using the LUR model, a PM2.5 concentration distribution map was simulated to compare the difference in the ecological services regarding the PM2.5 reduction in three urban forest types. Then the decisive factors influencing PM2.5 concentration were obtained by correlation analysis and a regression model. It was concluded that urban forests play an important role in PM2.5 mitigation. The PM2.5 concentration of the urban forests varied due to their locations and the opportunity of contact with contaminants. Furthermore, LF had the strongest PM2.5 reduction capacity, larger than RF and AF, for it had the biggest PM2.5 reduction distance when compared to RF and AF. NDVI was the most important factor for mitigating the PM2.5 concentration than the other patch shape indexes. The AREA, PERIM, and SHAPE parameters also significantly affected PM2.5 concentration. The PM2.5 concentration decreased rapidly when the AREA and PERIM of the forest patch were small and then declined slowly when AREA and PERIM increased. In addition, the PM2.5 variation of RF and LF cannot be regulated by FRAC, and CIRCLE only has a positive relation with AF.
Urban air quality suffers enormous pressure under intensive urbanization and global change. Urban forest ecosystems have huge potential for atmosphere purification, including PM2.5 mitigation. Reasonable forest management measures can help to sustain the stability of ecological services. The exact connections between PM2.5 concentration and urban forest characteristics are critical to establishing such practices. The following recommendations should be considered to decrease PM2.5 pollution.
(1)
Improve urban forest growth status or health condition. Growth status represented by NDVI had the greatest influence on PM2.5 reduction. LF and AF were far away from road traffic pollution and usually received more maintenance than RF. Therefore, the focus for RF should be their conservation in terms of water, fertilizer, and pest and disease management in urban management.
(2)
Increase the forest patch area, perimeter, and irregularity. As we know, it is difficult to increase the forest size in the limited urban environment. Nevertheless, the amount of forest can be increased through roof greening, vertical greening, and building metope greening, etc. On the other hand, when the forest size is fixed, the PM2.5 concentration can be effectively reduced by increasing the length of its boundary and creating a more irregular spatial shape of the boundary, which helps to maximize the reduction ability of the urban forest. In addition, to improve the PM2.5 mitigation capacity of AF, an irregular round boundary should be considered for landscape planning.
(3)
The regression model between the patch parameters of the urban forests and PM2.5 concentrations should be used to evaluate the reduction effect of the forest. Low PM2.5 concentration patches should be selected as the optimal urban forest planning and design scheme. Through assessing the PM2.5 reduction capacity of different forest types, related transformation and optimization measures could be implemented.

Supplementary Materials

The following supporting information can be downloaded at: https://www.mdpi.com/article/10.3390/f13091408/s1, Figure S1: Spatial distribution of PM2.5 concentration in Changchun; Table S1: Urban forest classification; Table S2: Correlations between environmental factors and PM2.5 concentration for LUR model.

Author Contributions

C.Z., G.B. and D.Z. lead to collect and analyze the data. Forest patches were extracted by Y.S. The manuscript was written by C.Z. and G.B. The article was revised by D.Z. and G.B. All authors have read and agreed to the published version of the manuscript.

Funding

The research article was supported by the Natural Science Foundation of Jilin Province (20220101315JC), the Scientific Research Cultivation Project of Changchun University (ZKC202005; ZKQ201913), and the “Climbing” Program of Changchun University (ZKP202015).

Conflicts of Interest

The authors declare no conflict of interest.

References

  1. She, Q.; Cao, S.; Zhang, S.; Zhang, J.; Zhu, H.; Bao, J.; Meng, X.; Liu, M.; Liu, Y. The impacts of comprehensive urbanization on PM2.5 concentrations in the Yangtze River Delta, China. Ecol. Indic. 2021, 132, 108337. [Google Scholar] [CrossRef]
  2. Li, J.; Lei, J.; Li, S.; Yang, Z.; Tong, Y.; Zhang, S.; Duan, Z. Spatiotemporal analysis of the relationship between urbanization and the eco-environment in the Kashgar metropolitan area, China. Ecol. Indic. 2022, 135, 108524. [Google Scholar] [CrossRef]
  3. World Urbanization Prospects: The 2018 Revision; United Nations: New York, NY, USA, 2018.
  4. 2020 China Statistical Yearbook; China National Bureau of Statistic: Beijing, China, 2021.
  5. Ren, M.; Fang, X.; Li, M.; Sun, S.; Pei, L.; Xu, Q.; Ye, X.; Cao, Y. Concentration-Response Relationship between PM2.5 and Daily Respiratory Deaths in China: A Systematic Review and Metaregression Analysis of Time-Series Studies. Biomed. Res. Int. 2017, 2017, 5806185. [Google Scholar] [CrossRef] [PubMed]
  6. Liang, Z.; Wang, W.; Wang, Y.; Ma, L.; Liang, C.; Li, P.; Yang, C.; Wei, F.; Li, S.; Zhang, L. Urbanization, ambient air pollution, and prevalence of chronic kidney disease: A nationwide cross-sectional study. Environ. Int. 2021, 156, 106752. [Google Scholar] [CrossRef] [PubMed]
  7. Ambient Air Pollution; World Health Organization: Geneva, Switzerland. 2020. Available online: www.who.int/multi-media/details/ambient-air-pollution (accessed on 29 August 2022).
  8. Lu, C.W.; Fu, J.; Liu, X.F.; Chen, W.W.; Hao, J.L.; Li, X.L.; Pant, O.P. Air pollution and meteorological conditions significantly contribute to the worsening of allergic conjunctivitis: A regional 20-city, 5-year study in Northeast China. Light Sci. Appl. 2021, 10, 190. [Google Scholar] [CrossRef]
  9. Liu, Y.; Tong, D.; Cheng, J.; Davis, S.J.; Yu, S.; Yarlagadda, B.; Clarke, L.E.; Brauer, M.; Cohen, A.J.; Kan, H.; et al. Role of climate goals and clean-air policies on reducing future air pollution deaths in China: A modelling study. Lancet Planet. Health 2022, 6, e92–e99. [Google Scholar] [CrossRef]
  10. Shao, Y.; Ma, Z.; Wang, J.; Bi, J. Estimating daily ground-level PM2.5 in China with random-forest-based spatiotemporal kriging. Sci. Total Environ. 2020, 740, 139761. [Google Scholar] [CrossRef] [PubMed]
  11. Pope, C.A., 3rd; Burnett, R.T.; Thurston, G.D.; Thun, M.J.; Calle, E.E.; Krewski, D.; Godleski, J.J. Cardiovascular mortality and long-term exposure to particulate air pollution: Epidemiological evidence of general pathophysiological pathways of disease. Circulation 2004, 109, 71–77. [Google Scholar] [CrossRef]
  12. Song, Y.; Wang, X.; Maher, B.A.; Li, F.; Xu, C.; Liu, X.; Sun, X.; Zhang, Z. The spatial-temporal characteristics and health impacts of ambient fine particulate matter in China. J. Clean. Prod. 2016, 112, 1312–1318. [Google Scholar] [CrossRef]
  13. Yang, J.; Chang, Y.; Yan, P. Ranking the suitability of common urban tree species for controlling PM2.5 pollution. Atmos. Pollut. Res. 2015, 6, 267–277. [Google Scholar] [CrossRef] [Green Version]
  14. Cheng, Z.; Wang, S.; Jiang, J.; Fu, Q.; Chen, C.; Xu, B.; Yu, J.; Fu, X.; Hao, J. Long-term trend of haze pollution and impact of particulate matter in the Yangtze River Delta, China. Enviton. Pollut. 2013, 182, 101–110. [Google Scholar] [CrossRef] [PubMed]
  15. Pratichi Singh, D.Y.; Pandian, E. Link between air pollution and global climate change. Glob. Clim. Change 2021, 5, 79–108. [Google Scholar]
  16. Nowak, D.J.; Crane, D.E.; Stevens, J.C. Air pollution removal by urban trees and shrubs in the United States. Urban For. Urban Green. 2006, 4, 115–123. [Google Scholar] [CrossRef]
  17. Nowak, D.J.; Hirabayashi, S.; Bodine, A.; Hoehn, R. Modeled PM2.5 removal by trees in ten U.S. cities and associated health effects. Environ. Pollut. 2013, 178, 395–402. [Google Scholar] [CrossRef] [PubMed]
  18. Cavanagh, J.-A.E.; Zawar-Reza, P.; Wilson, J.G. Spatial attenuation of ambient particulate matter air pollution within an urbanised native forest patch. Urban For. Urban Green. 2009, 8, 21–30. [Google Scholar] [CrossRef]
  19. Nowak, D.J.; Hirabayashi, S.; Bodine, A.; Greenfield, E. Tree and forest effects on air quality and human health in the United States. Environ. Pollut. 2014, 193, 119–129. [Google Scholar] [CrossRef] [PubMed]
  20. Ren, Z.; He, X.; Pu, R.; Zheng, H. The impact of urban forest structure and its spatial location on urban cool island intensity. Urban Ecosyst. 2018, 21, 863–874. [Google Scholar] [CrossRef]
  21. Zhou, W.; Cao, F. Effects of changing spatial extent on the relationship between urban forest patterns and land surface temperature. Ecol. Indic. 2020, 109, 105778.1–105778.8. [Google Scholar] [CrossRef]
  22. Wu, J.; Wang, Y.; Qiu, S.; Peng, J. Using the modified i-Tree Eco model to quantify air pollution removal by urban vegetation. Sci. Total Environ. 2019, 688, 673–683. [Google Scholar] [CrossRef] [PubMed]
  23. Tallis, M.; Taylor, G.; Sinnett, D.; Freer-Smith, P. Estimating the removal of atmospheric particulate pollution by the urban tree canopy of London, under current and future environments. Landsc. Urban Plan. 2011, 103, 129–138. [Google Scholar] [CrossRef]
  24. Beckett, K.P.; Freer Smith, P.H.; Taylor, G. Effective tree species for local air quality management. J. Arboric. 2000, 26, 12–19. [Google Scholar]
  25. Liu, X.; Yu, X.; Zhang, Z. PM2.5 Concentration Differences between Various Forest Types and Its Correlation with Forest Structure. Atmosphere 2015, 6, 1801–1815. [Google Scholar] [CrossRef] [Green Version]
  26. Nguyen, T.; Yu, X.; Zhang, Z.; Liu, M.; Liu, X. Relationship between types of urban forest and PM2.5 capture at three growth stages of leaves. J Environ. Sci. 2015, 27, 33–41. [Google Scholar] [CrossRef] [PubMed]
  27. Łowicki, D. Landscape pattern as an indicator of urban air pollution of particulate matter in Poland. Ecol. Indic. 2019, 97, 17–24. [Google Scholar] [CrossRef]
  28. Wu, J.; Xie, W.; Li, W.; Li, J. Effects of Urban Landscape Pattern on PM2.5 Pollution—A Beijing Case Study. PLoS ONE 2015, 10, e0142449. [Google Scholar] [CrossRef]
  29. Bagheri, Z.; Nadoushan, M.A.; Abari, M.F. Evaluation the Effect of Green Space on Air Pollution Dispersion using landscape metrics: A case study of Isfahan city. Fresenius Environ. Bull. 2017, 26, 8135–8145. [Google Scholar]
  30. Lei, Y.; Duan, Y.; He, D.; Zhang, X.; Chen, L.; Li, Y.; Gao, Y.; Tian, G.; Zheng, J. Effects of Urban Greenspace Patterns on Particulate Matter Pollution in Metropolitan Zhengzhou in Henan, China. Atmosphere 2018, 9, 199. [Google Scholar] [CrossRef]
  31. Feng, H.; Zou, B.; Tang, Y. Scale- and Region-Dependence in Landscape-PM2.5 Correlation: Implications for Urban Planning. Remote Sens. 2017, 9, 918. [Google Scholar] [CrossRef]
  32. Kim, S.; Lee, S.; Hwang, K.; An, K. Exploring Sustainable Street Tree Planting Patterns to Be Resistant against Fine Particles (PM2.5). Sustainability 2017, 9, 1709. [Google Scholar] [CrossRef]
  33. Jin, S.; Guo, J.; Wheeler, S.; Kan, L.; Che, S. Evaluation of impacts of trees on PM2.5 dispersion in urban streets. Atmos. Environ. 2014, 99, 277–287. [Google Scholar] [CrossRef]
  34. Islam, M.N.; Rahman, K.-S.; Bahar, M.M.; Habib, M.A.; Ando, K.; Hattori, N. Pollution attenuation by roadside greenbelt in and around urban areas. Urban For. Urban Green. 2012, 11, 460–464. [Google Scholar] [CrossRef]
  35. Chen, J.; Yu, X.; Sun, F.; Lun, X.; Fu, Y.; Jia, G.; Zhang, Z.; Liu, X.; Mo, L.; Bi, H. The Concentrations and Reduction of Airborne Particulate Matter (PM10, PM2.5, PM1) at Shelterbelt Site in Beijing. Atmosphere 2015, 6, 650–676. [Google Scholar] [CrossRef]
  36. Sun, F.; Yin, Z.; Lun, X.; Zhao, Y.; Li, R.; Shi, F.; Yu, X. Deposition velocity of PM2.5 in the winter and spring above deciduous and coniferous forests in Beijing, China. PLoS ONE 2014, 9, e97723. [Google Scholar] [CrossRef] [PubMed]
  37. Liu, J.; Zhai, J.; Zhu, L.; Yang, Y.; Liu, J.; Zhang, Z. Particle removal by vegetation: Comparison in a forest and a wetland. Environ. Sci. Pollut. Res. Int. 2017, 24, 1597–1607. [Google Scholar] [CrossRef]
  38. 2020 Jilin Statistical Yearbook; Statistic Bureau of Jilin: Changchun, China, 2021.
  39. 2020 Changchun Statistical Yearbook; Changchun Bureau of Statistics: Changchun, China, 2021.
  40. 2020 State of the Environment Bulletin of Jilin Province; Ecology and Environment Department of Jilin Province: Changchun, China, 2021.
  41. 2018 State of the Environment Bulletin of Jilin Province; Ecology and Environment Department of Jilin Province: Changchun, China, 2019.
  42. 2019 State of the Environment Bulletin of Jilin Province; Ecology and Environment Department of Jilin Province: Changchun, China, 2020.
  43. Zhai, C.; Wang, W.; He, X.; Zhou, W.; Xiao, L.; Zhang, B. Urbanization Drives SOC Accumulation, Its Temperature Stability and Turnover in Forests, Northeastern China. Forests 2017, 8, 130. [Google Scholar] [CrossRef]
  44. Pitiranggon, M.; Johnson, S.; Haney, J.; Eisl, H.; Ito, K. Long-term trends in local and transported PM2.5 pollution in New York City. Atmos. Environ. 2021, 248, 118238. [Google Scholar] [CrossRef]
  45. Xu, X.; Qin, N.; Yang, Z.; Liu, Y.; Cao, S.; Zou, B.; Jin, L.; Zhang, Y.; Duan, X. Potential for developing independent daytime/nighttime LUR models based on short-term mobile monitoring to improve model performance. Environ. Pollut. 2021, 268 Pt. B, 115951. [Google Scholar] [CrossRef]
  46. Zhao, M.; Liu, Q.; Xu, F.; Cheng, C. Effects of greenbelt plant configuration on atmospheric PM2.5 in Beijing. Int. J. Sustain. Dev. World Ecol. 2017, 25, 176–183. [Google Scholar] [CrossRef]
  47. Sebastiani, A.; Buonocore, E.; Franzese, P.P.; Riccio, A.; Chianese, E.; Nardella, L.; Manes, F. Modeling air quality regulation by green infrastructure in a Mediterranean coastal urban area: The removal of PM10 in the Metropolitan City of Naples (Italy). Ecol. Model. 2021, 440, 109383. [Google Scholar] [CrossRef]
  48. Ohsawa, T. Idea paper: How are ecosystem services related to biodiversity and ecological integrity in each site under climate change? Ecol. Res. 2022, 37, 461–465. [Google Scholar] [CrossRef]
  49. Zhang, D.; Zheng, H.; He, X.; Ren, Z.; Zhai, C.; Yu, X.; Mao, Z.; Wang, P. Effects of forest type and urbanization on species composition and diversity of urban forest in Changchun, Northeast China. Urban Ecosyst. 2015, 19, 455–473. [Google Scholar] [CrossRef]
  50. Jin, H.; Chen, X.; Wang, Y.; Zhong, R.; Zhao, T.; Liu, Z.; Tu, X. Spatio-temporal distribution of NDVI and its influencing factors in China. J. Hydrol. 2021, 603, 127129. [Google Scholar] [CrossRef]
  51. Ma, Y.; Zhang, Q.; Yi, X.; Ma, L.; Zhang, L.; Huang, C.; Zhang, Z.; Lv, X. Estimation of Cotton Leaf Area Index (LAI) Based on Spectral Transformation and Vegetation Index. Remote Sens. 2021, 14, 136. [Google Scholar] [CrossRef]
  52. Liu, J.; Xiao, B.; Jiao, J.; Li, Y.; Wang, X. Modeling the response of ecological service value to land use change through deep learning simulation in Lanzhou, China. Sci. Total Environ. 2021, 796, 148981. [Google Scholar] [CrossRef]
Figure 1. (a) The Administrative Map of China, with Changchun city displayed in red color. (b) The Administrative Map of Changchun city, with the red line indicated the built-up area. (c) Map of Changchun built-up area, different types of urban forest and the location of China State PM2.5 Monitoring Sites.
Forests 13 01408 g001
Figure 2. The PM2.5 reduction distance of RF, LF, and AF. Note: Refer to Table S1 for the meaning of the abbreviated forest types.
Forests 13 01408 g002
Figure 3. Regression analysis of PM2.5 concentration and forest patch characteristics parameters. Notes: Refer to Table S1 for the meaning of the abbreviated forest types, and Table 1 for the meaning of the abbreviated forest patch characteristic parameters, respectively. Figures (ae) were the regression model between PM2.5 concentration and AREA, PERIM, SHAPE, FRAC and NDVI respectively in RF, Figures (fi) were the regression model between PM2.5 concentration and AREA, PERIM, SHAPE and NDVI respectively in LF, and Figures (jo) were the regression model between PM2.5 concentration and AREA, PERIM, SHAPE, FRAC, CIRCLE and NDVI respectively in AF.
Forests 13 01408 g003
Table 1. Name, meaning, and range of forest patch characteristic parameters.
Forest Patch MetricsDefinitionEcological MeaningData Range
Patch Area (AREA)The extent of urban forest patch.The larger the number, the larger the area, and richer the species diversity.AREA > 0
Patch Perimeter (PERIM)The length of urban forest patch edge.The larger the number, the larger the perimeter. It also reflects the complexity of the forest edge.PERIM > 0
Shape Index (SHAPE)Degree of regularity of patch shape.The larger the value, the more complex the patch shape. When the value approaches 1, it indicates that the patches are aggregated to the maximum extent (such as square or near square).SHAPE ≥ 1
Fractal Dimension Index (FRAC)The complexity of patch shape on spatial scale.The larger the value, the more complex the shape and the greater the ecological complexity.1 ≤ FRAC ≤ 2
Related Circumscribing Circle (CIRCLE)The degree of near-circular or near-strip shape of forest patch.The smaller value means the shape tends to be round, while the larger value indicates the patch shape tends to be strip.0 < CIRCLE < 1
Normalized Difference Vegetation Index (NDVI)The degree of forest coverage and health condition.The positive value indicates vegetation exist, and the larger the value, the greater the vegetation coverage.−1 < NDVI < 1
Table 2. Descriptive statistic of forest patch characteristic parameters and PM2.5 concentration of three forest types.
Forest TypeIndexMax.Min.MeanSD
RFAREA (km2)6.850.040.881.03
PERIM (m)3880140825.42521.19
SHAPE3.961.572.310.43
FRAC1.261.081.200.04
CIRCLE0.970.570.880.07
NDVI0.790.430.650.07
PM2.5 (μg/m3)60.1047.5252.23 a2.22
LFAREA (km2)123.710.0110.2919.09
PERIM (m)30,80064.002380.944331.54
SHAPE10.581.032.001.47
FRAC1.361.011.110.83
CIRCLE0.950.090.610.18
NDVI0.850.550.670.07
PM2.5 (μg/m3)58.0131.0044.07c7.57
AFAREA (km2)5.640.040.400.62
PERIM (m)1940140380.23245.20
SHAPE2.571.031.630.25
FRAC1.201.011.140.37
CIRCLE0.910.300.730.11
NDVI0.890.530.670.09
PM2.5 (μg/m3)55.6136.3246.74 b3.00
Notes: Different letters indicated significant differences. Refer to Table S1 for the meaning of the abbreviated forest types, and Table 1 for the meaning of the abbreviated forest patch characteristic parameters, respectively.
Table 3. Correlations of forest patch characteristic parameters and PM2.5 concentration.
Forest TypeAREAPERIMSHAPEFRACCIRCLENDVI
RF−0.447 **−0.475 **−0.206 **0.137 **−0.035−0.751 **
LF−0.648 **−0.542 **−0.354 **−0.1020.035−0.715 **
AF−0.530 **−0.479 **−0.088 *0.136 **0.127 **−0.716 **
Notes: * Correlation is significant at 0.05 level; ** Correlation is significant at 0.01 level. Refer to Table S1 for the meaning of the abbreviated forest types, and Table 1 for the meaning of the abbreviated forest patch characteristic parameters, respectively.
Publisher’s Note: MDPI stays neutral with regard to jurisdictional claims in published maps and institutional affiliations.

