Article

Developing and Comparing Individual Tree Growth Models of Major Coniferous Species in South Korea Based on Stem Analysis Data

1
Institute of Forest Science, Kangwon National University, Chuncheon 24341, Republic of Korea
2
Natural Resources Institute Finland (Luke), Latokartanonkaari 9, 00790 Helsinki, Finland
3
Division of Forest Science, College of Forest and Environmental Sciences, Kangwon National University, Chuncheon 24341, Republic of Korea
*
Author to whom correspondence should be addressed.
These authors contributed equally to this work.
Forests 2023, 14(1), 115; https://doi.org/10.3390/f14010115
Submission received: 30 November 2022 / Revised: 23 December 2022 / Accepted: 4 January 2023 / Published: 7 January 2023
(This article belongs to the Section Forest Ecology and Management)

Abstract

:
Tree growth in Korean red pine (Pinus densiflora, hereafter Pd), Korean white pine (Pinus koraiensis, hereafter Pk), and Japanese larch (Larix kaempferi, hereafter Lk) was modeled using Logistic, Korf, Gompertz, Chapman-Richards, and Weibull equations and stem analysis data from sample trees: 38 trees for Pd, 46 trees for Pk, and 45 trees for Lk. The models were fitted to the total increment of tree size variables, diameter at breast height (DBH), height, basal area, and stem volume, as a function of age. After selecting the best-fit growth function, the current annual increment (CAI) and mean annual increment (MAI) were compared for each variable by species. The optimal growth functions were Chapman-Richards for DBH and stem volume, Korf for height, and Gompertz for basal area. The parameter estimates in the final models were all significant (p < 0.01) with best-fit statistics and unbiased residual plots. When plotted with observed values, the growth patterns of each variable were represented properly. The predicted growth curves over age were concave with respect to the Y-axis in DBH and height but lightly convex in basal area, and explicitly convex in stem volume, whereas an asymptote of sigmoid curve in stem volume was not apparent until 100 years. Age with the maximum MAI among variables was arranged similarly to CAI; the age with maximum MAI was earliest for DBH and latest for volume. The maximum growth was achieved earliest in Lk, followed by Pk and Pd. The developed models were able to predict tree size variables and serve as a reference to understand growth characteristics by species.

1. Introduction

Korean red pine (Pinus densiflora Siebold & Zucc., hereafter Pd), Korean white pine (Pinus koraiensis S. & Z., hereafter Pk), and Japanese larch (Larix kaempferi (Lamb.) Carrière, hereafter Lk) are the major plantation species in South Korea because they are fast-growing and commercially used for lumber [1,2,3]. These species have been intensively planted since the 1970s. In 2020, approximately 36.9% (2,319,832 ha) of forested land in South Korea was occupied by coniferous species [4]. Out of the total coniferous forested area, 68.1% (1,579,787 ha), 6.5% (151,946 ha), and 11.2% (260,255 ha) was occupied by Pd, Pk, and Lk, respectively [4]. Due to the continued importance of these tree species as commercial wood supply, concerns have increased regarding their growing methods and management, as well as future expectations for the growth and development of these species.
In contemporary stand management planning, selecting a tree growth function is an important task of forest science. Growth functions, which are statistical expressions of biological growth principles, form the basis for the realistic determination of stand productivity level, tree dimensions, and potential structure assortments [5,6,7]. Growth functions describe the incremental growth changes of an individual or population over time [8]. Selecting the appropriate growth functions for tree and stand modeling is important for developing growth and yield models.
Sigmoid growth functions are more commonly used than non-sigmoid growth functions in forest modeling as the diameter at breast height (DBH), height, and basal area of trees are asymptotic with age [9,10,11]. The growth functions have been associated with immediate application in regard to forestry management planning. The functions are based on knowledge, definition, and usage of characteristics on the growth curve, and periodic and average increment curves [12].
For these reasons, the models using sigmoid growth functions have been developed to understand growth characteristics and predict tree size in the forestry in advanced countries [10,13,14,15,16,17,18,19]. In addition to the total increment of tree size, current annual increment (CAI) and mean annual increment (MAI) are important growth characteristics because those indicate a quantitative amount of increment in relation to the change in age and provide an implication of growth rate, which is also used for economic assessment [8,11]. They can help to evaluate the age at which a tree achieves the maximum size [20,21,22]. Yet, there is a lack of relevant studies even for the major commercial species such as Pd, Pk, and Lk. Thus, the information on tree growth remains unknown and any comparisons among species incomplete. At present, the variables of tree size in South Korea cannot be predicted because research on growth functions is lacking.
This study aimed to fit the growth models of DBH, height, basal area, and stem volume for Pd, Pk, and Lk using widely used sigmoid growth functions in the field of forest biometrics and to identify the best-fit growth model for each variable of the three species. After determining the best growth model, the total increment, CAI, and MAI of each variable over age were derived from the best growth models of the three species. Based on the simulation, additionally, the growth processes of each variable were compared for the three species.

2. Materials and Methods
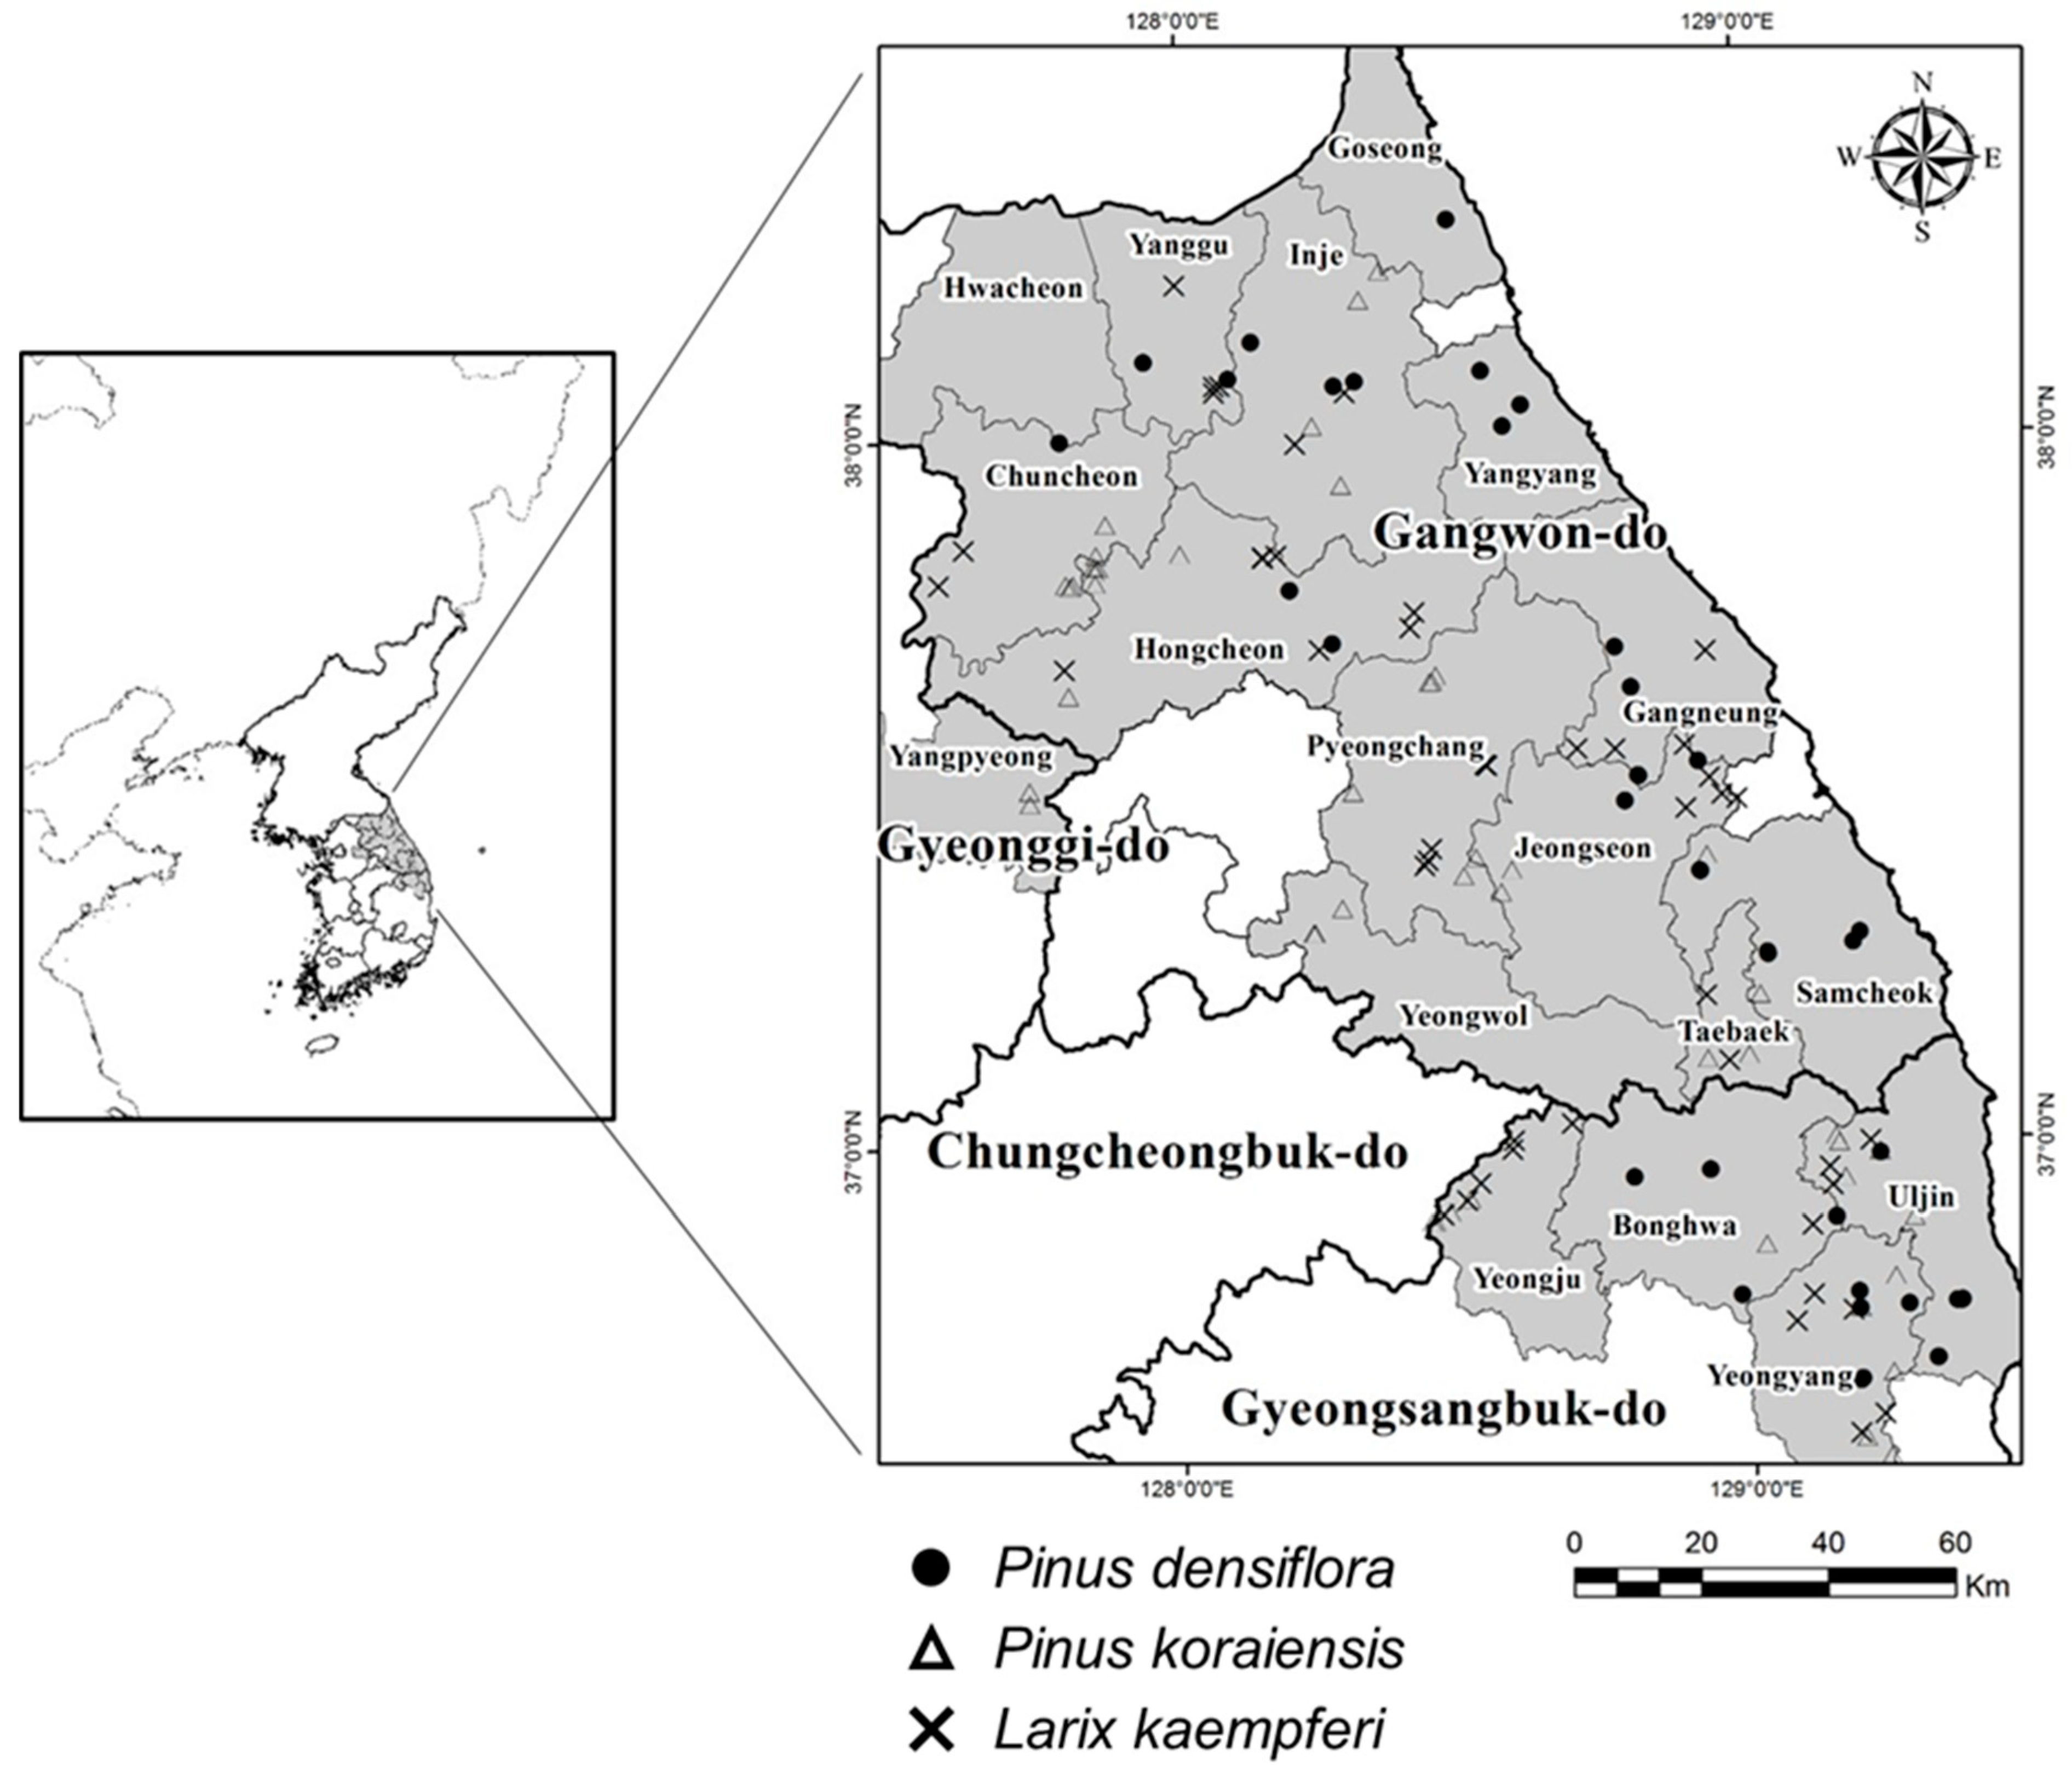
2.1. Study Area

2.1.1. Location and Site Characteristics

For this study, Pd, Pk, and Lk plantations were targeted, and the selected experimental plots were located in the national forests of the north-eastern region of South Korea. A total of 129 sites were selected as study areas: 38 sites for Pd, 46 sites for Pk, 45 sites for Lk (Figure 1). The experimental plots were situated between 36°33′ and 38°18′ N latitude and 127°34′ E and 129°21′ E longitude and represented the typical forests of South Korea formed in mountain areas. According to the Korea Meteorological Administration [23], the 30-year averaged mean annual temperature was 7.1–13.5 °C, the minimum was 2.3–9.6 °C, and was the maximum 12.2–18.3 °C among municipalities where the plots were located. The mean annual precipitation ranged from 1112.2 to 1695.1 mm in the recent 30-year average (1991–2020), with most of the precipitation occurring during the rainy season in summer, which is a typical climate phenomenon in South Korea.

2.1.2. Plot Characteristic with Stand Density

The experimental plots were established to study the growth and yield according to the thinning intensity. For this purpose, one of the prerequisites of a permanent plot was a stand that was as heavily dense as possible without thinning. The plots were installed in the forest where the most recent thinning was conducted at least more than 7 years ago. The selected target stands had a relatively high stand density before installing the plots and executing the thinning operation [24,25]. The relative density (stand density index divided by maximum stand density index) before thinning was mostly above 0.7 in each stand type by species, according to the models of Lee and Choi [24,25].

2.2. Data Collection

2.2.1. Sample Tree Selection and Wood Disc Collection

All the analyses in this study were based on sample trees of each site studied for stem analysis. To collect stem profile data, we selected a representative sample tree that was either dominant or codominant in a stand, free of damage, and desirable in terms of stem quality, that is, straight, unforked, and uncrooked stem for sawtimber felled at each of the 129 sites [20,21]. After selecting a sample tree, it was felled, and 3–5 cm thickness of wood discs were collected from the sectioned stem. The discs were collected at a height of 0.2 m for the first wood disc (W0), 1.2 m for the second one (W1; corresponds to breast height in South Korea), 3.2 m (W2), and from this point onward at two-meter intervals until the second to the last disc (Wn−1). The last wood disc (Wn) was collected 1 or 2 m from the previous (Wn−1), depending on the total stem height. For example, the distance between Wn−1 and Wn was 1 m if the cone length is shorter than 1 m and the distance was 2 m if the cone length is longer than 1 m to collect an appropriate sample disc size, e.g., disc diameter > 1 cm. All the collected wood discs were naturally dried for several days, and then sanded using a sanding machine to prepare the surface for tree ring measurements. The fieldwork was carried out between 2012 and 2017, depending on the experimental site and target species.

2.2.2. Tree Ring Measurements and Stem Analysis

After completing the field works, the number of annual rings were recorded, and the 5-year increment was measured using the SENC 150 Precision Glass Scale Linear Encoder (HEIDENHAIN Corp., Schaumburg, IL, USA), the MEIJI EMZ-5TR microscope (MEIJI TECHNO CO., LTD., San Jose, CA, USA), and the advanced digital readout system Quadra-Chek 10 (METRONICS Inc., Bedford, NH, USA), which allow single-axis measurements at very high levels of precision and accuracy. The tree age was assigned as the number of tree rings on wood disc 0 (W0) plus 2 as conventionally applied for coniferous tree species in South Korea. The summary statistics of the sample trees are given in Table 1.
The total increment in DBH, height, basal area, and stem volume was measured at 5-year intervals (e.g., age 5, 10, 15, etc.). The 5-year increment of DBH and basal area was calculated based on the wood disc 1 (W1), and the height increment was computed on a 5-year basis by interpolation method using the number of tree rings on a wood disc and the length between the wood discs. The 5-year increment of the stem volume was the difference between the stem volumes before and after 5-year growth, and the stem volume at each age was a result of the total sum of all log volumes at the corresponding age. The log volume was calculated according to the Smalian’s method, which estimates the volume of a log by averaging the areas of the two log ends and multiplying the length of the log (mostly 2 m in our study, except for the 1-m length between W0 and W1) by the averaged area. Detailed descriptions of the traditional stem analysis can be found elsewhere [26].

2.3. Modeling Approach

2.3.1. Selection of Candidate Growth Functions

To fit the total increment of DBH, height, basal area, and stem volume of each species over age, growth functions, which are widely used in forest biometrics, were examined for this study: Logistic, Korf, Gompertz, Chapman-Richards, and Weibull [8,10,17,27]. These growth functions present a sigmoid curve, which often hypothesizes an asymptotic biological growth. A different background was developed for each model such as ecology, height growth of the forest stand, age distribution of the human population, animal growth, and probability distribution for the failure rate, and intrinsic characteristics varied according to the equations [10]. The sigmoid pattern is assumed as reasonable and largely applied for tree growth. Thus, the growth functions were compared and tested to find the best fit for this study. The integral and differential forms of each growth function are described in Table 2. In our study, the total increment corresponded to the integral form, and model parameters were fitted using the integral form of each function.

2.3.2. Statistical Modeling and Validation

The model fitting was conducted using the R statistical software, and nls function in stats packages was applied for estimating parameters of nonlinear regression [28]. The response variables of the models were DBH, height, basal area, and volume from all 5-year measurement instances. The explanatory variable was tree age in the corresponding size. Autocorrelation should be considered when several measurements are used from the same sample, although this correlation can be disregarded in stem analysis [9,18]. The 5-year interval is also regarded as less autocorrelated than the 1-year interval; therefore, the modeling can proceed without severe issues [29]. Consequently, the modeling method with only fixed effects was applied without considering autocorrelation and other random effects.
Model validity was evaluated by examining the parameter estimates together with standard error. The significance of p-value with t statistic was also checked to evaluate the stability of parameters. The coefficient of determination, or R-squared (R2), was calculated as a fit statistic; however, R2 alone may not be a sufficient metric as the models were fitted based on nonlinear regression. Accordingly, the root mean squared error (RMSE), the mean absolute error (MAE), and the mean absolute percentage error (MAPE) were also used to examine the model performance. The specific equations were as follows:
R 2 = 1 i = 1 n y i y ^ i 2 i = 1 n y i y ¯ 2
  RMSE = i = 1 n y i y ^ i 2 n
  MAE = i = 1 n y i y ^ i n
  MAPE = 100 % n i = 1 n y i y ^ i y i ,
where y is a tree parameter such as DBH (cm), height (m), basal area (m2), and stem volume (m3); y i is the observed value of sample i; y ^ i is the predicted value of the sample i; y ¯ is the observed average value; and n is the number of samples.
For the model validation after model fitting, the residual plots of each growth function were plotted by the variables and species. Additionally, the predicted growth curves with observed sample points were displayed over tree age. The model bias was analyzed using these residual plots and scatterplots. The final model for each variable by species was then selected synthetically, considering the parameter estimates, standard error, p-value, fit statistics, and the degree of bias in residuals.
Using the models selected by the variables, the total increment was demonstrated to show the representative growth curve in the age range of collected trees by species. Additionally, the CAI and MAI were calculated in simulations by variables. The CAI and MAI were calculated based on the differential equations and on the integral form divided by tree age, respectively (Table 2). The CAI and MAI were described separately and collectively in figures to analyze the validity in terms of the growth pattern and intersecting point between two types of annual increment curves.

3. Results and Discussion

3.1. Parameters Estimates and Fit Statistics

Generally, all models were adequately fitted, and parameters were estimated without any singularity or convergence problem (Table 3, Table 4, Table 5 and Table 6). The predicted growth curves were practically identical within the range of observations, but they varied outside the range of fitted tree age according to innate characteristics of the growth functions (Supplementary files). The parameters and standard errors ranged within the logical values in accordance with each growth function characteristic when compared with previous studies [13,14,15,16,17,30]. However, several unstable parameters and standard errors were with insignificant p-value (p > 0.01). For example, among DBH models, Korf function of Pd was not significant due to the parameter a (p > 0.01) (Table 3), while all parameters of each function in height models were significant (Table 4). In the basal area growth models, Korf for Pd and Pk and Korf, Chapman-Richards, and Weibull for Lk contained insignificant parameters (p > 0.01) (Table 5). In the case of volume models, Korf function for all species and Weibull function for Pd and Lk included insignificant parameters (p > 0.01) (Table 6). The logistic function performed much worse than all other functions in terms of the predicted curve with an extreme asymptote. Therefore, these models with unstable parameter estimates and/or unreliable prediction behavior were excluded from the best function (Table 3, Table 4, Table 5 and Table 6 and Figures S1–S12).
In addition, goodness-of-fit was examined with R2, RMSE, MAE, and MAPE. Some of the models presented the best-fit statistics (Table 3, Table 4, Table 5 and Table 6). The functions with best-fit statistics differed among variables and species, even though the metrics were comparable in some cases. Residual plots were also plotted over the predicted values and independent variable, which was tree age. No model showed an unusual or biased residual trend in variables and species (Supplementary files). When the predicted growth curve regarding total increment was graphically illustrated with observed sample points, the predicted lines over age generally traversed in the center of observations, and this characteristic represented the reasonable model fit. The biological concepts were examined assuming that tree size followed a sigmoid growth, and the CAI and MAI intersected at a mature stage. The prediction suitability, such as asymptote, growth rate, and inflection point, was evaluated for the final model selection in addition to the statistical assessment (Supplementary files). Considering all these evaluations, namely parameter estimates, fit statistics, residuals, and prediction suitability, we selected the best growth function for each variable. Consequently, the selected models were Chapman-Richards function for DBH and stem volume, Korf function for height, and Gompertz function for basal area.

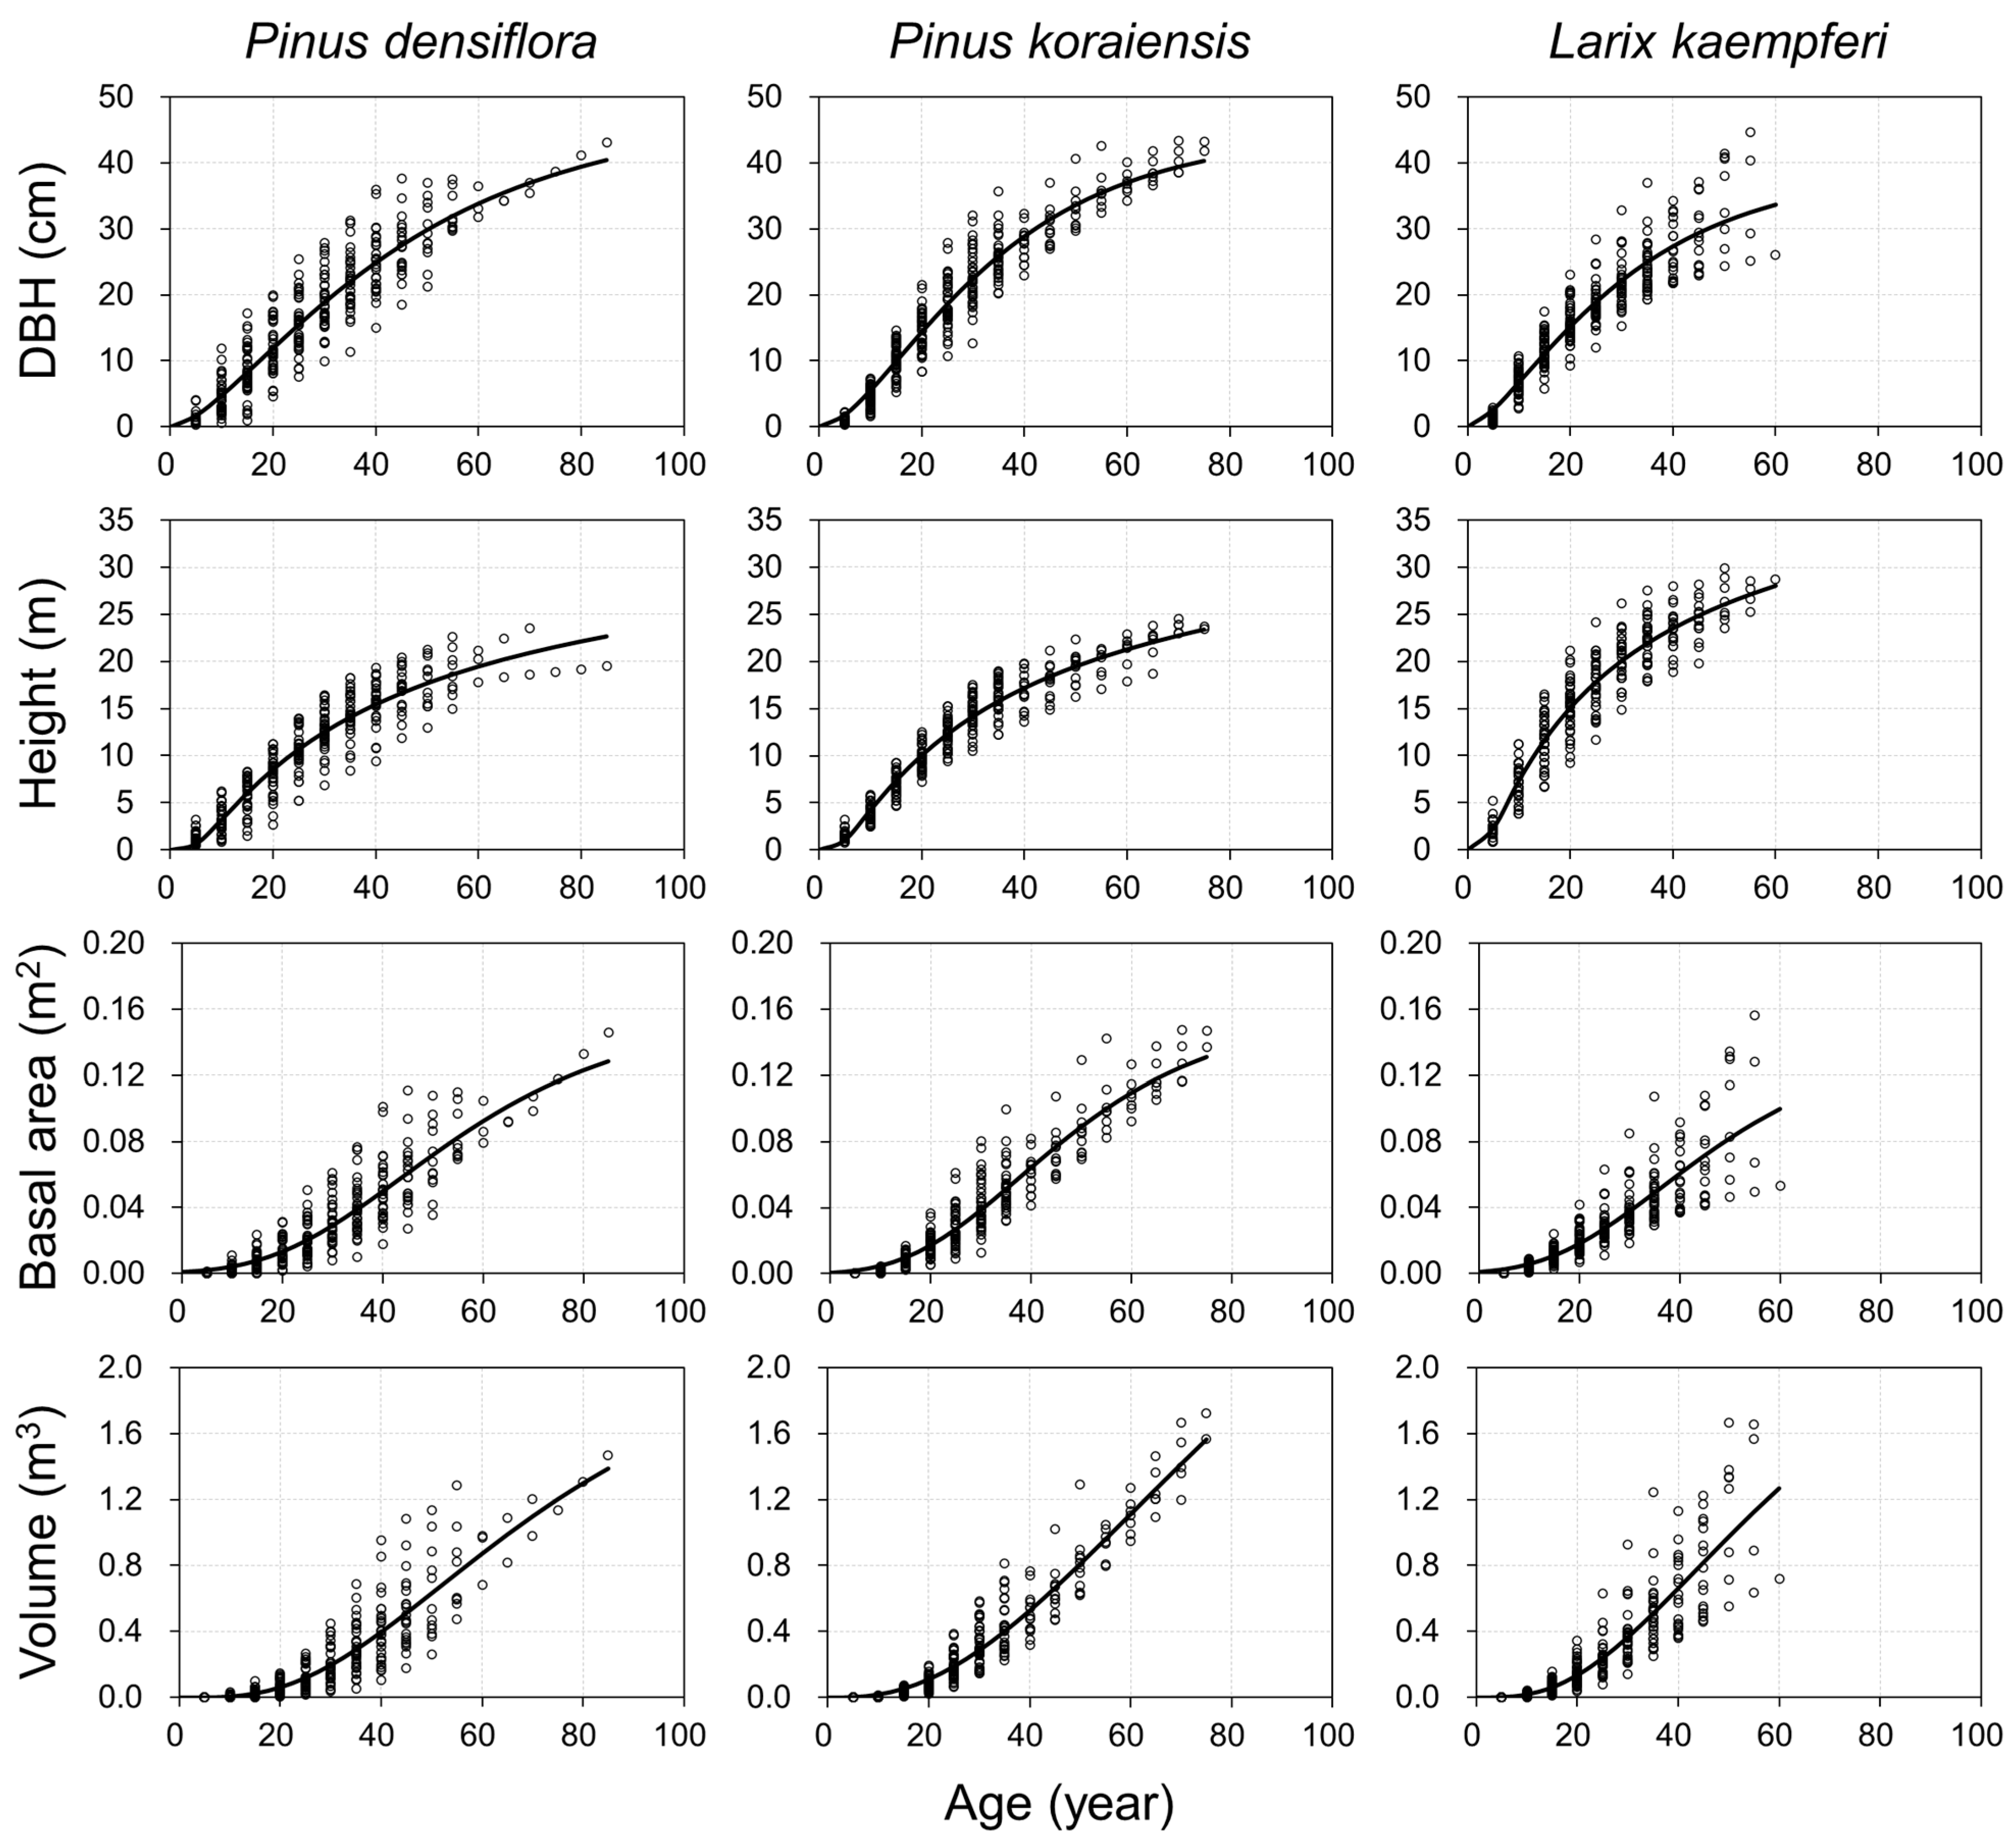
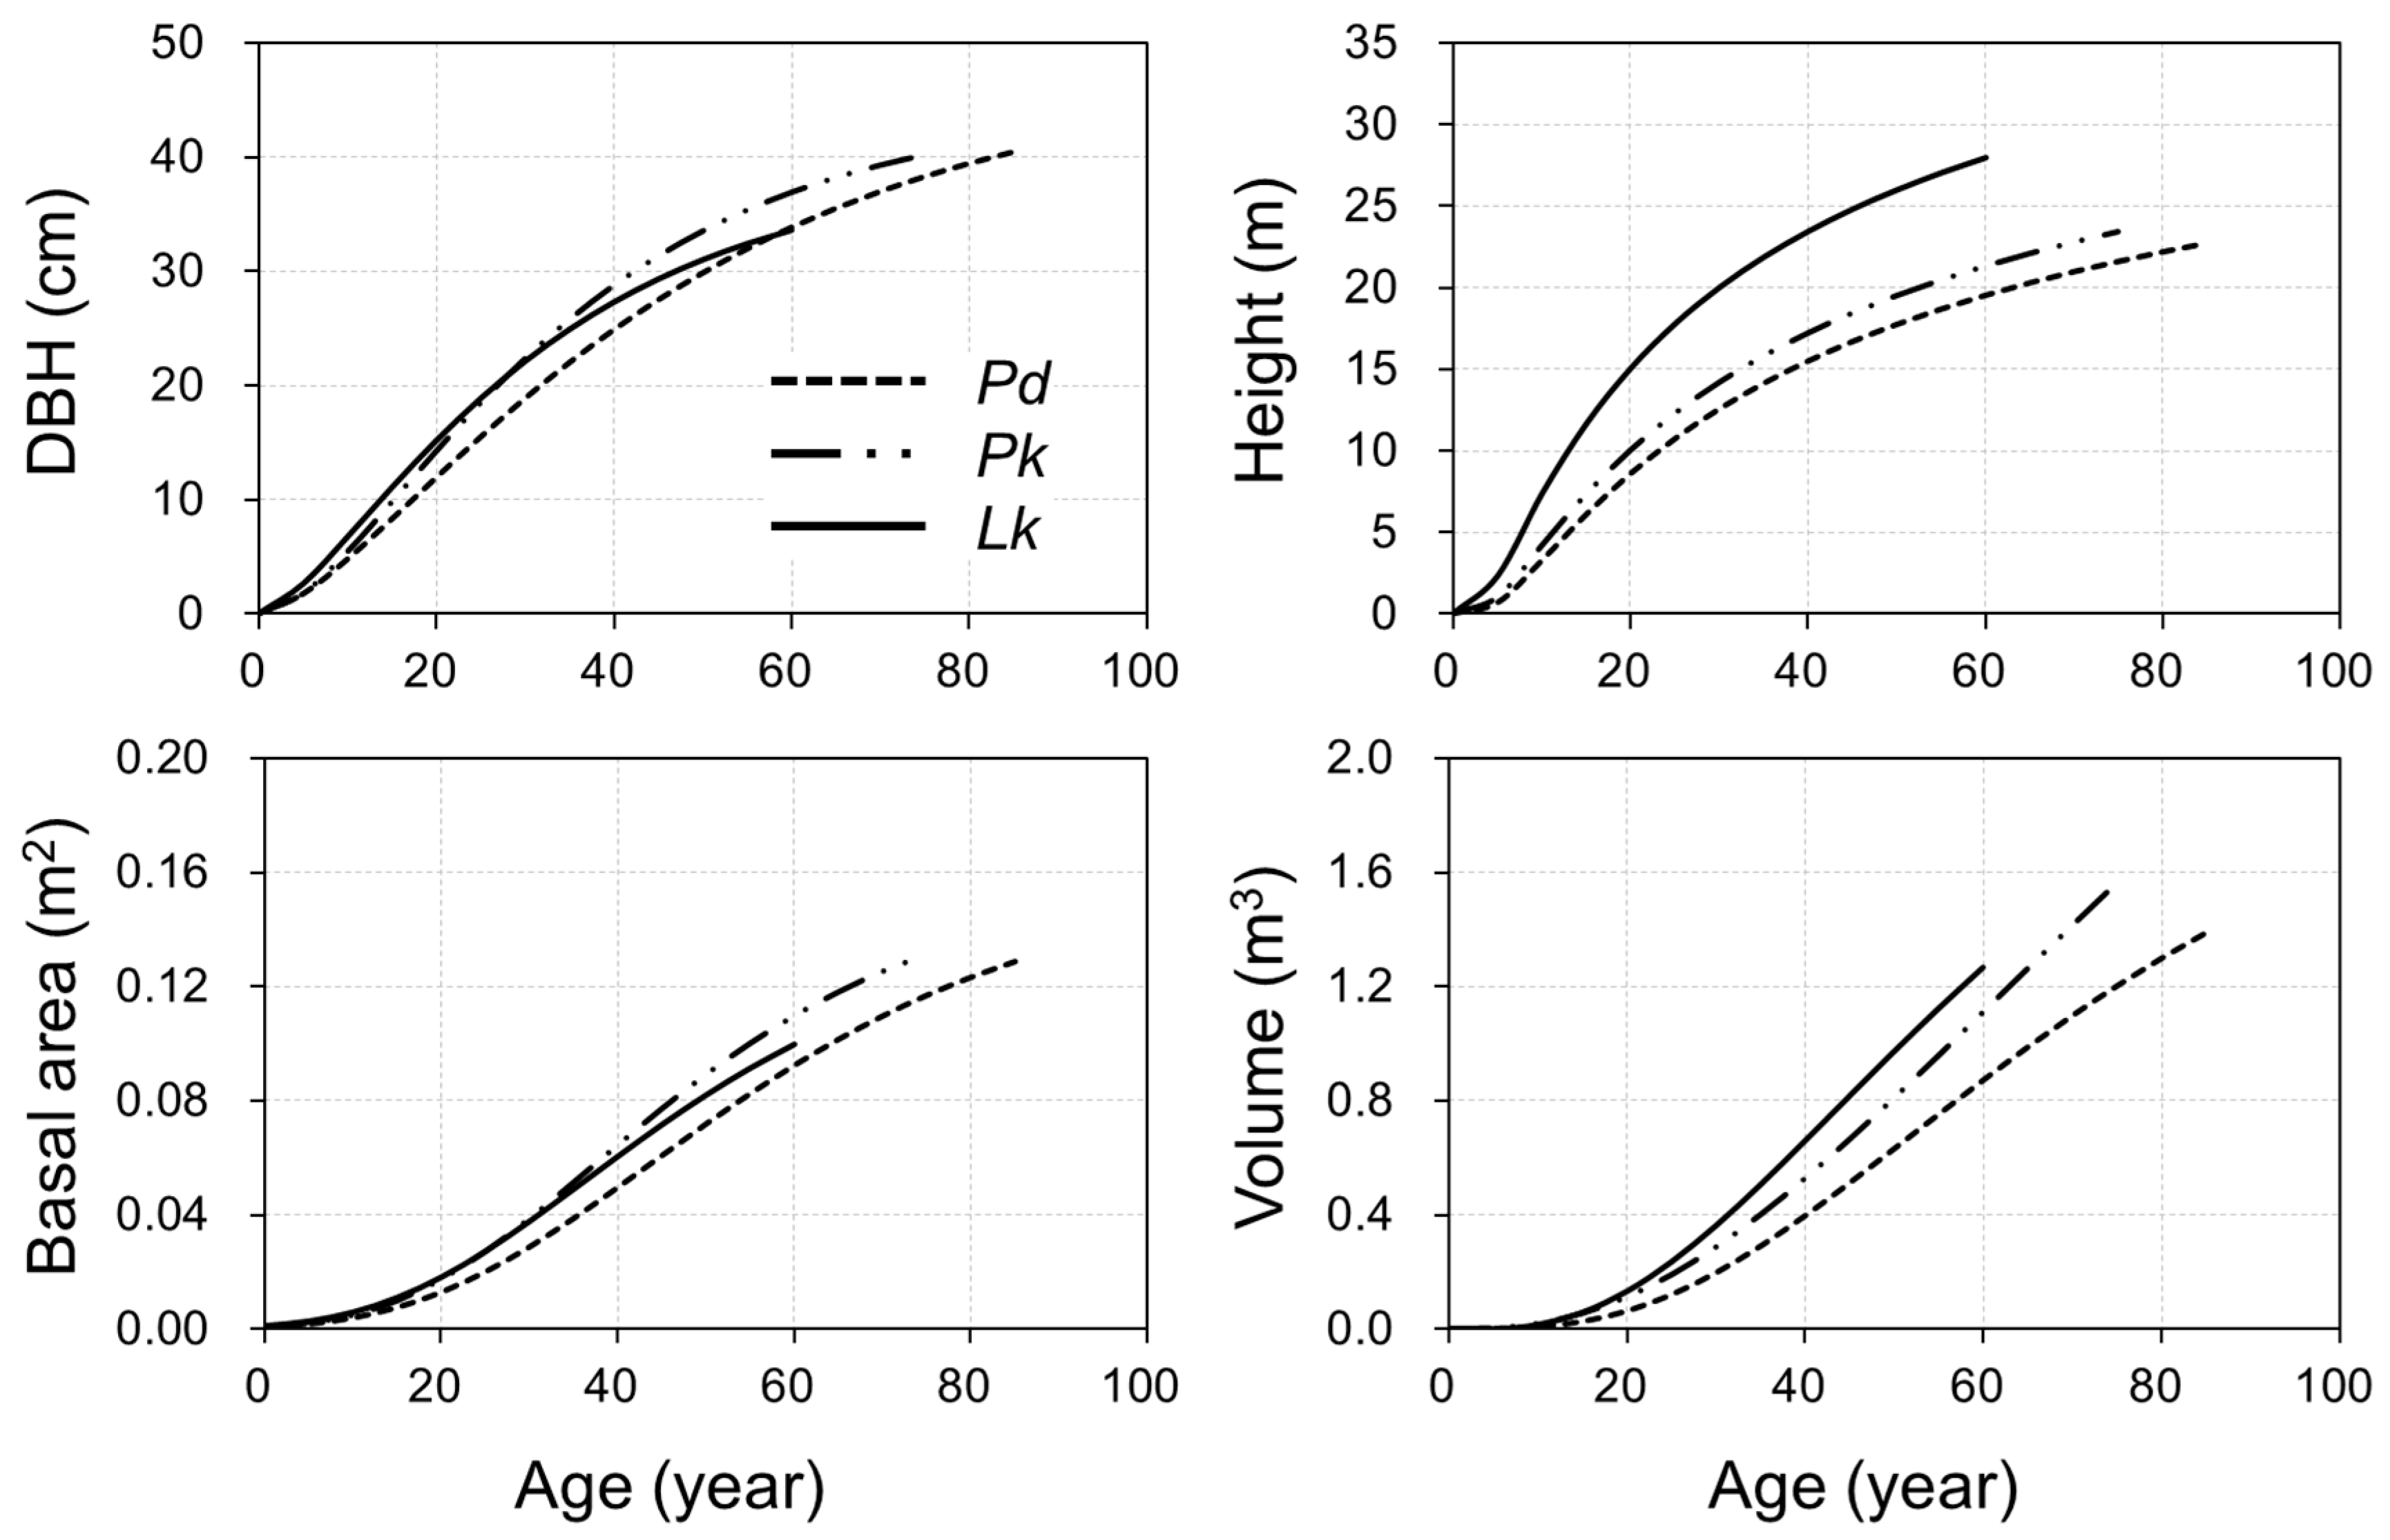
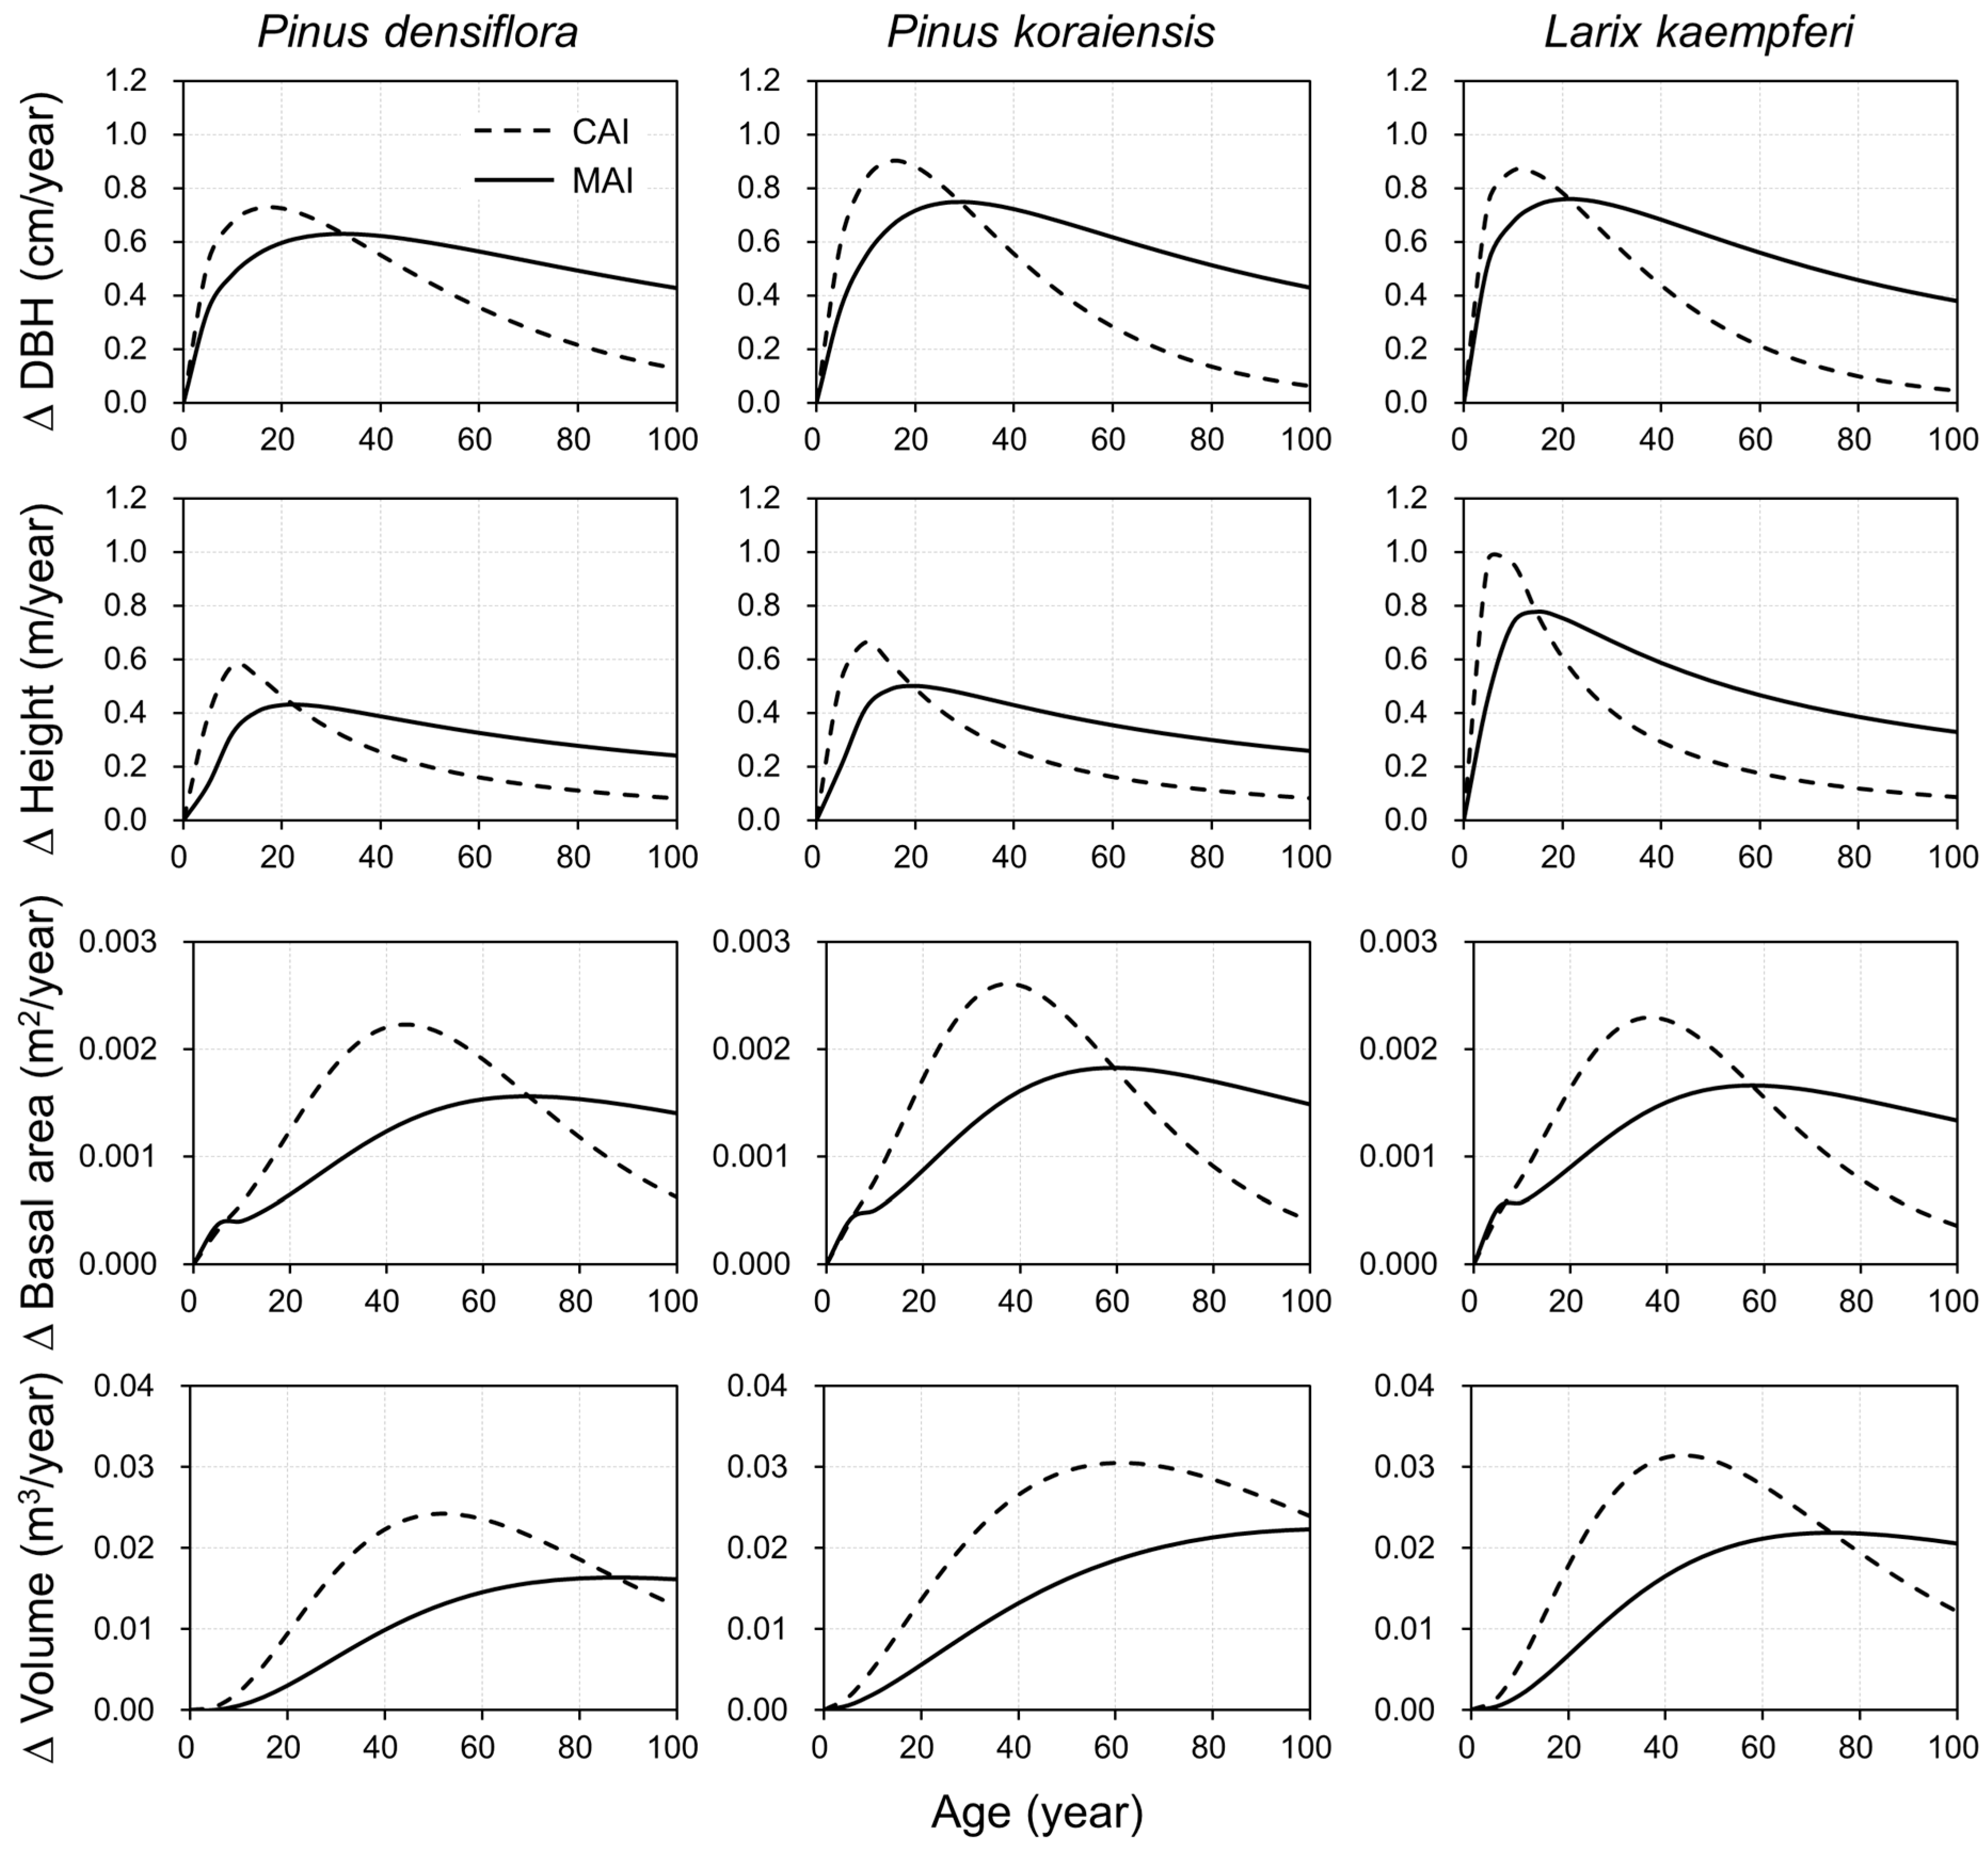
3.2. Growth Simulation and Characteristics

After determining the most suitable model for each variable, the total increment, CAI, and MAI were visually displayed to examine growth patterns over age and compare them between species (Figure 2, Figure 3, Figure 4 and Figure 5). Although the predicted sigmoid growth curves traversed the observed sample points properly, it should be noted that some trees could have a larger tree size than the estimated asymptote because the parameters were fitted for unbiased, accurate predictions (Figure 2).
The age at maximum growth differed according to the variable and species. The total increment in DBH in Lk followed a similar pattern to that in Pk until 40 years of age, but later, Pk was the largest among species (Figure 3). The age at which the DBH reached a diameter of 30 cm was 50 years for Pd, 42 years for Pk, and 47 years for Lk. In contrast, Lk constantly showed a superior growth in height compared to Pd and Pk. The height at 40 years of age, an average felling age for the species in South Korea, was 15 m for Pd, 17 m for Pk, and 23 m for Lk. The inflection point in both the DBH and height curve was situated at an early age, and then the growth decreased reaching the asymptote, which is concave with respect to the Y-axis as reported in many other studies on DBH and height growth [30,31,32,33,34].
The order of basal area by species was similar to that of DBH, but the basal area of Pk was largest after 35 years of age, followed by that of Lk and Pd. However, the volume curve was distinct from that of the other variables. The volume was larger in Lk than in Pd and Pk from an early age, and this trend continued (Figure 3). The age with 1 m3 of stem volume was the shortest, with 51 years for Lk, followed by 56 years for Pk and 65 years for Pd. Moreover, the volume presented vigorous growth even after the age at the inflection point of other variables, which stood for concave shape with respect to the Y-axis. In other words, the asymptote pattern of the basal area appeared later, at nearly 80 years of age, and that of the volume was not clearly defined until 100 years of age (Figure 3).
This concurs with the results of previous studies on volume growth [35,36,37,38,39,40]. Additionally, the one-dimensional growth pattern, such as DBH and height, was similar to that reported in previous studies [13,14,15,16]. However, the growth of a two- (basal area) or three-dimensional size (stem volume) exhibited a constant incremental pattern as the sigmoidal asymptote was not apparent and the pattern was further prolonged. It should be noted that the growth characteristics in our study were analyzed at the tree level, and carrying capacity was not considered at the stand level.
The growth characteristics, such as maximum growth and inflection point, became clearer when the CAI and MAI were analyzed (Figure 4). In the CAI analysis, the age with maximum increment differed among species, and it was in the range of 10–17 years for DBH, 5–10 years for height, 36–44 years for basal area, and 45–61 years for stem volume (Figure 4). The order of age with maximum increment was the same in MAI, but the culmination of MAI for each variable occurred at an older age than that of CAI in all species (Figure 4). Thus, the age with maximum MAI among species was 21–32 years for DBH, 15–22 years for height, 58–69 years for basal area, and 74–106 years for stem volume.
When CAI and MAI were analyzed by variables and species, the growth pattern and characteristics were evident in regard to the culmination, intersecting point, and its age (Figure 5). For DBH and height growth, the age of the intersection point was earliest in Lk, followed by that in Pk and Pd. For basal area growth, the age intersection points by species were in the same order as that for DBH and height growth, although these points were reached at a later age. Lee et al. [41] reported that CAI of Pd in DBH was mostly less than 0.5 cm year–1 after 40 years of age, which was analogous to our results. In volume growth, the age at the intersection point was different from the other variables: 86 years for Pd, 106 years for Pk, 74 years for Lk. This indicated that stem volume growth before 70 years of age was incremental at individual trees level (Figure 5). Similar results were reported in studies on the stem volume growth of Japanese cedar (Cryptomeria japonica (Thunb. ex L.f.) D.Don) [42] and basal area growth of Norway spruce (Picea abies (L.) H. Karst.) [39]. This resulted from the three-dimensional growth of stem volume being influenced by both basal area and height.
The CAI and MAI of the stem volume can be different from those of the basal area because the stem volume is a three-dimensional growth that combines DBH and height. Consequently, the age at the intersection of CAI and MAI varied by tree size variable and species in our study (Figure 5). This is considered the usual increment trend of the major coniferous species in South Korea. Nonetheless, it is noteworthy that the age for maximum growth of an individual tree does not conform with the age at the stand level. This is because the stand dynamics, including between-tree competition for resources, mortality, and ingrowth, were not taken into account [11]. Therefore, long-term monitoring with repeated measurements using permanent plots is considered indispensable and must be carried out persistently to study the growth and yield of a forest stand.

3.3. Model Evaluation and Applicability

Although the best models fit well with significant parameters and are statistically supported (Table 3, Table 4, Table 5 and Table 6), tree ages should be verified when predicting the dependent variables of tree size. The best model was validated as unbiased and accurate within the sample range. However, there is still uncertainty beyond the modeling range because the age range of samples collected was covered restrictively and differed among species (Table 1, Figure 4 and Figure 5). The growth curves could be changed with additional data on the age range; thus, they should be carefully handled for extrapolation. The spatial range should be referenced for application as the samples were collected from the stands of each species in Gangwon and North Gyeongsang provinces of South Korea. Those regions are known as suitable and favorable sites in South Korea for Pd, Pk, and Lk [43].
Moreover, tree parameters, especially those related to diameter growth such as DBH, basal area, and stem volume, were regarded to be linked to stand density. Thus, the stand density should be referenced as the background when examining the growth status of sample trees. The trees sampled in the present study were dominant or codominant in the plots where the relative density was higher than 0.7. These plots represent dense stands, where the growth of biometric features, for example, diameter vs. height, may differ from that in low-density stands [24,25]. Nevertheless, the study plots cannot be considered as unthinned stands because the history of silvicultural treatments and stand density during the entire period of tree growth is unknown. Even though some variations cannot be removed due to the inherent background of sample trees, the selected models were assessed to offer the representative growth curve for each tree size variable by species. Thus, the developed models in this study were considered to be helpful for understanding and managing the target species.

4. Conclusions

This study aimed to fit the model parameters and examine growth characteristics for major tree size variables of Pd, Pk, and Lk using the widely used sigmoid growth functions in forest biometrics. The selection of applied growth functions for all species was based on variables such as Chapman-Richards for DBH and stem volume, Korf for height, and Gompertz for the basal area. The final models revealed the applicable parameter estimates and properly depicted the overall growth pattern and characteristics of the trees. Contrary to DBH and height, the total increment of stem volume showed convex growth curves with respect to the Y-axis, suggesting that the volume pattern in three-dimensional growth was different from the one-dimension growth of DBH and height. Additionally, the age with maximum CAI and MAI was different among species and variables. The earliest age by variable was height, followed by DBH and basal area, and volume.
When using the models, especially for DBH, basal area, and volume, the applied stand density should be referenced because the size can vary with stand density. The temporal and spatial range should be noted for unbiased estimation, for example, for tree age and study area in the data, because it could lead to extrapolation and possibly unstable prediction outside the modeling range. The developed models were based on the growth characteristics of a tree in each stand; thus, they do not represent growth and yield characteristics at the stand level. Even though the sample data may not include tree growth characteristics from all stand conditions, our results provided the general growth patterns appropriately for the target species. Therefore, our model parameters and simulated growth patterns can be used as references to predict tree size by variables and understand growth characteristics for Pd, Pk, and Lk, particularly in South Korea.

Supplementary Materials

The following supporting information can be downloaded at: https://www.mdpi.com/article/10.3390/f14010115/s1, Figure S1. Residual plots of DBH models over predicted values by species; Figure S2. Residual plots of height models over predicted values by species; Figure S3. Residual plots of basal area models over predicted values by species; Figure S4. Residual plots of stem volume models over predicted values by species; Figure S5. Total increment of DBH by model type in each species; Figure S6. Total increment of height by model type in each species; Figure S7. Total increment of basal area by model type in each species; Figure S8. Total increment of stem volume by model type in each species; Figure S9. Comparison of current annual increment (CAI) and mean annual increment (MAI) by DBH model type in each species; Figure S10. Comparison of current annual increment (CAI) and mean annual increment (MAI) by height model type in each species; Figure S11. Comparison of current annual increment (CAI) and mean annual increment (MAI) by basal area model type in each species; Figure S12. Comparison of current annual increment (CAI) and mean annual increment (MAI) by stem volume model type in each species.

Author Contributions

Conceptualization, Y.S., D.L., and J.C.; methodology, Y.S. and D.L.; investigation, Y.S. and D.L.; data curation, D.L.; formal analysis, Y.S. and D.L.; software, Y.S. and D.L.; Resources, Y.S., D.L. and J.C.; Validation, Y.S., D.L. and J.C.; Visualization, D.L.; writing—original draft, Y.S. and D.L.; writing—review and editing, Y.S., D.L., and J.C.; Supervision, J.C.; funding acquisition, J.C.; project administration, J.C. All authors have read and agreed to the published version of the manuscript.

Funding

This study was carried out with the support of R&D Program for Forest Science Technology (Project No. 2022464B10-2224-0201) provided by Korea Forest Service (Korea Forestry Promotion Institute) and with the support of the Basic Science Research Program through the National Research Foundation of Korea (NRF) funded by the Korean Ministry of Education (Grant No. NRF-2016R1D1A1B02011648) in 2023.

Data Availability Statement

Not applicable.

Acknowledgments

Financial support for the data collection was provided by the National Forest Management Division of the Korea Forest Service. The Forest Resource Monitoring Center on Climate Change (FRMCCC) at the Kangwon National University provided data maintenance support.

Conflicts of Interest

The authors declare no conflict of interest. The funders had no role in the design of the study; in the collection, analyses, or interpretation of data; in the writing of the manuscript; or in the decision to publish the results.

References

  1. Korea Forest Research Institute. Commercial Tree Species 1 Korean Red Pine (Pinus densiflora Siebold & Zucc.); Korea Forest Research Institute: Seoul, Republic of Korea, 2012; ISBN 11-1400377-000569-01. [Google Scholar]
  2. Korea Forest Research Institute. Commercial Tree Species 3 Korean White Pine (Pinus koraiensis Siebold & Zucc.); Korea Forest Research Institute: Seoul, Republic of Korea, 2012; ISBN 11-1400377-000550-01. [Google Scholar]
  3. Korea Forest Research Institute. Commercial Tree Species 4 Japanese Larch (Larix kaempferi (Lamb.) Carriere); Korea Forest Research Institute: Seoul, Republic of Korea, 2012; ISBN 11-1400377-000551-01. [Google Scholar]
  4. Korea Forest Service. 2020 Statistical Yearbook of Forestry; Korea Forest Service: Daejeon, Korea, 2021; ISBN 11-1400000-000001-10. [Google Scholar]
  5. Yang, R.C.; Kozak, A.; Smith, J.H.G. The potential of Weibull-type functions as flexible growth curves. Can. J. For. Res. 1978, 8, 424–431. [Google Scholar] [CrossRef]
  6. Tomé, J.; Tomé, M.; Barreiro, S.; Paulo, J.A. Age-independent difference equations for modelling tree and stand growth. Can. J. For. Res. 2006, 36, 1621–1630. [Google Scholar] [CrossRef]
  7. Parresol, B.R.; Devall, M.S. Patterns of Diametric Growth in Stem-Analyzed Laurel Trees (Cordia alliodora) in a Panamanian Forest. Southwest. Nat. 2013, 58, 170–178. [Google Scholar] [CrossRef]
  8. Burkhart, H.E.; Tomé, M. Modeling Forest Trees and Stands; Springer Science & Business Media: New York, NY, USA, 2012; ISBN 978-94-007-1597-4. [Google Scholar]
  9. Monserud, R.A. Height growth and site index curves for inland Douglas-fir based on stem analysis data and forest habitat type. For. Sci. 1984, 30, 943–965. [Google Scholar]
  10. Zeide, B. Analysis of Growth Equations. For. Sci. 1993, 39, 594–616. [Google Scholar] [CrossRef]
  11. Burkhart, H.E.; Avery, T.E.; Bullock, B.P. Forest Measurements, 6th ed.; Waveland Press Inc.: Long Grove, IL, USA, 2018; ISBN 978-1-4786-3618-2. [Google Scholar]
  12. García, O. Stand Growth models: Theory and practice. In Proceedings of the Advancement in Forest Inventory and Forest Management Sciences—Proceedings of the IUFRO Seoul Conference, Seoul, Republic of Korea, 20–25 September 1993; Forestry Research Institute of the Republic of Korea. pp. 22–45. [Google Scholar]
  13. Ito, T. A System of growth models for even-aged pure stands based on the Richards growth function (I) A growth model for average height. J. Jpn. For. Soc. 1987, 69, 221–227. [Google Scholar]
  14. Ito, T. A System of growth models for even-aged pure stands based on the Richards growth function (II) A growth model for stand volume. J. Jpn. For. Soc. 1987, 69, 391–397. [Google Scholar]
  15. Ito, T. A system of growth models for even-aged pure stands based on the Richards growth function (IV) Estimation of the parameters using data from a temporary sample plot and stem-analyzed sample trees. J. Jpn. For. Soc. 1988, 70, 95–103. [Google Scholar]
  16. Ito, T. A system of growth models for even-aged pure stands based on the Richards growth function (III) Estimation of the parameters using data from remeasured temporary sample plots. J. Jpn. For. Soc. 1988, 70, 57–63. [Google Scholar] [CrossRef]
  17. Li, F.; Zhao, B.; Su, G. A derivation of the generalized Korf growth equation and its application. J. For. Res. 2000, 11, 81–88. [Google Scholar] [CrossRef]
  18. Johansson, T. A site dependent top height growth model for hybrid aspen. J. For. Res. 2013, 24, 691–698. [Google Scholar] [CrossRef]
  19. Pommerening, A.; Muszta, A. Methods of modelling relative growth rate. For. Ecosyst. 2015, 2, 5. [Google Scholar] [CrossRef] [Green Version]
  20. Seo, Y.-W.; Balekoglu, S.; Choi, J.-K. Growth pattern analysis by stem analysis of Korean white pine (Pinus koraiensis) in the central northern region of Korea. For. Sci. Technol. 2014, 10, 220–226. [Google Scholar] [CrossRef] [Green Version]
  21. Seo, Y.; Lee, D.; Choi, J. Growth Analysis of Red Pine (Pinus densiflora) by Stem Analysis in the Eastern Region of Korea. J. For. Environ. Sci. 2015, 31, 47–54. [Google Scholar] [CrossRef]
  22. Seo, Y.; Lee, D.; Choi, J. Growth pattern analysis of major coniferous tree species in South Korea. For. Sci. Technol. 2018, 14, 1–6. [Google Scholar] [CrossRef]
  23. Korea Meteorological Administration. Climate Characteristics by Region in Korea. Available online: https://www.weather.go.kr/w/obs-climate/climate/korea-climate/regional-char.do?area=2 (accessed on 15 September 2022).
  24. Lee, D.; Choi, J. Evaluating maximum stand density and size–density relationships based on the Competition Density Rule in Korean pines and Japanese larch. For. Ecol. Manag. 2019, 446, 204–213. [Google Scholar] [CrossRef]
  25. Lee, D.; Choi, J. Stocking Diagrams for Silvicultural Guideline in Korean Pines and Japanese Larch. Forests 2020, 11, 833. [Google Scholar] [CrossRef]
  26. Husch, B.; Beers, T.W.; Kershaw, J.A., Jr. Forest Mensuration, 4th ed.; John Wiley & Sons, Inc.: Hoboken, NJ, USA, 2002; ISBN 978-0-471-01850-6. [Google Scholar]
  27. Kiviste, A. Mathematical Functions of Forest Growth; Estonian Agricultural Academy: Tartu, Estonia, 1988; p. 108, Supplement 171p. [Google Scholar]
  28. R Core Team, R. A Language and Environment for Statistical Computing; R Foundation for Statistical Computing; R Core Team: Vienna, Austria, 2019. [Google Scholar]
  29. Pukkala, T.; Lähde, E.; Laiho, O. Species Interactions in the Dynamics of Even- and Uneven-Aged Boreal Forests. J. Sustain. For. 2013, 32, 371–403. [Google Scholar] [CrossRef]
  30. Liao, C.Y.; Podrázský, V.V.; Liu, G.B. Diameter and height growth analysis for individual White Pine trees in the area of Kostelec nad Černými lesy. J. For. Sci. 2003, 49, 544–551. [Google Scholar] [CrossRef] [Green Version]
  31. Kwak, D.A.; Lee, W.K.; Kim, S.W.; Seo, J.H. Regional differences in height and tper form of Pinus densiflora in Korea. Korean J. For. Meas. 2004, 7, 49–60. [Google Scholar]
  32. Son, Y.M.; Lee, K.H.; Kweon, S.D. Estimation of stem taper equation and growth pattern in Pinus koraiensis by two districts. Korean J. For. Meas. 2004, 7, 9–14. [Google Scholar]
  33. Perez, D. Growth and volume equations developed from stem analysis for Tectona grandis in Costa Rica. J. Trop. For. Sci. 2008, 20, 66–75. [Google Scholar]
  34. Zuidema, P.A.; Vlam, M.; Chien, P.D. Ages and long-term growth patterns of four threatened Vietnamese tree species. Trees 2011, 25, 29–38. [Google Scholar] [CrossRef] [Green Version]
  35. Chiba, Y. A Simple Mathematical Model of Growth Pattern in Tree Stems. Ann. Bot. 1994, 73, 91–98. [Google Scholar] [CrossRef]
  36. Brienen, R.J.; Zuidema, P.A. Lifetime growth patterns and ages of Bolivian rain forest trees obtained by tree ring analysis. J. Ecol. 2006, 94, 481–493. [Google Scholar] [CrossRef]
  37. Jeon, B.-H.; Lee, S.-H.; Lee, Y.-J.; Kim, H.; Kang, H.-M. Estimation of site index and stem volume equations for Larix leptolepis stand in Jinan, Chonbuk. J. Korean For. Soc. 2007, 96, 40–47. [Google Scholar]
  38. Inoue, S.; Shirota, T.; Mitsuda, Y.; Ishii, H.; Gyokusen, K. Effects of individual size, local competition and canopy closure on the stem volume growth in a monoclonal Japanese cedar (Cryptomeria japonica D. Don) plantation. Ecol. Res. 2008, 23, 953–964. [Google Scholar] [CrossRef]
  39. Castagneri, D.; Storaunet, K.O.; Rolstad, J. Age and growth patterns of old Norway spruce trees in Trillemarka forest, Norway. Scand. J. For. Res. 2013, 28, 232–240. [Google Scholar] [CrossRef]
  40. Tian, N.; Fan, Z.; Matney, T.G.; Schultz, E.B. Growth and Stem Profiles of Invasive Triadica sebifera in the Mississippi Coast of the United States. For. Sci. 2017, 63, 569–576. [Google Scholar] [CrossRef] [Green Version]
  41. Lee, W.-K.; von Gadow, K.; Chung, D.-J.; Lee, J.-L.; Shin, M.-Y. DBH growth model for Pinus densiflora and Quercus variabilis mixed forests in central Korea. Ecol. Model. 2004, 176, 187–200. [Google Scholar] [CrossRef]
  42. Sawata, S.; Nishizono, T.; Awaya, Y.; Nobori, Y. Analysis of Stem Growth Pattern in Japanese Cedar (Cryptomeria japonica) Trees in a Natural Forest in Akita, Northeastern Japan. J. Jpn. For. Soc. 2007, 89, 200–207. [Google Scholar] [CrossRef] [Green Version]
  43. Lee, D.; Choi, J. Development of Variable-Density Yield Models with Site Index Estimation for Korean Pines and Japanese Larch. Forests 2022, 13, 1150. [Google Scholar] [CrossRef]
Figure 1. Study sites and plot location by species from which sample trees were collected for stem analysis and model development.
Forests 14 00115 g001
Figure 2. Predicted growth curves and observations of tree size variables by species. The best models by variables were based on fit statistics and model performance; the selected growth functions were Chapman-Richards for DBH and stem volume, Korf for height, and Gompertz for basal area.
Forests 14 00115 g002
Figure 3. Predicted growth curves of DBH, height, basal area, and stem volume for species within the age range of modeling data. The best models by variables are based on fit statistics and model performance of the results; the selected growth functions are Chapman-Richards for DBH and stem volume, Korf for height, and Gompertz for basal area. Pd: Pinus densiflora. Pk: Pinus koraiensis. Lk: Larix kaempferi.
Forests 14 00115 g003
Figure 4. Simulated current annual increment and mean annual increment of DBH, height, basal area, and stem volume in different species. The best models by variables are based on fit statistics and model performance of the results; the selected growth functions are Chapman-Richards for DBH and stem volume, Korf for height, and Gompertz for basal area.
Forests 14 00115 g004
Figure 5. Simulated annual increment by tree size variables and species to examine current annual increment (CAI) and mean annual increment (MAI). The best models by variables are based on fit statistics and model performance of the results; the selected growth functions are Chapman-Richards for DBH and stem volume, Korf for height, and Gompertz for basal area.
Forests 14 00115 g005
Table 1. Summary statistics of sample trees per species at the time of tree felling for stem analysis.
SpeciesStatisticsAge
(Year)
DBH (cm)Height (m)Volume (m3)No. of TreesNo. of Sample Points at 5-Year Interval
Pinus densifloraMean4730.517.00.670738331
SD168.44.00.3940
Minimum95.23.60.0067
Maximum9947.323.81.6448
Pinus koraiensisMean4029.817.20.693546351
SD167.94.40.4743
Minimum1513.97.40.0527
Maximum7745.924.61.9642
Larix kaempferiMean3827.822.80.748045321
SD127.94.40.5160
Minimum1917.012.20.1614
Maximum6047.930.62.2803
SD: standard deviation.
Table 2. Growth functions of integral and differential form used in this study.
FunctionIntegral FormDifferential Form
Logistic Y = a / 1 + c e b t Δ Y = a b c e b t / 1 + c e b t 2
Korf Y = a e b t c Δ Y = a b c t c + 1 e b t c
Gompertz Y = a e b e c t Δ Y = a b c e c t e b e c t
Chapman-Richards Y = a ( 1 e b t ) c Δ Y = a b c e b t ( 1 e b t ) c 1
Weibull Y = a ( 1 e b t c ) Δ Y = a b c t c 1 e b t c
Note: Y is the diameter at breast height (cm), height (m), basal area (m2), or stem volume (m3) at age t; ΔY is the current annual increment of tree size at age t; e, also known as Euler’s number, is the base of natural logarithms; a, b, c are parameters to be determined by this study.
Table 3. Model parameters of DBH growth functions and indicators of fit.
SpeciesVariablesParm aParm bParm cFit Statistics
EstimateS.E.EstimateS.E.EstimateS.E.R2RMSEMAEMAPE
Pinus densiflora
(n = 303)
Logistic35.7659
(<0.0001)
1.31170.0847
(<0.0001)
0.005311.8485
(<0.0001)
1.22720.82914.09893.27990.5316
Korf134.3419
(0.0113)
52.722110.8703
(<0.0001)
1.66340.5042
(<0.0001)
0.10350.84123.95073.10560.3499
Gompertz39.8321
(<0.0001)
1.97103.3558
(<0.0001)
0.19210.0499
(<0.0001)
0.00400.83753.99623.17790.4498
Chapman-Richards47.4990
(<0.0001)
4.70420.0278
(<0.0001)
0.00531.6201
(<0.0001)
0.17480.84103.95373.12320.3843
Weibull44.1380
(<0.0001)
4.22930.0047
(<0.0001)
0.00101.4011
(<0.0001)
0.08860.84053.95903.13570.3984
Pinus koraiensis
(n = 324)
Logistic37.5633
(<0.0001)
0.68660.0980
(<0.0001)
0.004012.7995
(<0.0001)
1.00080.91253.25412.58030.4549
Korf82.1652
(<0.0001)
9.919814.0460
(<0.0001)
1.80920.7005
(<0.0001)
0.06570.93152.87812.14640.1926
Gompertz40.3021
(<0.0001)
0.90383.5817
(<0.0001)
0.15250.0606
(<0.0001)
0.00280.92433.02612.34210.3319
Chapman-Richards44.5393
(<0.0001)
1.64550.0393
(<0.0001)
0.00351.8676
(<0.0001)
0.12940.92942.92172.20290.2484
Weibull42.2732
(<0.0001)
1.52610.0047
(<0.0001)
0.00071.4882
(<0.0001)
0.05670.92802.95092.23720.2784
Larix kaempferi
(n = 314)
Logistic30.9468
(<0.0001)
0.87790.1130
(<0.0001)
0.006910.8427
(<0.0001)
1.12720.85073.68232.88710.5809
Korf86.7510
(0.0002)
22.66739.5077
(<0.0001)
1.27760.5696
(<0.0001)
0.09510.87443.37692.51510.2813
Gompertz33.3797
(<0.0001)
1.22733.2992
(<0.0001)
0.19440.0708
(<0.0001)
0.00510.86343.52132.72020.4476
Chapman-Richards39.1338
(<0.0001)
3.01420.0398
(<0.0001)
0.00681.5779
(<0.0001)
0.16380.87123.42012.59940.3629
Weibull37.5837
(<0.0001)
3.14120.0091
(<0.0001)
0.00161.3459
(<0.0001)
0.0850.87013.43392.62530.3937
S.E.: standard error. R2: coefficient of determination. RMSE: root mean squared error. MAE: mean absolute error. MAPE: mean absolute percentage error.
Table 4. Model parameters of height growth functions and indicators of fit.
SpeciesVariablesParm aParm bParm cFit Statistics
EstimateS.E.EstimateS.E.EstimateS.E.R2RMSEMAEMAPE
Pinus densiflora
(n = 331)
Logistic18.7523
(<0.0001)
0.39920.1097
(<0.0001)
0.005512.763
(<0.0001)
1.27940.88252.04301.58820.3479
Korf38.8374
(<0.0001)
5.674212.832
(<0.0001)
2.14140.7140
(<0.0001)
0.08710.88482.02251.54360.2555
Gompertz20.1584
(<0.0001)
0.55003.5208
(<0.0001)
0.19500.0674
(<0.0001)
0.00390.88831.99211.51350.2848
Chapman-Richards21.7626
(<0.0001)
0.91700.0460
(<0.0001)
0.00491.8879
(<0.0001)
0.17150.88861.98901.50160.2519
Weibull20.5390
(<0.0001)
0.78750.0055
(<0.0001)
0.00111.5140
(<0.0001)
0.07180.88901.98571.49700.2588
Pinus koraiensis
(n = 351)
Logistic20.5229
(<0.0001)
0.27270.1128
(<0.0001)
0.003711.6502
(<0.0001)
0.77220.93481.62251.31200.2559
Korf41.1095
(<0.0001)
3.283111.3164
(<0.0001)
1.01290.6949
(<0.0001)
0.04850.95101.40741.08280.1383
Gompertz21.7925
(<0.0001)
0.32993.3721
(<0.0001)
0.11560.0706
(<0.0001)
0.00240.94611.47611.17060.1881
Chapman-Richards23.6574
(<0.0001)
0.54550.0459
(<0.0001)
0.00291.7276
(<0.0001)
0.09140.95041.41541.09560.1468
Weibull22.8045
(<0.0001)
0.51830.0082
(<0.0001)
0.00091.4080
(<0.0001)
0.04170.94921.43261.11950.1621
Larix kaempferi
(n = 321)
Logistic24.6783
(<0.0001)
0.40690.1341
(<0.0001)
0.00639.8793
(<0.0001)
0.86780.89952.43781.95960.2788
Korf48.1994
(<0.0001)
5.37999.2619
(<0.0001)
1.03530.6928
(<0.0001)
0.06970.91562.23401.73190.1806
Gompertz26.0162
(<0.0001)
0.52303.1811
(<0.0001)
0.15750.0873
(<0.0001)
0.00440.90952.31401.81230.2247
Chapman-Richards28.1977
(<0.0001)
0.92760.0570
(<0.0001)
0.00551.6441
(<0.0001)
0.12790.91422.25281.75400.2001
Weibull27.2797
(<0.0001)
0.91470.0133
(<0.0001)
0.00191.3617
(<0.0001)
0.05990.91322.26581.76510.2093
Table 5. Model parameters of basal area growth functions and indicators of fit.
SpeciesVariablesParm aParm bParm cFit Statistics
EstimateS.E.EstimateS.E.EstimateS.E.R2RMSEMAEMAPE
Pinus densiflora
(n = 303)
Logistic0.1222
(<0.0001)
0.00750.0824
(<0.0001)
0.005440.6221
(<0.0001)
6.01080.79740.01320.00989.3810
Korf1.2308
(0.2652)
1.102720.7981
(0.0001)
5.31200.5068
(0.0005)
0.14470.80920.01280.00901.5625
Gompertz0.1578
(<0.0001)
0.01615.3828
(<0.0001)
0.38590.0384
(<0.0001)
0.00390.80670.01290.00934.8037
Chapman-Richards0.2152
(<0.0001)
0.04860.0215
(0.0002)
0.00562.6596
(<0.0001)
0.38820.80880.01280.00912.3751
Weibull0.1632
(<0.0001)
0.02810.0002
(0.0081)
0.00012.0586
(<0.0001)
0.14410.80790.01280.00923.0804
Pinus koraiensis
(n = 324)
Logistic0.1300
(<0.0001)
0.00430.0902
(<0.0001)
0.004337.9451
(<0.0001)
4.17350.90000.01120.00829.7820
Korf0.7276
(0.0153)
0.298522.6280
(<0.0001)
4.57830.6046
(<0.0001)
0.10100.91410.01040.00680.6608
Gompertz0.1581
(<0.0001)
0.00855.3982
(<0.0001)
0.29840.0449
(<0.0001)
0.00300.91030.01060.00734.2698
Chapman-Richards0.1992
(<0.0001)
0.02260.0272
(<0.0001)
0.00422.7702
(<0.0001)
0.28600.91310.01040.00701.6581
Weibull0.1597
(<0.0001)
0.01450.0003
(0.0002)
0.00012.0530
(<0.0001)
0.10110.91180.01050.00722.5677
Larix kaempferi
(n = 314)
Logistic0.1048
(<0.0001)
0.00930.0976
(<0.0001)
0.008635.2623
(<0.0001)
5.82970.75020.01370.008910.6329
Korf9.3665
(0.7741)
32.605814.8994
(<0.0001)
0.69780.2927
(0.1204)
0.18800.75670.01350.00822.1481
Gompertz0.1420
(<0.0001)
0.02384.9745
(<0.0001)
0.38500.0440
(<0.0001)
0.00660.75500.01360.00856.1127
Chapman-Richards0.2583
(0.1026)
0.15780.0178
(0.1013)
0.01082.1727
(<0.0001)
0.43910.75670.01360.00832.9777
Weibull0.1616
(0.0201)
0.06910.0004
(0.0039)
0.00011.9114
(<0.0001)
0.20650.75670.01350.00833.3699
Table 6. Model parameters of stem volume growth functions and indicators of fit.
SpeciesVariablesParm aParm bParm cFit Statistics
EstimateS.E.EstimateS.E.EstimateS.E.R2RMSEMAEMAPE
Pinus densiflora
(n = 303)
Logistic1.2895
(<0.0001)
0.0850.0899
(<0.0001)
0.006188.0312
(<0.0001)
16.98670.78660.13260.08916.8688
Korf8.2089
(0.1461)
5.633443.3596
(0.0265)
19.44490.7223
(0.0001)
0.18310.79570.12980.08171.0726
Gompertz1.7361
(<0.0001)
0.2047.1821
(<0.0001)
0.69730.0394
(<0.0001)
0.00430.79460.13010.08322.6467
Chapman-Richards2.1471
(<0.0001)
0.44430.0268
(<0.0001)
0.00604.0338
(<0.0001)
0.70780.79550.12980.08201.4566
Weibull1.5350
(<0.0001)
0.20690.00002
(0.0767)
0.000012.6495
(<0.0001)
0.18160.79440.13020.08322.1675
Pinus koraiensis
(n = 323)
Logistic1.6238
(<0.0001)
0.06940.0844
(<0.0001)
0.003764.6695
(<0.0001)
6.48970.92000.10300.075612.2879
Korf45.0916
(0.299)
43.350222.8314
(<0.0001)
3.46320.444
(<0.0001)
0.09990.93370.09370.05910.8214
Gompertz2.3206
(<0.0001)
0.19526.2032
(<0.0001)
0.28340.0358
(<0.0001)
0.00260.92990.09640.06494.8052
Chapman-Richards3.8923
(0.0001)
0.95830.0175
(<0.0001)
0.00402.9132
(<0.0001)
0.29920.93280.09440.06131.7015
Weibull2.5051
(<0.0001)
0.48210.00005
(<0.0001)
0.000012.2834
(<0.0001)
0.11060.93180.09510.06352.5439
Larix kaempferi
(n = 313)
Logistic1.2817
(<0.0001)
0.10670.1126
(<0.0001)
0.009281.0024
(<0.0001)
17.17890.78700.14950.090212.8173
Korf21.2675
(0.5182)
32.880125.1394
(0.0083)
9.45890.5363
(0.0164)
0.22220.78850.14890.08340.5679
Gompertz1.8400
(<0.0001)
0.31576.7796
(<0.0001)
0.72060.0475
(<0.0001)
0.00680.78920.14870.08504.3490
Chapman-Richards2.5000
(0.0066)
0.91340.0293
(0.0048)
0.01033.5893
(<0.0001)
0.79820.78910.14870.08351.2202
Weibull1.4885
(<0.0001)
0.29790.00003
(0.1138)
0.000022.6557
(<0.0001)
0.23510.78990.14840.08371.9647
Disclaimer/Publisher’s Note: The statements, opinions and data contained in all publications are solely those of the individual author(s) and contributor(s) and not of MDPI and/or the editor(s). MDPI and/or the editor(s) disclaim responsibility for any injury to people or property resulting from any ideas, methods, instructions or products referred to in the content.

