Article

A Comparative Analysis of Polyphenol Content and Biological Potential of Quercus petraea Matt. and Q. pubescens Willd. Bark Extracts

1
Doctoral School of Medicine and Pharmacy, “George Emil Palade” University of Medicine, Pharmacy, Sciences and Technology of Târgu Mures, 38 Gheorghe Marinescu Street, 540139 Târgu Mures, Romania
2
Department of Pharmacognosy and Phytotherapy, Faculty of Pharmacy, “George Emil Palade” University of Medicine, Pharmacy, Sciences and Technology of Târgu Mures, 38 Gheorghe Marinescu Street, 540139 Târgu Mures, Romania
3
Department of Pharmaceutical Botany, Faculty of Pharmacy, “Iuliu Hatieganu” University of Medicine and Pharmacy, 23 Gheorghe Marinescu Street, 400337 Cluj-Napoca, Romania
4
Laboratory of Chromatography, Institute of Advanced Horticulture Research of Transylvania, University of Agricultural Sciences and Veterinary Medicine, 400372 Cluj-Napoca, Romania
5
Department of Microbiology, Faculty of Medicine, “George Emil Palade” University of Medicine, Pharmacy, Sciences and Technology of Târgu Mures, 38 Gheorghe Marinescu Street, 540139 Târgu Mures, Romania
6
Department of Pharmaceutical Botany, Faculty of Pharmacy, “George Emil Palade” University of Medicine, Pharmacy, Sciences and Technology of Târgu Mures, 38 Gheorghe Marinescu Street, 540139 Târgu Mures, Romania
7
Research Center of Medicinal and Aromatic Plants, “George Emil Palade” University of Medicine, Pharmacy, Sciences and Technology of Târgu Mures, 38 Gheorghe Marinescu Street, 540139 Târgu Mures, Romania
*
Author to whom correspondence should be addressed.
Forests 2023, 14(1), 116; https://doi.org/10.3390/f14010116
Submission received: 31 October 2022 / Revised: 2 January 2023 / Accepted: 4 January 2023 / Published: 7 January 2023
(This article belongs to the Section Wood Science and Forest Products)

Abstract

:
Quercus wood (oak wood) is a valuable resource, which has led to the intense processing of oak trees by the forestry industry. As a result, large amounts of forestry by-products (bark and leaves) are left in the woods, considered valueless. Thus, the aim of this study was to evaluate and compare the phytochemical profile and potential biological activities of Q. petreaea Matt. and Q. pubescens Willd. bark extracts. The extracts were obtained by microwave (MAE) and ultrasound-assisted extraction (UAE) with water (100%) and ethanol:water (70:30). These extracts were then characterized in terms of the total polyphenolic and tannin contents using the Folin–Ciocâlteu method. Their antioxidant properties were determined by observing the neutralizing effects of the extracts against 1,1-diphenyl-2-picrylhydrazyl (DPPH) and 2,2′-azino-bis(3-ethylbenzothiazoline)-6-sulfonic acid (ABTS) radicals. The antimicrobial effect was tested on Gram-positive and Gram-negative bacterial strains and three fungi from the Candida genus. Cellular counts were measured to determine the cytotoxic effects of the extracts on HEK 293T cell lines. Moreover, spectrophotometrical assays were performed to assess the inhibitory effects of the extracts against the enzymatic activity of α-glucosidase, tyrosinase, and acetylcholinesterase. The MAE resulted in higher yields of polyphenolic compounds and tannins compared to the UAE bark extracts. All of the experimental variants exhibited free-radical-neutralizing properties, especially Q. petraea extracts. Q. petraea extracts also had a more efficient antibacterial effect, especially against Gram-positive bacteria and K. pneumoniae. Antifungal activity was highlighted against C. krusei. Cell counts indicated a cytotoxic effect of the tested extracts against HEK 293T cells. The tested extracts inhibited the activity of α-glucosidase, tyrosinase, and acetylcholinesterase, indicating the potential use of these extracts as antidiabetic, neuroprotective, and skin-protecting agents. These findings highlight the untapped therapeutic potential of the bioactive compounds found in the bark of Q. petraea and Q. pubescens.

1. Introduction

The Quercus genus comprises approximately 400 species of evergreen and deciduous trees (oaks) and is one of the most widespread tree groups in Europe, Asia, and the Americas [1]. Owing to the abundance of this genus and because of oak wood’s mechanical properties and durability, it has many uses in carpentry, construction, and furniture production [2]. However, the intense exploitation of this genus results in large amounts of byproducts, such as bark and leaves. The potential of these vegetal materials is not harnessed to its fullest, although several researchers have identified the phytochemical constituents comprising these materials and their various health benefits [3,4,5]. The beneficial effects of oak bark extracts include anti-inflammatory [6,7], antitumoral/antiproliferative [8], antidiabetic/hypoglycaemic [9], hypocholesterolemic [10], antihypertensive [11], and antimicrobial [12] activities.
The beneficial effects of the bark of Quercus species were previously linked to the presence of phenolics in the extracts obtained from this vegetal matrix [5]. The main phenolic components present in the bark of various oak species are phenolic acids (e.g., caffeic, ellagic, gallic, and protocatechuic acids), flavonoids (e.g., catechin and epicatechin), and tannins (e.g., ellagitannins, vescalagin, castalagin, granidinin, and roburins) [13,14,15,16]. These classes of compounds provide the antioxidant, antibacterial, antifungal, antitumoral, and enzyme-inhibitory activities of the extracts. The antioxidant activity of bark extracts obtained from species of the Quercus genus were highlighted previously in [6,8,17]. Moreover, oak bark extracts were shown to inhibit the growth and development of bacterial strains such as Pseudomonas aeruginosa, Bacillus cereus, Listeria monocytogenes, Escherichia coli, Mycobacterium flavus, and Staphylococcus aureus, and well as various fungal strains from the Aspergillus, Candida, and Penicillium genera [13,18,19]. The same study highlighted the inhibition of the proliferation of breast cancer (MCF-7), cervix cancer (HeLa), colon cancer (HT-29), and bladder cancer cell lines, as well as human embryonic kidney cells (HEK 293) [13]. Other oak bark extracts proved to have an antiproliferative effect against human larynx epidermoid carcinoma (Hep-2), indicating that gallic acid and catechin are the main antiproliferative components of these bark extracts [8]. The correlation between the content of antioxidant compounds such as catechin and epicatechin and the cytotoxic effects of oak bark extracts was also highlighted in the context of breast cancer (MDA-MB-231) and cervical cancer (HeLa) cell lines [20].
Additionally, extracts obtained from different parts of oak species proved to have inhibitory effects on the enzymatic activity of α-amylase, α-glucosidase, acetylcholinesterase, and tyrosinase [4,9,21,22]. The inhibitory effects of the extracts against α-glucosidase and tyrosinase were linked to two polyphenolic compounds, namely chlorocatechin and polydatin (a glucoside of resveratrol), the latter of which is an extremely potent tyrosinase inhibitor as an isolated compound [9]. These effects indicate the potential of oak extracts to be used as antidiabetic, neuroprotective, and skin-protective agents.
Thus, the main objectives of the current study were (1) the characterization of the phytochemical profile of Q. petraea Matt. and Q. pubescens Willd. bark extracts and (2) the evaluation of the biological potential (antioxidant, antibacterial, antifungal, cytotoxic, and enzyme-inhibitory activity) of Q. petraea and Q. pubescens bark extracts.

2. Materials and Methods

2.1. Chemicals, Reagents and Bacterial Strains

The chemicals used were 95% ethanol purchased from Girelli Alcool Srl (Zibido, San Giacomo, Italy), Na2CO3 decahydrate purchased from Reactivul Srl (Râmnicu, Vâlcea, Romania), gallic acid monohydrate purchased from Sigma-Aldrich Chemie GmbH (Steinheim, Germany), and Folin–Ciocâlteu reagent purchased from Merck KGaA (Darmstadt, Germany). 2,2-diphenyl-1-picrylhydrazyl (DPPH), 2,2′-azino-bis(3-ethylbenzothiazoline-6-sulfonic acid) (ABTS), hide powder, and pyrogallol were needed to perform the antioxidant activity and tannin content assays and were acquired from Sigma-Aldrich Chemie GmbH (Steinheim, Germany).
The antimicrobial activity was tested on different strains: Staphylococcus aureus ATCC 25923, methicillin-resistant Staphylococcus aureus ATCC 43300, Escherichia coli ATCC 25922, Klebsiella pneumoniae ATCC 13883, Pseudomonas aeruginosa ATCC 27853, Candida albicans ATCC 90028, C. parapsilosis ATCC 22019, and C. krusei 6258. These strains were provided by the Microbiology Department of the George Emil Palade University of Medicine, Pharmacy, Sciences, and Technology, Târgu-Mureș. HEK 293T cells were obtained from the Institute of Experimental Virology, UZH, Zürich.

2.2. Plant Sample

Sessile oak (Quercus petraea Matt.) Liebl. bark was obtained from Zagra, Bistrița Năsăud county, Romania. The age of the test trees was 30–40 years. Pubescent oak (Q. pubescens Willd.) bark was obtained from Petiș, Sibiu county, Romania. The bark (rhytidome) was collected from the trunk of the specimens at a height of approximately 1.5 m from the ground. The species were identified and authenticated by Dr. Corneliu Tanase of the Department of Pharmaceutical Botany. The rhytidome was dried in a Nahita 631 Plus drying oven (Auxilab S.L., Beriáin, Spain) at 50 °C for 24 h. The dried material was then milled using a Pulverisette 15 cutting mill (Fritsch GmbH, Idar-Oberstein, Germany). The biomass was directly used without any other pretreatments.

2.3. Extraction

The extraction process was carried out by two extraction methods (microwave-assisted extraction and ultrasound-assisted extraction) optimized in previous studies [23,24]. Ultrasound-assisted extraction (UAE) was performed on 5 g milled vegetal material treated with 200 mL of solvent (water/ethanol 70%) in an Erlenmeyer flask. The flask was covered with aluminium foil; then, the aqueous variants were placed in an Elma Transonics ultrasound bath (Elma Schmidbauer GmbH, Singen, Germany) for 15 min at 70 °C, and the ethanolic variants were extracted for 20 min at 65 °C.
Microwave-assisted extraction (MAE) was performed on 10 g milled bark, which placed in a microwave extractor vessel (Ethos X, Milestone, Sorisole, Italy) and treated with 200 mL of solvent (water/ethanol 70%). The vessel containing the mixture was then placed in an extractor. The aqueous variants were extracted for 29 min and 21 s at a microwave power of 864 W, while the ethanolic variants were extracted for 17 min and 40 s under microwave power of 655 W. Extracts obtained using both methods were then filtered through regular filter paper (pore size of 20 µm) under vacuum. Afterwards, the filtered extracts were brought back to the initial volume (200 mL) with matching solvent using volumetric flasks. The final extracts were centrifuged at 15,000 RPM for 10–20 min with a Hettich Mikro 200R (Andreas Hettich GmbH, Tuttlingen, Germany), followed by a freeze-dry process (Biobase Biodustry Co., Ltd., Shandong, China). The final products were eight freeze-dried extracts: QPuRA M, Q. pubescens bark extract obtained by aqueous MAE; QpuRE M, Q. pubescens bark extract obtained by ethanolic MAE; QpeRA M, Q. petraea bark extract obtained by aqueous MAE; QpeRE M, Q. petraea bark extract obtained by ethanolic MAE; QpuRA U, Q. pubescens bark extract obtained by aqueous UAE; QpuRE U, Q. pubescens bark extract obtained by ethanolic UAE; QpeRA U, Q. petraea bark extract obtained by aqueous UAE; and QpeRE U, Q. petraea bark extract obtained by ethanolic UAE.

2.4. Quantification of Total Phenolics and Tannins

The total polyphenolic content (TPC) was assessed using the Folin–Ciocâlteu method as previously described, with slight modifications [25]. Briefly, 2 mg of freeze-dried extract was dissolved in 1 mL of the original solvent that was used for the extraction. The obtained solution was then diluted 1 to 5 with water. Then, 400 µL of diluted solution was added 400 µL of Folin–Ciocâlteu reagent and 3.2 mL of Na2CO3 (5%). The samples were then kept in darkness for 1 h. The sample absorbances were recorded at 750 nm using a Specord 200Plus UV-Vis spectrophotometer (Analytik Jena AG, Jena, Germany). For the quantification of the phenolic content, a standard curve made of nine different gallic acid solutions was used. The concentrations ranged from 0.05 mg/mL to 0.45 mg/mL. The linear equation of the curve is y = 11.767× x + 0.2737. Each extract was reconstructed in triplicate, and the absorbance of each individual sample was recorded twice (six absorbance values for each experimental variant).
Briefly, tannins were quantified using the indirect method described in the European Pharmacopoeia 8th edition based on the quantification of total phenols and polyphenols not absorbed on hide powder. For the quantification of the total tannin content, an external standard of pyrogallol was used. This standard solution had a concentration of 0.025 mg/mL, as described in the pharmacopeial method [26].

2.5. In Vitro Antioxidant Assays

Free radical scavenging activity was determined according to a previously published method [23]. The inhibition capacity (IC) was calculated as follows: IC% = ((A0 – A1)/A0)×100, where A0 is the absorbance of the DPPH solution, and A1 is the absorbance of the mixture between the sample and DPPH solution read at 517 nm after an incubation period of 30 min. The concentration of extract that inhibits 50% (IC50) of the enzyme activity was calculated according to the least squares regression fit of the logarithmic concentrations plotted against the inhibition capacity, and the results were expressed as µg/mL sample.
ABTS free radical scavenging activity was determined according to a previously published protocol [27]. IC and IC50 were calculated as mentioned above.

2.6. Antimicrobial Activity Assay

The antibacterial activity was quantified by determining the minimum inhibitory concentrations (MICs) using the microdilution method as previously described [28]. Briefly, 10 µL of a freshly made 0.5 McFarland bacterial inoculum was added to 9.99 mL of Muller–Hinton (2x) liquid growth medium, obtaining a bacterial suspension. In the first column of the microdilution plate, 200 µL of 5 mg/mL reconstructed extracts (in water) were added, and each well of the row was filled with 100 µL of sterile water. Twofold dilutions were then performed for each experimental variant in the wells of the microdilution plate. After the completion of the dilution step, 100 µL of bacterial suspension was added to each well. The MICs were assessed after the incubation of the microdilution plate for 18–24 h at 37 °C.
The protocol for the assessment of the fungal strain MICs was similar, using RPMI medium as a substitute for Muller–Hinton (2x) medium.

2.7. Evaluation of Cytotoxicity

Human embryonic kidney cells (293T) were cultured in the presence or absence of the tested solutions in L15 medium with FBS (10%) and antibiotic and antimycotic solutions (1%).
After reaching semi-confluence (48 h), the medium was aspirated, the cells were washed with PBS, and fresh L15 medium mixed with the test solutions (6%, 3%, 1.5%, and 0.25%) was added. The samples were then incubated for 24 h at 37 °C. The medium was aspirated again to remove detached cells (dead cells). The wells were rinsed with PBS. Trypsin was then added to detach the living cells (80 µL/well). The trypsin was neutralized with 300 µL of L15 medium with 10% FBS. The final volume was transferred to Eppendorf tubes and centrifuged at 1500 RPM for 5 min. The supernatant was aspirated, and the cell deposit was resuspended in 50 µL of PBS by vortexing. The cells were then examined in a numbering chamber with the 10x objective of an optic microscope. Cells were numbered in 3 corners. All the numbered cells represent living cells, as dead cells were eliminated in the second aspiration step.

2.8. Antidiabetic (Glucosidase Inhibitory) Assay

An α-glucosidase inhibitory assay was performed according to a method described previously [29]. Briefly, a 2-fold dilution of the sample was performed in 100 mM phosphate buffer (pH 6.8) in a 96-well microplate. Yeast α-glucosidase was added for 10 min. The substrate (5 mM p-nitrophenyl-α-D-glucopyranoside prepared in same buffer) was then added. The absorbances of the samples were measured at 405 nm 20 min after incubation. Acarbose was used as a positive control. The results were expressed as IC50 values using the normalized logarithmic curve of the inhibition percentages calculated according to the following formula (Equation (1)):
Inhibition (%) = [(Abscontrol − Abssample)/Abscontrol] × 100

2.9. Tyrosinase Inhibitory Activity

Tyrosinase inhibitory activity of each sample was determined by a method previously described by Mocan et al [30]. Samples were dissolved in a 5% DMSO aqueous solution; for each sample, four wells were designated as A (buffer + enzyme), B (buffer), C (buffer + enzyme + sample), and D (buffer + sample); each one contained 200 µL of reaction mixture.
The plate was then Incubated at r”om t’mperature for 10 min. After incubation, 40 µL of 2.5 mM L-DOPA in PBS solution was added to each well, and the mixtures were incubated again at room temperature for 20 min. The absorbance of each sample was measured at 475 nm. Kojic acid was used as a positive control (0.10 mg/mL). The results were expressed as IC50 values using the normalized logarithmic curve of the inhibition percentages calculated according to Equation (2):
I   ( % ) = ( A B ) ( C D ) ( A B ) × 100

2.10. Acetylcholinesterase-Inhibitory Activity

Inhibition of acetylcholinesterase was measured through a previously modified version of Ellman’s method [31,32]. The reaction was initiated by mixing diluted extracts with 50 mM Tris-HCl buffer (pH 8.0 ), a 0.9 mM DTNB solution in Tris-HCl buffer, and a 0.078 U/mL enzyme solution. The mixtures were then incubated in a dark place at room temperature for 15 min. After incubation, a 4.5 mM ATCI solution in Tris-HCl buffer was added. The microplates were then incubated again for 10 min. The microplates containing the samples were then read at 405nm using a microplate reader. Galantamine was used as a positive control.
The results were expressed as IC50 values using the normalized logarithmic curve of the inhibition percentages calculated according to Equation (3):
I   ( % ) = A c A s A c × 100
where Ac is the absorbance of the control solution (galantamine), and As is the absorbance of the sample.

2.11. Statistical Analysis

All experiments were performed in triplicate to acquire enough data for statistical analysis, which was performed using GraphPad Prism 8 statistical software. The significance level was chosen before performing any statistical tests (α = 0.05). First, we determined whether our data were normally distributed using the Shapiro–Wilk test instead of the Kolmogorov–Smirnov test, owing to our small sample sizes. After normality assessment, the Kruskal–Wallis test (non-parametric one-way ANOVA) was used for TPC to determine whether a significant difference existed between the experimental variants. A p value less than 0.05 was considered significant. If a significant difference was detected, an appropriate multiple comparison test was used to identify the exact variants that were significantly different. For TTC and antioxidant capacity, an ordinary one-way ANOVA test was applied followed by Tukey’s multiple comparison test. For cytotoxicity evaluation, a one-way ANOVA test was used followed by Dunnett’s multiple comparison test (groups compared to control).

3. Results and Discussions

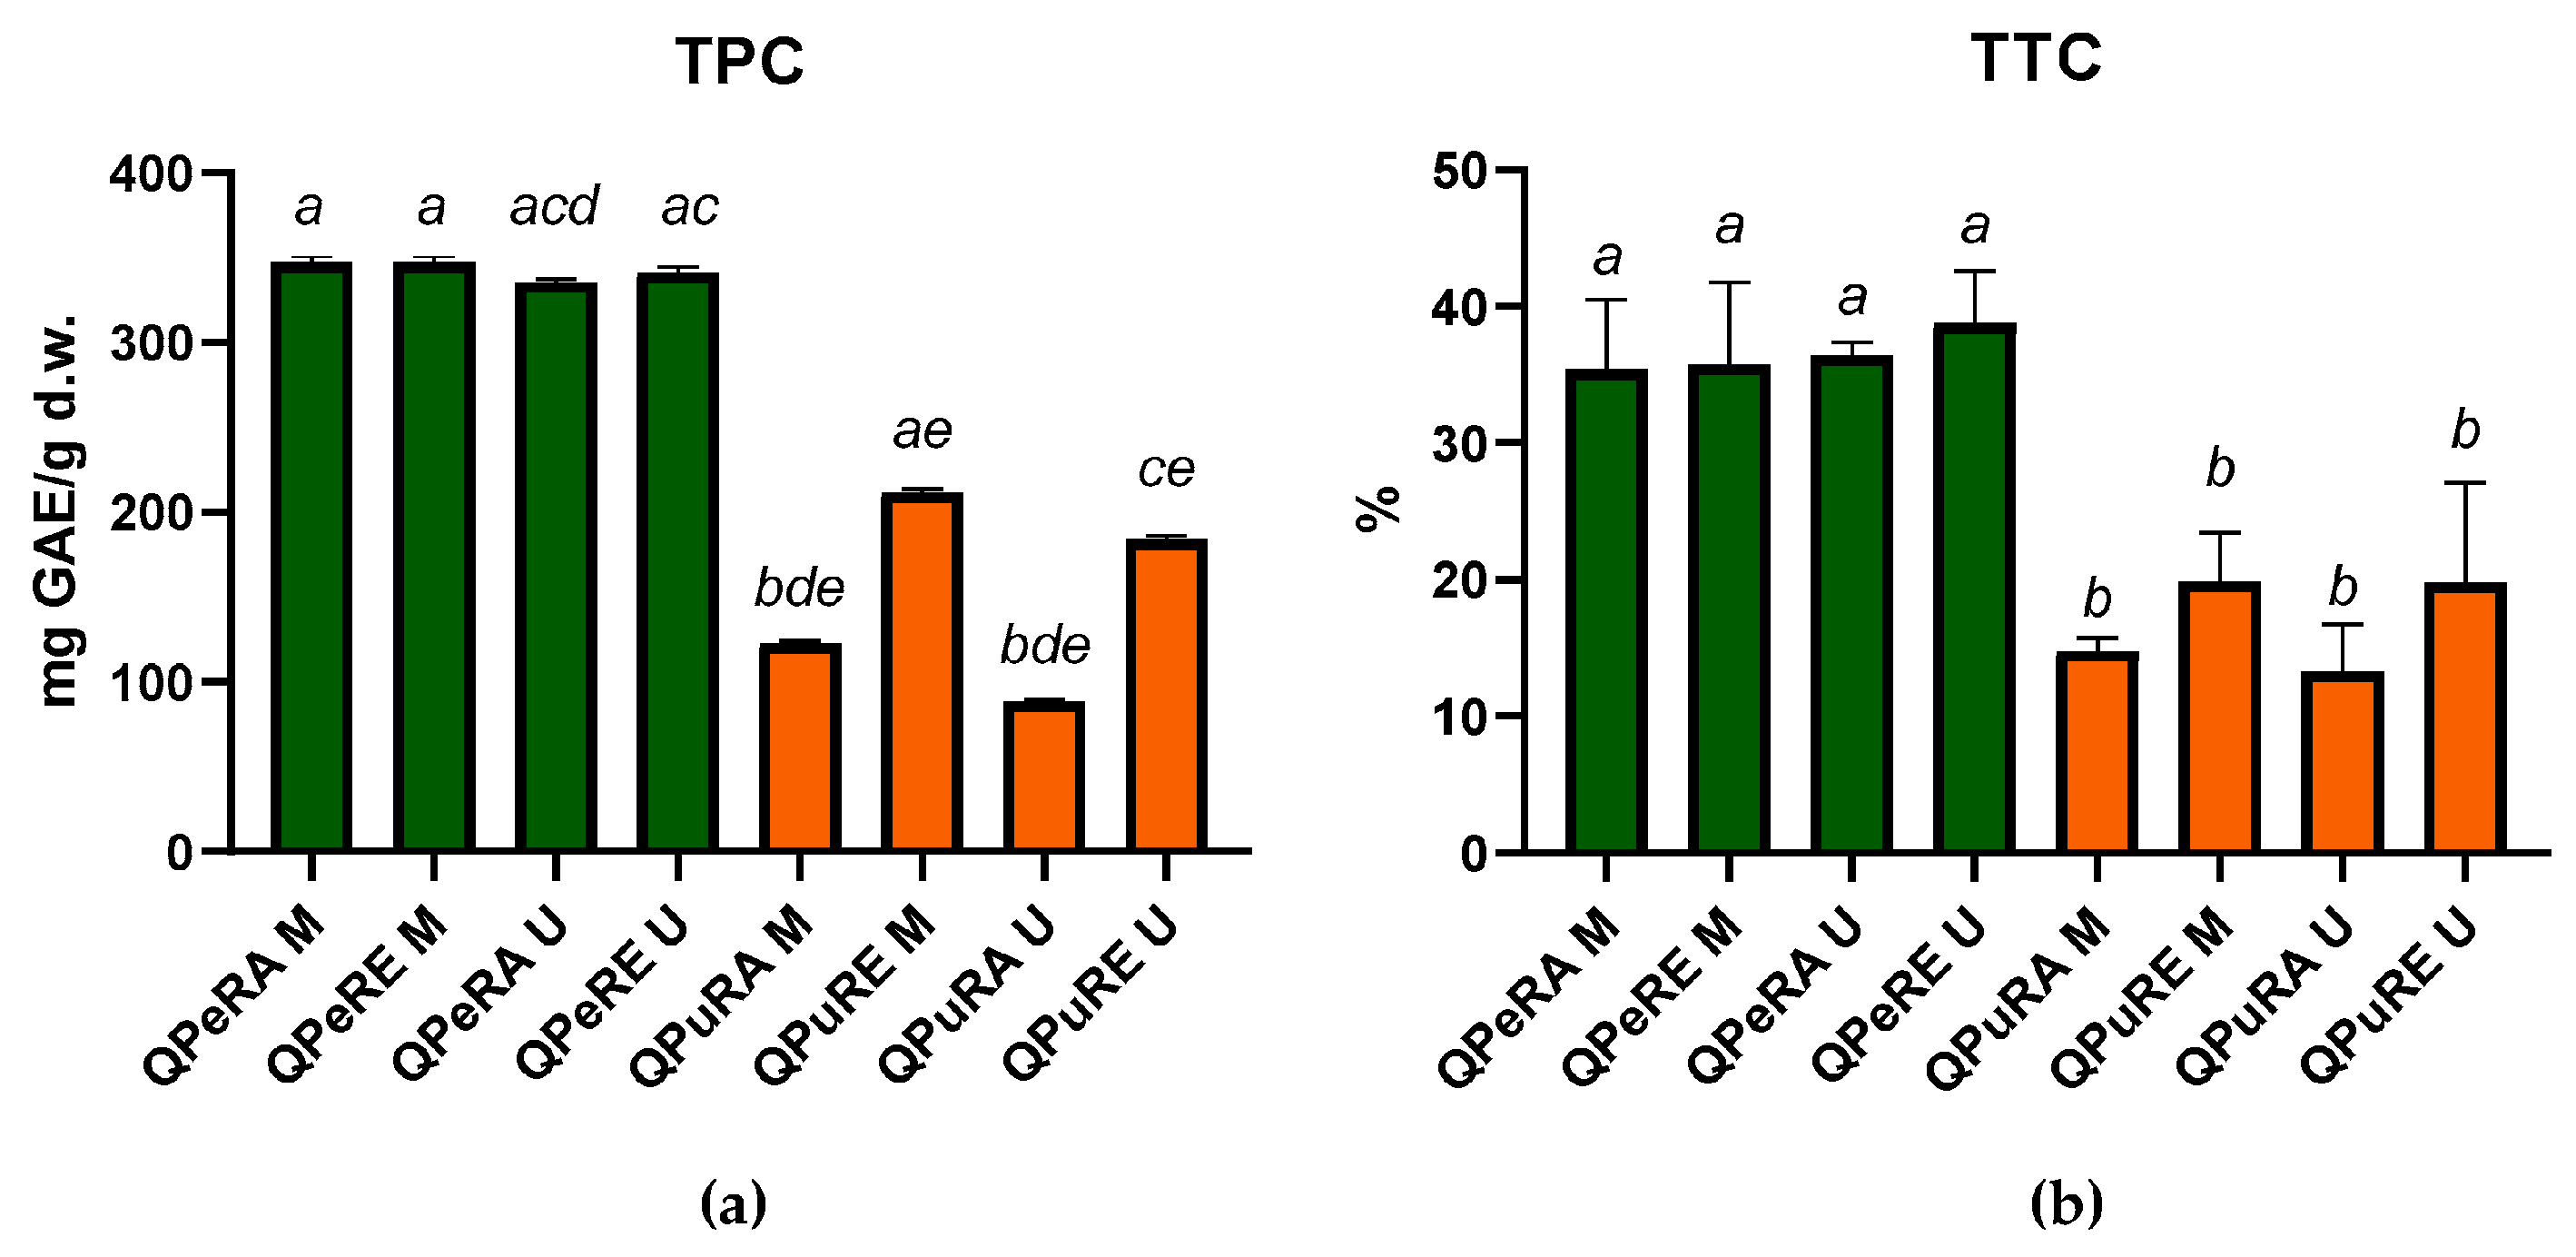
3.1. Total Phenolic Content (TPC)

Figure 1a shows the results for the total phenolic content (TPC) of the tested extracts. The results are expressed as mg gallic acid equivalents (GAE)/g freeze-dried extract (d.w.). As shown in Figure 1, the extract obtained from the bark of Q. petraea had a higher level of TPC compared to the Q. pubescens variants, and the MAE extracts of Q. petraea had a significantly higher level of phenolics compared to all Q. pubescens extracts except qPuRE M. No significant differences occurred between the Q. petraea variants, indicating that the extraction method and solvent did not significantly increase the phenolics yield in the case of this vegetal material. However, in the case of Q. pubescens bark using 70% ethanol solvent, MAE resulted in a higher yield of phenolics compared to the alternative method and solvent, although the differences did not appear to be significant.
Other studies reported high levels of total phenolics in the bark of other oak species. Ethanolic extracts of Q. rotundifolia bark had higher levels of polyphenolic compounds (572.8 mg GAE/g extract) than aqueous extracts (247.6 mg GAE/g extract) [33]. A concentration of 630.3 mg GAE/g extract was obtained using a hydroalcoholic mixture to extract from Q. faginea bark [34], whereas the bark of Q. crassifolia, Q. laurina, and Q. scytophylla comprised concentrations between 329 mg GAE/g extract and 860 mg GAE/g extract, as highlighted by Valencia-Aviles et al. [35]. Considering the data presented in the literature and our results, it can be observed that the Q. petraea bark extracts had comparable levels of polyphenols to those of other oak species, whereas Q. pubescens comprises lower concentrations of polyphenols compared to other species. However, it must be considered that different solvents, extraction methods, and analysis methods were used.

3.2. Total Tannin Content (TTC)

Figure 1b shows the results regarding the TTC of the tested extracts expressed as relative percentages of the TPC of each experimental variant. TTC values exhibit the same trend as the TPC values, considering the similarities of the graphical representations. All Q. petraea experimental variants had significantly higher levels of tannins compared to the Q. pubescens variants. There were no significant differences between the solvents and the extraction methods used. However, for the Q. pubescens variants, a slightly higher level of tannins was observed for the ethanolic extracts compared to the aqueous extracts for both extraction methods.

3.3. Antioxidant Capacity

The IC50 values for the experimental variants follow the same trend for both antioxidant capacity assays, as shown in Figure 2. Generally, lower IC50 values were registered for the Q. petraea variants, whereas UAE resulted in extracts with a higher antioxidant capacity for both species. Moreover, the ethanolic extracts exhibited lower IC50 values for both species and extraction methods, except for the qPeRE M and qPuRE M variants under the DPPH method.
Similar studies focusing on the bark extracts of other oak species have also highlighted the high antioxidant activity of the extracts obtained from this vegetal matrix. Ethanolic extracts obtained from the bark of Q. robur had a higher antioxidant capacity than butylated hydroxytoluene (a common antioxidant food additive) [36]. The radical scavenging potential of the ethanolic extracts of Q. salicina, Q. serrata, and Q. crispula bark was also previously highlighted [37]. Those results were also compared to a positive control of butylated hydroxytoluene. Previous studies have also shown the DPPH scavenging ability of Q. sideroxyla bark extracts [16].

3.4. Antibacterial and Antifungal Activity

The results with respect to antibacterial and antifungal activity are presented in Table 1. All the experimental variants exhibited antibacterial effects at the tested concentrations against Gram-positive bacteria, excluding qPuRA U. Against S. aureus, the Q. petraea variants had lower MIC and MBC values compared to Q. pubescens. Additionally, the ethanolic extracts had a bactericidal effect at lower concentrations compared to the aqueous extracts, regardless of the extraction method used. The same was observed for the S. aureus methicillin-resistant strain, although the MBC did not vary with the solvent used for the Q. petraea variants.
The experimental variants had variable effects against Gram-negative bacteria. E. coli proved to be resistant at the tested concentrations, while K. pneumoniae was sensitive to the tested extracts. The MICs and MBCs were lower in the case of Q. petraea extracts, but the qPuRE M variant exhibited the same potency against K. pneumoniae as the Q. petraea extracts. Against P. aeruginosa, qPeRE M and qPeRA U variants were the most efficient, whereas the Q. pubescens variants had no activity against the bacterial strain at the tested concentrations, with the exception of qPuRE M.
The effect of the tested solutions against the fungi strains was modest. Against C. albicans and C. parapsilosis, the extracts had no effect at the tested concentrations or were effective only at the highest concentration used. Against C. krusei, the Q. petraea variants, together with the qPuRE M variant, exhibited an antifungal effect at a concentration of ≤5 mg/mL.
Previous studies have shown the antibacterial capacity of the bark extracts of other oak species. For example, a study conducted on Q. crassifolia bark extracts not only showed the inhibitory effect of the extracts against E. coli but also that this effect was selective. It was observed that the inhibition zone for E. coli was significantly larger compared to probiotic bacterial strains, namely Lactobacillus bulgaricus and Streptococcus thermophilus [12]. Extracts obtained from the bark of Q. ilex exhibited moderate activity against a series of bacterial strains, namely E. coli, P. aeruginosa, S. aureus, S. epidermidis, P. mirabilis, K. pneumoniae, B. subtilis, S. typhimurium, V. cholerae, S. pyogenes, and S. agalactiae [38]. Another study focused on bark extracts obtained from Q. acutissima, Q. macrocarpa, and Q. robur, with MIC values between 0.05 and 0.29 mg/mL and MBC values between 0.11 and 0.66 mg/mL. These results were registered against P. aeruginosa, B. cereus, L. monocytogenes, E. coli, M. flavus, and S. aureus. The same study focused on the antifungal activity of the extracts and highlighted the inhibition of the growth and development of A. flavus, A. ochraceus, A. niger, C. albicans, P. feniculosum, and P. ochrochloron at low extract concentrations (MIC: 0.16–0.4 mg/mL; MFC: 0.33–0.86 mg/mL) [6].

3.5. Evaluation of Cytotoxicity

The cytotoxic potential of the extracts was first tested after 2 h of incubation. As shown in Table 2, the number of cells present in the control group is significantly higher compared to all the concentrations of the tested solutions, indicating a cytotoxic effect against human embryonic kidney cells 293T (HEK 293T), especially at a concentration of 6% for qPuRE M and at concentrations equal to or above 1.5% for qPeRE U. This highlights the higher potency of Q. petraea bark extracts.
The second step was evaluation after 24 h, which indicated lower cell counts for both test solutions and the control, as shown in Table 3. However, the cell counts for the experimental variants remained significantly lower than the control at every concentration tested. The qPeRE U variant was slightly more potent, exhibiting lower cell counts at lower concentrations than the qPuRE M variant.
The cytotoxic effect of Q. sideroxyla bark extracts was tested on human breast cancer cells (MDA-MB-231) and human cervical cancer cells (HeLa). It was observed that the tested extracts reduced the viability of the cancer cell lines without not significantly affecting the viability of the non-cancerous cell lines [20]. Moreover, the extracts obtained from the bark of Q. cerris, Q. macranthera, and Q. aucheri proved to exert cytotoxic effects against the Hep-2 human larynx epidermoid carcinoma cell line, especially the methanolic extracts of Q. macranthera [8].

3.6. Enzymatic Inhibition

3.6.1. α-Glucosidase Inhibition

All the experimental variants were tested for their effect on the activity of the α-glucosidase enzyme. Acarbose is a known inhibitor of this enzyme and was chosen as a comparison control. As shown in Table 4, all the tested solutions had a lower IC50 value than acarbose, indicating a more potent inhibition of α-glucosidase activity. The lowest IC50 value was registered for the qPeRE U variant—even lower than its pair obtained by MAE. However, the general trend for all the tested solutions indicated that the extracts obtained using 70% ethanol and microwave assistance exhibited lower IC50 values and thus a greater potency in inhibiting the tested enzyme. Q. petraea extracts also showed lower IC50 values than Q. pubescens; only the aqueous extract obtained from the bark of Q. pubescens via UAE (qPuRA U) was an exception, exhibiting a slightly lower IC50 compared to its Q. petraea pair (qPeRA U).
Previous studies showed that bark extracts obtained from Q. coccifera inhibited the α-glucosidase enzyme. The potency of the tested extract was higher than that of acarbose (positive control), with a registered IC50 value of 3.26 µg/mL, while the IC50 value for acarbose was 50.45 µg/mL [9]. Additionally, Q. robur bark extracts inhibited 97% of α-glucosidase activity at a concentration of 7.81 µg/mL. The extract was more potent than the acarbose-positive control [39]. These findings suggest that extracts obtained from the bark of various species of oak can be used as potent antidiabetic agents.

3.6.2. Acetylcholinesterase Inhibition

All the experimental variants were tested regarding their effect on the activity of the acetylcholinesterase enzyme. Galantamine (a known acetylcholinesterase inhibitor) was chosen as a comparison control. As shown in Table 5, all the tested solutions had a lower IC50 value than the control, indicating a less potent inhibition effect against the tested enzyme. Comparing the experimental variants, extraction with 70% ethanol resulted in the lowest IC50 values, regardless of the extraction method and species. For Q. petraea bark, MAE resulted in lower IC50 values, whereas for Q. pubescens, UAE resulted in extracts with a more potent inhibition effect for the extracts obtained with the same solvent.
Hydroalcoholic extracts obtained from the cork and corkback of Q. suber inhibited the activity of acetylcholinesterase by 45% to 65% at a concentration of 1.0 mg/mL depending on the material used and the particle sizes [40]. These inhibitory effects were also present in the extracts obtained from the acorns of Q. suber and Q. ilex, as shown by Custodio et al. [21]. The methanolic extracts exhibited a 69.4% inhibition of acetylcholinesterase at a concentration of 1 mg/mL. These results indicate the potential neuroprotective activity of compounds found in extracts obtained from the bark or other parts of oak species.

3.6.3. Tyrosinase Inhibition

All experimental variants were tested regarding their effect on the activity of the tyrosinase enzyme; however, for two of the experimental variants, the IC50 values could not be assessed (qPeRA U and qPuRA U). Kojic acid was chosen as a comparison control (known tyrosinase inhibitor). As shown in Table 6, all tested solutions exhibited higher IC50 values and therefore lower inhibitory effects than the control compound. Q. petraea bark extracts showed lower IC50 values, regardless of the solvent and extraction method. Additionally, MAE proved to be more efficient for the extraction of tyrosinase inhibitory compounds in aqueous extracts, whereas UAE proved to be more efficient in the case of ethanolic extracts.
The tyrosinase inhibitory effect was previously highlighted for Q. coccifera bark extracts, namely of a specific compound found in these extracts, polydatin [9]. An IC50 value of 4.05 µg/mL was registered for polydatin, whereas the whole extract had an IC50 value of 75.13 µg/mL compared to an IC50 value of 50.75 µg/mL for kojic acid (positive control). Q. dentata leaf extracts indicated a tyrosinase inhibition effect, with a maximum of 43% inhibition at the highest concentration tested. However, the bark extract of the species had no effect on the tyrosinase activity [41].

4. Conclusions

To summarize the results of the present study, the total polyphenolic and total tannin contents followed the same trend, and Q. petraea extracts had higher contents of both TPC and TTC than Q. pubescens variants. The 70% ethanol solution and the MAE were more efficient for the extraction of polyphenols and tannins for both species. The antioxidant capacity was also higher for the Q. petraea variants, but UAE was more efficient in extracting antioxidant compounds. Q. petraea extracts were more efficient in inhibiting the growth and development of Gram-positive bacterial strains K. pneumoniae and P. aeruginosa, whereas no activity was observed against E. coli at the tested concentrations. Modest antifungal activity was registered for both oak species, and no bacterial DNA alteration was observed for the tested variants. For the extracts of both oak species, cytotoxic effects were observed against the HEK 293T cell line. Regarding the effect on the enzymatic activity, both extracts showed an inhibitory effect against the tested enzymes, especially against α-glucosidase. The results show the potential of Q. petraea and Q. pubescens bark extracts to be used in future multipurpose nutraceutical formulations.

Author Contributions

Conceptualization, C.T.; methodology, C.T., A.N. (Adrian Nisca), A.N. (Alexandru Nicolescu), R.Ș., M.B., C.N.C., A.D.M., and A.M. (Adrian Man); validation, C.T. and A.M. (Andrei Mocan); investigation, C.T., A.N. (Adrian Nisca), R.Ș., and M.B.; resources, C.T.; data curation, C.T., A.N. (Alexandru Nicolescu), R.Ș., M.B., A.N. (Adrian Nisca), C.N.C., and A.D.M.; writing—original draft preparation, C.T., R.Ș., and A.N. (Alexandru Nicolescu); writing—review and editing A.M. (Andrei Mocan); supervision, C.T.; project administration, C.T.; funding acquisition, C.T. All authors have read and agreed to the published version of the manuscript.

Funding

This work was supported by a grant from the Romanian Ministry of Education and Research (CNS-UEFISCDI, project number PN-III-P1-1.1-TE-2019-1549) within PNCDI III.

Institutional Review Board Statement

Not applicable.

Informed Consent Statement

Not applicable.

Data Availability Statement

Not applicable.

Conflicts of Interest

The authors declare no conflict of interests.

References

  1. Wild Crop Relatives: Genomic and Breeding Resources; Kole, C. (Ed.) Springer: Berlin/Heidelberg, Germany, 2011; ISBN 978-3-642-21249-9. [Google Scholar]
  2. Alejano, R.; Vázquez-Piqué, J.; Domingo-Santos, J.; Fernández, M.; Andivia, E.; Martin, D.; Peérez-Carral, C.; González-Pérez, M.A. Dehesas: Open Woodland Forests of Quercus in Southwestern Spain. Ed. Nova Science Publishers: New York, NY, USA, 2011; ISBN 978-1-61942-493-7. [Google Scholar]
  3. Burlacu, E.; Nisca, A.; Tanase, C. A Comprehensive Review of Phytochemistry and Biological Activities of Quercus Species. Forests 2020, 11, 904. [Google Scholar] [CrossRef]
  4. Morales, D. Oak Trees (Quercus spp.) as a Source of Extracts with Biological Activities: A Narrative Review. Trends Food Sci. Technol. 2021, 109, 116–125. [Google Scholar] [CrossRef]
  5. Şöhretoğlu, D.; Renda, G. The Polyphenolic Profile of Oak (Quercus) Species: A Phytochemical and Pharmacological Overview. Phytochem. Rev. 2020, 19, 1379–1426. [Google Scholar] [CrossRef]
  6. Panchal, S.K.; Brown, L. Cardioprotective and Hepatoprotective Effects of Ellagitannins from European Oak Bark (Quercus petraea L.) Extract in Rats. Eur. J. Nutr. 2013, 52, 397–408. [Google Scholar] [CrossRef]
  7. Lorenz, P.; Heinrich, M.; Garcia-Käufer, M.; Grunewald, F.; Messerschmidt, S.; Herrick, A.; Gruber, K.; Beckmann, C.; Knoedler, M.; Huber, R.; et al. Constituents from Oak Bark (Quercus robur L.) Inhibit Degranulation and Allergic Mediator Release from Basophils and Mast Cells in Vitro. J. Ethnopharmacol. 2016, 194, 642–650. [Google Scholar] [CrossRef]
  8. Şöhretoğlu, D.; Sabuncuoğlu, S.; Harput, Ü.Ş. Evaluation of Antioxidative, Protective Effect against H2O2 Induced Cytotoxicity, and Cytotoxic Activities of Three Different Quercus Species. Food Chem. Toxicol. 2012, 50, 141–146. [Google Scholar] [CrossRef]
  9. Sari, S.; Barut, B.; Özel, A.; Kuruüzüm-Uz, A.; Şöhretoğlu, D. Tyrosinase and α-Glucosidase Inhibitory Potential of Compounds Isolated from Quercus coccifera Bark: In Vitro and in Silico Perspectives. Bioorganic Chem. 2019, 86, 296–304. [Google Scholar] [CrossRef] [PubMed]
  10. Khouzami, L.; Mroueh, M.; Daher, C. The Role of Methanolic Extract of Quercus infectoria Bark in Lipemia, Glycemia, Gastric Ulcer and Bacterial Growth. J. Med. Plants Res. 2009, 2, 224–230. [Google Scholar]
  11. Sharifi, N.; Souri, E.; Ziai, S.A.; Amin, G.; Amanlou, M. Discovery of New Angiotensin Converting Enzyme (ACE) Inhibitors from Medicinal Plants to Treat Hypertension Using an in Vitro Assay. DARU J. Pharm. Sci. 2013, 21, 74. [Google Scholar] [CrossRef] [Green Version]
  12. Valencia-Avilés, E.; Martínez-Flores, H.; García-Pérez, M.; Meléndez-Herrera, E.; García-Pérez, M. Investigation of the Antibacterial Activity and Subacute Toxicity of a Quercus crassifolia Polyphenolic Bark Extract for Its Potential Use in Functional Foods. J. Food Sci. 2019, 84, 1692–1702. [Google Scholar] [CrossRef]
  13. Elansary, H.; Szopa, A.; Kubica, P.; Ekiert, H.A.; Mattar, M.; Al-Yafrasi, M.A.; El-Ansary, D.O.; Zin El-Abedin, T.K.; Yessoufou, K. Polyphenol Profile and Pharmaceutical Potential of Quercus spp. Bark Extracts. Plants 2019, 8, 486. [Google Scholar] [CrossRef] [PubMed]
  14. Horvathova, M.; Orszaghova, Z.; Laubertova, L.; Vavakova, M.; Sabaka, P.; Rohdewald, P.; Durackova, Z.; Muchova, J. Effect of the French Oak Wood Extract Robuvit on Markers of Oxidative Stress and Activity of Antioxidant Enzymes in Healthy Volunteers: A Pilot Study. Oxid. Med. Cell. Longev. 2014, 2014, e639868. [Google Scholar] [CrossRef] [Green Version]
  15. Natella, F.; Leoni, G.; Maldini, M.; Natarelli, L.; Comitato, R.; Schonlau, F.; Virgili, F.; Canali, R. Absorption, Metabolism, and Effects at Transcriptome Level of a Standardized French Oak Wood Extract, Robuvit, in Healthy Volunteers: Pilot Study. J. Agric. Food Chem. 2014, 62, 443–453. [Google Scholar] [CrossRef]
  16. Rosales-Castro, M.; González-Laredo, R.F.; Rocha-Guzmán, N.E.; Gallegos-Infante, J.A.; Rivas-Arreola, M.J.; Karchesy, J.J. Antioxidant Activity of Fractions from Quercus sideroxyla Bark and Identification of Proanthocyanidins by HPLC-DAD and HPLC-MS. Holzforschung 2012, 66, 577–584. [Google Scholar] [CrossRef]
  17. Dróżdż, P.; Pyrzynska, K. Extracts from Pine and Oak Barks: Phenolics, Minerals and Antioxidant Potential. Int. J. Environ. Anal. Chem. 2021, 101, 464–472. [Google Scholar] [CrossRef]
  18. Uddin, G.; Rauf, A. Phytochemical Screening, Antimicrobial and Antioxidant Activities of Aerial Parts of Quercus robur L. Middle-East J. Med. Plants Res. 2012, 1, 1–4. [Google Scholar]
  19. Dania, V.O.; Fadina, O.O.; Ayodele, M.; Kumar, P.L. Efficacy of Oryza sativa Husk and Quercus phillyraeoides Extracts for the in Vitro and in Vivo Control of Fungal Rot Disease of White Yam (Dioscorea rotundata Poir). SpringerPlus 2014, 3, 711. [Google Scholar] [CrossRef] [Green Version]
  20. Soto-García, M.; Rosales-Castro, M.; García-Sánchez, J.R.; Rivas-Arreola, M.J.; Soto-García, M.; Rosales-Castro, M.; García-Sánchez, J.R.; Rivas-Arreola, M.J. In Vitro Cytotoxic Activity of Bark Extracts from Pinus durangensis Martinez and Quercus sideroxyla Bonpl. Biotecnia 2022, 24, 55–61. [Google Scholar] [CrossRef]
  21. Custódio, L.; Patarra, J.; Alberício, F.; Neng, N.R.; Nogueira, J.M.F.; Romano, A. Extracts from Quercus sp. Acorns Exhibit in Vitro Neuroprotective Features through Inhibition of Cholinesterase and Protection of the Human Dopaminergic Cell Line SH-SY5Y from Hydrogen Peroxide-Induced Cytotoxicity. Ind. Crops Prod. 2013, 45, 114–120. [Google Scholar] [CrossRef]
  22. Gezici, S.; Sekeroglu, N. Neuroprotective Potential and Phytochemical Composition of Acorn Fruits. Ind. Crops Prod. 2019, 128, 13–17. [Google Scholar] [CrossRef]
  23. Nisca, A.; Ștefănescu, R.; Moldovan, C.; Mocan, A.; Mare, A.D.; Ciurea, C.N.; Man, A.; Muntean, D.-L.; Tanase, C. Optimization of Microwave Assisted Extraction Conditions to Improve Phenolic Content and In Vitro Antioxidant and Anti-Microbial Activity in Quercus cerris Bark Extracts. Plants 2022, 11, 240. [Google Scholar] [CrossRef] [PubMed]
  24. Tanase, C.; Mocan, A.; Coșarcă, S.; Gavan, A.; Nicolescu, A.; Gheldiu, A.-M.; Vodnar, D.C.; Muntean, D.-L.; Crișan, O. Biological and Chemical Insights of Beech (Fagus sylvatica L.) Bark: A Source of Bioactive Compounds with Functional Properties. Antioxidants 2019, 8, 417. [Google Scholar] [CrossRef] [PubMed]
  25. Cicco, N.; Lanorte, M.T.; Paraggio, M.; Viggiano, M.; Lattanzio, V. A Reproducible, Rapid and Inexpensive Folin–Ciocalteu Micro-Method in Determining Phenolics of Plant Methanol Extracts. Microchem. J. 2009, 91, 107–110. [Google Scholar] [CrossRef]
  26. Council of Europe; European Directorate for the Quality of Medicines & Healthcare. European Pharmacopoeia 8.0: Published in Accordance with the Convention on the Elaboration of a European Pharmacopoeia; European Directorate for the Quality of Medicines & Healthcare, Council of Europe: Strasbourg, France, 2013; ISBN 978-92-871-7525-0. [Google Scholar]
  27. Nisca, A.; Ștefănescu, R.; Stegăruș, D.I.; Mare, A.D.; Farczadi, L.; Tanase, C. Phytochemical Profile and Biological Effects of Spruce (Picea abies) Bark Subjected to Ultrasound Assisted and Microwave-Assisted Extractions. Plants 2021, 10, 870. [Google Scholar] [CrossRef]
  28. Tanase, C.; Cosarca, S.; Toma, F.; Mare, A.; Man, A.; Miklos, A.; Imre, S.; Boz, I. ANTIBACTERIAL ACTIVITIES OF BEECH BARK (Fagus sylvatica L.) POLYPHENOLIC EXTRACT. Environ. Eng. Manag. J. 2018, 17, 877–884. [Google Scholar] [CrossRef]
  29. Mocan, A.; Babotă, M.; Pop, A.; Fizeșan, I.; Diuzheva, A.; Locatelli, M.; Carradori, S.; Campestre, C.; Menghini, L.; Sisea, C.R.; et al. Chemical Constituents and Biologic Activities of Sage Species: A Comparison between Salvia Officinalis L., S. Glutinosa L. and S. Transsylvanica (Schur Ex Griseb. & Schenk) Schur. Antioxidants 2020, 9, 480. [Google Scholar] [CrossRef] [PubMed]
  30. Mocan, A.; Cairone, F.; Locatelli, M.; Cacciagrano, F.; Carradori, S.; Vodnar, D.C.; Crișan, G.; Simonetti, G.; Cesa, S. Polyphenols from Lycium barbarum (Goji) Fruit European Cultivars at Different Maturation Steps: Extraction, HPLC-DAD Analyses, and Biological Evaluation. Antioxidants 2019, 8, 562. [Google Scholar] [CrossRef] [Green Version]
  31. Nicolescu, A.; Babotă, M.; Zhang, L.; Bunea, C.I.; Gavrilaș, L.; Vodnar, D.C.; Mocan, A.; Crișan, G.; Rocchetti, G. Optimized Ultrasound-Assisted Enzymatic Extraction of Phenolic Compounds from Rosa canina L. Pseudo-Fruits (Rosehip) and Their Biological Activity. Antioxidants 2022, 11, 1123. [Google Scholar] [CrossRef]
  32. Păltinean, R.; Ielciu, I.; Hanganu, D.; Niculae, M.; Pall, E.; Angenot, L.; Tits, M.; Mocan, A.; Babotă, M.; Frumuzachi, O.; et al. Biological Activities of Some Isoquinoline Alkaloids from Fumaria schleicheri Soy. Will. Plants 2022, 11, 1202. [Google Scholar] [CrossRef] [PubMed]
  33. Sousa, V.; Ferreira, J.P.A.; Miranda, I.; Quilhó, T.; Pereira, H. Quercus rotundifolia Bark as a Source of Polar Extracts: Structural and Chemical Characterization. Forests 2021, 12, 1160. [Google Scholar] [CrossRef]
  34. Ferreira, J.P.A.; Miranda, I.; Sousa, V.B.; Pereira, H. Chemical Composition of Barks from Quercus faginea Trees and Characterization of Their Lipophilic and Polar Extracts. PLOS ONE 2018, 13, e0197135. [Google Scholar] [CrossRef] [PubMed]
  35. Valencia-Avilés, E.; García-Pérez, M.E.; Garnica-Romo, M.G.; Figueroa-Cárdenas, J.D.D.; Meléndez-Herrera, E.; Salgado-Garciglia, R.; Martínez-Flores, H.E. Antioxidant Properties of Polyphenolic Extracts from Quercus laurina, Quercus crassifolia, and Quercus scytophylla Bark. Antioxidants 2018, 7, 81. [Google Scholar] [CrossRef] [PubMed]
  36. Dróżdż, P.; Pyrzynska, K. Assessment of Polyphenol Content and Antioxidant Activity of Oak Bark Extracts. Eur. J. Wood Wood Prod. 2018, 76, 793–795. [Google Scholar] [CrossRef] [Green Version]
  37. Tuyen, P.T.; Khang, D.T.; Thu Ha, P.T.; Hai, T.N.; Elzaawely, A.A.; Xuan, T.D. Antioxidant Capacity and Phenolic Contents of Three Quercus Species. Int. Lett. Nat. Sci. 2016, 54, 85–99. [Google Scholar] [CrossRef]
  38. Berahou, A.; Auhmani, A.; Fdil, N.; Benharref, A.; Jana, M.; Gadhi, C.A. Antibacterial Activity of Quercus ilex Bark’s Extracts. J. Ethnopharmacol. 2007, 112, 426–429. [Google Scholar] [CrossRef] [PubMed]
  39. Unuofin, J.O.; Lebelo, S.L. UHPLC-QToF-MS Characterization of Bioactive Metabolites from Quercus robur L. Grown in South Africa for Antioxidant and Antidiabetic Properties. Arab. J. Chem. 2021, 14, 102970. [Google Scholar] [CrossRef]
  40. Ferreira, J.; Santos, S.; Pereira, H. In Vitro Screening for Acetylcholinesterase Inhibition and Antioxidant Activity of Quercus suber Cork and Corkback Extracts. Evid. Based Complement. Alternat. Med. 2020, 2020, e3825629. [Google Scholar] [CrossRef]
  41. Hwang, J.-H.; Lee, B.M. Inhibitory Effects of Plant Extracts on Tyrosinase, l-DOPA Oxidation, and Melanin Synthesis. J. Toxicol. Environ. Health A 2007, 70, 393–407. [Google Scholar] [CrossRef]
Figure 1. (a) Total phenolic content (TPC) of the oak bark extracts. (b) Total tannin content (TTC) of the bark extracts; different letters indicate significant differences. qPeRA M—Q. petraea bark extract obtained by aqueous MAE; qPeRE M—Q. petraea bark extract obtained by ethanolic MAE; qPeRA U—Q. petraea bark extract obtained by aqueous UAE; qPeRE U—Q. petraea bark extract obtained by ethanolic UAE; qPuRA M—Q. pubescens bark extract obtained by aqueous MAE; qPuRE M—Q. pubescens bark extract obtained by ethanolic MAE; qPuRA U—Q. pubescens bark extract obtained by aqueous UAE; qPuRE U—Q. pubescens bark extract obtained by ethanolic UAE. Results are expressed as mg GAE/g d.w (dry weight) (TPC) and as percentage of the TPC (TTC).
Forests 14 00116 g001
Figure 2. (a) Antioxidant capacity (DPPH method); (b) antioxidant capacity (ABTS method); different letters indicate significant differences. qPeRA M—Q. petraea bark extract obtained by aqueous MAE; qPeRE M—Q. petraea bark extract obtained by ethanolic MAE; qPeRA U—Q. petraea bark extract obtained by aqueous UAE; qPeRE U—Q. petraea bark extract obtained by ethanolic UAE; qPuRA M—Q. pubescens bark extract obtained by aqueous MAE; qPuRE M—Q. pubescens bark extract obtained by ethanolic MAE; qPuRA U—Q. pubescens bark extract obtained by aqueous UAE; qPuRE U—Q. pubescens bark extract obtained by ethanolic UAE. Results are expressed as µg freeze-dried extract/ mL solution (representing the IC50 value).
Forests 14 00116 g002
Table 1. MIC and MBC values of the tested extracts against the bacterial and fungal strain results expressed as mg freeze-dried extract/mL solution (concentration in the microtiter plate wells).
Tested BacteriaMIC/MBC (mg Freeze-Dried Extract/mL Solution)
qPeRA MqPeRE MqPeRA UqPeRE UqPuRA MqPuRE MqPuRA U
Staphylococcus aureus
ATCC 25923
0.3/2.50.3/0.30.3/1.250.156/0.32.5/50.6/2.55/>5
Methicillin-resistant Staphylococcus aureus (MRSA) ATCC 433000.6/0.60.3/0.30.3/0.30.3/0.32.5/2.50.6/1.25>5/>5
Escherichia coli ATCC 25922>5/>5>5/>5>5/>5>5/>5>5/>5>5/>5>5/>5
Klebsiella pneumoniae
ATCC 700603
0.3/0.30.3/1.250.3/0.60.3/0.31.25/1.250.3/0.35/5
Pseudomonas aeruginosa
ATCC 2753
2.5/51.25/1.250.6/2.51.25/>5>5/>52.5/2.5>5/>5
Tested fungiMIC/MFC (mg Freeze-Dried Extract/mL Solution)
Candida albicans
ATCC 90028
>5/>5>5/>5>5/>5>5/>5>5/>5>5/>5>5/>5
Candida parapsilosis
ATCC 22019
>5/>55/>55/>5>5/>5>5/>55/5>5/>5
Candida krusei
ATCC 6258
1.25/>51.25/>52.5/>55/>5>5/>52.5/>55/>5
qPeRA M—Q. petraea bark extract obtained by aqueous MAE; qPeRE M—Q. petraea bark extract obtained by ethanolic MAE; qPeRA U—Q. petraea bark extract obtained by aqueous UAE; qPeRE U—Q. petraea bark extract obtained by ethanolic UAE; qPuRA M—Q. pubescens bark extract obtained by aqueous MAE; qPuRE M—Q. pubescens bark extract obtained by ethanolic MAE; qPuRA U—Q. pubescens bark extract obtained by aqueous UAE; qPuRE U—Q. pubescens bark extract obtained by ethanolic UAE. Results are expressed as mg freeze-dried extract/ mL solution (concentration in the microtiter plate wells).
Table 2. The effect of tested solutions on confluent cells after 2 h of incubation.
Tested SolutionConcentration of Tested SolutionMean
qPuRE M6%3.67 ± 1.16 *
3%57.67 ± 5.03 *
1.5%46.00 ± 11.79 *
0.25%41.33 ± 15.31 *
qPeRE U6%0.00 ± 0.00 *
3%0.33 ± 0.58 *
1.5%1.00 ± 1.00 *
0.25%56.00 ± 14.42 *
Control 150.00 ± 15.62
qPuRE M—Q. pubescens bark extract obtained by ethanolic MAE; qPeRE U—Q. petraea bark extract obtained by ethanolic UAE. The concentration of the tested solutions is expressed as percentage of stock solution concentration (10 mg/mL) ± SD; “*”, significant difference compared to the control. The results are expressed as the number of confluent cells.
Table 3. The effect of tested solutions on confluent cells after 24 h of incubation.
Tested SolutionConcentration of Tested SolutionMean
qPuRE M6%0.00 ± 0.00 *
3%0.00 ± 0.00 *
1.5%1.67 ± 1.16 *
0.25%1.00 ± 1.00 *
qPeRE U6%0.00 ± 0.00 *
3%0.00 ± 0.00 *
1.5%0.67 ± 0.58 *
0.25%0.00 ± 0.00 *
Control 7.67 ± 3.12
qPuRE M—Q. pubescens bark extract obtained by ethanolic MAE; qPeRE U—Q. petraea bark extract obtained by ethanolic UAE. The concentration of the tested solutions is expressed as percentage of stock solution concentration (10 mg/mL) ± SD; “*”, significant difference compared to the control. Results are expressed as the number of confluent cells.
Table 4. IC50 values for the tested solutions against α-glucosidase.
Tested SolutionIC50 (µg/mL)
qPeRA M6.1675
qPeRE M3.9125
qPeRA U12.0025
qPeRE U3.385
qPuRA M9.64
qPuRE M6.7
qPuRA U11.045
qPuRE U9.5775
Control (Acarbose)122.275
qPeRA M—Q. petraea bark extract obtained by aqueous MAE; qPeRE M—Q. petraea bark extract obtained by ethanolic MAE; qPeRA U—Q. petraea bark extract obtained by aqueous UAE; qPeRE U—Q. petraea bark extract obtained by ethanolic UAE; qPuRA M—Q. pubescens bark extract obtained by aqueous MAE; qPuRE M—Q. pubescens bark extract obtained by ethanolic MAE; qPuRA U—Q. pubescens bark extract obtained by aqueous UAE; qPuRE U—Q. pubescens bark extract obtained by ethanolic UAE. Results are expressed as µg freeze-dried extract/mL solution (concentration from the microtiter plate wells).
Table 5. IC50 values for the tested solutions against acetylcholinesterase.
Tested SolutionIC50 (µg/mL)
qPeRA M176.7
qPeRE M55.51
qPeRA U232.9
qPeRE U110.9
qPuRA M272.5
qPuRE M165.4
qPuRA U222.7
qPuRE U109.0
Control (Galantamine)0.000185
qPeRA M—Q. petraea bark extract obtained by aqueous MAE; qPeRE M—Q. petraea bark extract obtained by ethanolic MAE; qPeRA U—Q. petraea bark extract obtained by aqueous UAE; qPeRE U—Q. petraea bark extract obtained by ethanolic UAE; qPuRA M—Q. pubescens bark extract obtained by aqueous MAE; qPuRE M—Q. pubescens bark extract obtained by ethanolic MAE; qPuRA U—Q. pubescens bark extract obtained by aqueous UAE; qPuRE U—Q. pubescens bark extract obtained by ethanolic UAE. IC50 values are expressed as µg dried extract/mL solution (concentration from the microtiter plate wells).
Table 6. IC50 values for the tested solutions against tyrosinase
Tested SolutionIC50 (µg/mL)
qPeRA M91.8
qPeRE M94.54
qPeRA U-
qPeRE U85.48
qPuRA M286.8
qPuRE M130.16
qPuRA U-
qPuRE U97.06
Control (Kojic acid)4.44
qPeRA M—Q. petraea bark extract obtained by aqueous MAE; qPeRE M—Q. petraea bark extract obtained by ethanolic MAE; qPeRA U—Q. petraea bark extract obtained by aqueous UAE; qPeRE U—Q. petraea bark extract obtained by ethanolic UAE; qPuRA M—Q. pubescens bark extract obtained by aqueous MAE; qPuRE M—Q. pubescens bark extract obtained by ethanolic MAE; qPuRA U—Q. pubescens bark extract obtained by aqueous UAE; qPuRE U—Q. pubescens bark extract obtained by ethanolic UAE. IC50 values are expressed as µg dried extract/mL solution (concentration from the microtiter plate wells).
Disclaimer/Publisher’s Note: The statements, opinions and data contained in all publications are solely those of the individual author(s) and contributor(s) and not of MDPI and/or the editor(s). MDPI and/or the editor(s) disclaim responsibility for any injury to people or property resulting from any ideas, methods, instructions or products referred to in the content.

