Article

Spatial and Temporal Evolution and Driving Mechanisms of Water Conservation Amount of Major Ecosystems in Typical Watersheds in Subtropical China

School of Geography, South China Normal University, Guangzhou 510631, China
*
Author to whom correspondence should be addressed.
Forests 2023, 14(1), 93; https://doi.org/10.3390/f14010093
Submission received: 15 December 2022 / Revised: 30 December 2022 / Accepted: 1 January 2023 / Published: 4 January 2023
(This article belongs to the Section Forest Hydrology)

Abstract

:
The water conservation function of ecosystems is a research hot spot in the field of water resources, and it is also an important ecological service function of terrestrial ecosystems and a key point in eco-hydrology research. With the increasing frequency of human activities and climate change, how to reveal the response of ecosystem water conservation function to the changing environment is a scientific problem that needs to be urgently addressed in ecological hydrology research. To reveal the eco-hydrological processes under the changing environment, this study was based on the distributed hydrological model (SWAT) and used water conservation amount (WCA) as an indicator to assess the water conservation capacity of ecosystems. Scenario analysis and statistical analysis were also used to determine the spatial and temporal evolution of the WCAs of farmland, forest, and grassland ecosystems under a changing environment and to further investigate the influence mechanisms of land use change and climate change on the WCA. The findings show that (1) the climate conditions in the Hanjiang watershed have determined the distribution pattern of the ecosystem’s WCA. The spatial distribution patterns of the WCA of each ecosystem differed significantly between the dry season and the wet season. Under the combined influence of human activities and climate change, there was no significant change in the spatial distribution pattern of the WCA. (2) Climate change patterns, which were dominated by precipitation and influenced by evapotranspiration, determined the changes in the WCA of ecosystems. In addition, there were significant spatial differences in the response of the watershed WCA under changing environments in the dry season. Differences in land use type and local climate change were the main reasons for such differences. (3) There were differences in the WCA and the response to changing environments among ecosystems. Forest ecosystems had the highest WCA; grassland ecosystems were the most sensitive to land use change. This study can provide a theoretical basis for alleviating the increasingly serious water resource problems in the basin and ensuring water and ecological security in the basin.

1. Introduction

Essentially, ecosystem services are the benefits humans derive from ecosystem functions that provide the basis for their survival and development [1]. A major function of ecosystems are eco-hydrological services [2]. In ecosystem services, the water conservation function is the focus of hydrological services. Through canopy, plant litter, soil, lakes, and water bodies at a particular spatial and temporal scale, an ecosystem can intercept, infiltrate, store, and maintain water in its system, which meets the ecosystem’s water demand while maintaining the ecosystem’s environmental quality [3]. Hydrological services are becoming increasingly important for human social development and ecological security as human demand for water resources increases. In watersheds, water-bearing functions have become a major challenge for water resources management [4,5]. The conservation of water not only affects ecosystem productivity, nutrient cycling, and environmental purification but also constrains the sustainable development of the socioeconomic system. Additionally, the International Geosphere-Biosphere Programme (IGBP) and the International Hydrological Programme (IHP) have initiated a series of major research projects involving ecological hydrology and water resources. There have been many studies demonstrating the spatial and temporal heterogeneity, complexity, and dynamics of the water conservation function [2]. This study supports the construction of regional ecological security by assessing the water conservation function and exploring its change mechanisms.
Currently, ecosystems around the world are experiencing dramatic changes. Anthropogenic activities and climate change are the two major factors driving changes in ecosystem services [6,7]. As a result of land use change and climate change, water-bearing functions are also being affected [8,9]. A major contributor to the loss of biodiversity and ecosystem services is land use and land cover change [10,11], which also affects water quantity by altering infiltration and evapotranspiration [12]. The effects of climate change are significantly affecting hydrological processes and vegetation physiological ecology as well as the hydrological cycle [13,14]. Consequently, scholars need to investigate how land use change and climate change affect water conservation functions. In recent years, most scholars have focused on water yield responses to changing environments [15,16] and have conducted studies at the watershed scale. There is a lack of a comprehensive and targeted evaluation of how water conservation amount (WCA) changes in different ecosystems under changing conditions [12,17]. Therefore, this article integrates scenario analysis, statistical methods, and ecosystem service assessment in order to analyze changes in ecosystem services in a more comprehensive and effective way.
The water conservation function of Chinese ecosystems has decreased in recent decades, which has profound implications for watershed management and ecosystem stability [13]. As a typical watershed in the subtropical region of China, the Hanjiang watershed is not only the second largest in Guangdong Province, China, following the Pearl River, but it is also an important water source and ecological barrier for eastern Guangdong and southwestern Fujian [18,19]. Watershed ecosystems have undergone dramatic changes due to frequent human activities and climate change, affecting their water conservation function. This study aims to reveal the response of watershed eco-hydrological processes to changing environments, as well as the spatial and temporal evolution of the WCA in different ecosystems. The results of this study will provide a basis for eco-hydrological studies on typical subtropical watersheds in China. Based on distributed hydrological models and water balance equations, we investigated (1) the spatial and temporal evolution of the WCA in the watershed from 1980 to 2020; (2) determined how land use change and climate change affect the ecosystem WCA using scenario setting methods and statistical analysis; (3) determined if different ecosystems respond differently to changes in the WCA. Additionally, our research results are critical to ecological construction, environmental protection, and socio-economic development in the watershed, and can provide useful references and theoretical support to the government when making ecological and environmental decisions.

2. Materials and Methods

2.1. Study Area

The Hanjiang watershed is located between 115°13′ and 117°09′ E, 23°17′ and 26°05′ N. Its area includes parts of the Guangdong, Fujian, and Jiangxi Provinces (Figure 1). It is mainly composed of the Mei River and the Ting River, which merge to form the Hanjiang River mainstream, which eventually merges with the South China Sea. It is located in the subtropical monsoon climate zone, where the weather is hot and humid and storms are frequent. In the watershed, annual rainfall averages about 1620 mm, with uneven distribution and large spatial variations, and about 70%–85% of the rainfall occurs during the flood season. In the dry season, rainfall amounts to only 15% to 30% of the annual rainfall, which has also resulted in significant differences between flood and dry season runoff in the watershed. In the flood season, the runoff accounts for about 80% of the annual runoff, which is 2.7 times more than in the dry season [18]. Forest, cropland, and grassland account for about 95% of the area of the Hanjiang watershed, with forest land accounting for 68% and cropland for 20%. There are three main types of ecosystems in the Hanjiang watershed: forest ecosystems, farmland ecosystems, and grassland ecosystems.

2.2. Materials

The hydrological model was constructed using digital elevation data (DEM), land cover data, soil data, and meteorological data. The digital elevation data were provided by the International Scientific Data Service Platform of the Chinese Academy of Sciences (http://www.csdb.cn/ accessed on 1 July 2021) with a spatial resolution of 90 m. Five land cover data from 1980 to 2020 were obtained through remote sensing interpretation, and remote sensing data were obtained from the official website of the U.S. Geological Survey (http://earthexplorer.usgs.gov accessed on 7 July 2021), with a resolution of 30 m. The soil data were provided by the World Soil Database (HWSD) (https://www.fao.org/soils-portal/ accessed on 10 July 2021). In addition, the soil hydrological property data were calculated using Soil Plant Atmosphere Water (SPAW) software. Data from 32 meteorological stations in the watershed from 1970 to 2020 included daily-scale precipitation, temperature, solar radiation, wind speed, and relative humidity, as collected by the China National Meteorological Science Data Sharing Service Platform and some district and county meteorological bureaus in Guangdong, Fujian, and Jiangxi. The data for the runoff were actual measurements from the Watershed Authority of China’s Chaoan hydrological station between 1980 and 2010.

2.3. Simulation and Assessment of Water Source Nutrient Capacity

2.3.1. Construction and Evaluation of the Hydrological Model

In recent years, hydrological models have been widely used in studies on ecosystems’ WCAs [20]. In this study, hydrological processes in the Hanjiang watershed were simulated and assessed using the Soil and Water Assessment Tool (SWAT). This model can simulate the hydrological response of the watershed with high temporal resolution while also describing the spatial and temporal variability of the hydrological cycle [21]. Furthermore, the model integrates different land use patterns and underlying geological conditions. In eco-hydrological studies, the SWAT model has been widely used for the simulation of eco-hydrological processes, and it has provided accurate results [4,22]. Therefore, this model enabled us to simulate the hydrological processes in the Hanjiang watershed more accurately.
The raw data needed to be processed before the model could be constructed. Soil and land use types were reclassified to match the SWAT model database data types, and we used SPAW to calculate some soil parameters and SwatWeather to calculate meteorological data. After this was completed, the model had to be calibrated and validated to determine its suitability. Using SWAT-CUP, models can be calibrated and parameter sensitivity analyses can be performed [23]. Based on the monthly runoff data from important hydrological stations in the watershed from 1980 to 2010, the SUFI2 algorithm [24], which is the most widely used algorithm in this program, was used in this study to analyze parameter sensitivity and calibrate and validate the model. To assess the accuracy and simulation effectiveness of the models, the correlation coefficient (R2) and Nash–Sutcliffe efficiency coefficient (Ens) were used [25]. They were calculated as follows:
R 2 = [ i = 1 n ( Q O i Q O ¯ ) ( Q m i Q m ¯ ) ] 2 i = 1 n ( Q O i Q O ¯ ) 2 i = 1 n ( Q m i Q m ¯ ) 2
E n s = 1 i = 1 n ( Q m i Q O i ) 2 i = 1 n ( Q O i Q O ¯ )
where Q mi is the simulated runoff series; Q Oi is the measured runoff series; Q O ¯ is the arithmetic mean of the measured runoff series; Q m ¯ is the arithmetic mean of the simulated runoff series; n is the number of simulated periods.
Each of the hydrological models set up in this study showed R2 and Nash–Sutcliffe efficiency coefficients above 0.9, indicating satisfactory simulation performance under each scenario. A high R2 indicates a good correlation between the simulated and measured runoff. In light of this, this hydrological model presents a reasonable way of simulating hydrological processes in the Hanjiang watershed.

2.3.2. Calculation of WCA

A study of the water-content mechanism is based on the water balance principle. The WCA can be calculated accurately using this principle at all spatial and temporal scales, making it the most effective and widely used method. According to this principle, the difference between precipitation and evapotranspiration and other depletion is the WCA [26]:
WCA = P R E C i E i S U R Q i
where W C A indicates the water conservation amount per unit area of each ecosystem in the watershed (mm);   P R E C i indicates the rainfall in each ecosystem (mm); E i indicates the evapotranspiration in each ecosystem (mm); S U R Q i indicates the surface runoff generated by each ecosystem (mm).
Moreover, we used the relative rate of change to evaluate the change in the WCA. The relative rate of change of the WCA was calculated by the equation:
R e l a t i v e   c h a n g e   r a t e = ( WCA 2 WCA 1 ) WCA 1 × 100 %
where WCA1 and WCA2 are the water conservation amount in the previous and latter periods, respectively.

2.4. Driving Mechanisms of WCA Changes in a Changing Environment

2.4.1. Assessment of Land Use Change

a.
Land Use Transfer Matrix
It was necessary to assess the changes in land use to analyze the impact on the WCA. The Markov model can be used to study land use pattern change in a watershed. The equation is below:
S ( T ) = P i j + S ( T 0 )
where S ( T ) and S ( T 0 ) are the states of the land use structure at the moments T and T 0 , respectively; P i j is the state transfer matrix, which is given by:
P i j = [ P 11 P 1 n P n 1 P n n ]
where, 0 P i j < 1   and   j = 1 N P i j = 1 ( i , j = 1 , 2 , , n ) , n is the number of land use types.
b.
Land Use Level
The degree of land use not only reflects the natural properties of the land itself in land use but can also quantitatively express the comprehensive level of land use in a specific study area. The equation is below:
L a = 100 × i = 1 n A i × C i
where L a is the comprehensive index of land use degree; C i is the percentage of the graded area of land use degree at level i ; Ai is the graded index of land use degree at level i . Indicators of land use intensity are given to the graded land use index; unused land and hard-to-use land receive a graded index of 1; forest, grassland, and water areas receive a graded index of 2; arable, garden, and artificial grassland receive a graded index of 3; and settlements, industrial and mining areas, and transportation areas receive a graded index of 4.
c.
Land Use Dynamic Degree
An indicator of the single land use dynamic attitude reflects the rate and magnitude of change in different land use types over time, reflecting the impact of human activities on a single land use type. The equation is below:
K i = [ ( S i t 2 S i t 1 ) S i t 1 ] × 1 t × 100 %
where K i is the dynamic attitude of land use type i in the period from t 1 to t 2 ; S i t 1 and S i t 2 denote the area of land use type i at time t 1 and t 2 , respectively.
Furthermore, we used the integrated land use dynamic attitude to depict regional differences in land use type change and compare the integrated effects of human activity on land use type change over time in the watershed. The equation is below:
S = [ i = 1 n ( Δ S i j S i ) ] × 100 × 1 t × 100 %
where S is the integrated land use dynamic attitude of the study area corresponding to period t , Δ S i j is the total area of the conversion of land use type i to other land use types within each study period, S i is the total area of land use type i at the start time of monitoring; t is the period of land use change.

2.4.2. Analysis Methods of the Driving Mechanism

a.
Statistical Analysis Method
Multiple linear regression models can be used to establish the relationship between independent and dependent variables [27]. We used a multiple linear regression model to determine how climate change and land use change affected the WCA based on land use dynamics, precipitation, and evapotranspiration as independent variables (Table 1).
An analysis of the correlation can reveal the specific degree and direction of correlation between independent and dependent variables [28]. In this regard, we conducted a correlation analysis using Pearson correlation analysis for the independent variables in the regression model that were significantly correlated with the WCA after establishing a multiple linear regression model.
b.
Scenario analysis
A change in the WCA is influenced by climatic conditions and land use changes over a period of time. Assuming no changes in the climate conditions, a change in the WCA would be a result of land use change, and a scenario with this condition is called a land use change scenario. Similarly, if the land use types do not change, the WCA changes due to changes in the climate conditions; this is called a climate change scenario. When both the climate conditions and land use change, it is called a combined change scenario. Therefore, we set up eight scenarios to analyze the impact of climate change and land use change on the WCA. We present five scenarios, A to E, in this paper based on the land use data from 1980, 1990, 2000, 2010, and 2020 for analyzing land use change’s impacts. Scenarios F to G were used to analyze the impacts of climate change, and scenarios H to G were used to analyze the combined impacts of land use and climate change.

3. Results

3.1. Spatial Distribution Characteristics and Changes in the WCA of Major Ecosystems in the Hanjiang Watershed

Table 2 shows that the average WCA of the Hanjiang watershed is 288.32 mm, with forest ecosystems having an average WCA of 106.35 mm, agricultural ecosystems having an average WCA of 101.60 mm, and grasslands having an average WCA of 80.37 mm. Figure 2B shows that the forest ecosystem has the highest WCA in the dry season, while the grassland ecosystem has the lowest. The WCAs of all ecosystems decreased spatially from northeast to southwest. From 1980 to 2020, most of the sub-watersheds of each ecosystem showed a significant increase in WCA (Figure 2A). Grassland ecosystems showed the largest increase in WCA, and the average relative change rates of the WCA in both farmland and forest ecosystems were above 90%. There was a significant increase in the WCA in the upper reaches of the Mei River and the middle reaches of the Hanjiang River in terms of spatial distribution. Despite this, the spatial distribution pattern of the highest WCA in the northern part of the watershed remained the same. The wet season’s WCA in each ecosystem was significantly higher than that in the dry season, with forest ecosystems having the highest WCA and grassland ecosystems having the lowest (Figure 3B). The distribution characteristics of the WCA of each ecosystem differed from that of the dry season, as they were more southward and less northward. The WCA was unevenly distributed in agroecosystems and grassland ecosystems, showing large spatial differences (Figure 3A). During the period of 1980–2020 (scenarios H to G), the overall WCA of each ecosystem increased in the middle and upper reaches of the Ting River but decreased in the southern part. Additionally, WCA changes showed spatial heterogeneity, with grassland ecosystems showing the largest changes. Overall, from 1980 to 2020, there were no significant changes in the spatial distribution pattern of the WCA of each ecosystem, which still showed the characteristics of the highest in the southern part of the watershed and large spatial differences.
Combining the above analyses, it can be concluded that climate change and human activities affected the WCA of each ecosystem, with a large difference between the dry and wet seasons. During these two seasons, each ecosystem’s WCA showed roughly opposite trends. Human activities and climate change had a greater impact on the WCA of each ecosystem during the dry season. In addition, there were differences between the changes in the WCA of each ecosystem, with grassland ecosystems experiencing the biggest changes and the largest spatial differences in the WCA (Figure 2B and Figure 3B), indicating that the grassland ecosystem WCA is more sensitive to changes in the environment.

3.2. An Investigation of the Driving Mechanisms of Changes in the WCA of Major Ecosystems under Changing Environmental Conditions

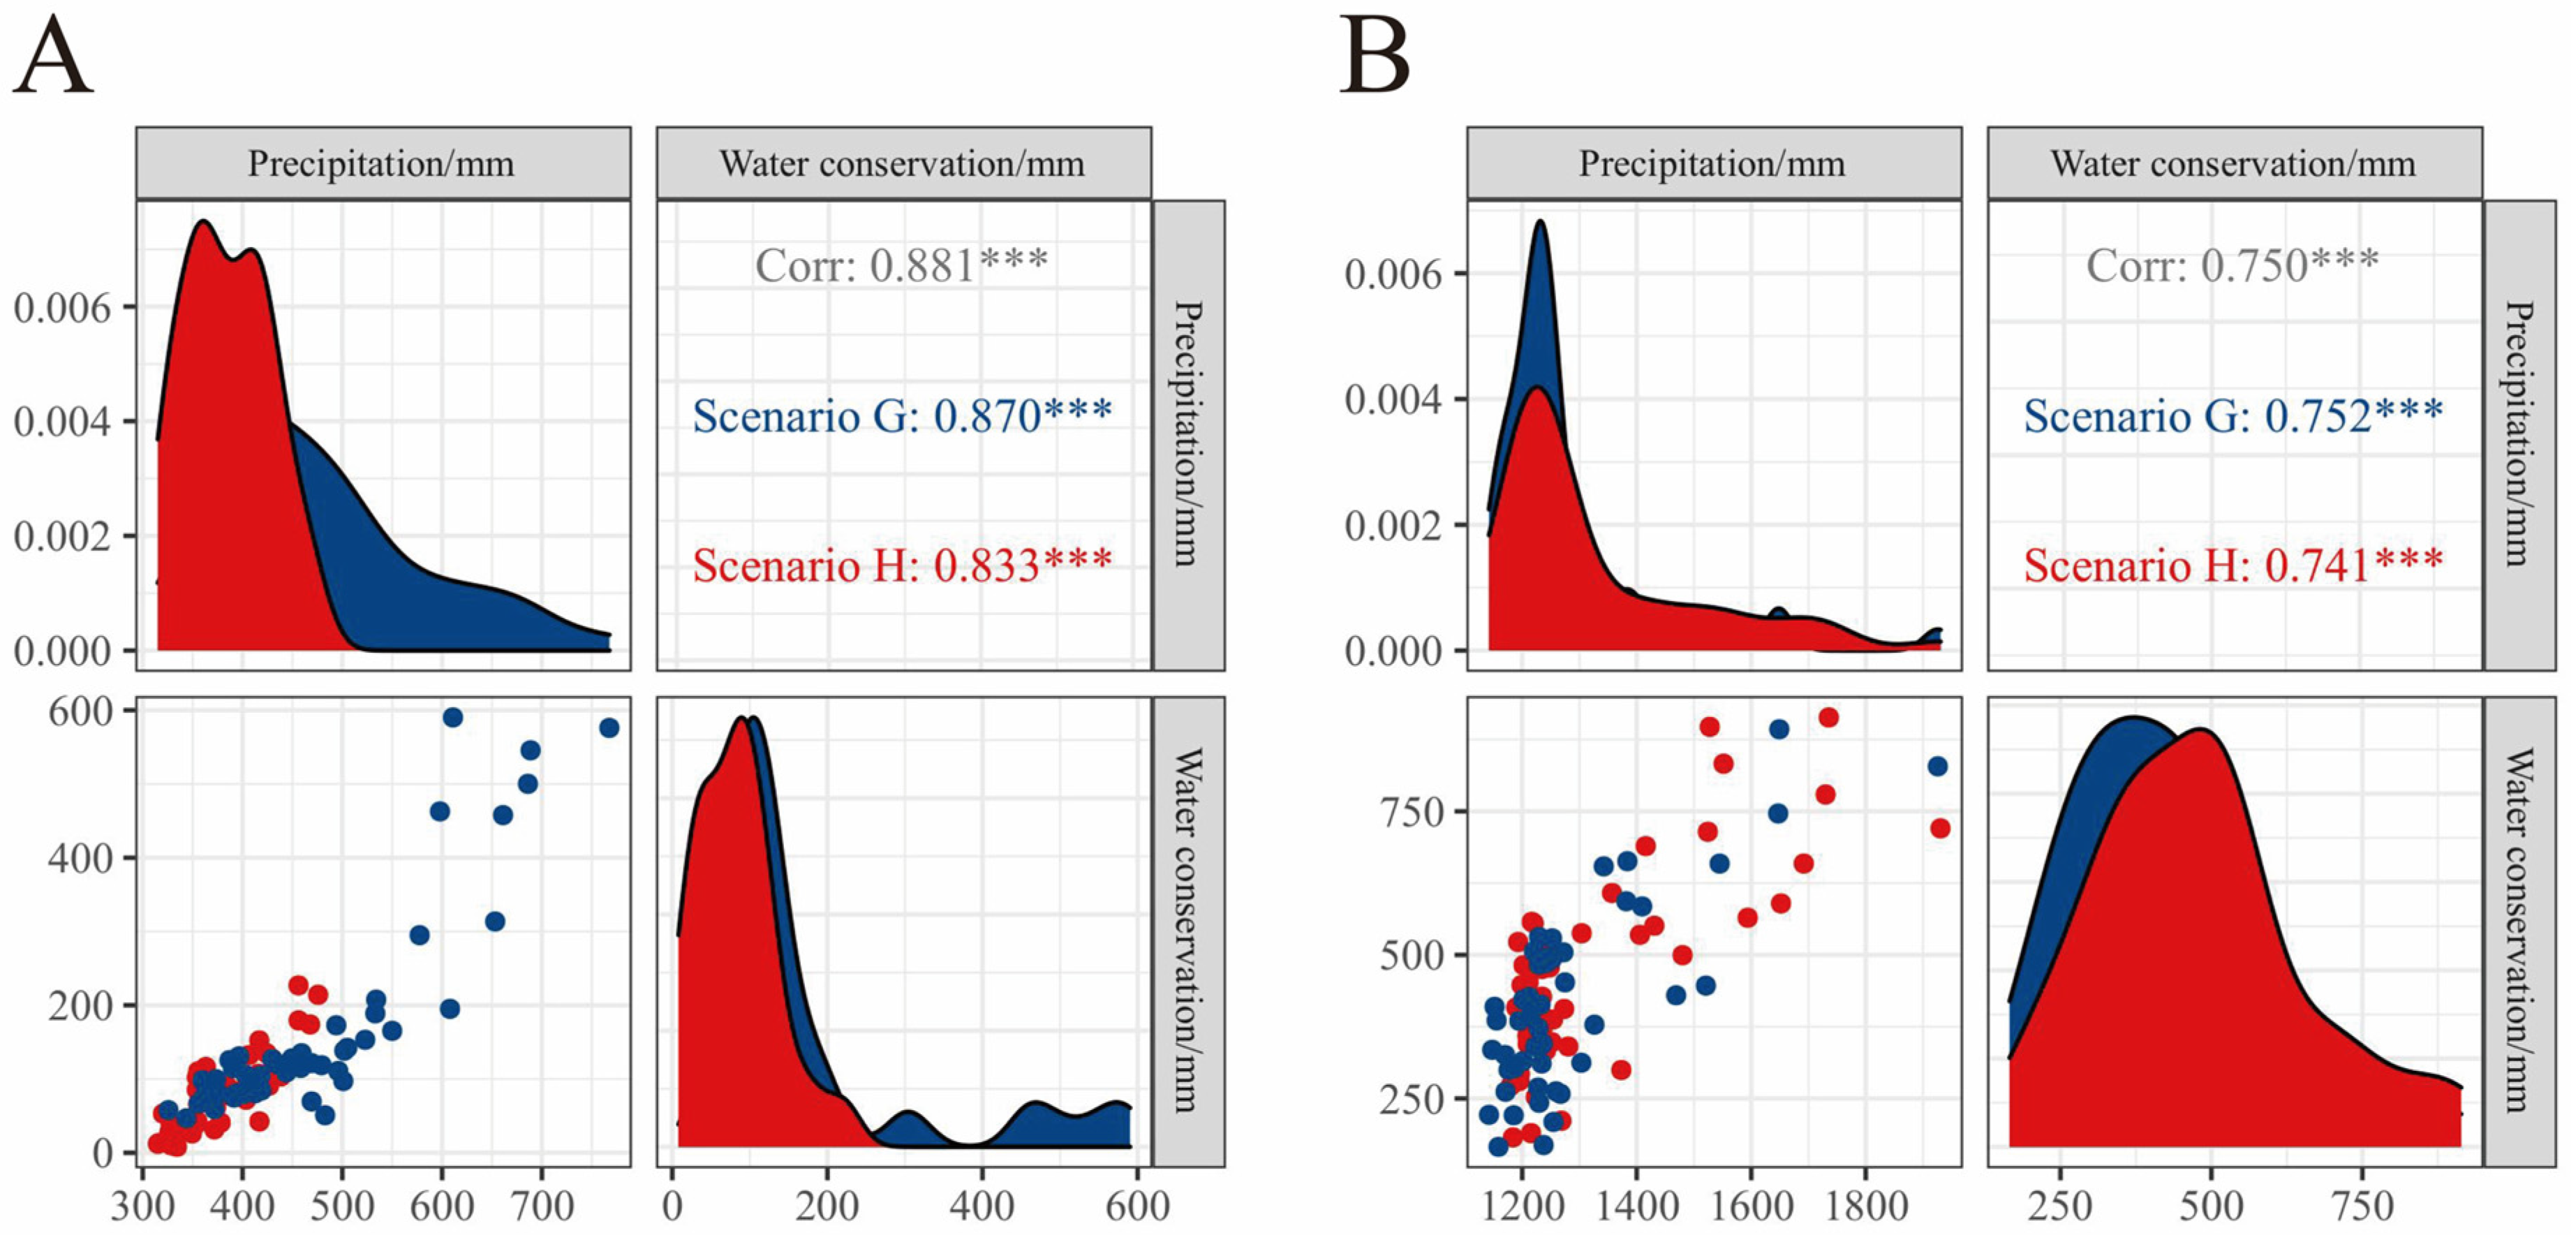
3.2.1. The Combined Impact of Land Use and Climate on WCA

According to the results of the multiple linear regression (Table 3), each driver contributed differently to the WCA. The WCA was most affected by precipitation and evapotranspiration, and precipitation had a significant driving effect at the 0.001 level, but their effect on the WCA was slightly smaller during the wet season. Land use had a lesser impact than climate. It is evident that the impact of the land use level increased every year from 1980 to 2020 when comparing the results of scenario H with those of scenario G, indicating that human activities gradually increased their impact, but this does not change the fact that precipitation was still the primary cause.
Due to precipitation’s influence on the WCA, we correlated precipitation under scenario H and scenario G with the WCA, as shown in Figure 4. According to Figure 4A, the correlation between rainfall and the WCA was higher during the dry season compared to Figure 4B. The WCA and rainfall were correlated in both seasons with an increasing trend.

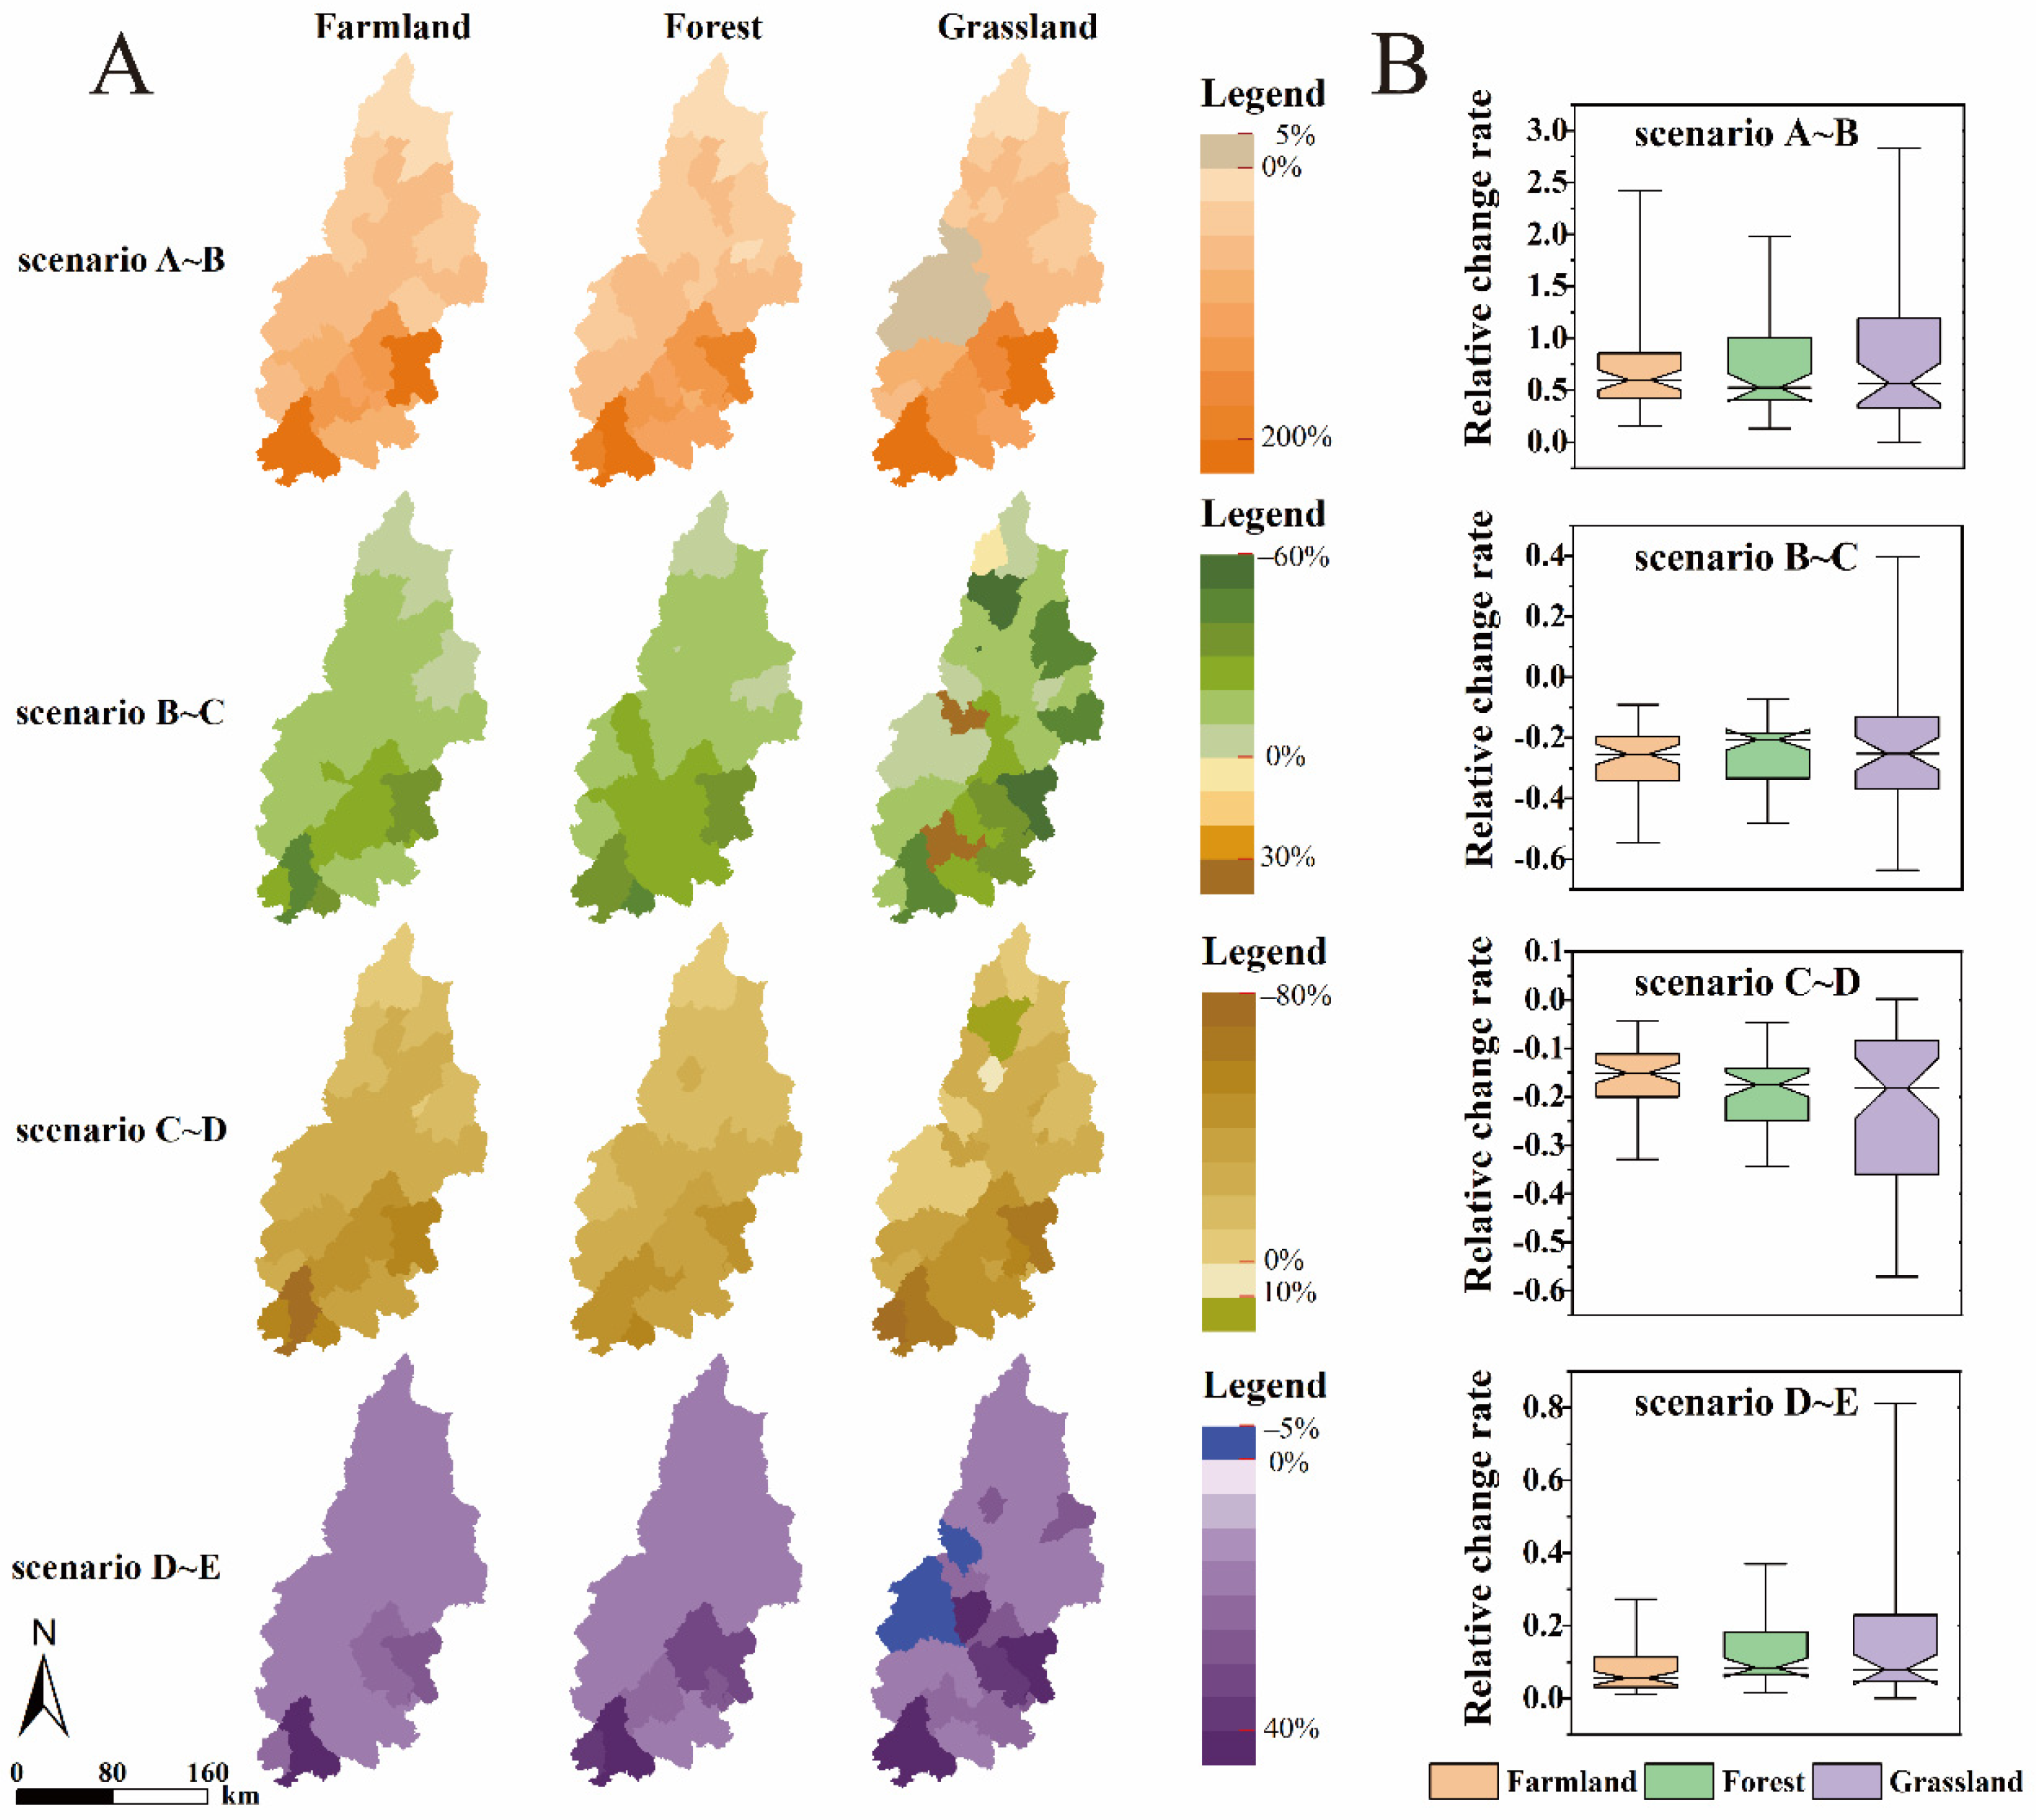
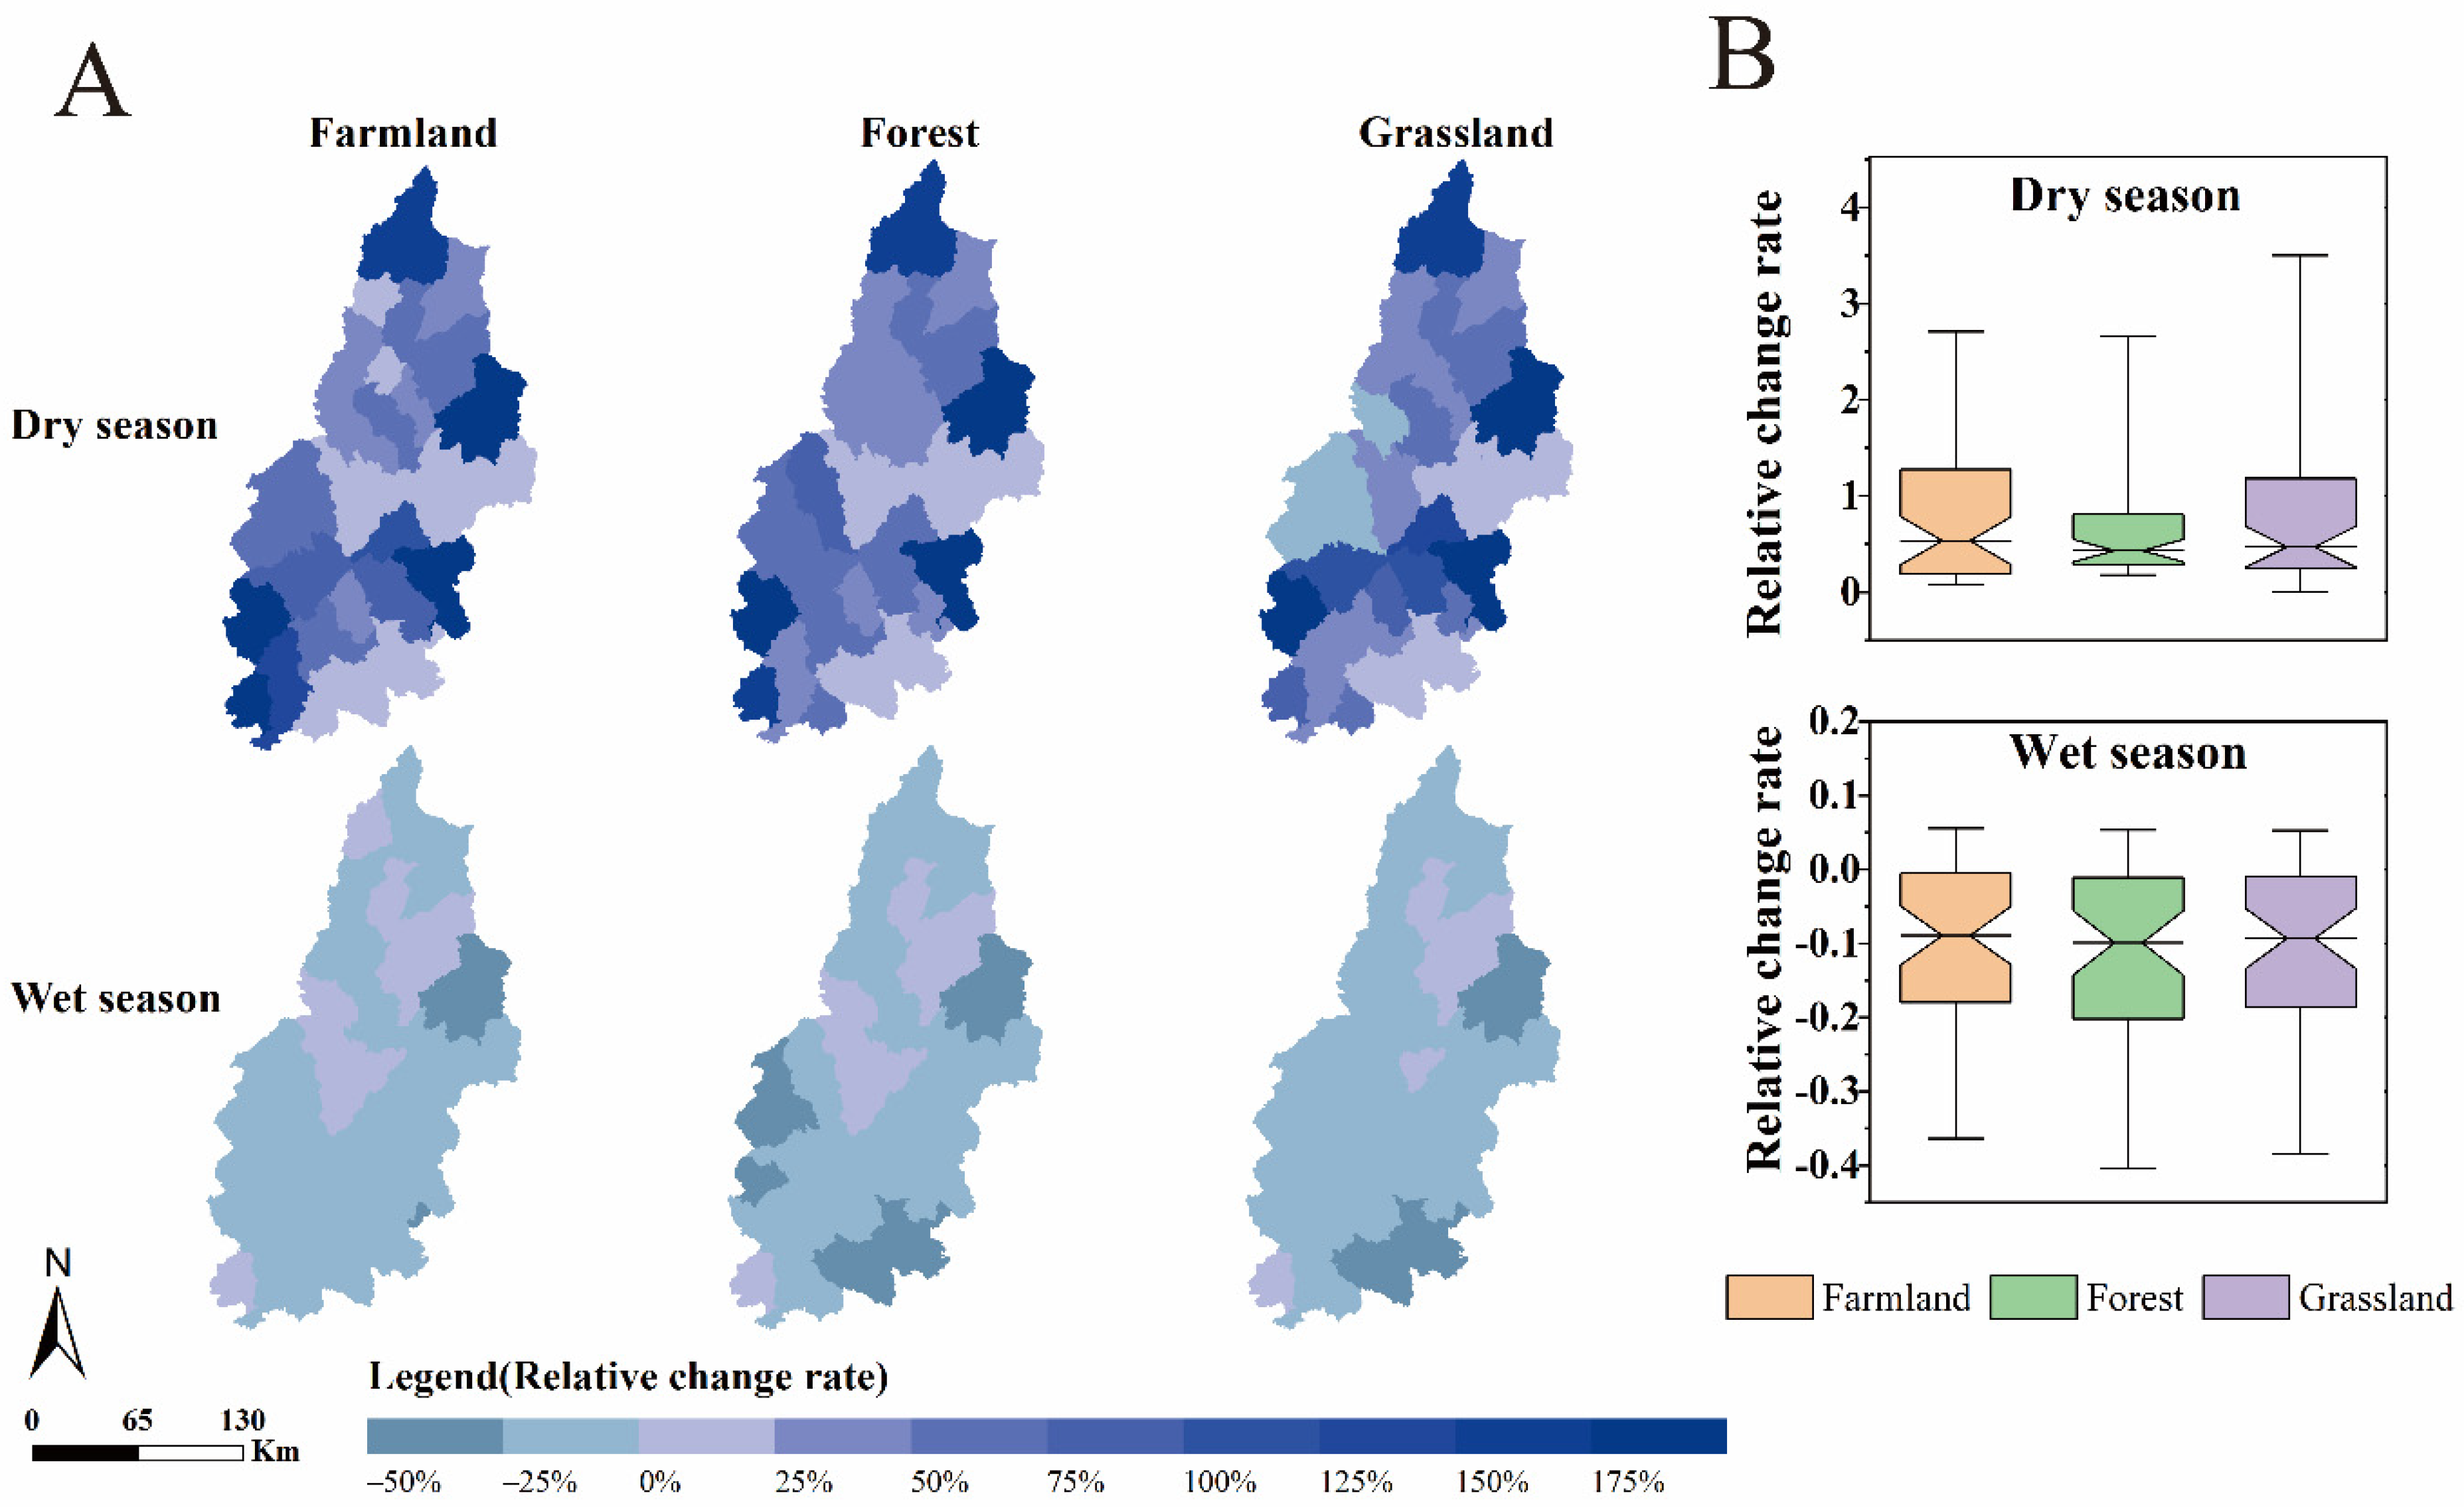
3.2.2. Impact of Land Use Change on WCA of Major Ecosystems

In Figure 5 and Figure 6, in most regions, the WCA of each ecosystem show an increasing trend from 1980 to 1990. In conjunction with Figure 7A, it can be seen that the land use type changed to a lesser extent during this period, and grassland and water body areas increased, which increased the WCA. There was an increase in the forest land area from 1990 to 2000, but there was an increase in the construction land area in the south and a decrease in the grassland area; therefore, the WCA still showed a decreasing trend in the whole watershed. From 2000 to 2010, the WCA of all ecosystems showed a decreasing trend throughout the year, except for a small increase in the WCA of the grassland ecosystems in the northern part of the watershed, which was associated with a significant decrease in the area of forest land during this period (Figure 7C). The WCA of each ecosystem generally increased from 2010 to 2020, except for a small decrease in some areas. Combined with Figure 7A,B, the change in the construction land area and the increase in the water area were related to this change in the watershed.
In conjunction with the above analysis, it can be concluded that human activities cause changes in the ecosystem WCA to some extent. As the focal area for urbanization, the southeastern part of the watershed experienced the greatest decrease in the WCA between 1990 and 2010. Figure 7B,C show that the proportion of decreased cultivated land and grassland in the watershed was relatively low between 1980 and 1990 and from 2010 to 2020. Thus, the WCA of each ecosystem shows an increasing trend from 1980 to 1990 and 2010 to 2020. In terms of the degree of the response of each ecosystem, the grassland ecosystem’s WCA responded most significantly to land use changes, as evidenced by the most significant spatial variation (Figure 5B and Figure 6B). Additionally, comparing the results of the two seasons revealed (Figure 5 and Figure 6) that the trends of the WCA changes in each ecosystem were approximately the same in both seasons, but the magnitudes of the changes differed. In the dry season, land use changes had a greater effect on the WCA than in the wet season, and the spatial variation of this effect was also more significant.

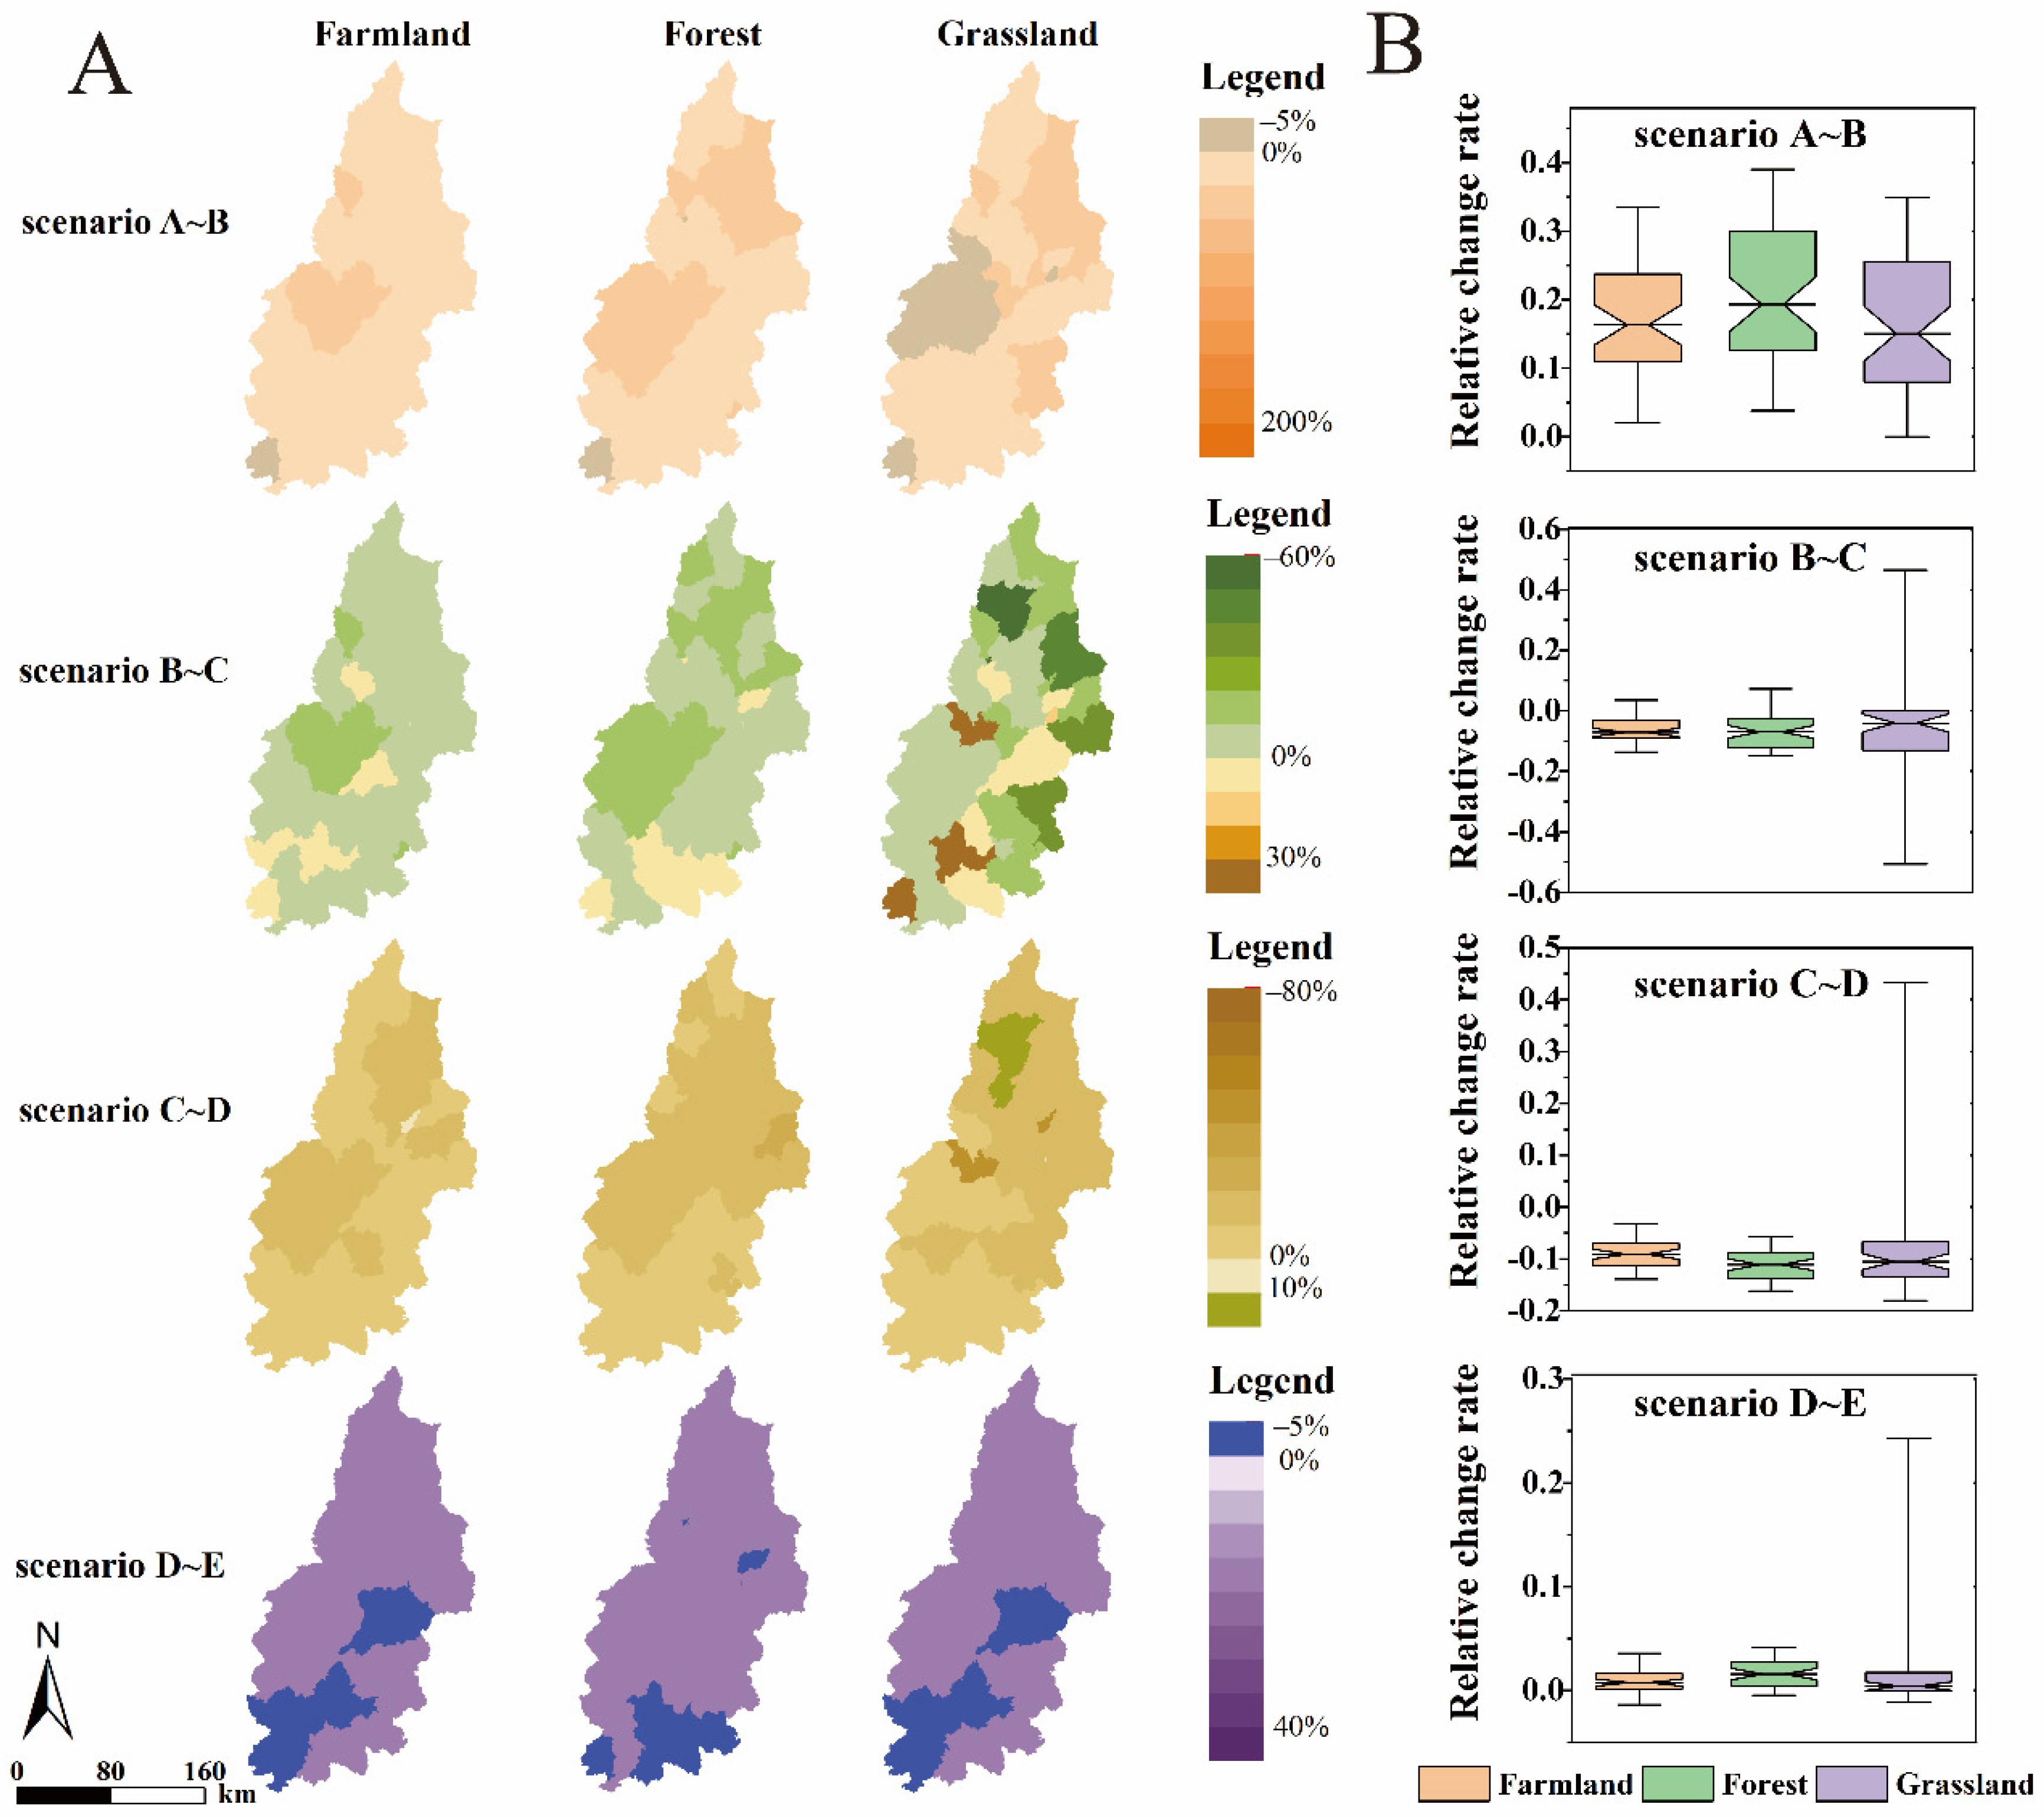
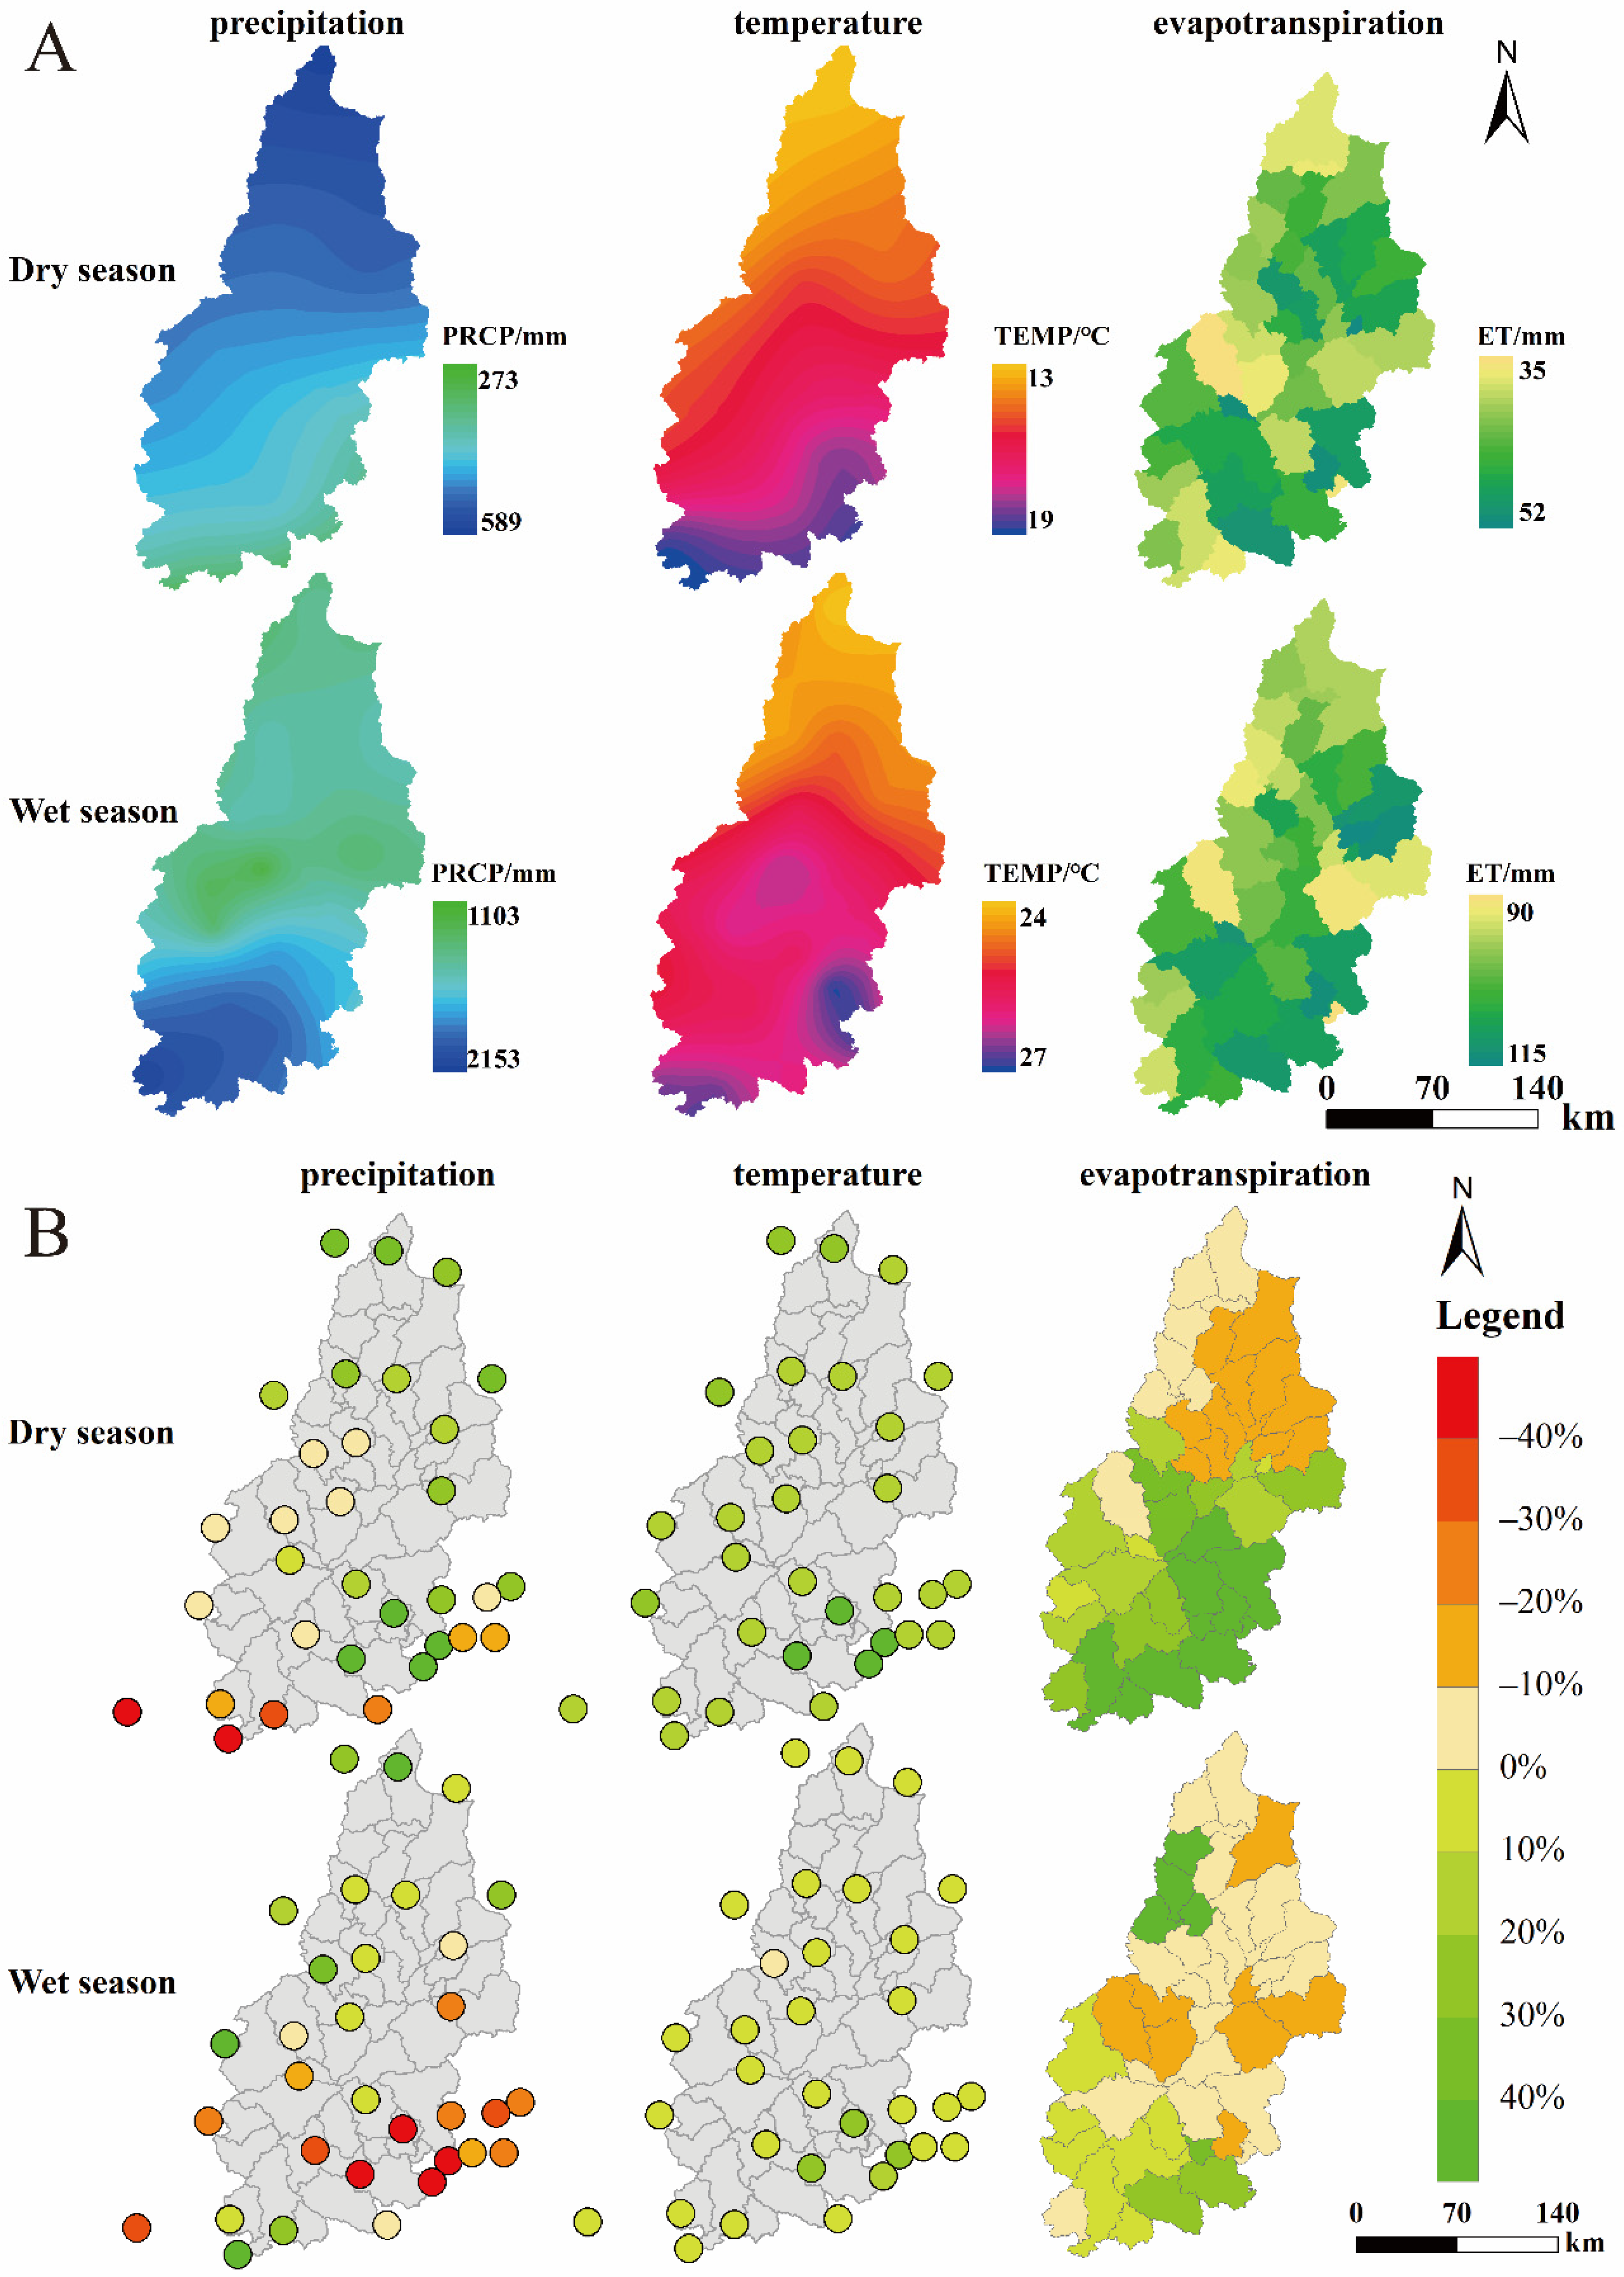
3.2.3. Impact of Climate Change on WCA of Major Ecosystems

Comparing Figure 2 and Figure 3 with Figure 8A, the WCA spatial distributions in the watershed were related to the precipitation and evapotranspiration spatial distributions. Throughout the year, the temperature in the watershed increased, but in the dry season, precipitation was higher and evapotranspiration was lower in the northern part of the watershed, so the WCA was highest in each ecosystem there. While evapotranspiration was greater in the southern part of the watershed during the wet season, precipitation was greater in other areas, and therefore, the WCA was higher. As a result, precipitation and evapotranspiration played a major role in determining the distribution pattern of the WCA within the watershed ecosystem.
The changes in the WCA of each ecosystem under climate change differed between the dry and wet seasons, as shown in Figure 9. Combined with Figure 8B, it is obvious that during the dry season, evapotranspiration increased in some parts of the watershed, while more than half of the meteorological stations observed an increase in precipitation, so most ecosystems showed significant increases in their WCAs. Evapotranspiration decreased in most parts of the watershed during the wet season, but precipitation decreased significantly, so the WCA of each ecosystem mostly decreased during the wet season. Overall, the impact of climate change on the WCA of each ecosystem was most pronounced during the dry season, while there was significant spatial variation in this impact (Figure 9B).

4. Discussion

One of the most important functions of ecosystems is the provision of water. The water-bearing function of each ecosystem is affected by current human activities and climate change. This article examines the spatial and temporal distribution patterns and driving mechanisms of the WCA in a variety of ecosystems under changing environmental conditions using hydrological models. According to our analysis of the spatial distribution characteristics of WCA, differences in precipitation may contribute to some extent to the differences in the spatial distribution of the WCA [29,30]. Figure 8A shows that areas with more precipitation displayed higher WCAs in both seasons, whereas there was no significant spatial variation in evapotranspiration. In addition, land use changes in some parts of the watershed from 1980 to 2020 were higher, but the spatial distribution pattern of the WCA in each ecosystem in the watershed did not show significant changes, suggesting that land use changes in the watershed in the last 50 years had a small impact on the spatial distribution of the WCA. We also found that climatic conditions had a greater influence than land use in our multiple linear regression analysis.
Regarding the effects of human activities on ecosystems’ WCAs, land use changes are thought to be the most significant factor [16,31]. We found that land use changes had a significant impact on the WCAs, depending on their type and intensity. It has been shown that changes in land use type affect hydrological processes such as infiltration and runoff [32,33], which in turn affects water availability. Conversion between different land use types impacts WCAs differently, resulting in spatial differences in WCA changes according to the impact mechanisms of the land use type changes. As a result of urbanization, the original natural or semi-natural land use/cover is replaced with a high number of hardened surfaces, which prevent surface water from infiltrating into the ground, thereby reducing water retention. Afforestation, on the other hand, increases vegetation cover, which increases the capacity of the plant canopy layer and plant litter to intercept precipitation, and increases water infiltration, which results in increased water retention [32]. In terms of the intensity of land use change, different land use scenarios lead to significant differences in the WCA, suggesting that land use impacts on ecosystem hydrological services are related to land use intensity [34]. The intensity of land use alters three ecosystem characteristics that are closely related to hydrological services, namely canopy density, plant litter, and root density [35], as well as changing ecosystem biodiversity and functional richness [11,36], which indirectly affect ecosystem hydrological services. Consequently, to create a virtuous cycle between society, ecosystems, and the economy, humans need to optimize land use to protect and maintain their hydrological services.
In terms of the mechanisms of climate change’s impact on WCAs, researchers showed that precipitation and evapotranspiration drive the hydrological cycle [37]. Climate change plays a significant role in changing water availability [38]. In this study, precipitation was positively correlated with water availability, whereas evapotranspiration, which is determined by ambient temperature, humidity, and wind, was negatively correlated with water availability [26,29,30]. These findings were also confirmed in South China [39].
Under the two driving effects, we found that the WCAs responded differently in the two seasons. On seasonal time scales, different soil properties and vegetation types affect hydrological processes’ response to changing environments [40]. The northern part of the watershed is mostly woodland and grassland with high vegetation cover, good soil structure, and high water conservation function [41]. During the wet season, rains in the northern part of the watershed enrich groundwater storage. As a consequence, this groundwater replenishes runoff and improves soil moisture conditions in the dry season [20,42]. According to Figure 8B, precipitation and evapotranspiration changes within the watershed had greater magnitude and spatial variation in the dry season, leading to greater spatial variation in the driving effect of climate change on the WCA in the dry season. Overall, there were significant spatial differences in the response of the watershed’s WCA under changing environments during the dry season, and differences in the underlying surface type and local climate change are the main reasons for such differences [15].
In terms of the WCA of the ecosystem, the three ecosystems differ greatly. As opposed to agricultural and grassland ecosystems, forest ecosystems have three layers that interact with rainfall: the canopy, the litter horizon, and the soil layer. Infiltration and the water storage capacity can be improved by these three layers, thereby buffering and storing rainfall, impounding soil water, regulating river runoff, and purifying water quality [43,44,45]. As a result, forest ecosystems have the highest water conservation capacity, as well as the highest water conservation amount. As grassland ecosystems are more sensitive to land use change, the large changes in grassland area between 1980 and 2020 and the regional dispersion involved resulted in greater landscape fragmentation, which led to spatial heterogeneity in the ecosystem’s spatial patterns and ecological processes [46]. Hence, the changes in the WCA of the grassland ecosystems had the greatest spatial variation (Figure 5B and Figure 6B).
Lastly, this study investigated the spatial and temporal evolution of the WCA of major ecosystems in the Hanjiang watershed, filling the gaps in existing studies by investigating the driving mechanisms of changing environmental conditions. However, there are some shortcomings in this paper as well. First, due to the number and spatial locations of hydrological stations, there are uncertainties in the simulation of the hydrological model. In the next step, we can consider using more hydrological stations to improve the model accuracy and simulate the hydrological processes in the basin more accurately. Second, vegetation, soil, and climate interact in complex ways during eco-hydrological processes in changing environments. We did not consider the effects of specific forest community types, forest age, and soil properties on the WCA; therefore, to clarify the intricate relationship between the changing environments and hydrological ecosystem services in a watershed, future research needs to consider the effects of various factors on the WCA function of ecosystems.

5. Conclusions

To reveal the eco-hydrological processes under the changing environment, this study was based on the distributed hydrological model (SWAT) and used the water conservation amount (WCA) as an indicator to assess the water content capacity of ecosystems. Scenario analysis and statistical analysis were also used to determine the spatial and temporal evolution of the WCAs of farmland, forest, and grassland ecosystems under a changing environment and to further investigate the influence mechanisms of land use change and climate change on the WCA. The results show that:
(1) The average WCA of the Hanjiang watershed is about 288.32 mm, whereas the average WCAs of the farmland, forest, and grassland ecosystems are about 101.60 mm, 106.34 mm, and 80.39 mm, respectively.
(2) Climate conditions determine the distribution pattern of ecosystems’ WCAs, and the spatial distribution pattern of the WCA in each ecosystem differed significantly between the two seasons. The WCA spatial distribution patterns did not change significantly as a result of land use change and climate change combined.
(3) Land use changes caused by construction and forest were the main factors affecting the WCAs in different ecosystems. Changes in ecosystems’ WCAs were driven by climate change patterns dominated by precipitation and influenced by evapotranspiration. The WCA also responded differently under changing environments during the dry season due to differences in the underlying surface type and local climate change.
(4) There was variation in the distribution of the WCAs among the three ecosystems and their responses to changing environments. Forest ecosystems had the highest WCA, while grassland ecosystems were the most sensitive to changes in land use.
Typical watersheds in subtropical China’s hilly regions are affected by natural conditions as well as frequent human activities, resulting in complex and variable eco-hydrological processes. In our study, we found that land use changes affected the WCA spatially, while climatic conditions determined its spatial distribution. Overall, climate change had a greater impact than land use change. These results have important theoretical implications for the planning and management of water resources and ecological restoration of subtropical watersheds in China. In the context of global change, our study is also an important case study of eco-hydrological processes in watersheds.

Author Contributions

Conceptualization, Y.L. and M.K.; methodology, Y.L. and J.D.; software, Y.L. and M.K.; validation, Y.L., M.K. and J.D.; formal analysis, Y.L. and J.D.; investigation, Y.L. and J.D.; resources, Y.L. and M.K.; data curation, M.K.; writing—original draft preparation, Y.L. and M.K.; writing—review and editing, Y.L. and J.D.; visualization, J.D. and M.K.; supervision, C.Z.; project administration, Y.L. and J.D.; funding acquisition, C.Z. All authors have read and agreed to the published version of the manuscript.

Funding

This research was funded by the FORESTRY ECOLOGICAL MONITORING NETWORK PLATFORM CONSTRUCTION (No. 2021-KYXM-09; 2021-KYXM-09-001) and the GUANGDONG NATURAL SCIENCE FOUNDATION (No. 2019A1515011627).

Data Availability Statement

Not applicable.

Acknowledgments

We thank the Field Scientific Observation and Research Station of Hanjiang River in Guangdong province; we also thank our other colleagues’ valuable comments and suggestions that have helped improve the manuscript.

Conflicts of Interest

The authors declare no conflict of interest.

References

  1. Costanza, R.; d’Arge, R.; De Groot, R.; Farber, S.; Grasso, M.; Hannon, B.; Limburg, K.; Naeem, S.; O’neill, R.V.; Paruelo, J. The value of the world’s ecosystem services and natural capital. Nature 1997, 387, 253–260. [Google Scholar] [CrossRef]
  2. Long, C.; Gaodi, X.; Changshun, Z.; Sha, P.; Na, F.; Liqiang, G.; Caixia, Z. Modelling ecosystem water supply services across the Lancang River Basin. J. Resour. Ecol. 2011, 2, 322–327. [Google Scholar] [CrossRef]
  3. Hu, W.; Li, G.; Gao, Z.; Jia, G.; Wang, Z.; Li, Y. Assessment of the impact of the Poplar Ecological Retreat Project on water conservation in the Dongting Lake wetland region using the InVEST model. Sci. Total Environ. 2020, 733, 139423. [Google Scholar] [CrossRef] [PubMed]
  4. Dennedy-Frank, P.J.; Muenich, R.L.; Chaubey, I.; Ziv, G. Comparing two tools for ecosystem service assessments regarding water resources decisions. J. Environ. Manag. 2016, 177, 331–340. [Google Scholar] [CrossRef] [PubMed] [Green Version]
  5. Xiao, Q.; Hu, D.; Xiao, Y. Assessing changes in soil conservation ecosystem services and causal factors in the Three Gorges Reservoir region of China. J. Clean. Prod. 2017, 163, S172–S180. [Google Scholar] [CrossRef]
  6. Schroter, D.; Cramer, W.; Leemans, R.; Prentice, I.C.; Araujo, M.B.; Arnell, N.W.; Bondeau, A.; Bugmann, H.; Carter, T.R.; Gracia, C.A.; et al. Ecosystem service supply and vulnerability to global change in Europe. Science 2005, 310, 1333–1337. [Google Scholar] [CrossRef] [Green Version]
  7. Carpenter, S.R.; Mooney, H.A.; Agard, J.; Capistrano, D.; DeFries, R.S.; Díaz, S.; Dietz, T.; Duraiappah, A.K.; Oteng-Yeboah, A.; Pereira, H.M. Science for managing ecosystem services: Beyond the Millennium Ecosystem Assessment. Proc. Natl. Acad. Sci. USA 2009, 106, 1305–1312. [Google Scholar] [CrossRef] [Green Version]
  8. Hoyer, R.; Chang, H. Assessment of freshwater ecosystem services in the Tualatin and Yamhill basins under climate change and urbanization. Appl. Geogr. 2014, 53, 402–416. [Google Scholar] [CrossRef]
  9. Xu, F.; Zhao, L.; Jia, Y.; Niu, C.; Liu, X.; Liu, H. Evaluation of water conservation function of Beijiang River basin in Nanling Mountains, China, based on WEP-L model. Ecol. Indic. 2022, 134, 108383. [Google Scholar] [CrossRef]
  10. Foley, J.A.; Defries, R.; Asner, G.P.; Barford, C.; Bonan, G.; Carpenter, S.R.; Chapin, F.S.; Coe, M.T.; Daily, G.C.; Gibbs, H.K.; et al. Global consequences of land use. Science 2005, 309, 570–574. [Google Scholar] [CrossRef]
  11. Chillo, V.; Vázquez, D.P.; Amoroso, M.M.; Bennett, E.M.; Koricheva, J. Land-use intensity indirectly affects ecosystem services mainly through plant functional identity in a temperate forest. Funct. Ecol. 2018, 32, 1390–1399. [Google Scholar] [CrossRef] [Green Version]
  12. Bai, Y.; Ochuodho, T.O.; Yang, J. Impact of land use and climate change on water-related ecosystem services in Kentucky, USA. Ecol. Indic. 2019, 102, 51–64. [Google Scholar] [CrossRef]
  13. Ouyang, Z.; Zheng, H.; Xiao, Y.; Polasky, S.; Liu, J.; Xu, W.; Wang, Q.; Zhang, L.; Xiao, Y.; Rao, E. Improvements in ecosystem services from investments in natural capital. Science 2016, 352, 1455–1459. [Google Scholar] [CrossRef] [PubMed]
  14. Duan, K.; Sun, G.; Sun, S.; Caldwell, P.V.; Cohen, E.C.; McNulty, S.G.; Aldridge, H.D.; Zhang, Y. Divergence of ecosystem services in U.S. National Forests and Grasslands under a changing climate. Sci. Rep. 2016, 6, 24441. [Google Scholar] [CrossRef] [PubMed] [Green Version]
  15. Sun, G.; Caldwell, P.V.; McNulty, S.G. Modelling the potential role of forest thinning in maintaining water supplies under a changing climate across the conterminous United States. Hydrol. Process. 2015, 29, 5016–5030. [Google Scholar] [CrossRef]
  16. Wang, J.; Wu, T.; Li, Q.; Wang, S. Quantifying the effect of environmental drivers on water conservation variation in the eastern Loess Plateau, China. Ecol. Indic. 2021, 125, 107493. [Google Scholar] [CrossRef]
  17. Xu, J.; Xie, G.; Xiao, Y.; Li, N.; Yu, F.; Pei, S.; Jiang, Y. Dynamic Analysis of Ecological Environment Quality Combined with Water Conservation Changes in National Key Ecological Function Areas in China. Sustainability 2018, 10, 1202. [Google Scholar] [CrossRef] [Green Version]
  18. Li, Z.; Huang, B.; Qiu, J.; Cai, Y.; Yang, Z.; Chen, S. Analysis on evolution characteristics of ecological flow of Hanjiang River under changing environment. Water Resour. Prot 2021, 37, 22–29. [Google Scholar] [CrossRef]
  19. Li, Y.; Deng, J.; Zang, C.; Kong, M.; Zhao, J. Spatial and temporal evolution characteristics of water resources in the Hanjiang River Basin of China over 50 years under a changing environment. Front. Environ. Sci. 2022, 10, 1377. [Google Scholar] [CrossRef]
  20. Li, M.; Liang, D.; Xia, J.; Song, J.; Cheng, D.; Wu, J.; Cao, Y.; Sun, H.; Li, Q. Evaluation of water conservation function of Danjiang River Basin in Qinling Mountains, China based on InVEST model. J. Environ. Manag. 2021, 286, 112212. [Google Scholar] [CrossRef]
  21. Arnold, J.G.; Srinivasan, R.; Muttiah, R.S.; Williams, J.R. Large area hydrologic modeling and assessment part I: Model devel-opment 1. JAWRA J. Am. Water Resour. Assoc. 1998, 34, 73–89. [Google Scholar] [CrossRef]
  22. Cong, W.; Sun, X.; Guo, H.; Shan, R. Comparison of the SWAT and InVEST models to determine hydrological ecosystem service spatial patterns, priorities and trade-offs in a complex basin. Ecol. Indic. 2020, 112, 106089. [Google Scholar] [CrossRef]
  23. Arnold, J.G.; Moriasi, D.N.; Gassman, P.W.; Abbaspour, K.C.; White, M.J.; Srinivasan, R.; Santhi, C.; Harmel, R.; Van Griensven, A.; Van Liew, M.W. SWAT: Model use, calibration, and validation. Trans. ASABE 2012, 55, 1491–1508. [Google Scholar] [CrossRef]
  24. Yang, J.; Reichert, P.; Abbaspour, K.C.; Xia, J.; Yang, H. Comparing uncertainty analysis techniques for a SWAT application to the Chaohe Basin in China. J. Hydrol. 2008, 358, 1–23. [Google Scholar] [CrossRef]
  25. Knoben, W.J.M.; Freer, J.E.; Woods, R.A. Technical note: Inherent benchmark or not? Comparing Nash–Sutcliffe and Kling–Gupta efficiency scores. Hydrol. Earth Syst. Sci. 2019, 23, 4323–4331. [Google Scholar] [CrossRef] [Green Version]
  26. Zhai, R.; Tao, F.; Xu, Z. Spatial–temporal changes in runoff and terrestrial ecosystem water retention under 1.5 and 2 °C warming scenarios across China. Earth Syst. Dyn. 2018, 9, 717–738. [Google Scholar] [CrossRef] [Green Version]
  27. Lu, X.; Zang, C.; Burenina, T. Study on the variation in evapotranspiration in different period of the Genhe River Basin in China. Phys. Chem. Earth Parts A/B/C 2020, 120, 102902. [Google Scholar] [CrossRef]
  28. Senthilnathan, S. Usefulness of Correlation Analysis. 2019. Available online: https://doi.org/10.2139/ssrn.3416918 (accessed on 5 December 2022).
  29. Wu, X.; Shi, W.; Guo, B.; Tao, F. Large spatial variations in the distributions of and factors affecting forest water retention capacity in China. Ecol. Indic. 2020, 113, 106152. [Google Scholar] [CrossRef]
  30. Yin, L.; Tao, F.; Zhai, R.; Chen, Y.; Hu, J.; Wang, Z.; Fu, B. Impacts of Future Climate Change and Atmospheric CO2 Concen-tration on Ecosystem Water Retention Service. Earth’s Future 2022, 10, e2021EF002138. [Google Scholar] [CrossRef]
  31. Zhang, Z.; Xia, F.; Yang, D.; Huo, J.; Wang, G.; Chen, H. Spatiotemporal characteristics in ecosystem service value and its interaction with human activities in Xinjiang, China. Ecol. Indic. 2020, 110, 105826. [Google Scholar] [CrossRef]
  32. Brown, A.E.; Zhang, L.; McMahon, T.A.; Western, A.W.; Vertessy, R.A. A review of paired catchment studies for determining changes in water yield resulting from alterations in vegetation. J. Hydrol. 2005, 310, 28–61. [Google Scholar] [CrossRef]
  33. Zang, C.; Liu, J. Trend analysis for the flows of green and blue water in the Heihe River basin, northwestern China. J. Hydrol. 2013, 502, 27–36. [Google Scholar] [CrossRef]
  34. Bolund, P.; Hunhammar, S. Ecosystem services in urban areas. Ecol. Econ. 1999, 29, 293–301. [Google Scholar] [CrossRef]
  35. Wen, Z.; Zheng, H.; Smith, J.R.; Zhao, H.; Liu, L.; Ouyang, Z. Functional diversity overrides community-weighted mean traits in linking land-use intensity to hydrological ecosystem services. Sci. Total Environ. 2019, 682, 583–590. [Google Scholar] [CrossRef]
  36. Felipe-Lucia, M.R.; Soliveres, S.; Penone, C.; Fischer, M.; Ammer, C.; Boch, S.; Boeddinghaus, R.S.; Bonkowski, M.; Buscot, F.; Fiore-Donno, A.M.; et al. Land-use intensity alters networks between biodiversity, ecosystem functions, and services. Proc. Natl. Acad. Sci. USA 2020, 117, 28140–28149. [Google Scholar] [CrossRef]
  37. Mendoza, K.; Mehta, V.M.; Daggupati, P.; Srinivasan, R.; Rosenberg, N.J.; Deb, D. High-Resolution Simulations of Decadal Climate Variability Impacts on Water Yield in the Missouri River Basin with the Soil and Water Assessment Tool (SWAT). J. Hydrometeorol. 2016, 17, 2455–2476. [Google Scholar] [CrossRef]
  38. Aznarez, C.; Jimeno-Sáez, P.; López-Ballesteros, A.; Pacheco, J.P.; Senent-Aparicio, J. Analysing the Impact of Climate Change on Hydrological Ecosystem Services in Laguna del Sauce (Uruguay) Using the SWAT Model and Remote Sensing Data. Remote Sens. 2021, 13, 2014. [Google Scholar] [CrossRef]
  39. Yang, D.; Liu, W.; Tang, L.; Chen, L.; Li, X.; Xu, X. Estimation of water provision service for monsoon catchments of South China: Applicability of the InVEST model. Landsc. Urban Plan. 2019, 182, 133–143. [Google Scholar] [CrossRef]
  40. Zhang, L.; Dawes, W.R.; Walker, G.R. Response of mean annual evapotranspiration to vegetation changes at catchment scale. Water Resour. Res. 2001, 37, 701–708. [Google Scholar] [CrossRef]
  41. Bruijnzeel, L.A. Hydrological functions of tropical forests: Not seeing the soil for the trees? Agric. Ecosyst. Environ. 2004, 104, 185–228. [Google Scholar] [CrossRef]
  42. Peña-Arancibia, J.L.; Bruijnzeel, L.A.; Mulligan, M.; van Dijk, A.I.J.M. Forests as ‘sponges’ and ‘pumps’: Assessing the impact of deforestation on dry-season flows across the tropics. J. Hydrol. 2019, 574, 946–963. [Google Scholar] [CrossRef]
  43. Jackson, R.B.; Jobbagy, E.G.; Avissar, R.; Roy, S.B.; Barrett, D.J.; Cook, C.W.; Farley, K.A.; le Maitre, D.C.; McCarl, B.A.; Murray, B.C. Trading water for carbon with biological carbon sequestration. Science 2005, 310, 1944–1947. [Google Scholar] [CrossRef] [Green Version]
  44. Piao, S.; Friedlingstein, P.; Ciais, P.; de Noblet-Ducoudré, N.; Labat, D.; Zaehle, S. Changes in climate and land use have a larger direct impact than rising CO2 on global river runoff trends. Proc. Natl. Acad. Sci. USA 2007, 104, 15242–15247. [Google Scholar] [CrossRef] [PubMed] [Green Version]
  45. Zang, C.; Wu, M.; Zhang, J.; Yue, Y. Research on the chemical element transport characteristics of the larch forest ecosystem of Greater Xing’an Mountain in China. Phys. Chem. Earth Parts A/B/C 2020, 120, 102919. [Google Scholar] [CrossRef]
  46. Pickett, S.T.; Cadenasso, M.L. Landscape ecology: Spatial heterogeneity in ecological systems. Science 1995, 269, 331–334. [Google Scholar] [CrossRef] [PubMed]
Figure 1. The location and distribution of meteorological and hydrological stations of the Hanjiang watershed.
Forests 14 00093 g001
Figure 2. The spatial and temporal distribution of the WCA (mm) in each ecosystem during the dry season (A) versus relative changes (B).
Forests 14 00093 g002
Figure 3. The spatial and temporal distribution of the WCA (mm) in each ecosystem during the wet season (A) versus relative changes (B).
Forests 14 00093 g003
Figure 4. An analysis of rainfall and WCA for scenarios H and G for the watershed. (A) Dry season; (B) wet season. Note: *** indicates significance at the α = 0.001 level.
Forests 14 00093 g004
Figure 5. Relative change in WCA of each ecosystem under land use change scenarios (dry season). (A) Spatial distribution of WCA evolution for each ecosystem; (B) relative rate of change in WCA for each ecosystem.
Forests 14 00093 g005
Figure 6. Relative change in WCA of each ecosystem under land use change scenarios (wet season). (A) Spatial distribution of WCA evolution for each ecosystem; (B) relative rate of change in WCA for each ecosystem.
Forests 14 00093 g006
Figure 7. Land use changes in the watershed under the land use change scenario. (A) The percentage change matrix for each land use type; (B) the distribution and average of dynamic attitudes for each land use type; (C) the area of change for each land use type. Note: CL represents cultivated land; FL represents forest; GL represents grassland; RL represents construction land; W represents water.
Forests 14 00093 g007
Figure 8. The distribution pattern (A) and relative changes (B) of major meteorological elements under climate change in the watershed.
Forests 14 00093 g008
Figure 9. Relative changes in WCA of each ecosystem under climate change scenarios (dry season). (A) Spatial distribution of WCA evolution for each ecosystem; (B) Relative rate of change in WCA for each ecosystem.
Forests 14 00093 g009
Table 1. An analysis of the scenarios set up in this study and the analysis ideas.
ScenarioYear
Land Use DataMeteorological Data
Land use changeA19801970–2020
B19901970–2020
C20001970–2020
D20101970–2020
E20201970–2020
Climate changeF20201971–1980
G20202011–2020
Combined changeH19801971–1980
G20202011–2020
Table 2. WCA of the Hanjiang watershed and major ecosystems (mm).
Ecosystem TypeScenario HScenario GAverage
Farmland Ecosystem99.77103.42101.60
Forest Ecosystem103.57109.12106.35
Grassland Ecosystem77.4983.2580.37
ALL280.84295.79288.32
Table 3. Multiple linear regression results for scenarios H and G.
Independent VariableStandardized Regression Coefficients (β)Level of Significance (P)
Scenario HScenario GScenario HScenario G
Dry seasonPrecipitation0.8700.860******
Evapotranspiration−0.2230.079
Land use level0.0640.090
R20.7560.768
Wet seasonPrecipitation0.7140.731******
Evapotranspiration−0.097−0.212
Land use level0.0840.089
R20.5630.623
Note: *** indicates significance at the α = 0.001 level.
Disclaimer/Publisher’s Note: The statements, opinions and data contained in all publications are solely those of the individual author(s) and contributor(s) and not of MDPI and/or the editor(s). MDPI and/or the editor(s) disclaim responsibility for any injury to people or property resulting from any ideas, methods, instructions or products referred to in the content.

