Abstract
Understanding the relationship between soil environmental conditions and the interspecific integration of plant traits might shed light on how plants adapt to their environment. In order to clarify the adaptation strategies of desert plants in the various habitats, this study calculated interspecific trait integration (ITI) and plant trait networks (PTN) by selecting plants from high water-salinity habitat (HSM) with salt stress and low water-salinity habitat (LSM) with drought stress in the Ebinur Lake region. Eight different phytochemical traits were taken into consideration, including carbon (C), nitrogen (N), phosphorus (P), sulfur (S), potassium (K), calcium (Ca), sodium (Na), and magnesium (Mg). Six soil factors were chosen, including soil pH, water content (SVWC), electrical conductivity (EC), soil nitrogen (N), phosphorus (P), and potassium (K). The results obtained are shown below: (1) the relationship between plant leaf chemical traits was closer in HSM than in LSM, and the correlation between C and other leaf chemical traits was significant in HSM and insignificant in LSM; (2) the correlations between soil factors and ITI were not statistically significant; however, in both soil water-salinity habitats, the strength of fit between SVWC and ITI was the greatest, while the strength of fit between EC and ITI was the smallest; and (3) according to the PTN, C and Ca are the two most central traits for the growth of desert leaf chemical plants in Ebinur Lake, which is consistent with the results of the PCA. Coordination of plant leaf traits along water-salinity gradients involves many different combinations of traits, and the use of ITI and PTN can quantify the complex relationships between multiple traits to a greater extent, highlighting the multivariate mechanisms of plant response and adaptation to soil habitats. This information will help expand and optimize our ability to observe and predict desert plant responses to habitat change, providing powerful insights for assessing desert plant survival strategies.
1. Introduction
Functional traits are measurable attributes of individual plants that determine how they acquire and compete for resources and tolerate stressful conditions [1,2]. Ecology has long faced challenges in comprehending the functional connections between plant communities and their environments [3]. To investigate the relationship between traits and the environment, community ecologists have mostly concentrated on the mean and variance of traits at the species level [4]. Interspecific trait integration has not received as much attention along local environmental gradients as trait mean values and other metrics of functional diversity have [5]. The idea of trait integration stems from the discovery that an individual’s or a species’ traits can vary in a coordinated way, favoring some functions over others [6,7]. For instance, species adapted to severe conditions may prioritize resource acquisition functions over resource conservation activities, whereas species adapted to softer habitats may follow the reverse strategy [8,9]. Understanding how species’ multidimensional functional niches along environmental gradients, limitations, and changes in resource supply affect plant adaptation patterns and community structure requires research on trait integration. It also reveals ecological processes or key drivers of community assembly [2,10].
Trait integration indicates how multiple traits differ from one another [11], providing useful insights into the functional tradeoffs underlying biodiversity patterns [8]. On a local or small scale, topographic and soil factors determine the distribution of traits [12]. Delhaye et al. proposed that the increase in trait integration with soil metal toxicity in plant communities supports the idea that highly constraining environments select increasingly coordinated sets of functional traits, possibly driving the decrease in species richness [2]. According to this, abiotic gradients may have a direct or indirect impact on species richness [13], and trait integration and how it responds to the environment may not only reflect a plant’s strategy for adaptation but also have an impact on changes in the variety of a community. Gianoli and Palacio-Lopez came to the conclusion that, in some situations, flexibility and integration could be additional coping mechanisms for stress [14]. Some academics think that a trait’s plasticity may vary depending on how well it integrates in various situations [15]. In other words, integration qualities have more similar plasticity than non-integration traits, and their similarity in plastic responses predicts their integration in the environment [16]. The leaves are the primary site of photosynthesis and a vital organ for plants to keep the hydrological system in balance. They are quite plastic and sensitive to environmental changes [12]. Multiple components of plant fitness help mechanically determine the environmental distribution of the species. They are therefore often used to explore plant adaptation strategies to the environment. The correlation and integration between attributes may indicate the adaptation methods of plants in arid settings, according to Yang et al.’s study of leaf traits in typical small tree and shrub plants in arid regions of northwest China [17]. Over the course of their long-term evolutionary history, these dominant species have gradually evolved a number of unique morphological and physiological adaptation traits in response to droughts [18]. Through the trait integration approach, we can understand how the interrelationships between multiple traits change [11]. Trait integration can be greatly changed by changing the external environment [6]. In order to better understand the community trait space and the ecological processes that shape it, trait integration analysis is a complementary method [2].
It is still challenging to effectively describe and integrate diverse social structures and predict ecosystem-level responses to environmental disturbance using trait assessments at the individual level [19]. Recently, some scholars have studied the interdependence between network analyses and traits by constructing plant trait networks to quantify their parameters. Using network analyses, they can visualize and quantify trait integration [7,20,21]. Burton et al. found a small clustering of a priori trait characteristics when employing network analyses to explore trait integration and functional differences within coexisting species of plants [22]. Biogeochemical cycles in desert ecosystems are often slower than those in forest and aquatic ecosystems, which leads to arid soils and poor net primary productivity [23]. Gao et al. improved our comprehension of how vulnerable arid ecosystems are to environmental change by building functional trait networks that included leaf, root, and component biomass in desert ecosystems in China. These networks revealed the complex relationships between the three and the key traits of the ecosystem [24]. Desert plants are a type of zonal vegetation that thrives in arid regions and has special functional characteristics. The building of desert plants’ communities is significantly influenced by the trade-off relationship between their functional traits and adversity strategies [25]. In order to compare phenotype-based tactics among different species, Westoby recommended the use of trait-based dimensions. A collection of associated traits known as the trait dimension reflects the limitations and trade-offs that make up the plant phenotype [26]. The “leaf economic spectrum (Leaf economics spectrum, LES)”—a well-known relationship among an established group of leaf economic features such as specific leaf area, leaf nitrogen concentration, leaf longevity, and net photosynthesis—is a prime example [27]. The leaf economic spectrum arranges plants on a specific axis, and one end represents a fast investment-return strategy larger than the leaf surface, higher leaf nitrogen content, faster photosynthetic and respiratory rate, and short leaf life, while the other end represents a slow investment-return strategy opposite to the above characteristics [28]. However, individual plant traits are usually combined into multiple functional systems for growth and adaptation to stressful environments. Recent studies have proposed how the leaf economic spectrum, which simplifies the relationship between traits, blurs the overall pattern of plant adaptation [29,30]. Therefore, shifting the trait-based ecology perspective from axis to network view provides a better understanding of the interdependence of multiple physiological functions, which is essential to understanding the ecology and evolution of plant morphological and functional diversity [21].
Due to its role in offering mechanical stability and the supply of nutrients for plants [12], soil is thought to play a significant role in affecting leaf functional traits on an isolated regional scale [18]. The ecological environment in arid desert areas is extremely fragile, and desert plants are usually under stressful conditions of drought, salinization, and nutrient depletion [31]. Environmental elements such as soil pH, moisture, salinity, and nutrients, which change plant stoichiometric ratios through plant-soil feedback, typically have a major impact on a plant’s functional traits [32]. Phylogenetically more stable than forms that are frequently tested, phytochemical elements might possibly be more directly related to ecosystem function [33]. For plant growth and the regulation of several physiological processes, the elements C, N, and P within leaves are essential [34]. By blocking sodium uptake, encouraging the absorption of K, Ca, and nitrate ions, boosting the exocytosis of Cl−, and causing the synthesis of anti-salt compounds, Ca can improve plant salt resistance [35]. As crucial osmoregulatory components, potassium (K) and sodium (Na) aid desert plants in their tolerance to both drought and salinity stress [36]. The grouping and structure of plant groups can be revealed by analyzing the variance of plant leaf features in desert settings. This research also aids in understanding how plants react to local changes in the environment [12]. Numerous studies have shown that higher interdependence between traits allows plants to effectively acquire and mobilize resources [37], and resource-poor plants may face stronger choices and therefore tend to have tighter trait correlations and trade-offs [38]. Although it is commonly established that gradients in the environment affect average trait values, it is less clear how these gradients affect local populations’ levels of trait integration [13]. In general, higher-stress circumstances are likely to result in an increase in trait integration [39]. It is possible to quantify the strategies that plants employ using a relatively limited number of traits, according to the integration of traits and trait spectra across resources (such as light, water, carbon, and nutrients) and organs [40]. In this study, we hope to study the relationship between plant leaf chemical traits and soil habitats by constructing ITI and PTN, to understand the mechanism of promotion or inhibition of different habitats on desert plants, and to comprehensively elaborate the adaptive responses of plants to their environments from a systematic perspective. Based on this, we are focusing on the following questions: (1) Which soil-water-salinity habitat has a stronger positive correlation between ITI and soil factors? We hypothesized that ITI is more closely correlated positively with soil factors in low-soil water-salinity habitat than in high-soil water-salinity habitat because interspecific trait integration is facilitated by environmental stress. (2) Is there a significant variation in PTN between the two habitats in terms of soil, water, and salinity? Because interplant trait connections might exhibit considerable changes as impacted by environmental conditions, we hypothesized that the differences in PTN complexity and central traits between the two-soil water-salinity habitats were significant. By testing the above hypotheses, this study hopes to reveal the adaptation strategies of desert plants to stressful environments from the perspective of interspecific trait integration and network formation.
2. Materials and Methods
2.1. Study Area
The Ebinur Lake Wetland National Nature Reserve (44°30′–45°09′ N, 82°36′–83°50′ E) is located in northwest Jinghe County, Bortala Mongolian Autonomous Prefecture, Xinjiang, China, in the lowest depression in the southwest margin of Junggar Basin and the water and salt collection center [41]. The climate is hot and dry throughout the year and is influenced by the normal temperate continent’s dry climate. The highest and lowest recorded temperatures are 41.3 °C and −36.4 °C, respectively, with an annual average temperature of 7.8 °C. The yearly sunshine hours are 2699.87, the annual evaporation is 2221.3 mm, and the annual precipitation is 105.17 mm. One of the water sources for Ebinur Lake is the Aqikesu River, which flows through the study area and is situated on the east side of the lake. The soil around riverbanks had a high water and salt content, which gradually decreased as one moved further away from the river. Depending on how far away from the river you are, the area’s vegetation mix differs. Major plant species close to the river channel are shrub plants Lycium ruthenicum, Halostachys capsica, and herbaceous plants Salsola aperta, licorice, Glycyrrhiza uralensis, etc. Away from the river, the main distribution of small trees is Tamarix ramosissima, shrubby Kalidium foliatum, herbaceous Salsola collina, Halocnemum strobilaceum, Salsola ruthenica, etc. The common species in both habitats are Arbor Populus euphratica, Haloxylon ammodendron, Nitraria sibirica, and Apocynum venetum. The herbaceous plants are Phragmites australis, Suaeda microphylla, Halimodendron halodendron, Suaeda salsa, Reaumuria soongorica, Alhagi sparsifolia, Suaeda glauca, and Karelinia capsica [41].
2.2. Plot Setting
In the Ebinur Lake Wetland National Nature Reserve, the experimental area is situated on the north bank of the Aqikesu River. The vegetation in this location is typical of the desert; the climate and surroundings are the same. The slope and appearance are the same at the same moment. There is no influence from the landscape because the height difference is so modest (between 290 and 310 m). In addition, the study area is not a human activity area and is not disturbed by human beings. According to previous studies, there is a significant gradient change of soil water and salt in the direction perpendicular to the Aqikesu River in the experimental area. Therefore, the transect of water and salt change is selected for investigation and experimentation.
The precise transect and plot layout approach is as follows: The Aqikesu River is divided into three transects, each with a 5 km interval. The soil water and salinity along the transects gradually decreased with distance from the river, and the transects were not susceptible to human disturbance. Ten to twelve 10 m × 10 m samples (n = 32) were created across each transect, with 0.5 km between each sample. The number of cultivated species in two sample plots is too small, which affects the subsequent analysis; therefore, this study selected 30 sample plots for later analysis.
2.3. Sample Collection
Soil sampling: In accordance with the idea of random and uniform sampling, three sites were chosen in each sample plot, and soil samples were collected from these three locations for each sample plot. This was undertaken in order to accurately reflect the soil water, salt, and nutrient status of the sample plots. Following the removal of the litter layer, soil samples ranging from 0 to 15 cm were collected. Soil samples were quickly mixed and homogenized before being placed in self-sealing bags and given a number. In the area of sampling points, soil volumetric water content (SVWC) was measured using time-domain reflectometry (TDR, Field Scout TM TDR 300, Spectrum Technologies, Inc., Plainfield, IL, USA). For different indices, other samples were naturally dried in the air.
Plant sampling: Using GPS, the latitude and longitude of the centers of each square were recorded, along with the names of each species that was present and the number of individuals that were there. Choose the primary plant species in the location of the samples, choose three individuals at random from each species, and note the plant height, crown width, and DBH (base) values of each individual; three identically sized mature leaves that were healthy, unharmed, and from three distinct individuals were flattened with clear plastic plates before being photographed. Twenty to thirty leaves, weighing about twenty grams, were collected from each of the above three individual plants using twig clippers, placed in an envelope bag, and returned to the laboratory for subsequent testing.
2.4. Sample Processing and Testing
The soil was dried, and other soil factors were determined indoors. Soil pH was determined using the acidimeter method (PHS-3C, Shanghai Yidian Scientific Instrument Co., Ltd., Shanghai, China), and soil electrical conductivity (EC) was determined using a conductivity meter (DDS-307, Shanghai Yidian Scientific Instrument Co., Ltd., Shanghai, China), with a soil-to-water ratio of 1:5. Kjeldahl nitrogen determination, HClO4–H2SO4 molybdenum–antimony colorimetry, and atomic absorption spectrometry (HITACHI Z-2000) were each used to measure soil nitrogen, phosphorus, and potassium.
Leaf samples were pulverized and screened for leaf traits after being dried in a 75 °C oven for 48 h. Leaf C content by potassium dichromate-sulfate oxidation method; leaf N by Kjeldahl method (with H2SO4 used to speed up digestion); leaf P by first absorbing nitrogenous and perchloric acids and then using the molybdenum antimony colorimetric (Z−2000, Hitachi High-Technologies Trading (Shanghai) Co., Ltd., Shanghai, China) method; leaf S content by BaSO4 turbidimetry; and leaf Ka, Na, Mg, and Ca content by atomic absorption spectroscopy. Specific experimental methods are described in the literature [42].
2.5. Data Processing and Analysis
Prior to completing numerical and statistical analysis, all trait indicators for each species were averaged. The Shapiro–Wilk test and Levene’s test were then used to analyze all variables for normality and the chi-square hypothesis, respectively. By using cluster analysis (class average method), the habitat for soil water and salinity was identified. The 30 samples were then divided into two habitats: habitats with more water and salinity are more strongly stressed by salinity and are defined as high water-salinity habitat (HSM), and habitats with less water and salinity are defined as low water-salinity habitat (LSM). We utilized one-way analysis of variance (one-way ANOVA) to assess the variation in plant characteristics and soil physicochemical components according to water and salinity gradients. Both Pearson correlation analysis and principal component analysis (PCA) were used to investigate the association between plant leaf chemical characteristics in habitats with high and low soil water and salinity. The variance in interspecific trait integration (ITI) along the gradient was then explored using the range of eigenvalues (i.e., the difference between the eigenvalues of the first and last principal component axes) for each PCA. The variation in ITI was analyzed in relation to soil factors using a one-dimensional linear regression method. Finally, the topology of trait relationships was visualized using the IGRAPH package in R to form a plant trait network [28]. Leaf chemical traits are shown as nodes, while the correlations between them are shown as edges. The adjacency matrix A = [ai,j], where ai,j ϵ [0, 1], was generated by assigning associations above the significance threshold as 1 and relationships below the significance threshold as 0. We defined significance thresholds of |r| > 0.2 and p < 0.05 [21,43]. For each characteristic, two measures of network centrality were computed: degree (D), which is the number of edges on a node, and weighted degree (Dw), which is the total of a node’s significant correlation coefficients [44]. Excel 2016, Origin 2023, and R 4.1.0 were used for data collection and statistical analysis.
3. Results
3.1. Leaf Chemical Traits and Their Relationships in Response to High and Low Soil Water-Salinity Habitats
With the exception of soil phosphorus (P) and potassium (K), soil factors were significantly higher in high soil water and salinity habitat than in low soil water and salinity habitat (p < 0.05) (Table 1). In the high and low soil water-salinity habitats, respectively, there were 16 and 17 plant species present. Since many of the plants in the two habitats shared characteristics, a total of 23 plant species were identified in the two habitats. Plants in the low soil water-salinity habitat had significantly greater K and Na contents than those in the high soil water-salinity habitat, whereas the high soil water-salinity habitat had significantly higher Ca contents than the low soil water-salinity habitat.

Table 1.
Soil properties and plant leaf chemical traits (mean ± standard deviation).
3.2. Relationship between Plant Leaf Chemical Traits under Different Soil Water and Salinity Habitats
Overall, trait correlations were slightly higher in high soil water-salinity habitats than in low soil water-salinity habitats (Figure 1). In high soil water and salinity habitat, C showed significant correlations with other chemical traits except S and P, significant positive correlations with Ca, and significant negative correlations with Mg, Na, N, and K. In low soil water and salinity habitat, C has a weak correlation with other chemical traits except Ca. Na showed significant positives with S and N, and it was significantly negative with Ca.
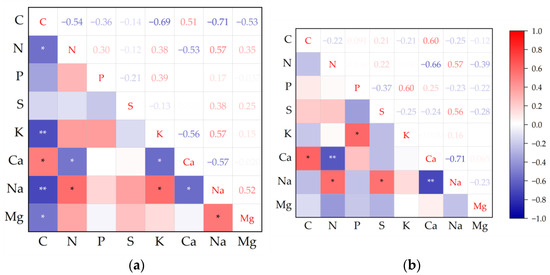
Figure 1.
Pearson correlation analysis among plant leaf chemical traits in high and low soil water and salinity habitat. (a) high soil water and salinity habitat; (b) low soil water and salinity habitat. Note: * p ≤ 0.05; ** p ≤ 0.01.
The first two principal components (PC) of the high soil water-salinity habitat explained 44.88% and 19.29% of the total variance, respectively (Table 2). PC1 mainly represented Na, N, K, C, and Ca. S explained the least for PC1, and the first principal component axis showed a large negative correlation between C, Ca, and other chemical traits. PC2 mainly represents P, S, and Mg, with C explaining the least for PC2 (Figure 2).
Table 2.
Eigenvalues and explained variance (%) of high and low soil water and salinity habitat.
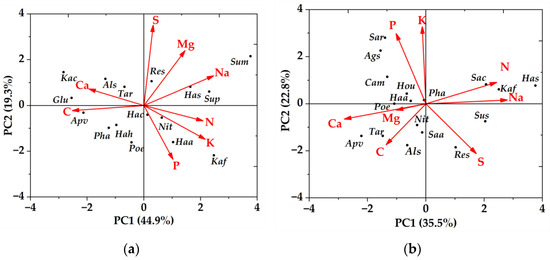
Figure 2.
Principal component analysis of plant leaf chemical traits in high and low soil water and salinity habitat. (a) high soil water and salinity habitat; (b) low soil water and salinity habitat. Als—Alhagi sparsifolia; Ags—Agriophyllum squarrosum; Apv—Apocynum venetum; Cam—Calligonum mongolicum; Hou—Horaninowia ulicina; Glu—Glycyrrhiza uralensis; Hac—Halostachys caspica; Hah—Halimodendron halodendron; Has—Halocnemum strobilaceum; Kac—Karelinia caspica; Kaf—Kalidium foliatum; Nit—Nitraria tangutorum; Pha—Phragmites australis; Res—Reaumuria songarica; Saa—Salsola aperta; Sac—Salsola collina; Sum—Suaeda microphylla; Sup—Suaeda prostrata; Sar—Salsola ruthenica; Tar—Tamarix ramosissima; Sus—Suaeda salsa; Haa—Haloxylon ammodendron; Sup—Suaeda prostrata.
The first two principal components (PC) of the low soil water-salinity habitat explained 35.52% and 22.83% of the total variance, respectively. PC1 mainly represented Na, N, C, and Ca; K explained the least for PC1 (Table 2). All chemical traits were positively correlated with PC1, except Na, N, and S, which were negatively correlated with PC1. PC2 mainly represents K and P. Na and Mg have the least explanation for PC2. Shrub plants, Haloxylon ammodendron and Populus euphratica, were distributed around P in both high and low soil water and salinity habitat, and the distribution of trees and herbs is not irregular (Figure 2).
3.3. Interspecific Trait Integration and Trait Network Changes along Soil Water and Salinity Habitats
Under low soil water and salinity habitat, SVWC, N, and P were positively correlated with ITI, with N having the highest strength of linear fit for ITI and K being negatively correlated with ITI with a higher strength of linear fit. Under high soil water and salinity levels, all soil factors except P were positively correlated with ITI, with SVWC having the highest linear fit strength for ITI. Overall, SVWC had the strongest linear fit to ITI, and EC had the weakest linear fit to ITI in both soil water-salinity habitats (Figure 3).
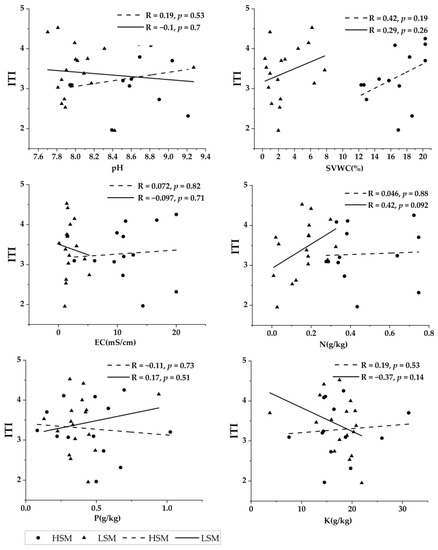
Figure 3.
The relationship between pH, SVWC (soil volume and water content), EC (electrical conductivity), N (nitrogen), P (phosphorus), K (potassium), and ITI (interspecific trait integration) under high and low soil water and salinity habitat.
The plant trait network showed a stronger association of plant leaf chemical traits in high soil water-salinity habitats than in low soil water-salinity habitats, and not all chemical traits were directly connected in the trait network (Figure 4). In high soil water-salinity habitats, the greater correlations between K, Ca, Na, C, Mg, and N connected into a trait network, with C serving as the central trait that connected all other chemical traits with the exception of S and P. The central trait in the low soil water-salinity habitat was Ca; Na also had the same degree as the central trait (D = 3), with a lower weighting than the central trait (Table 3); and Mg was not connected to any other chemical traits in the trait network.
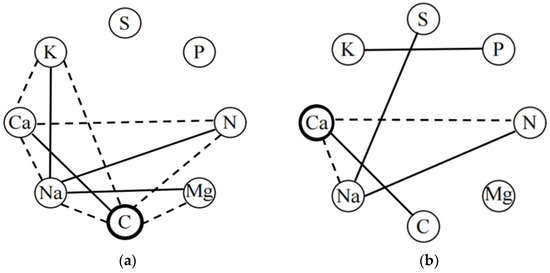
Figure 4.
Plant trait networks in high and low soil water and salinity habitat. (a) high soil water and salinity habitat; (b) low soil water and salinity habitat. Black solid dashed line edges indicate positive and negative correlations, respectively. Only significant relationships (p < 0.05) are displayed. The traits denoted by black circles have the highest weighted degree (the total of all significant coefficients of correlation for a node) centrality value.
Table 3.
Parameters of plant trait networks in high and low soil water-salinity habitats.
4. Discussion
4.1. Leaf Chemical Traits and Their Relationships in Response to High and Low Soil Water-Salinity Habitats
During long-term natural selection, plants growing in different habitats can optimize their resource allocation to cope with environmental stresses, and the differences in chemical elements contained in plants are one of the manifestations [45]. The current investigation demonstrated that the K, Ca, and Na contents of plants varied significantly in different water and salinity habitats (Table 1). The Ca content of plants in the high soil water and salinity habitat was significantly higher than in the low soil water and salinity habitat, which is consistent with the findings of Zhang et al. In contrast to the habitat of Ebinur Lake with high soil water and salinity, which has a higher content of soil powder and clay particles, the low soil water and salinity habitat is primarily made up of desert sand with a sandy texture [31]. At the level of Ebinur Lake plant arid plant groups, this led to a large decrease in leaf Ca content with decreasing soil water salinity because soil conditions have a strong impact on the variance of Ca content [46,47]. This suggests that plants adapt to environmental change by changing their leaf chemical traits. C, N, and P are vital nutrients that enable plant growth and are closely associated with crucial metabolic processes [48]. The ratio of C:N:P in terrestrial plants can indicate how well-adapted the plant is to the particular growth conditions in a given area [49]. In this study, there was a significant negative correlation between C and N (P), and both N and P showed a significant positive correlation in high soil water and salinity habitat. This is in line with the findings of the Sterner et al. study, which claims that one of the shared leaf chemical traits of higher terrestrials is the substantial negative correlation between leaf C and N (P) and the positive correlation between N and P [49,50]. This is one of the most basic characteristics of plants and is also a strong guarantee for stable community growth and development [51]. However, compared to the above characteristics, the relationship between C and P in plants with low soil water and salinity habitat is different. This may be because the plants get their N and P directly from the soil [52]. Environmental changes will also lead to significant differences in trait relationships, which are typically exhibited by a loss of trait correlation in stressful environments [16]. This theory was supported by the relationship between K and N, which showed that these two variables were significantly positively associated in high soil water-salinity habitat but not in low soil water-salinity habitat. Furthermore, different water-saline ecosystems support diverse plant species. Different trait correlations within species and between species can result from the degree of individual access to resources [53]. Ecological strategies that have evolved through evolutionary processes include synergies and trade-offs between various functioning traits [54].
The PCA revealed synergies or trade-offs between desert plant leaf chemical traits in both soil water and salinity habitats. Na, N, C, and Ca had the largest explanations of PC1 in the two-soil water and salinity habitats, and C and Ca showed a negative correlation with PC1. This suggests that Na, N, C, and Ca are relatively significant leaf chemical traits of desert plants in Ebinur Lake. Ca is a crucial nutrient element and messenger substance that plays a crucial role in both nutrient and signal transduction as an important biogenic element [33]. Osmoregulation is a crucial physiological defense mechanism for plant drought resistance in arid and desolate desert regions, and Na is a crucial osmoregulation ingredient for plants to adapt to an arid environment [55]. These chemical traits have special biochemical functions in plant growth, development, and reproduction [56]. Due to water scarcity and low nutrient levels, perennial herbs, shrubs, and trees of various kinds dominate the structure and functionality of desert ecosystems in the Ebinur Lake area. It happens frequently that various species respond differently to environmental stress [57]. The importance of elemental P for shrubs was demonstrated by PCA, which revealed that the shrub species Haloxylon ammodendron and Populus euphratica had high P content in both high and low soil water and salinity habitat. The amount of P in a leaf indicates how well a plant can absorb nutrients from the soil and is a crucial component of many proteins and genetic materials [58]. Desert plants have undergone long-term deductive evolution that has produced distinctive adaptive traits and functional countermeasures [59]. However, PCA failed to identify any distinct patterns in the distribution of trees and herbs. This is likely because changes in plant functional traits are impacted by a mix of environmental screening and biological interactions, which results in a convergence of traits that adopt the same growth strategy.
4.2. Relationship between ITI and Various Soil Physical and Chemical Factors
Interactions between different functional traits produce complex relationships, which are reflected in the synergistic response of different functional traits to environmental changes [60]. In our investigation, soil SVWC and N had the strongest relationships with ITI, which also tended to rise in both soil water-salinity habitats. The effect of pH on ITI was not significant in both soil water-salinity habitats. This may be due to the fact that in the Ebinur Lake area, plants have adapted to salinity habitats through physiological adaptations, and therefore leaf chemical traits are not significantly affected by pH. Nitrogen (N) and phosphorus (P) are the two nutrients that most often limit plant growth in terrestrial ecosystems [52]. According to this study, N is the main factor limiting plant growth and yield formation in habitats with low soil water and salinity, probably because saline plants have higher N uptake efficiency under low N conditions [61]. N supply and drought stress had similar interactions on plant growth [62], which could explain the positive correlation and high fit of soil SVWC and N with ITI in both soil water-salinity habitats. P was positively correlated with ITI in low soil water-salinity habitats, but ITI tended to decrease in high soil water-salinity habitats. One of the causes of the decline in ITI in high soil water-salinity habitats may be the accumulation of soil carbonate and a rise in soil alkalinity, which might result in the underutilization of P [24]. Additionally, P becomes insoluble in alkaline soils when it mixes with Ca, Mg, and other alkaline earth metals [63]. This can also result in a decrease in ITI since it makes it harder for plants to absorb and use P from the soil. The effect of potassium (K) on ITI was different in the two-soil water-salinity habitats, with a stronger negative correlation between K and ITI in the low soil water-salinity habitat. This may be due to the reduced mobility of K+ under drought and saline habitats in low soil water-salinity habitats, where the efficiency of K+ diminishes with lowering soil water content [62]. Soil water content and salinity have been established in earlier studies to be important environmental variables affecting desert plants [41]. In our study, ITI was positively connected with SVWC in both soil water and salinity habitats, and the association between ITI and SVWC was more significant in desert plants than EC. Studies have indicated that the main factor restricting the proper growth and development of desert plants in arid locations is the soil water content [12,64]. By limiting nutrient availability through mineralization as well as by reducing nutrient diffusion and mass movement in the soil, drought stress and the associated reduction in soil moisture can lower plant nutrient uptake [65]. Small variations in water will show up in the soil and vegetation, especially in arid and semi-arid areas. In order to adapt to drought stress in various water and salinity ecosystems, plants therefore chose combinations of diverse traits, or drought adaptation strategies [66]. According to the findings of PTN, where the network structure is more complex in high soil water and salinity habitat than in low soil water and salinity habitat, indicating more combinations between leaf chemical traits, the difference in the strength of fit between ITI and SVWC in high and low soil water salinity habitats may be caused by differences in the selected chemical trait combinations. The ITI and SVWC fits were higher in high soil water and salinity habitat because trait integration is the combination of individual qualities at progressively more sophisticated levels to determine the fitness and ultimate ecological processes of an organism [67]. The association between EC and ITI varied between the two soil water and salinity habitats, and neither habitat had a strong linear fit. In high soil water and salinity habitat, ITI was positively connected with EC, whereas in low soil water and salinity habitat, it was negatively correlated. This may be because soil salinity stress can limit plant growth by altering processes like photosynthesis, oxidative stress, osmotic stress, and ion imbalance [68]. For instance, too much Na+ in the soil might affect how plants use and process K+, changing plant growth, mineral distribution, and photosynthetic rates [69]. Light stress and salt stress are the main environmental factors limiting photosynthetic efficiency, and salt stress has short- or long-term effects on photosynthesis [70]. Although salt stress has been reported to inhibit photosynthesis [71], it has also been reported that photosynthesis is not slowed down by salinity and is even stimulated by low salt concentrations [72]. Therefore, salt stress limits photosynthesis, which results in less combination and integration of leaf chemical traits, which may explain why ITI declines with rising EC in low soil water and salinity habitat. Additionally, there are several plant species in two soil water-salinity habitats, and plant species vary widely in how salinity affects their ability to flourish [73,74], which also influences the ITI among plants.
Reduced density, dwarf plants, changes in species mix, simplistic structures, and poor water quality will eventually result in decreased production and the deterioration of ecosystem function. Therefore, HSM is more suited to the survival of desert plants than LSM. The data presented above contradict hypothesis (1), which states that ITI under LSM should be higher than LSM and more closely tied to the soil habitat. This could be due to two factors. The first is because there is not a strong enough environmental gradient for selection. Delhaye et al. additionally stated that an extreme environmental gradient is necessary for ITI research [2]. The second reason may be that this study selected only chemical traits and not traits like morphology and physiology. Because the environmental filter chooses particular combinations of traits rather than individual trait values, as shown by a greater ITI between some traits at the community level, for instance, a decrease in soil water may have a negative impact on the levels of phosphate and nitrogen in the leaves [44]. As a result, the relationship between leaf N and P in the LSM is inconsistent with the study by Sterner et al. [50]. Reich et al. also argued that which function is optimized, or the extent to which traits are coordinated, is usually determined by the biophysical, evolutionary and/or prevailing environmental constraints operating under a particular selection regime [8,60,75]. The ITI of leaf chemical traits along a weaker environmental gradient was investigated in this work. The drawback of this study stems from the conclusion that there was little association between soil factors. Future investigations should use plant morphological, physiological, and chemical traits to evaluate ITI on a stronger environmental gradient. To analyze changes in plant functional strategy, ITI can potentially be used with other functional diversity indices. In addition, selection for plant leaf chemical traits affects the complexity of plant trait networks and central traits [28]. The central leaf chemical traits of high and low soil water and salinity habitat are C and Ca, respectively, and Na also had the same degree as Ca, further confirming the results of the PCA. C, Ca, and Na are relatively important chemical traits of desert plant leaves in the Ebinur Lake area. This is in line with hypothesis (2) that distinct water and salinity habitats have different central leaf chemical traits. Highly connected traits are expected as a result of biophysical and/or selection processes that favor the efficient use and acquisition of resources within and between plant tissues [40]. It is important to take into account plant community composition, growth type (or functional group), and strategic variations brought on by certain landforms (such as deserts) when considering plant growth trade-off strategies at the regional scale [12]. The results indicate a more complex network structure and more leaf chemical trait connections in high soil water and salinity habitat than in low soil water and salinity habitat. The studies suggest that communities with less species diversity in relatively cold and arid climates have less trait connectivity, simpler trait network topology, and lower trait correlations [56]. Resources become more scarce, and abiotic circumstances become more harsh or varied as habitats change from benign to stressful or from high to low productivity ecosystems, reducing the size of the community’s possible niche space [13]. A complex network of trait correlations reflecting numerous concurrent selective processes in adaptation or community construction will develop from adaptation across resource gradients [76]. To ascertain which traits are required to represent ecological strategies, it is also vital to comprehend the link between traits and functional differentiation among species within local groups.
5. Conclusions
In this paper, eight plant leaf chemical traits were selected based on the analysis of two habitats in the Ebinur Lake area, but the plant species were not identical under different soil, water, and salinity habitats. The relationship between plant leaf chemical traits was closer in HSM than in LSM, and the relationship between C and other leaf chemical traits was significant in HSM but not in LSM. Indicating that stressful habitats may lead to the loss of correlations among chemical traits, in both soil water-salinity habitats, the strength of fit between SVWC and ITI was the greatest, while the strength of fit between EC and ITI was the smallest. Contrary to hypothesis (1) of this study, the relationship between soil factors and ITI in both habitats was not statistically significant. This could be the result of selecting only chemical traits and not traits like morphology and physiology, as well as insufficient gradients in the habitats. The plant trait network determined that C and Ca were the two central leaf chemical traits for desert plant growth in Ebinur Lake. This agrees with both hypothesis (2) and the PCA findings.
Author Contributions
Conceptualization, J.Y. and X.Z.; methodology, J.Y. and X.Z.; software, J.Y. and D.S.; validation, J.Y.; investigation, J.Y., D.S., Y.W. and J.T.; formal analysis, J.Y.; data curation, J.Y. and J.T.; writing—original draft preparation, J.Y. and Y.W.; writing—review and editing, J.Y. and X.Z.; supervision, X.Z.; funding acquisition, X.Z. All authors have read and agreed to the published version of the manuscript.
Funding
This research was supported by the Natural Science Foundation of Xinjiang Uygur Autonomous Region (2023D01C12) and National Natural Science Foundation of China (31700354).
Institutional Review Board Statement
Not applicable.
Informed Consent Statement
Not applicable.
Data Availability Statement
Not available.
Conflicts of Interest
The authors declare no conflict of interest.
References
- Violle, C.; Navas, M.L.; Vile, D.; Kazakou, E.; Fortunel, C.; Hummel, I.; Garnier, E. Let the concept of trait be functional! Oikos 2007, 116, 882–892. [Google Scholar] [CrossRef]
- Delhaye, G.; Bauman, D.; Séleck, M.; Ilunga Wa Ilunga, E.; Mahy, G.; Meerts, P.; Spasojevic, M. Interspecific trait integration increases with environmental harshness: A case study along a metal toxicity gradient. Funct. Ecol. 2020, 34, 1428–1437. [Google Scholar] [CrossRef]
- Zhang, S.H.; Zhang, Y.; Xiong, K.N.; Yu, Y.H.; Min, X.Y. Changes of leaf functional traits in karst rocky desertification ecological environment and the driving factors. Glob. Ecol. Conserv. 2020, 24, e01381. [Google Scholar] [CrossRef]
- Akram, M.A.; Zhang, Y.; Wang, X.; Shrestha, N.; Malik, K.; Khan, I.; Ma, W.; Sun, Y.; Li, F.; Ran, J.; et al. Phylogenetic independence in the variations in leaf functional traits among different plant life forms in an arid environment. J. Plant Physiol. 2022, 272, 153671. [Google Scholar] [CrossRef]
- Mouchet, M.A.; Villéger, S.; Mason, N.W.H.; Mouillot, D. Functional diversity measures: An overview of their redundancy and their ability to discriminate community assembly rules. Funct. Ecol. 2010, 24, 867–876. [Google Scholar] [CrossRef]
- Murren, C.J. Phenotypic integration in plants. Plant. Spec. Biol. 2002, 17, 89–99. [Google Scholar] [CrossRef]
- Messier, J.; Mcgill, B.J.; Enquist, B.J.; Lechowicz, M.J. Trait variation and integration across scales: Is the leaf economic spectrum present at local scales? Ecography 2017, 40, 685–697. [Google Scholar] [CrossRef]
- Reich, P.B.; Walters, M.B.; Ellsworth, D.S. From tropics to tundra: Global convergence in plant functioning. Proc. Natl. Acad. Sci. USA 1997, 94, 13730–13734. [Google Scholar] [CrossRef]
- Laughlin, D.C. The intrinsic dimensionality of plant traits and its relevance to community assembly. J. Ecol. 2014, 102, 186–193. [Google Scholar] [CrossRef]
- Tonsor, S.J.; Scheiner, S.M. Plastic trait integration across a CO2 gradient in Arabidopsis thaliana. Am. Nat. 2007, 169, E119–E140. [Google Scholar] [CrossRef]
- Pigliucci, M. Phenotypic integration: Studying the ecology and evolution of complex phenotypes. Ecol. Lett. 2003, 6, 265–272. [Google Scholar] [CrossRef]
- Li, S.; Wang, H.; Gou, W.; White, J.F.; Kingsley, K.L.; Wu, G.; Su, P. Leaf functional traits of dominant desert plants in the Hexi Corridor, Northwestern China: Trade-off relationships and adversity strategies. Glob. Ecol. Conserv. 2021, 28, e01666. [Google Scholar] [CrossRef]
- Silva, J.L.A.; Souza, A.F.; Vitória, A.P. Leaf trait integration mediates species richness variation in a species-rich neotropical forest domain. Plant. Ecol. 2021, 222, 1183–1195. [Google Scholar] [CrossRef]
- Gianoli, E.; Palacio-López, K. Phenotypic integration may constrain phenotypic plasticity in plants. Oikos 2009, 118, 1924–1928. [Google Scholar] [CrossRef]
- Parsons, K.J.; Mcwhinnie, K.; Pilakouta, N.; Walker, L. Does phenotypic plasticity initiate developmental bias? Evol. Dev. 2020, 22, 56–70. [Google Scholar] [CrossRef] [PubMed]
- Matesanz, S.; Blanco-Sanchez, M.; Ramos-Munoz, M.; De La Cruz, M.; Benavides, R.; Escudero, A. Phenotypic integration does not constrain phenotypic plasticity: Differential plasticity of traits is associated to their integration across environments. New Phytol. 2021, 231, 2359–2370. [Google Scholar] [CrossRef]
- Yang, X.D.; Anwar, E.; Zhou, J.; He, D.; Gao, Y.C.; Lv, G.H.; Cao, Y.E. Higher association and integration among functional traits in small tree than shrub in resisting drought stress in an arid desert. Environ. Exp. Bot. 2022, 201, 104993. [Google Scholar] [CrossRef]
- Kadioglu, A.; Terzi, R. A dehydration avoidance mechanism: Leaf rolling. Bot. Rev. 2007, 73, 290–302. [Google Scholar] [CrossRef]
- Funk, J.L.; Larson, J.E.; Ames, G.M.; Butterfield, B.J.; Cavender-Bares, J.; Firn, J.; Laughlin, D.C.; Sutton-Grier, A.E.; Williams, L.; Wright, J. Revisiting the Holy Grail: Using plant functional traits to understand ecological processes. Biol. Rev. 2017, 92, 1156–1173. [Google Scholar] [CrossRef]
- Wright, I.J.; Falster, D.S.; Pickup, M.; Westoby, M. Cross-species patterns in the coordination between leaf and stem traits, and their implications for plant hydraulics. Physiol. Plant. 2006, 127, 445–456. [Google Scholar] [CrossRef]
- Poorter, H.; Lambers, H.; Evans, J.R. Trait correlation networks: A whole-plant perspective on the recently criticized leaf economic spectrum. New Phytol. 2014, 201, 378–382. [Google Scholar] [CrossRef] [PubMed]
- Burton, J.I.; Perakis, S.S.; Brooks, J.R.; Puettmann, K.J. Trait integration and functional differentiation among co-existing plant species. Am. J. Bot. 2020, 107, 628–638. [Google Scholar] [CrossRef]
- Yang, X.D.; Zhang, X.N.; Lv, G.H.; Ali, A. Linking Populus euphratica Hydraulic Redistribution to Diversity Assembly in the Arid Desert Zone of Xinjiang, China. PLoS ONE 2014, 9, e109071. [Google Scholar] [CrossRef] [PubMed]
- Gao, D.X.; Wang, S.; Wei, F.L.; Wu, X.T.; Zhou, S.; Wang, L.X.; Li, Z.D.; Chen, P.; Fu, B.J. The vulnerability of ecosystem structure in the semi-arid area revealed by the functional trait networks. Ecol. Indic. 2022, 139, 108894. [Google Scholar] [CrossRef]
- Luo, Y.; Chen, Y.; Peng, Q.W.; Li, K.H.; Mohammat, A.; Han, W.X. Nitrogen and phosphorus resorption of desert plants with various degree of propensity to salt in response to drought and saline stress. Ecol. Indic. 2021, 125, 107488. [Google Scholar] [CrossRef]
- Stuart Chapin, F.; Kellar, A.; Francisco, P. Evolution of Suites of Traits in Response to Environmental Stress. Am. Nat. 1993, 142, S78–S92. [Google Scholar] [CrossRef]
- Wright, I.J.; Reich, P.B.; Westoby, M.; Ackerly, D.D.; Baruch, Z.; Bongers, F.; Cavender-Bares, J.M.; Chapin, T.; Cornelissen, J.H.C.; Diemer, M.W.; et al. The worldwide leaf economics spectrum. Nature 2004, 428, 821–827. [Google Scholar] [CrossRef]
- Li, Y.; Liu, C.C.; Xu, L.; Li, M.X.; Zhang, J.H.; He, N.P. Leaf Trait Networks Based on Global Data: Representing Variation and Adaptation in Plants. Front. Plant Sci. 2021, 12, 710530. [Google Scholar] [CrossRef]
- Bruelheide, H.; Dengler, J.; Purschke, O.; Lenoir, J.; Jiménez-Alfaro, B.; Hennekens, S.M.; Botta-Dukát, Z.; Chytrý, M.; Field, R.; Jansen, F.; et al. Global trait–environment relationships of plant communities. Nat. Ecol. Evol. 2018, 2, 1906–1917. [Google Scholar] [CrossRef]
- Sack, L.; Buckley, T.N. Trait multi-functionality in plant stress response. Integr. Comp. Biol. 2020, 60, 98–112. [Google Scholar] [CrossRef]
- Zhang, X.N.; Li, Y.; Yang, X.D.; He, X.M.; Lv, G.H. Responses of leaf chemical trait and economics spectrum in desert plants to varied soil water and salinity. Chin. J. Ecol. 2018, 37, 1299–1306. [Google Scholar] [CrossRef]
- Furey, G.N.; Tilman, D. Plant biodiversity and the regeneration of soil fertility. Proc. Natl. Acad. Sci. USA 2021, 118, e2111321118. [Google Scholar] [CrossRef] [PubMed]
- Furey, G.N.; Tilman, D. Plant chemical traits define functional and phylogenetic axes of plant biodiversity. Ecol. Lett. 2023, 26, 1394–1406. [Google Scholar] [CrossRef] [PubMed]
- Zhang, J.H.; Zhao, N.; Liu, C.C.; Yang, H.; Li, M.L.; Yu, G.R.; Wilcox, K.; Yu, Q.; He, N.P. C:N:P stoichiometry in China’s forests: From organs to ecosystems. Funct. Ecol. 2018, 32, 50–60. [Google Scholar] [CrossRef]
- Jiang, T.H.; Zhan, X.H.; Xu, Y.C.; Zhou, L.X.; Zong, L.G. Roles of calcium in stress-tolerance of plants and its ecological significance. Chin. J. Appl. Ecol. 2005, 16, 971–976. [Google Scholar]
- Wang, L.L.; Zhang, X.F.; Xu, S.J. Is salinity the main ecological factor that influences foliar nutrient resorption of desert plants in a hyper-arid environment? BMC Plant Biol. 2020, 20, 461. [Google Scholar] [CrossRef]
- Flores-Moreno, H.; Fazayeli, F.; Banerjee, A.; Datta, A.; Kattge, J.; Butler, E.E.; Atkin, O.K.; Wythers, K.; Chen, M.; Anand, M.; et al. Robustness of trait connections across environmental gradients and growth forms. Glob. Ecol. Biogeogr. 2019, 28, 1806–1826. [Google Scholar] [CrossRef]
- Liu, C.C.; Li, Y.; Xu, L.; Chen, Z.; He, N.P. Variation in leaf morphological, stomatal, and anatomical traits and their relationships in temperate and subtropical forests. Sci. Rep. 2019, 9, 5803. [Google Scholar] [CrossRef]
- Dwyer, J.M.; Laughlin, D.C. Selection on trait combinations along environmental gradients. J. Veg. Sci. 2017, 28, 672–673. [Google Scholar] [CrossRef]
- Reich, P.B. The world-wide ‘fast–slow’ plant economics spectrum: A traits manifesto. J. Ecol. 2014, 102, 275–301. [Google Scholar] [CrossRef]
- Tusifujiang, Y.L.K.; Zhang, X.N.; Gong, L. The relative contribution of intraspecific variation and species turnover to the community-level foliar stoichiometric characteristics in different soil moisture and salinity habitats. PLoS ONE 2021, 16, e0246672. [Google Scholar] [CrossRef] [PubMed]
- Dong, M. Observation and Analysis of Terrestrial Biocommunities; Standards Press of China: Beijing, China, 1997. [Google Scholar]
- Kleyer, M.; Trinogga, J.; Cebrián-Piqueras, M.A.; Trenkamp, A.; Fløjgaard, C.; Ejrnaes, R.; Bouma, T.J.; Minden, V.; Maier, M.; Mantilla-Contreras, J.; et al. Trait correlation network analysis identifies biomass allocation traits and stem specific length as hub traits in herbaceous perennial plants. J. Ecol. 2019, 107, 829–842. [Google Scholar] [CrossRef]
- Rosas, T.; Mencuccini, M.; Barba, J.; Cochard, H.; Saura-Mas, S.; Martinez-Vilalta, J. Adjustments and coordination of hydraulic, leaf and stem traits along a water availability gradient. New Phytol. 2019, 223, 632–646. [Google Scholar] [CrossRef]
- Cao, Y.B.; Wang, B.T.; Wei, T.T.; Ma, H. Ecological stoichiometric characteristics and element reserves of three stands in a closed forest on the Chinese loess plateau. Environ. Monit. Assess. 2016, 188, 80. [Google Scholar] [CrossRef]
- Asner, G.P.; Martin, R.E.; Tupayachi, R.; Anderson, C.B.; Sinca, F.; Carranza-Jiménez, L.; Martinez, P. Amazonian functional diversity from forest canopy chemical assembly. Proc. Natl. Acad. Sci. USA 2014, 111, 5604–5609. [Google Scholar] [CrossRef]
- He, M.Z.; Song, X.; Tian, F.P.; Zhang, K.; Zhang, Z.S.; Chen, N.; Li, X.R. Divergent variations in concentrations of chemical elements among shrub organs in a temperate desert. Sci. Rep. 2016, 6, 20124. [Google Scholar] [CrossRef]
- Sardans, J.; Rivas-Ubach, A.; Peñuelas, J. The C:N:P stoichiometry of organisms and ecosystems in a changing world: A review and perspectives. Perspect. Plant Ecol. Evol. Syst. 2012, 14, 33–47. [Google Scholar] [CrossRef]
- Li, Z.; Han, L.; Liu, Y.H.; An, S.Q.; Leng, X. C, N and P stoichiometric characteristics in leaves of Suaeda salsa during different growth phase in coastal wetlands of China. Chin. J. Plant Ecol. 2013, 36, 1054–1061. [Google Scholar] [CrossRef]
- Sterner, R.W.; Elser, J.J. Ecological Stoichiometry: Biology of Elements from Molecules to the Biosphere. J. Plankton Res. 2003, 25, 1183. [Google Scholar] [CrossRef]
- Wu, T.G.; Wu, M.; Liu, L.; Xiao, J.H. Seasonal variations of leaf nitrogen and phosphorus stoichiometry of three herbaceous species in Hangzhou Bay coastal wetlands, China. Chin. J. Plant Ecol. 2010, 34, 23–28. [Google Scholar] [CrossRef]
- Güsewell, S. N:P ratios in terrestrial plants: Variation and functional significance. New Phytol. 2004, 164, 243–266. [Google Scholar] [CrossRef]
- Vannoordwijk, A.J.D.; De Jong, G. Acquisition and Allocation of Resources: Their Influence on Variation in Life History Tactics. Am. Nat. 1986, 128, 137–142. [Google Scholar] [CrossRef]
- Eviner, V.T.; Iii, F.S.C. Functional Matrix: A Conceptual Framework for Predicting Multiple Plant Effects on Ecosystem Processes. Annu. Rev. Ecol. Evol. Syst. 2003, 34, 455–485. [Google Scholar] [CrossRef]
- Li, S.X.; Zhou, X.R.; Wang, S.M. Positive Functions of Sodium in Plants. J. Desert Res. 2008, 28, 485–490. [Google Scholar]
- Li, Y.; Liu, C.C.; Sack, L.; Xu, L.; Li, M.X.; Zhang, J.H.; He, N.P. Leaf trait network architecture shifts with species-richness and climate across forests at continental scale. Ecol. Lett. 2022, 25, 1442–1457. [Google Scholar] [CrossRef]
- Powell, T.L.; Wheeler, J.K.; De Oliveira, A.a.R.; Da Costa, A.C.L.; Saleska, S.R.; Meir, P.; Moorcroft, P.R. Differences in xylem and leaf hydraulic traits explain differences in drought tolerance among mature Amazon rainforest trees. Glob. Chang. Biol. 2017, 23, 4280–4293. [Google Scholar] [CrossRef]
- Zhang, K.; He, M.Z.; Li, X.R.; Tan, H.J.; Gao, Y.H.; Li, G.; Han, G.J.; Wu, Y.Y. Foliar carbon, nitrogen and phosphorus stoichiometry of typical desert plants across the Alashan Desert. Acta Ecol. Sin. 2014, 34, 6538–6654. [Google Scholar] [CrossRef]
- Lanta, V.; Lepš, J. Effect of functional group richness and species richness in manipulated productivity–diversity studies: A glasshouse pot experiment. Acta Oecol. 2006, 29, 85–96. [Google Scholar] [CrossRef]
- He, D.; Biswas, S.R.; Xu, M.S.; Yang, T.H.; You, W.H.; Yan, E.R. The importance of intraspecific trait variability in promoting functional niche dimensionality. Ecography 2020, 44, 380–390. [Google Scholar] [CrossRef]
- Abliz, A.; Lv, G.H.; Zhang, X.N.; Gong, Y.M. Carbon, nitrogen and phosphorus stoichiometry of photosynthetic organs across Ebinur Lake Wetland Natural Reserve of Xinjiang, Northwest China. Chin. J. Ecol. 2015, 34, 2123–2130. [Google Scholar] [CrossRef]
- Hu, Y.; Schmidhalter, U. Drought and salinity: A comparison of their effects on mineral nutrition of plants. J. Plant Nutr. Soil Sci. 2005, 168, 541–549. [Google Scholar] [CrossRef]
- Huang, C.Y.; Xu, J.M. Pedology Soil Study; China Agricultural Publishing House: Beijing, China, 1983. [Google Scholar]
- Li, W.J.; Lv, G.H.; Zhang, L.; Wang, H.F.; Li, Z.K.; Wang, J.L.; Ma, H.Y.; Liu, Z.D. Analysis of potential water source differences and utilization strategies of desert plants in arid regions. Ecol. Environ. 2019, 28, 1557–1566. [Google Scholar] [CrossRef]
- He, M.; Dijkstra, F.A. Drought effect on plant nitrogen and phosphorus: A meta-analysis. New Phytol. 2014, 204, 924–931. [Google Scholar] [CrossRef]
- Pivovaroff, A.L.; Pasquini, S.C.; De Guzman, M.E.; Alstad, K.P.; Stemke, J.S.; Santiago, L.S. Multiple strategies for drought survival among woody plant species. Funct. Ecol. 2016, 30, 517–526. [Google Scholar] [CrossRef]
- Marks, C.O. The causes of variation in tree seedling traits: The roles of environmental selection versus chance. Evolution 2007, 61, 455–469. [Google Scholar] [CrossRef]
- Meng, X.Q.; Zhou, J.; Sui, N. Mechanisms of salt tolerance in halophytes: Current understanding and recent advances. Open Life Sci. 2018, 13, 149–154. [Google Scholar] [CrossRef]
- Bejaouia, F.; Salasb, J.J.; Nouairid, I.; Smaouia, A.; Abdellya, C.; Martínez Forceb, E.; Youssefc, N.B. Changes in chloroplast lipid contents and chloroplast ultrastructure in Sulla carnosa and Sulla coronaria leaves under salt stress. J Plant. Physiol. 2016, 198, 32–38. [Google Scholar] [CrossRef]
- Parida, A.K.; Das, A.B. Salt tolerance and salinity effects on plants: A review. Ecotoxicol. Environ. Saf. 2005, 60, 324–349. [Google Scholar] [CrossRef]
- Chaudhuri, K.; Choudhuri, M.A. Effects of short-term NaCl stress on water relations and gas exchange of two jute species. Biol. Plant. 1997, 40, 373–380. [Google Scholar] [CrossRef]
- Kurban, H.; Saneoka, H.; Nehira, K.; Adilla, R.; Premachandra, G.S.; Fujita, K. Effect of salinity on growth, photosynthesis and mineral composition in leguminous plant Alhagi pseudoalhagi (Bieb.). Soil. Sci. Plant. Nutr. 1999, 45, 851–862. [Google Scholar] [CrossRef][Green Version]
- Batterton, J.C., Jr.; Baalen, C.V. Growth Responses of Blue-green Algae to Sodium Chloride Concentration. Arch. Mikrobiol. 1971, 76, 151–165. [Google Scholar] [CrossRef] [PubMed]
- Moisander, P.H.; Mcclinton, E.; Paerl, H.W. Salinity Effects on Growth, Photosynthetic Parameters, and Nitrogenase Activity in Estuarine Planktonic Cyanobacteria. Microb. Ecol. 2014, 43, 432–442. [Google Scholar] [CrossRef] [PubMed]
- Diaz, S.; Kattge, J.; Cornelissen, J.H.; Wright, I.J.; Lavorel, S.; Dray, S.; Reu, B.; Kleyer, M.; Wirth, C.; Prentice, I.C.; et al. The global spectrum of plant form and function. Nature 2016, 529, 167–171. [Google Scholar] [CrossRef]
- Freschet, G.T.; Kichenin, E.; Wardle, D.A. Explaining within-community variation in plant biomass allocation: A balance between organ biomass and morphology above vs below ground? J. Veg. Sci. 2015, 26, 431–440. [Google Scholar] [CrossRef]


Disclaimer/Publisher’s Note: The statements, opinions and data contained in all publications are solely those of the individual author(s) and contributor(s) and not of MDPI and/or the editor(s). MDPI and/or the editor(s) disclaim responsibility for any injury to people or property resulting from any ideas, methods, instructions or products referred to in the content. |
© 2023 by the authors. Licensee MDPI, Basel, Switzerland. This article is an open access article distributed under the terms and conditions of the Creative Commons Attribution (CC BY) license (https://creativecommons.org/licenses/by/4.0/).