1. Introduction
With the growing impact of human activities on wildlife, the need for efficient methods to monitor and understand changes in biodiversity has become more urgent. Traditional wildlife monitoring and conservation practices require extensive fieldwork and specialized expertise [
1,
2], limiting the ability to collect data and consuming valuable human resources. Traditional methods for tracking forest wildlife, such as collar tracking, acoustic tracking and sample line methods, are still the main methods used to collect and record information about animals [
3,
4]. However, each of these methods has certain disadvantages, so researchers strive to improve them. These challenges hinder researchers from understanding animal behavior in their natural habitats and lead to the failure to meet the needs of protecting wildlife diversity. However, the emergence and widespread use of modern science and technology, such as smart sensors, artificial intelligence and information technology, has introduced a variety of automated sensors that surpass the spatial and temporal scale data collection capabilities of humans. This has resulted in reduced monitoring costs and an important role in wildlife research.
Currently, the key technological innovations for wildlife monitoring and research in the forest area involve three main aspects: the commercial application of small, low-power monitoring devices; real-time transmission networks based on wireless communication; and automatic identification algorithms and models based on artificial intelligence [
5,
6]. The first two research tools have become mature and, in recent years, artificial intelligence technology has become a research hot spot in various industries, including wildlife monitoring. New research results are providing advanced tools for wildlife monitoring and protection, including target detection technology, which is widely used in the field of wildlife conservation. For example, Torney et al. [
7] used the YOLOv3 detection algorithm to achieve automatic counting of wild animals in images; Alsaadi and Nidhal [
8] achieved the classification and detection of mammals in the presence of light, occlusion, and other disturbances using the one-stage target detection algorithm SSD and classification algorithm MobileNetv1; Patrizia Tassinari and Marco Bovo et al. [
9] identified
cows in real time and detected their location and movements by adopting the object detection YOLO algorithm; Yonghua XIE and Jueze JIANG et al. [
10] detected and classified infrared thermal images of the
Amur tigers as well as their food chain (
plum deer,
horse deer,
reindeer, and
roe deer), improving the YOLOv5 algorithm [
11].
Object detection, serving as the cornerstone for research tasks such as individual recognition and re-identification (from labeling to re-labeling), has garnered significant attention from a multitude of researchers in this field. However, as the accuracy of object detection algorithms continues to improve, these algorithms have become more complex and resource-demanding. This trend has hindered detection devices from fully leveraging their advantages of being lightweight, convenient, and fast. Consequently, this study takes the example of Amur tiger species detection. Through an analysis of detection algorithms, we identify anchor-free object detection algorithms suitable for field-edge devices. Further refinement is applied to the selected algorithms. Without altering the total number of parameters, the objective is to provide remote terminal devices with a high-precision detection algorithm focused on species inhabiting forests. This endeavor aims to provide research support for the study, conservation, and restoration of wildlife behavior among large forest-dwelling animals by integrating computer vision algorithms with forestry devices, contributing to the scientific foundation of biodiversity preservation.
2. Materials and Methods
2.1. Introduction of Datasets
This study uses the
Amur Tiger Re-identification in the Wild (ATRW) dataset [
12]. The dataset was created by the World Wildlife Fund (WWF), using surveillance cameras and tripod-mounted DSLRs to capture 8076 high-resolution (1920 × 1080) video clips of 92 large wild northeastern tigers at 10 zoos in China. In this study, the wild northeastern tiger on object detection part of this data set was selected for the research. The information in the object detection section of this data set is shown in
Table 1.
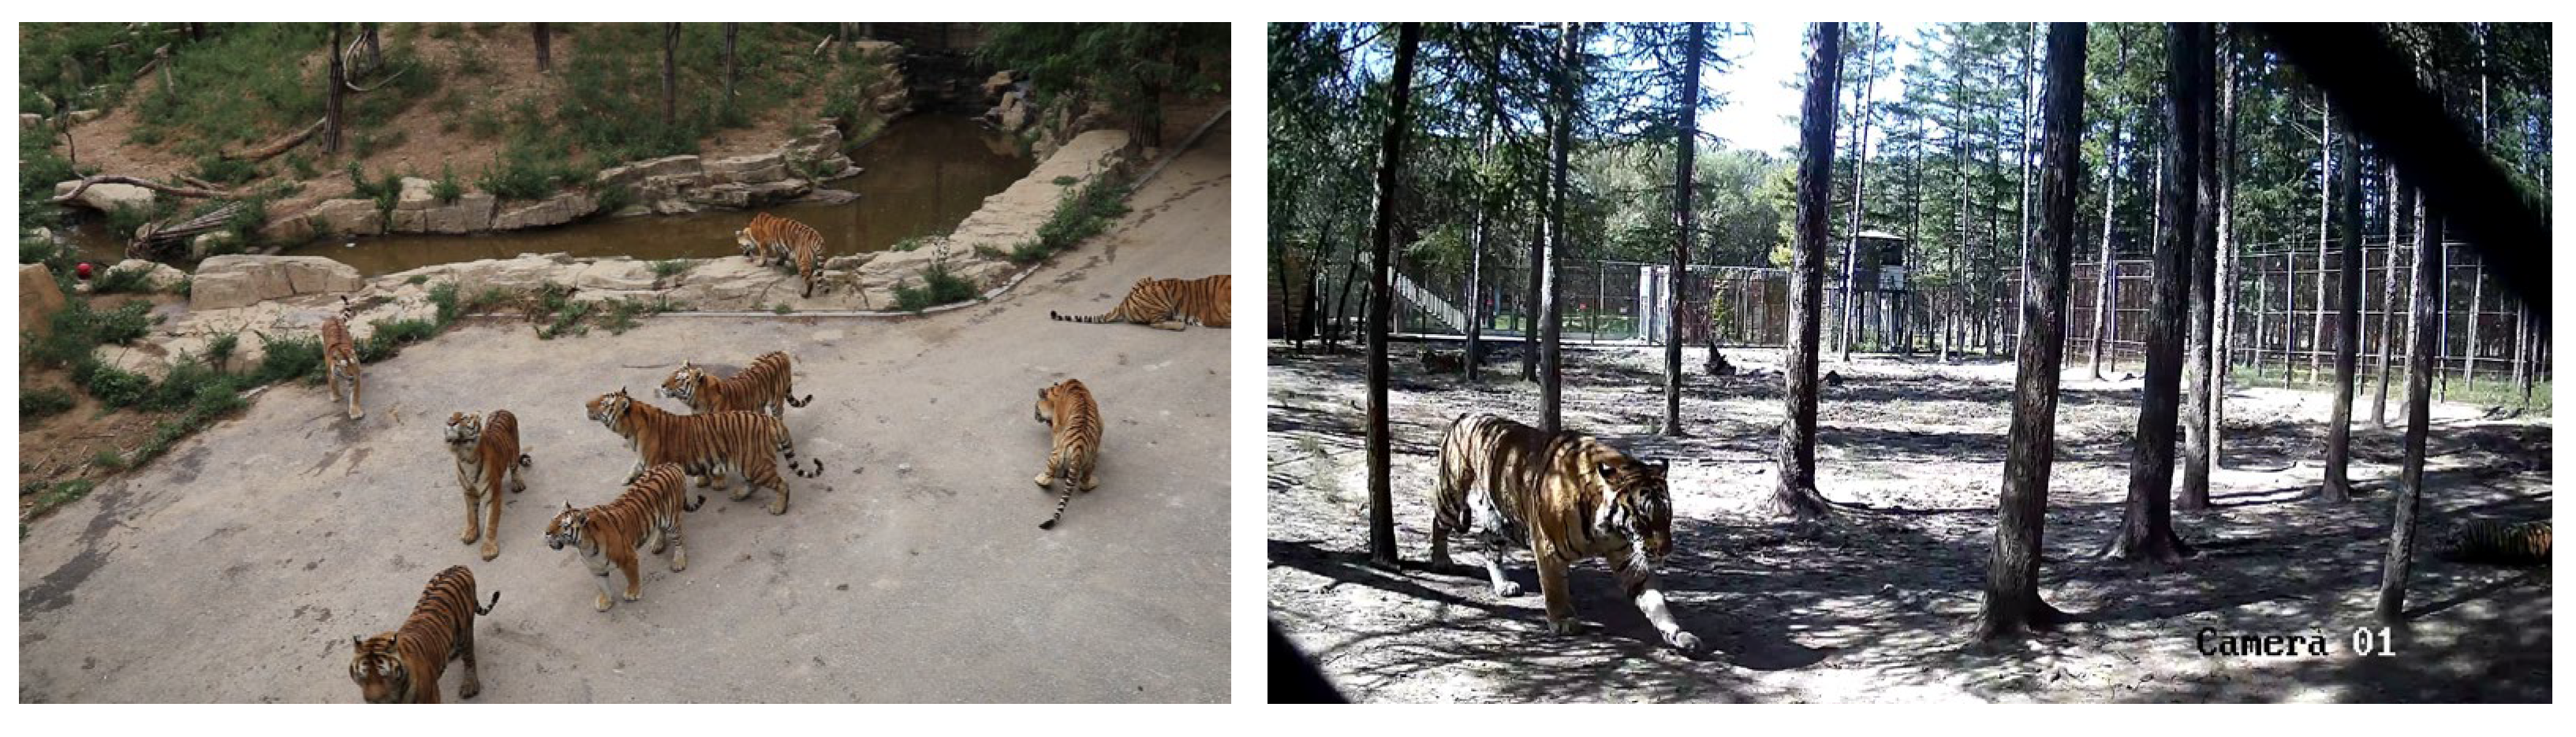
Among them, the training and validation sets in the data set will be assigned 2762 images according to 9:1. The following shows the sample photos of the
Amur tiger taken by DSLR and surveillance cameras, as shown in
Figure 1.
2.2. Preparation of Datasets
In order to enrich the ATRW dataset and train the model better for the performance of the detection algorithm, we adopted three ways of pre-processing the dataset.
(1) Mosaic image enhancement [
13]; Mosaic is to splice multiple images and is input to the network for training. In this study, 4 images are spliced for data enhancement. (2) Mixup data enhancement [
14]: two images are merged according to a certain transparency, and the whole training process is trained which uses only the fused new image. (3) Image proportional scaling: all the images of the Northeast Tiger data set are scaled from 1920 × 1080 in length and width to 640 × 640 correspondingly.
2.3. Detection Scheme
The remote monitoring of Amur tigers in forest environments using infrared trap cameras offers distinctive advantages. These cameras possess exceptional concealment and compact dimensions, rendering them inconspicuous within the forest setting and minimizing disruption to the natural behavior of wildlife. Furthermore, certain infrared trap cameras are equipped with wireless communication technology, enabling automated data collection, prolonged operation, and remote transmission of images and data. This capability empowers researchers to conduct real-time monitoring and analysis without the need for on-site presence, enhancing efficiency and minimizing disturbance to the habitat.
Therefore, in order to facilitate the pragmatic implementation of the algorithmic model for monitoring and data acquisition pertaining to the
Amur tiger, a comprehensive detection strategy is introduced. Specifically, this scheme involves the strategic deployment of infrared trap cameras in regions frequently traversed by the
Amur tiger [
15], including forests, commonly frequented water sources, and well-trodden pathways. These infrared cameras are equipped with a 1/3 FULL HD 3CMOS impact sensor, featuring a shutter trigger speed ranging from 0.5 to 0.6 s and a maximum trigger distance of 15 m. They are meticulously positioned to ensure optimal coverage and establish a seamless 4G communication interface with the designated remote terminal server.
This connectivity mechanism facilitates instantaneous data transfer, enabling real-time transmission of captured visual data. Upon the detection of any presence within the designated areas, the infrared cameras diligently discern the presence of an
Amur tiger. Subsequently, the associated terminal device identifies the detected entity and promptly initiates the collection of pertinent visual data for further analysis and archival. The detection flow chart and scheme diagram are illustrated in
Figure 2.
2.4. Introduction of Anchor-Free Algorithm
Current target detection algorithms are classified into two main categories: anchor-based algorithms and anchor-free algorithms. Anchor-free algorithms can detect the central region and boundary information of an object directly without the need to cluster training data with multiple anchor parameters of width and height, as required by anchor-based algorithms. They are widely used for target detection in complex environments. Moreover, in the post-processing task of target detection, anchor-based algorithms pre-assign multiple anchor frames, and the processing delay is proportional to the overall number of anchor frames, demanding high hardware performance from detection terminals. Therefore, to ensure the detection speed and real-time performance of the detection device, this study utilizes an anchor-free frame detection algorithm.
Anchor-free algorithms are categorized into two main ideas at present: (1) keypoint detection method: first detect the upper left and lower right corners of the object, and then form a detection box by combining the two detected corner points; (2) center-based detection method: directly detect the central region and boundary information of the object and decouple the classification and regression into two sub-networks.
YOLOX Algorithm
The YOLOX algorithm [
16] represents a significant advancement within the YOLO series, as it introduces the utilization of an anchor-free approach for genuine object detection. The YOLOX algorithm is divided into YOLOX-nano, YOLOX-tiny, YOLOX-s, YOLOX-m, YOLOX-l, and YOLOX-x in terms of the width and depth of the network. These six models of networks are only differentiated in terms of depth and width, and their network structures are identical. Therefore, in this paper, we only use YOLOX-s as the base structure of this network, and the YOLOX-s network structure diagram, as shown in
Figure 3.
As shown in
Figure 3, the YOLOX model employs the Focus structure in its feature extraction part, which reduces the width and height information of the image. The model’s feature extraction network uses CSPDarknet-53 as the backbone feature extraction network, which first extracts three effective feature layers in the CSPDarknet-53 from the input image. These effective features are then fed into the enhanced feature extraction network in the feature fusion layer, which combines feature information from different scales. The Feature Pyramid Network (FPN) structure [
17] used by YOLOX in the feature fusion part is capable of fusing the feature maps of three dimensions output from the feature extraction part, and has a certain focus on each output, improving detection accuracy on targets of different scales. In the prediction part, unlike previous YOLOX series models, the YOLOX model uses a decoupled prediction head structure, which slightly increases the computational complexity but greatly improves the model’s detection accuracy.
Lastly, YOLOX uses the GIoU bounding box regression loss function. Although the GIoU loss function in YOLOX proves efficacious, its refinement could be pursued by incorporating a more comprehensive geometric perspective of the bounding box. This augmentation has the potential to further elevate the precision of the detection model. Its equation is as follows:
where
is the intersection-to-merge ratio,
is the minimum outer rectangle, and
is the difference between
and the merge between the true and predicted boxes.
2.5. Algorithm Improvement
Through qualitative analysis of the YOLOX model, a follow-up improvement scheme is developed to improve the accuracy of the model. (1) The CBAM-E attention mechanism was incorporated in the middle of the backbone and neck; (2) the GIOU loss was replaced by CIoU loss.
2.5.1. Enhanced Convolutional Block Attention Module
The attention mechanism learns features by “weighting” the features in the feature map, allowing the network to focus more on useful features. The Convolutional Block Attention Module (CBAM) mechanism [
18] is a new channel and spatial attention mechanism. The CBAM is divided into two parts: the Channel Attention Module (CAM) and the Spatial Attention Module (SAM). CAM captures correlations between different channels within the dataset. In forest environments,
Amur tigers may be obstructed by trees or low light conditions, leading to some image channels containing relevant information while others have more noise. CAM helps the network automatically select and highlight channels containing crucial information about tigers. Meanwhile, SAM captures feature relationships at different spatial locations. In forests, the tiger’s location can be influenced by factors such as trees and terrain, resulting in significant feature differences at different positions. SAM helps the network focus on specific areas where tigers are located, thereby enhancing detection accuracy.
Although the CBAM attention mechanism has achieved remarkable success in image processing, it may face challenges when dealing with Amur tigers in forest settings due to their diverse poses and varying camera angles of trap cameras. This could lead to performance degradation or excessive computational complexity. Therefore, our study aims to find a more effective way to improve object detection performance.
Compared to fully connected layers, 1 × 1 convolutional layers can still achieve parameter sharing, increase the model’s non-linear capabilities, and reduce the risk of overfitting. Furthermore, 1 × 1 convolutional layers operate on each pixel, preserving spatial information in the image and enabling pointwise feature transformations, which are valuable for constructing multi-channel feature representations.
With the motivation to enhance model performance, we have redesigned a novel attention mechanism called the Enhanced Convolutional Block Attention Module (CBAM-E), as illustrated in
Figure 4. This improvement is expected to reduce model complexity, improve computational efficiency, and deliver superior performance in object detection tasks. It is anticipated that this enhancement will enable our model to excel in addressing challenges such as low light conditions and target obstructions, which are common when monitoring
Amur tigers in forest environments.
2.5.2. CIoU Loss Function
To address the shortcomings of IoU loss and GIoU loss concerning localization and prediction, CIoU loss [
19] considers more geometric factors of the prediction box and the real box and solves this problem by introducing a penalty term
. The CIoU loss equation is shown below:
where
and
denote the centroids of the real box and the prediction box, respectively,
denotes the Euclidean distance between the two points, and
denotes the diagonal distance of the smallest outer rectangle of the real box and the prediction box.
A good bounding box loss function should include three critical geometric factors: overlap area, centroid distance, and aspect ratio. The CIoU loss not only takes into account the geometric factors of the aspect ratio but also considers the consistency of the bounding box’s width-to-height ratio. In the equation, represents the parameter used to balance the proportions, while describes the parameter that captures the consistency of the aspect ratio between the real box and the prediction box.
2.6. Model Evaluation Metrics
In this study, the metric mean of Average Precision (mAP), which measures the accuracy of the model, is used in order to facilitate the evaluation of the performance of the model, and two thresholds of and are used to assess the model. The higher the threshold value is, the more stringent the performance requirement of the model. Meanwhile, the total number of parameters of the model is added as the evaluation criterion of the model in order to be able to deploy the algorithm to the hardware to provide feasibility, which is used to measure the size of the model.
3. Results
3.1. Training the YOLOX Model
In this experiment, the hardware environment consisted of an Intel i5 12400f CPU and NVIDIA GeForce RTX 3060 GPU, and the software environment was Python 3.10 with the Windows 10 operating system. YOLOX network models were adopted to evaluate and analyze the ATRW dataset separately, which used a learning rate decay with an initial learning rate of 0.01, and after 300 iterations, the training results were obtained, as shown in
Table 2.
As shown in
Table 2, after CBAM was introduced into YOLOX,
of the model increased by 0.52% from 97.32 to 97.84%.
increased by 1.23% from 75.10% to 76.33%. This confirms our earlier analysis that the incorporation of CBAM, particularly spatial attention, allows the model to better comprehend and focus on the position and contextual information of the targets. For large animals like the
Amur tiger, the spatial attention mechanism aids in capturing the target’s location, posture, and surrounding environment, especially in forested and low-light conditions, thereby enhancing the detection accuracy.
Subsequently, after introducing CBAM-E into YOLOX, the reached 98.05%, while reached 78.37%. Compared to YOLOX and YOLOX_CBAM, this represents an improvement of 0.73% and 0.21% in . Furthermore, improved by 3.27% and 2.04% over YOLOX and YOLOX_CBAM. These results demonstrate that the refined CBAM, after improvement, can dynamically adjust channel and spatial weights of feature maps, making it better suited for the Amur tiger detection task in forested environments. This performance enhancement is particularly pronounced when using higher accuracy thresholds (). Moreover, the introduction of attention mechanisms had almost no impact on the model’s total parameters.
3.2. Training the YOLOX Improvement Model
After the introduction of the CBAM-E module, the performance of the model has been significantly improved. Therefore, CIoU loss is further introduced to design the ablation experiment of the overall improvement of the model and verify the improved performance of the model. The experimental results are presented in
Table 3.
The final improvement is to replace the original GIoU loss function of the bounding box of the model with the CIoU loss function. As shown in
Table 3, the improved YOLOX model exhibited an increase in
from 98.05 to 98.18%, representing a gain of 0.13%. Similarly,
increased from 78.37 to 78.70%, indicating an improvement of 0.33%. This improvement can be attributed to the use of CIoU, which considers the complete intersection between bounding boxes more comprehensively compared to GIoU. This results in a more precise measurement of the matching degree between predicted and actual bounding boxes. In the
Amur tiger dataset, factors such as tree obstruction and low light conditions can lead to blurry or partially visible object boundaries. CIoU handles these situations better, providing a more accurate matching metric. Additionally, CIoU is less sensitive to scale variations, which is crucial in the wild, where tigers may be captured at varying distances and angles, leading to significant scale changes. CIoU adapts better to these scale variations, ensuring consistent performance.
In summary, CIoU offers advantages in object detection, including higher matching accuracy, insensitivity to scale variations, and a smoother optimization curve compared to GIoU. These qualities enhance the detection performance, particularly in challenging scenarios like the ATRW dataset, yielding more precise results. Therefore, in practical applications, employing the CIoU loss function can enhance the performance of object detection models on specialized datasets.
According to
Table 3, whether CBAM-E and CIoU are introduced individually into YOLOX or together, there is an observable performance improvement in the model. This confirms the effectiveness of the YOLOX enhancements. The improved YOLOX model is capable of handling object detection tasks in complex environments, especially when detecting large objects in forested areas. The modified YOLOX model structure is depicted in
Figure 5.
3.3. Contrast Experiment
After improvements, YOLOX has demonstrated a significant enhancement in its detection performance. To showcase the model’s superiority compared to other models, comparative experiments were designed. Horizontal comparisons were conducted with the anchor-based YOLOv5s algorithm, while vertical comparisons were made with the anchor-free CenterNet algorithm [
20]. Each experiment underwent 300 epochs, and the experimental results are presented in
Table 4.
As shown in
Table 4, the improved YOLOX model has been subjected to rigorous comparative experiments, contrasting it horizontally with the anchor-based YOLOv5s algorithm and vertically with the anchor-free CenterNet algorithm. These experiments yielded notably higher
and
values compared to both of these algorithms. This outcome can be attributed to several factors: (1) enhanced attention mechanisms: the introduction of CBAM-E attention mechanisms in YOLOX allows the model to focus on relevant features and regions of interest effectively. This is particularly advantageous in scenarios with obscured targets, such as in forested environments, where East Siberian tigers are often partially hidden by vegetation. The attention mechanisms help the model better understand and highlight important information. (2) Adaptation to real-world scenarios: the East Siberian tiger dataset is challenging due to the animals’ diverse poses, variable distances, and occlusion by environmental elements. YOLOX, especially with CBAM-E and CIoU, has shown superior adaptability to these real-world conditions, improving the detection accuracy.
3.4. Model Test
This section aims to test the improved model and analyze its detection results to observe the detection results on the test set. Compared with the performance of the model before the improvement, the performance of the improved model has been greatly improved in
. Some of the model detection results on the test set are shown in
Figure 6 and
Figure 7.
In real-world wildlife monitoring scenarios, it is common for subjects of interest, such as the
Amur tiger, to be partially visible at the edges of the camera’s field of view due to their unpredictable movements within dense vegetation. To address this challenging situation, our algorithm, which combines the YOLOX model with the CBAM-E attention mechanism, exhibits a remarkable capability. Through a comprehensive evaluation of a dataset collected from a natural reserve with high vegetation density, we specifically designed scenarios mimicking subjects partially entering the camera frame. Our results, as presented in
Figure 8, indicate that the algorithm consistently and accurately detects these partially visible subjects. The confidence scores generated by the algorithm reflect the degree of subject visibility, providing valuable insights into the detection reliability.
3.5. Analysis of the Experimental Results
Based on the obtained detection results, it can be observed that the improved YOLOX model, regardless of whether the Amur tiger is in open areas near water sources or in dimly lit forests, is able to detect all Amur tigers. Through a comparison of the detection performance before and after the improvements, the enhanced algorithm exhibits higher confidence in detecting Amur tigers, particularly in scenarios involving multiple tiger gatherings or under conditions with light interference. Moreover, the generated bounding boxes of the improved algorithm better conform to the contours of Amur tigers compared to the previous version, eliminating instances where the generated bounding box overlaps with the detected Amur tigers.
4. Discussion
In this study, we focused on the Amur tiger as our research subject. Addressing the context of Amur tigers within forest ecosystems, we devised a remote monitoring and data collection system by combining infrared trap cameras with terminal servers. Furthermore, we introduced a novel attention mechanism, CBAM-E, and incorporated it along with the CIoU loss function to develop a new YOLOX algorithm. The new algorithm improves the detection accuracy of the model without increasing the total number of parameters. The is 98.18%, and the is 78.70%. Amur tigers are large wild animals that typically inhabit forest environments, often concealed by trees and vegetation. They are also active under low light or weak nighttime lighting conditions. These unique characteristics demand that the object detection model accurately captures information about Amur tigers.
In the past, the collection and organization of wildlife-related data relied heavily on manual efforts, resulting in significant time consumption when extracting the desired information from massive image datasets. However, in recent years, researchers have developed efficient image recognition and detection models based on artificial intelligence technology. These models, coupled with forestry devices such as infrared trap cameras and drones, have been increasingly employed in automatic species identification and rapid assessment of animal images. This has greatly enhanced the efficiency of collecting animal-related data and shortened the research cycle for studying animals.
Amur tigers are large wild animals that typically inhabit forest environments, often concealed by trees and vegetation. They are also active under low light or weak nighttime lighting conditions. These unique characteristics demand that the object detection model accurately captures information about
Amur tigers. In studies related to the
Amur tiger, some researchers [
21] have achieved automatic individual recognition of
Amur tigers using deep neural networks, achieving an average accuracy rate of 92.37% for identifying facial and body stripe patterns on the left and right sides. Other studies [
10] have employed infrared thermal imaging to capture images of
Amur tigers and their food chain, and through improvements to the YOLOv5 algorithm, achieved a recognition accuracy of 93.2%. Similarly, utilizing the ATRW dataset, researchers [
22] conducted species detection studies on
Amur tigers using the SSDlite algorithm, achieving a detection accuracy of 95.5%. In comparison, the metrics of this study surpassed those by 2.68%. The enhanced YOLOX algorithm demonstrates robust performance under challenging conditions, such as low illumination, the presence of clustered and occluded targets, and obstruction by trees and vegetation.
Despite the growing emphasis on Amur tiger conservation efforts and the increasing tiger population, their overall numbers remain relatively low compared to other wildlife species. Consequently, publicly available datasets for Amur tigers are not as extensive as those for other animals. However, our dataset, comprising 4434 images, each featuring multiple Amur tigers, provides a foundational resource for initial research and algorithm analysis focused on large-scale wildlife like the Amur tiger. By demonstrating the feasibility of algorithm development with a smaller dataset of Amur tigers, we believe that similar endeavors involving larger datasets for other wildlife species can proceed more smoothly. In addition, we plan to collect image data related to the Amur tiger in various scenarios, including high vegetation, partially obscured subjects, and other conditions. This initiative aims to enrich the open dataset and provide valuable data contributions for future research on large wild animals, such as the Amur tiger.
5. Conclusions
The accurate and intelligent monitoring of large wild animals is crucial in the field of animal conservation. In this study, we propose an improved YOLOX algorithm that enables the development of a lightweight model for deployment on detection terminal devices. By integrating artificial intelligence with intelligent sensing devices, this model offers a research direction for the remote collection of image information related to Amur tigers. This approach enhances our understanding of the species’ ecological and behavioral patterns, providing a scientific basis for Amur tiger conservation.
In future research, expanding the Amur tiger detection dataset will further enhance the model’s detection performance. Additionally, integrating network information technology and “3S” technologies will optimize the detection capabilities of detection devices, enabling cloud storage and visual analysis. This will contribute to improving the accuracy of intelligent identification regarding species, individuals, and behaviors, while also enhancing the efficiency of handling large-scale data. Ultimately, these advancements will provide comprehensive technological support for the establishment of natural conservation systems in forest areas dedicated to the protection of large wild animals.
Author Contributions
Conceptualization, Y.X. and W.Y.; methodology, Y.X.; software, W.Y.; validation, W.Y.; formal analysis, W.Y.; investigation, Y.X.; resources, Y.X.; data curation, W.Y.; writing—original draft preparation, W.Y.; writing—review and editing, Y.X.; visualization, W.Y.; supervision, Y.X.; project administration, Y.X.; funding acquisition, Y.X. All authors have read and agreed to the published version of the manuscript.
Funding
This research was funded by a project of the Natural Science Foundation of Heilongjiang Province, Research on Key Technologies of Wildlife Intelligent Monitoring (LH2020C034).
Data Availability Statement
The data presented in this study are available upon request from the corresponding authors.
Acknowledgments
The authors thank the anonymous reviewers for their useful comments, which improved the quality of the paper.
Conflicts of Interest
The authors declare no conflict of interest. The funders had no role in the design of the study; in the collection, analyses, or interpretation of data; in the writing of the manuscript; or in the decision to publish the results.
References
- Figueroa, K.; Camarena-Ibarrola, A.; García, J.; Villela, H.T. Fast automatic detection of wildlife in images from trap cameras. In Proceedings of the Progress in Pattern Recognition, Image Analysis, Computer Vision, and Applications: 19th Iberoamerican Congress, CIARP 2014, Puerto Vallarta, Mexico, 2–5 November 2014; pp. 940–947. [Google Scholar]
- Liu, W.; Anguelov, D.; Erhan, D.; Szegedy, C.; Reed, S.; Fu, C.-Y.; Berg, A.C. SSD: Single shot multibox detector. In Proceedings of the Computer Vision–ECCV 2016: 14th European Conference, Amsterdam, The Netherlands, 11–14 October 2016; pp. 21–37. [Google Scholar]
- Schneider, T.C.; Kowalczyk, R.; Köhler, M. Resting site selection by large herbivores–The case of European bison (Bison bonasus) in Białowieza Primeval Forest. Mamm. Biol. 2013, 78, 438–445. [Google Scholar] [CrossRef]
- Lapshin, A.S.; Andreychev, A.V.; Kuznetsov, V.A. Daily and seasonal dynamics of the vocalization of the Eagle Owl (Bubo bubo, Strigiformes, Strigidae) in the central Volga region. Zool. Zhurnal 2018, 97, 77–88. [Google Scholar]
- LeCun, Y.; Bengio, Y.; Hinton, G. Deep learning. Nature 2015, 521, 436–444. [Google Scholar] [CrossRef] [PubMed]
- Zou, Z.; Chen, K.; Shi, Z.; Guo, Y.; Ye, J. Object detection in 20 years: A survey. Proc. IEEE 2023, 111, 257–276. [Google Scholar] [CrossRef]
- Torney, C.J.; Lloyd-Jones, D.J.; Chevallier, M.; Moyer, D.C.; Maliti, H.T.; Mwita, M.; Kohi, E.M.; Hopcraft, G.C.; McCrea, R. A comparison of deep learning and citizen science techniques for counting wildlife in aerial survey images. Methods Ecol. Evol. 2019, 10, 779–787. [Google Scholar] [CrossRef]
- Alsaadi, E.M.T.A.; El Abbadi, N.K. An Automated Mammals Detection Based on SSD-Mobile Net. J. Phys. Conf. Ser. 2021, 1879, 022086. [Google Scholar] [CrossRef]
- Tassinari, P.; Bovo, M.; Benni, S.; Franzoni, S.; Poggi, M.; Mammi, L.M.E.; Mattoccia, S.; Di Stefano, L.; Bonora, F.; Barbaresi, A.; et al. A computer vision approach based on deep learning for the detection of dairy cows in free stall barn. Comput. Electron. Agric. 2021, 182, 106030. [Google Scholar] [CrossRef]
- Xie, Y.; Jiang, J.; Bao, H.; Zhai, P.; Zhao, Y.; Zhou, X.; Jiang, G. Recognition of big mammal species in airborne thermal imaging based on YOLO V5 algorithm. Integr. Zool. 2023, 18, 333–352. [Google Scholar] [CrossRef]
- Jocher, G. Yolov5. 2021. Available online: https://github.com/ultralytics/yolov5 (accessed on 1 August 2023).
- Li, S.; Li, J.; Tang, H.; Qian, R.; Lin, W. Atrw. In Proceedings of the 28th ACM International Conference on Multimedia, Seattle, WA, USA, 12–16 October 2020; pp. 2590–2598. [Google Scholar]
- Bochkovskiy, A.; Wang, C.-Y.; Liao, H.-Y.M. Yolov4: Optimal speed and accuracy of object detection. arXiv 2020, arXiv:2004.10934. [Google Scholar]
- Zhang, H.; Cisse, M.; Dauphin, Y.N.; Lopez-Paz, D. mixup: Beyond empirical risk minimization. arXiv 2017, arXiv:1710.09412. [Google Scholar]
- O’Connell, A.F.; Nichols, J.D.; Karanth, K.U. Camera Traps in Animal Ecology: Methods and Analyses; Springer: Berlin/Heidelberg, Germany, 2011; Volume 271. [Google Scholar]
- Ge, Z.; Liu, S.; Wang, F.; Li, Z.; Sun, J. Yolox: Exceeding yolo series in 2021. arXiv 2021, arXiv:2107.08430. [Google Scholar]
- Lin, T.-Y.; Dollár, P.; Girshick, R.; He, K.; Hariharan, B.; Belongie, S. Feature pyramid networks for object detection. In Proceedings of the IEEE Conference on Computer Vision and Pattern Recognition, Honolulu, HI, USA, 21–26 July 2017; pp. 2117–2125. [Google Scholar]
- Woo, S.; Park, J.; Lee, J.-Y.; Kweon, I.S. Cbam: Convolutional block attention module. In Proceedings of the European Conference on Computer Vision (ECCV), Munich, Germany, 8–14 September 2018; pp. 3–19. [Google Scholar]
- Zheng, Z.; Wang, P.; Liu, W.; Li, J.; Ye, R.; Ren, D. Distance-IoU loss: Faster and better learning for bounding box regression. In Proceedings of the AAAI Conference on Artificial Intelligence, New York, NY, USA, 7–12 February 2020; pp. 12993–13000. [Google Scholar]
- Duan, K.; Bai, S.; Xie, L.; Qi, H.; Huang, Q.; Tian, Q. Centernet: Keypoint triplets for object detection. In Proceedings of the IEEE/CVF International Conference on Computer Vision, Seoul, Republic of Korea, 27 October–2 November 2019; pp. 6569–6578. [Google Scholar]
- Shi, C.; Xu, J.; Roberts, N.J.; Liu, D.; Jiang, G. Individual automatic detection and identification of big cats with the combination of different body parts. Integr. Zool. 2023, 18, 157–168. [Google Scholar] [CrossRef] [PubMed]
- Ghosh, S.B.; Muddalkar, K.; Mishra, B.; Garg, D. Amur tiger Detection for Wildlife Monitoring and Security. In Proceedings of the Advanced Computing: 10th International Conference, IACC 2020, Panaji, India, 5–6 December 2020; pp. 19–29. [Google Scholar]
| Disclaimer/Publisher’s Note: The statements, opinions and data contained in all publications are solely those of the individual author(s) and contributor(s) and not of MDPI and/or the editor(s). MDPI and/or the editor(s) disclaim responsibility for any injury to people or property resulting from any ideas, methods, instructions or products referred to in the content. |
© 2023 by the authors. Licensee MDPI, Basel, Switzerland. This article is an open access article distributed under the terms and conditions of the Creative Commons Attribution (CC BY) license (https://creativecommons.org/licenses/by/4.0/).


